Centrality, transverse momentum and collision energy dependence of the Tsallis parameters in relativistic heavy-ion collisions
Abstract
The thermodynamic properties of matter created in high-energy heavy-ion collisions have been studied in the framework of the non-extensive Tsallis statistics. The transverse momentum () spectra of identified charged particles (pions, kaons, protons) and all charged particles from the available experimental data of Au-Au collisions at the Relativistic Heavy Ion Collider (RHIC) energies and Pb-Pb collisions at the Large Hadron Collider (LHC) energies are fitted by the Tsallis distribution. The fit parameters, and measure the degree of deviation from an equilibrium state and the effective temperature of the thermalized system, respectively. The spectra are well described by the Tsallis distribution function from peripheral to central collisions for the wide range of collision energies, from = 7.7 GeV to 5.02 TeV. The extracted Tsallis parameters are found to be dependent on the particle species, collision energy, centrality, and fitting ranges in . For central collisions, both and depend strongly on the fit ranges in . For most of the collision energies, remains almost constant as a function of centrality, whereas increases from peripheral to central collisions. For a given centrality, systematically increases as a function of collision energy whereas has a decreasing trend. A profile plot of and with respect to collision energy and centrality shows an anti-correlation between the two parameters.
1 Introduction
Relativistic heavy-ion collisions produce matter at extreme conditions of temperatures and energy densities in the form of quark-gluon plasma (QGP). The QGP state is formed at the early stages of the collision, which survives for a very short span of time (7–10 fm/), after which the matter gets transformed rapidly to a system of hadron gas. The information about the initial condition of the system gets mostly lost by multi-partonic interactions throughout the evolution of the collision. The final state behavior of such a colliding system can be obtained from the measurement of the number and identity of produced particles, along with their energy and momentum spectra. The final state information is nevertheless most useful for understanding the particle production mechanisms and the nature of the matter produced in these high-energy collisions.
The space-time evolution of the hot and dense system produced in the collision ceases at two symbolic freeze-out conditions, namely, the chemical freeze-out and kinetic freeze-out. The colliding medium first reaches chemical equilibrium, and then cools down by expansion. Due to this expansion of the system, the inelastic collisions cease when the mean free path for the interactions becomes comparable to the system size. This is known as the chemical freeze-out, at which point the abundances of different particle species become constant. After this stage, even if the relative fractions of the particles are constant, these particles continue to interact till a point where the final state interactions between the hadrons are no longer effective. After this kinetic freeze-out all the interactions cease and the (transverse) momentum spectra of the particles remain unchanged. Therefore, transverse momentum () spectra of produced particles constitute some of the basic measurements to extract the kinetic freeze-out condition of the systems produced in high-energy collisions.
Several different standard statistical model fits using Boltzmann-Gibbs (BG), Fermi-Dirac, Bose-Einstein distributions, -exponential distribution STAR-2009 ; STAR-BES1 Erlang distribution Gao-2012_Erlang , Tsallis distribution Wong-2015 ; Azmi-2020 ; Cleymans-Worku-2012-EPJ ; Trambak-2018 ; Azmi-2015 and other kinds of distribution functions have been used to describe the spectra and extract physical parameters. The BG statistical model has attained a huge success in explaining the thermodynamic properties in different physical systems. However, the BG thermal (exponential) model is inappropriate at high transverse momenta in high-energy collision systems as it cannot explain the high transverse momentum range which is mostly followed by the inverse power-law behavior NA61-1982 ; Hagedron-1983 ; ALICE-pp_2013 . A distribution following the non-extensive Tsallis statistics Tsallis-1988 ; Tsallis-1998 has been shown to provide a better description of the nature of the non-exponential transverse momentum spectrum. The description of particle spectra using the Tsallis distribution has gained lots of interest recently as it can describe the spectra at high . The Tsallis distribution is found to be very successful in describing the spectra at high ranges in proton-proton () collisions Azmi-2015 ; Wong-2015 . The spectra of identified particles in system at different collision energies can be explained by the Tsallis distribution function as presented in Ref. Trambak-2018 ; Zheng-2016 , whereas the multiplicity dependence of all charged particles spectra with the Tsallis framework is reported in Ref. Rath-2020 .
In case of heavy-ion collisions, the transverse momentum spectra have traditionally been fitted by blast-wave model BW1 STAR-BES1 ; STAR-14.5 ; STAR-2009 ; ALICE-2.76-2013 ; ALICE-5.02-2020 . This model has a simple assumption that there is a kinetic freeze-out of the colliding medium at temperature and particles are moving with a common collective radial flow velocity (). However, the blast-wave model cannot be used to describe the spectra at mid to high- ranges. Recent studies Azmi-2020 have found that the Tsallis statistics also works in heavy-ion collisions providing good fitting of the spectra of all charged particles. Since these fits do not account for the radial flow, the temperatures obtained from the Tsallis fits are the effective temperatures, different from the kinetic freeze-out temperatures. This effective temperature depends on the particle mass and the collective flow velocity. The intercept in is an alternative method PHENIX-2004 ; Wei-2016 ; Lao-2018 to find freeze-out temperature where is the rest mass and is the average transverse radial flow velocity.
In the present work, we use the thermodynamically consistent form of the Tsallis distribution Cleymans-Worku-2012-EPJ to fit the transverse momentum () spectra of the identified charged particles with a focus on pions as well as all charged particles in heavy-ion collision systems corresponding to eight different collision energies at RHIC and two collision energies at the LHC. For each of the spectrum, we obtain the Tsallis fit parameters, , which expresses the degree of deviation from an equilibrium state, and as the effective temperature. The dependencies of the fitting parameters on collision centrality, collision energy and fitting ranges in are investigated and will be presented. The relative success of Tsallis distribution for different particles in heavy-ion system will be also discussed. In section 2, we discuss the formulation of the Tsallis distribution and the methodology of fitting the spectra. In section 3, we present Tsallis fittings of the spectra at different centrality, energy and ranges. In section 4, present the Tsallis fit parameters and discuss their relevances for different collision energies. A discussion on the results is given in section 5. Finally, the paper is summarized in section 6.
2 Tsallis statistics and methodology
The non-extensive Tsallis form of the Boltzmann-Gibbs distribution in terms of energy (), effective temperature (), and chemical potential () of a system can be expressed as Tsallis-1988 ; Tsallis-1998 ,
| (1) |
The has the form,
| (2) |
where is the entropy index which measures the degree of non-additivity of the entropy or deviation from the equilibrium of the system. In general, . In equilibrium case, i.e., in the limit . Therefore, Eq. 1 is simplified to the extensive Boltzmann-Gibbs form,
| (3) |
The Tsallis form with thermodynamical consideration of the invariant momentum distribution of the particles has been introduced and discussed in Cleymans-Worku-2012-JPG ; Cleymans-Worku-2012-EPJ . The particle number density () can be expressed using Tsallis statistics as,
| (4) |
where is the degeneracy factor of the particles. The expression of the invariant momentum distribution can be obtained from the particle number density as given in Eq. 4 as,
| (5) |
Here is the particle number, and is refereed as the volume of the system which depends on the . Therefore, is not necessarily the volume of the system, but serves as a normalization factor of the Tsallis distribution. For non vanishing chemical potential, Eq. 5 can be rewritten in terms of transverse mass () and rapidity () in the form,
| (6) |
The invariant yields, is an experimentally measured observable. Therefore, the Tsallis parameters can be obtained from experimentally measured invariant momentum distributions using the fitting function as given in Eq. 6, with as an input.
| (GeV) | Collision system | Particles | Centrality (%) | Experiment | |
|---|---|---|---|---|---|
| 7.7, 11.5, 19.6, 27, 39 | Au-Au | , , | 0.1 | 0-5, 5-10, 10-20, 20-30, 30-40, 40-50, 50-60, 60-70, 70-80 | STAR STAR-BES1 |
| 14.5 | Au-Au | , , | 0.1 | 0-5, 5-10, 10-20, 20-30, 30-40, 40-50, 50-60, 60-70, 70-80 | STAR STAR-14.5 |
| 62.4 | Au-Au | , | 0.5 | 0-10, 10-20, 20-40, 40-80 | STAR STAR-62.4 |
| 200 | Au-Au | , | 0.5 | 0-12, 10-20, 20-40, 40-60, 60-80 | STAR STAR-200 |
| 200 | Au-Au | , , | 0.26 | 0-5, 5-10, 10-15, 15-20, 20-30, 30-40, 40-50, 50-60, 60-70, 70-80, 80-92 | PHENIX PHENIX-200 |
| 2760 | Pb-Pb | , , | 0.5 | 0-5, 5-10, 10-20, 20-30, 30-40, 40-50, 50-60, 60-70, 70-80, 80-90 | ALICE ALICE-2.76-2013 |
| 2760 | Pb-Pb | , , | 0.5 | 0-5, 5-10, 10-20, 20-30, 30-40, 20-40, 40-50, 40-60, 60-80 | ALICE ALICE-2.76-2016 |
| 2760 | Pb-Pb | Nch | 0.8 | 0-5, 5-10, 10-20, 20-30, 30-40, 40-50, 50-60, 60-70, 70-80 | ALICE ALICE-2.76-Nch |
| 5020 | Pb-Pb | , , | 0.5 | 0-5, 5-10, 10-20, 20-30, 30-40, 40-50, 50-60, 60-70, 70-80, 80-90 | ALICE ALICE-5.02-2020 |
| 5020 | Pb-Pb | Nch | 0.8 | 0-5, 5-10, 10-20, 20-30, 30-40, 40-50, 50-60, 60-70, 70-80 | ALICE ALICE-5.02-Nch |
A different type of Tsallis distribution is used by the STAR STAR-pp-2007 , PHENIX PHENIX-pp-2010 ; PHENIX-pp-2011 , ATLAS ATLAS-pp-2011 , CMS CMS-pp-2017 and ALICE ALICE-pp-2011 ; ALICE-pp-2012 ; ALICE-pp-2018 ; ALICE-pp-2020 collaborations as in the expression below,
| (7) |
where are the fitting parameters and is the rest mass of the particle. At mid-rapidity and zero chemical potential Eq. 7 has same dependency on transverse momentum as in Eq. 6 except the additional dependency. The incorporation of in Eq. 6 has more consistent behavior of and whereas no clear pattern of and can be found Cleymans-Worku-2012-EPJ . In this present study, Tsallis distribution of thermodynamical consistent form given in Eq. 6 has been used. The conversion from rapidity to pseudo-rapidity phase-space is made using a Jacobian () of the form,
| (8) |
At mid-rapidity (), this can be simplified as
| (9) |
The expression of the Tsallis distribution for all charged particle pseudo-rapidity distribution at mid-rapidity can be given as,
| (10) |
Here, the sum runs for three kind of the particles , and considering that those are the most abundant in productions. The factor in front of the right side takes into account of the associated anti-particles, , and . The degeneracy factors () are unity for pions and kaons and for protons. At mid-rapidity, Eq. 6 reduces to the form,
| (11) |
This equation (11) has been used to fit invariant momentum spectra of identified particles. The centrality dependent finite chemical potential has been considered for the RHIC energy STAR-BES1 ; Debadeepti-thesis-2019 , whereas at LHC energies has been approximated to zero.
3 Fits of the spectra
Detailed analysis of the transverse momentum spectra of produced particles provides important information regarding the particle production mechanisms. We have fitted the spectra of identified and all charged particles in heavy-ion collisions at RHIC and LHC. At RHIC, the experimental data of Au-Au collisions from the beam energy scan (BES-I) program are available for 7.7, 11.5, 14.5 19.6, 27, 39 GeV STAR-BES1 ; STAR-14.5 as well as at 62.4 and at the top energy of 200 GeV STAR-62.4 ; STAR-200 . Fine centrality binning data from PHENIX collaboration at 200 GeV PHENIX-200 are also fitted. At the LHC, data published by the ALICE collaboration for spectra of identified charged particles in Pb-Pb collisions at 2.76 TeV ALICE-2.76-2013 ; ALICE-2.76-2016 and at 5.02 TeV ALICE-5.02-2020 have been included in our study. In addition, spectra of all charged particles () measured by ALICE at 2.76 and 5.02 TeV ALICE-2.76-Nch ; ALICE-5.02-Nch are also used. In Table 1, we summarize the experimental datasets used in the present study in terms of collision energy, colliding system, pseudo-rapidity () range, range, and centrality binning in percentage of the cross-section. For the experimental data, the systematic and statistical uncertainties are added in quadrature.
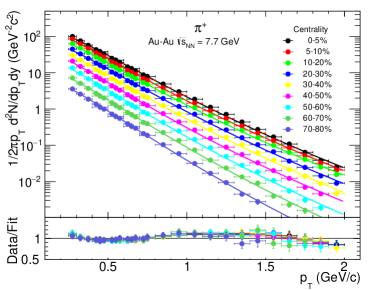
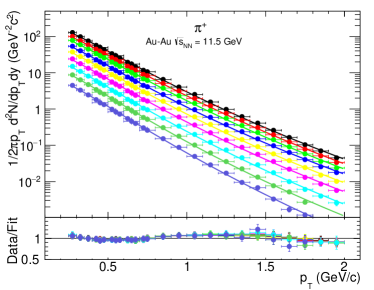
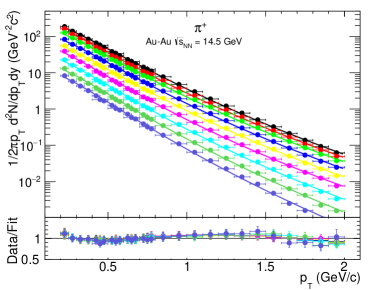
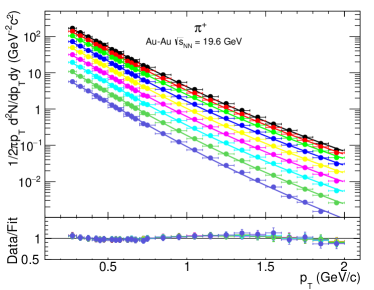
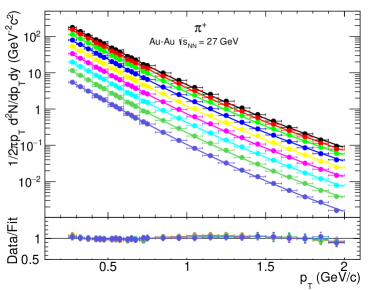
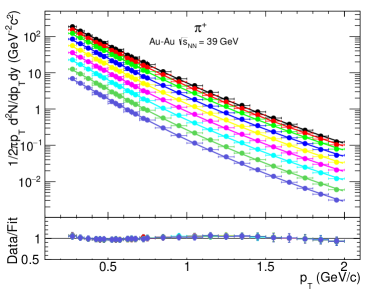
The fits to the transverse momentum spectra at all collision energies as given in Table 1 are performed by the expression of Tsallis distribution as in Eq. 11. The transverse momentum spectra with Tsallis fitting of positively charged pions () at different centrality bins in Au-Au collisions at 7.7 GeV to 39 GeV measured by the STAR collaboration from the RHIC BES-I STAR-BES1 ; STAR-14.5 program are shown in Fig. 1. The data are available for range up to 2 GeV/, and so the fits, represented by the solid lines, are also made up to this range. The Tsallis distribution provides very good fits of the data at all centralities, which is evident from the ratio of the experimental data to the fit value as shown in the lower panel of the figure. The maximum deviations of the ratios from unity are within . The fits of the spectra of distributions are of similar quality to the distributions.
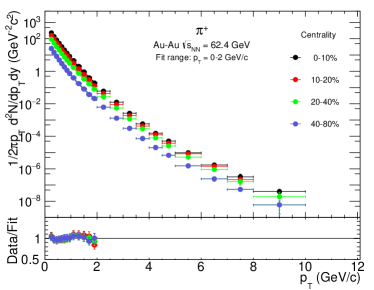
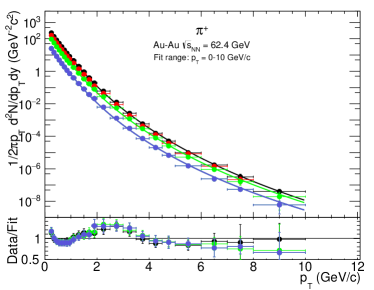
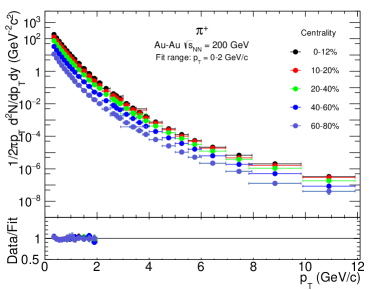
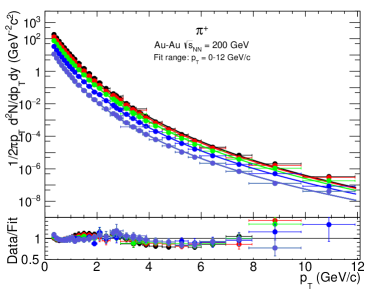
Fig. 2 shows the spectra along with the corresponding Tsallis fits for Au-Au collisions at 62.4 and 200 GeV from STAR STAR-62.4 ; STAR-200 experiment with the available ranges up to 10 GeV/ and 12 GeV/, respectively. The left panels of the figure show the fits of the range up to 2 GeV/ and the right panels provide the Tsallis fitting of the entire spectrum. The ratios of the data to fit values are shown in the lower part of the figures. We observe that the quality of the Tsallis distribution fits shown in the left panels are quite good (with maximum deviations within ) for fits up to low- region of 2 GeV/c. Fits to higher as shown in the right panels are not as good (the maximum deviations are larger, up to about 30%). The fit parameters turn out to be dependent on the fit ranges in . The results of the fits are discussed in detail in the next section.
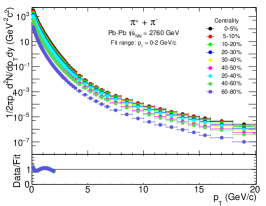
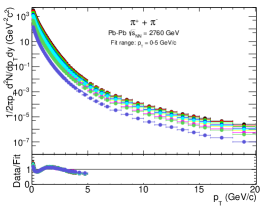
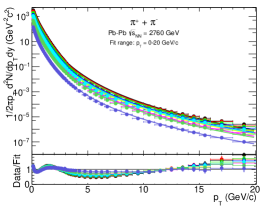
In Fig. 3, we present the transverse momentum spectra of all charged pions () for different centrality bins for Pb-Pb collisions at 2.76 TeV from the ALICE ALICE-2.76-2016 collaboration. The fits with the Tsallis distribution function have been shown for three different ranges, where the left, middle, and the right plots in the figure correspond to ranges up to 2 GeV/, 5 GeV/ and 20 GeV/, respectively. The lower parts of the plots give the ratio of the data to the fitted values. These ratios show that the fitting is in good agreement with the data for peripheral events, whereas some deviations have been observed for central collisions and at large . Furthermore, it is observed that the fit parameters vary according to the fitting ranges in . In addition, we have fitted the low- region of these spectra by fixing the parameter which gives the standard BG distribution, (Eq. 3). We observed that, fixing the parameter to unity does not provide a reasonable fit even at low- region transverse momentum spectrum cannot be explained by exponential function only. Different studies present that at low- region the spectra are modified by resonance productions Aleksas resonance , which is not considered here in the Tsallis fitting.
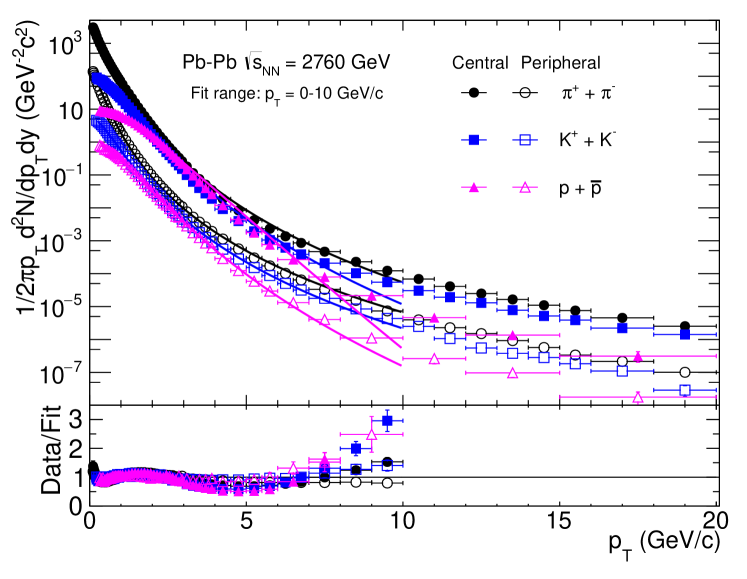
The transverse momentum spectra of identified charged pions, kaons and protons at different collision energies and centralities are fitted using the Tsallis distribution. The fitting of the spectra of and along with for Pb-Pb collisions at 2.76 TeV ALICE-2.76-2016 are shown in Fig. 4 . The fits of the data are performed for ranges up to 10 GeV/ for the most central (0–5%) and peripheral (70–80%) collisions as presented by the solid and open markers, respectively. The quality of the fits is presented by the ratio of data to fit values at the lower part of the figure. In general, we observe that the data for peripheral collisions are fitted better compared to those of the central collisions. Moreover, the fits are considerably better for pions, then kaons and finally for protons. The fits diverge gradually from the data with increasing particle masses and centrality at large ranges.
4 Results of the Tsallis fit parameters
In this section, we present the results of the fitting of distributions as a function of collision centrality, collision energy as well as the ranges of the fits. The results are presented for the Tsallis parameters, , , and the normalization volume, .
4.1 Centrality dependence of Tsallis parameters
In the previous section, we have presented distributions for different collision energies and collision centralities. The collision centralities have been shown in terms of the percentage of the cross-sections. For a given centrality window, the centrality can also be expressed in terms of average number of participating nucleons (). As the centrality bins in the data as shown in Table 1 are different, it is useful to express the centrality in terms of . In Fig. 5, we present the variation of , , and as a function of for positively charged pions at RHIC energies, and for all charged pions at LHC energies. The parameters obtained from and spectra of ALICE data ALICE-2.76-2013 are similar to the results for all charged pions. All the fits are made for maximum values of up to 2 GeV/. The following observations are made regarding the centrality and collision energy dependence of these parameters:
-
•
The Tsallis parameter, , systematically increases from low to high collision energies. For each collision energy, the variation of as a function of has been inferred by fitting the dependence with a linear function. We observe that within the given uncertainly, is independent centrality at RHIC energies. However, for LHC energies decreases from peripheral to central collisions.
-
•
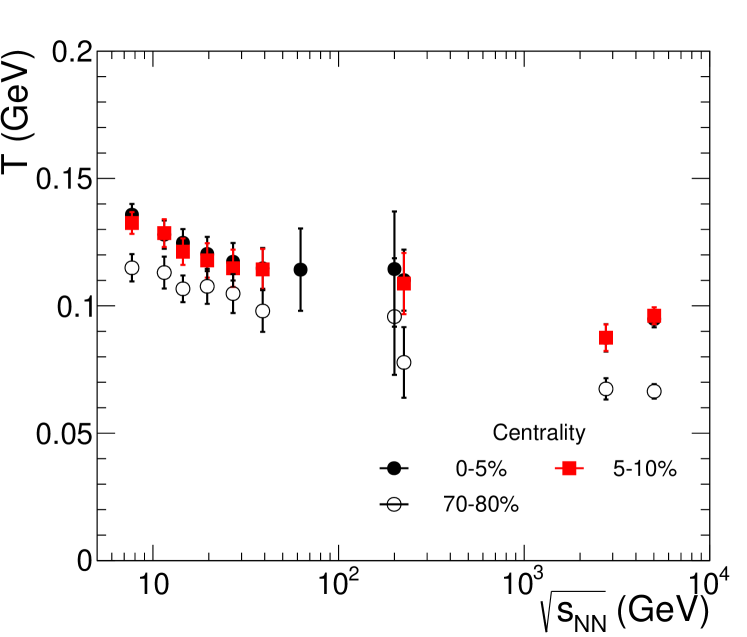
The Tsallis temperature, , decreases from low to high collision energies. For all collision energies, the values of increase from peripheral to central collisions.
-
•
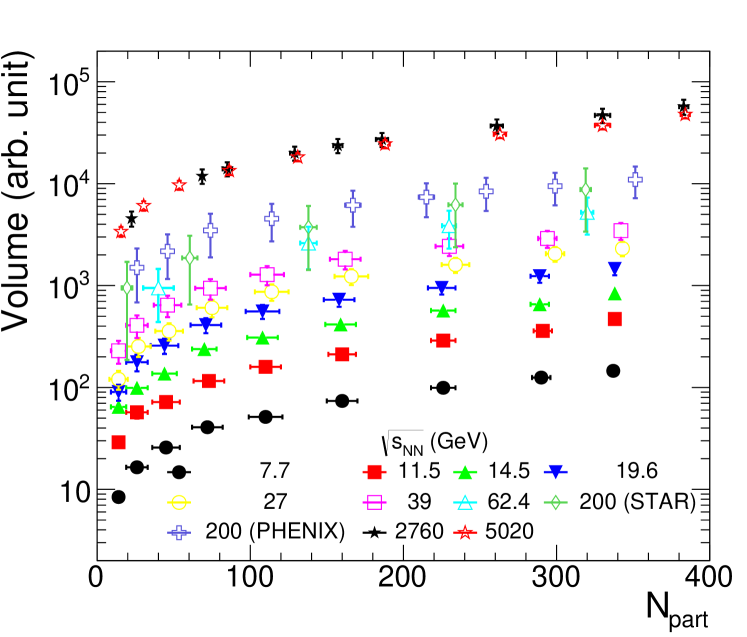
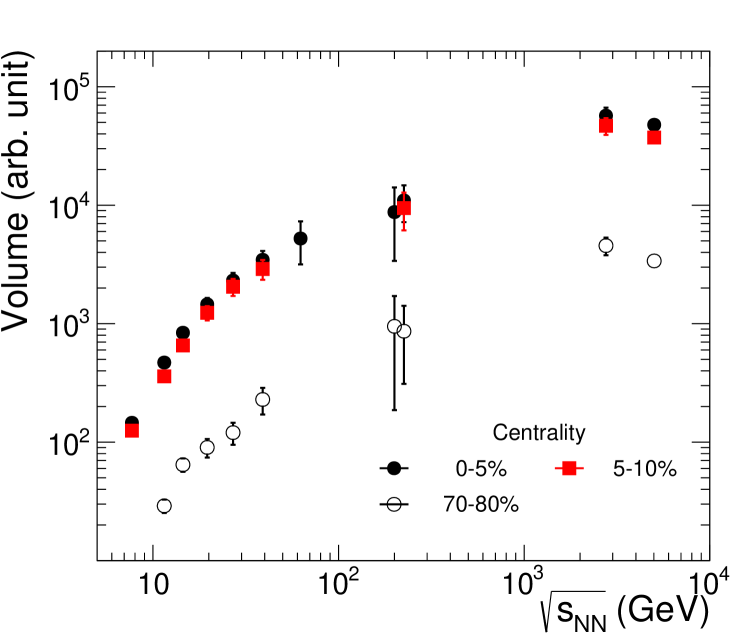
The normalization parameter, , increases from low to high collision energies. For all collision energies, increases monotonically from peripheral to central collisions.
4.2 Collision energy dependence of Tsallis parameters
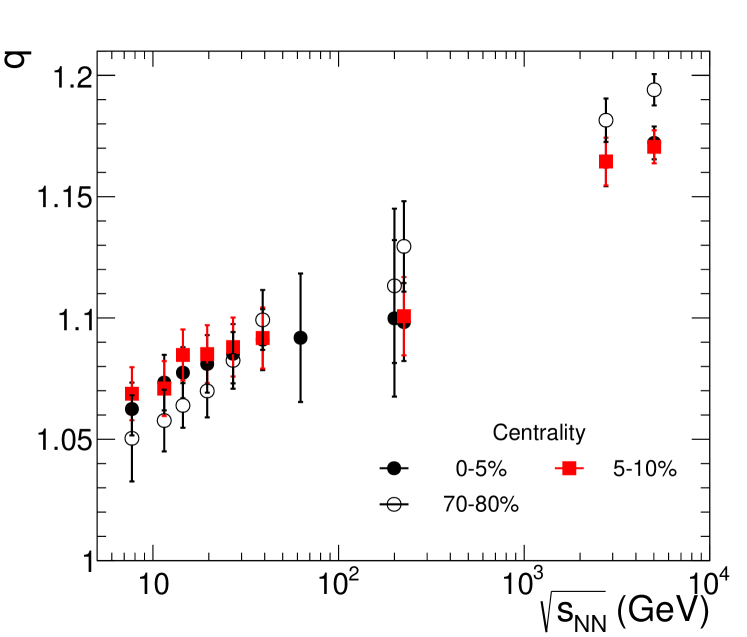
The variations of the Tsallis parameters, , , and the normalization parameter, , are scanned over the collision energy from RHIC to LHC energies. The results of the fits to spectra up to a value of 2 GeV/ are presented in Fig. 6. At RHIC energies, the fits are performed for , and at the LHC energies, the fits are presented for . For clarity, results are presented only for central (0–5%, 5–10%) and peripheral (70–80%) collisions. The following observations are made regarding the collision energy dependence of these parameters:
-
•
The parameter as a function of collision energy shows that for all centralities increases with the increase of collision energy. A closer look at the centrality dependence shows that at RHIC energy remains unchanged with the centrality within the uncertainty, whereas, in higher energies, decreases from peripheral to central collisions.
-
•
The parameter decreases with the increase of the collision energy. Another important observation is that increases from peripheral to central collisions at all collision energies.
-
•
The variation of with collision energy shows that, increases consistently with increasing . This is reasonable as the system size and hence particle productions increase with and centrality.
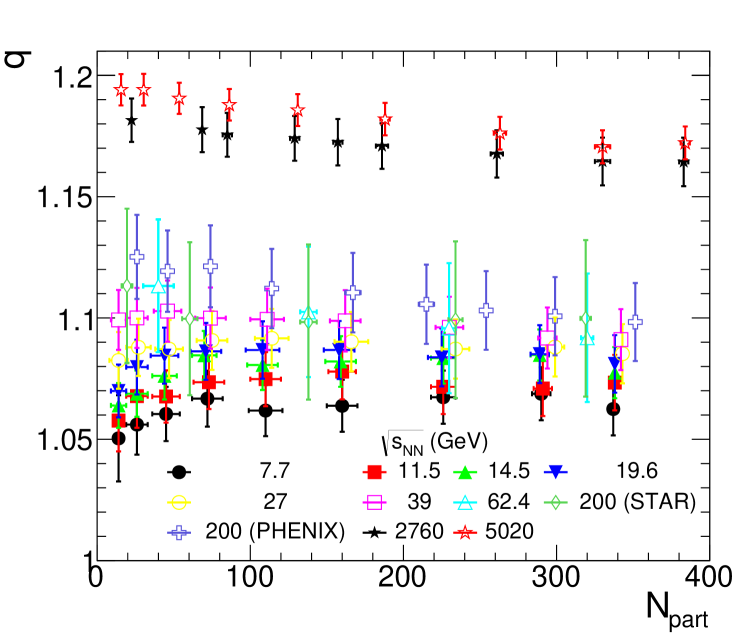
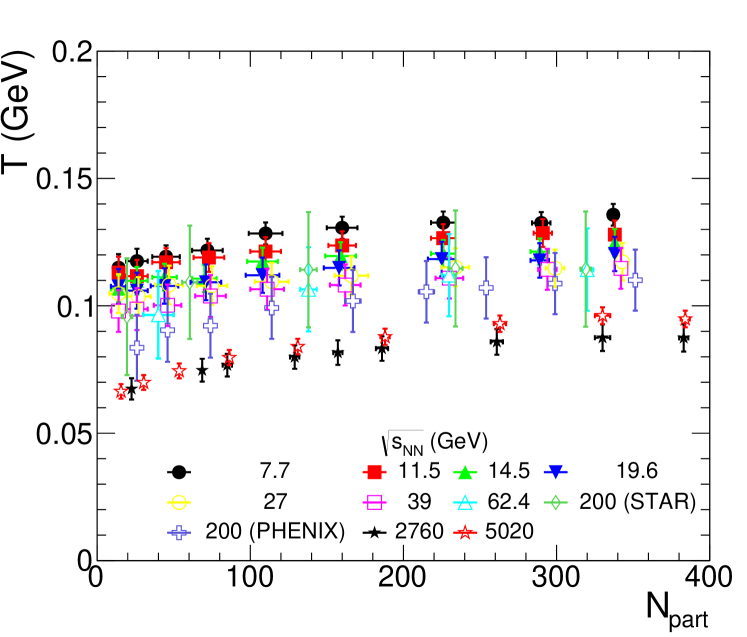
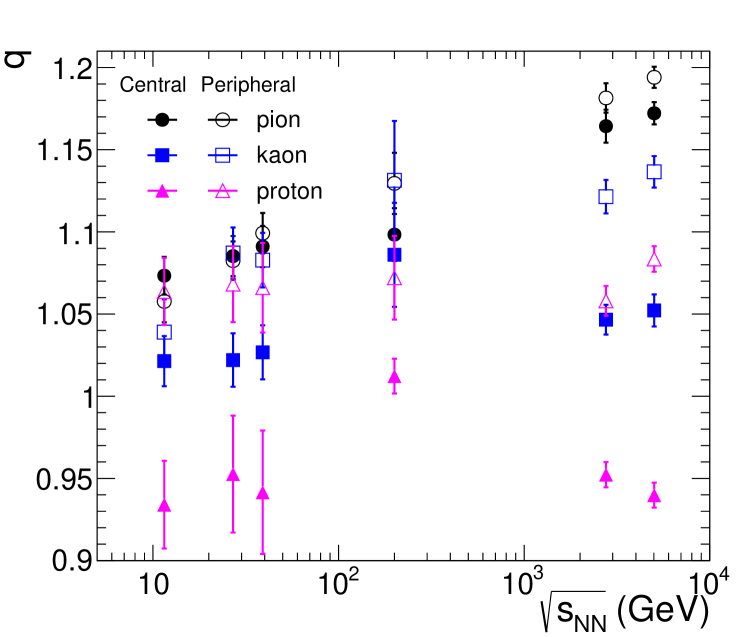
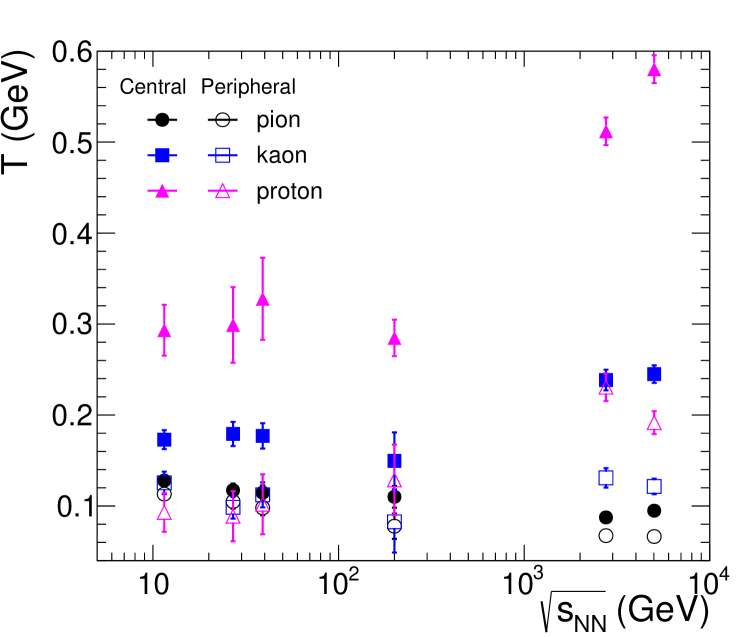
The usefulness of the Tsallis parameters can be understood by fitting the spectra of kaons and protons along with those of pions. This has been done for RHIC energies from the STAR BES-I STAR-BES1 and PHENIX PHENIX-200 datasets and at LHC for the ALICE ALICE-2.76-2016 ; ALICE-5.02-2020 data. The variations of and as a function of are shown in Fig. 7 for all the three identified particles. The parameters presented in the figure correspond to the range up to 2 GeV/, 3 GeV/ and 5 GeV/ for pions, kaons, and protons, respectively. The results of the peripheral and central collisions are labeled as open and solid markers, respectively. It has been observed from the figure that for pions and kaons has an increasing trend with for both central and peripheral collisions. But for protons, the trend is very different, and at the LHC energies values are found lower than unity within the fitting range of the proton spectra, which is against the basic assumption of the distribution function. This could be because of the radial flow which has a larger effect on protons that is not considered in the fitting. The temperature shows a distinct difference for central and peripheral collisions for all the three particle species. For peripheral collisions, values are similar for all particles. But for central collisions, shows a strong mass dependency. For pions, decreases with increase of , whereas increases for kaons and protons, with unusually high value for protons.
4.3 Behavior of Tsallis parameters for different ranges
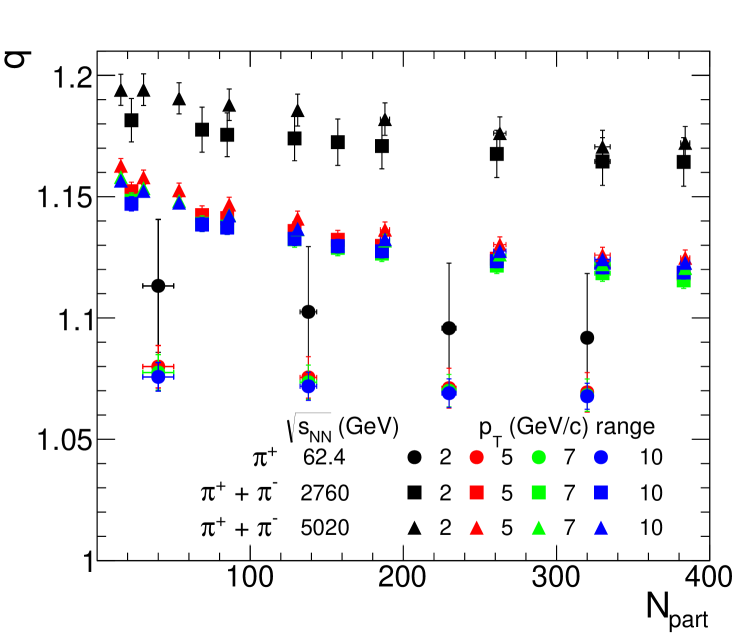
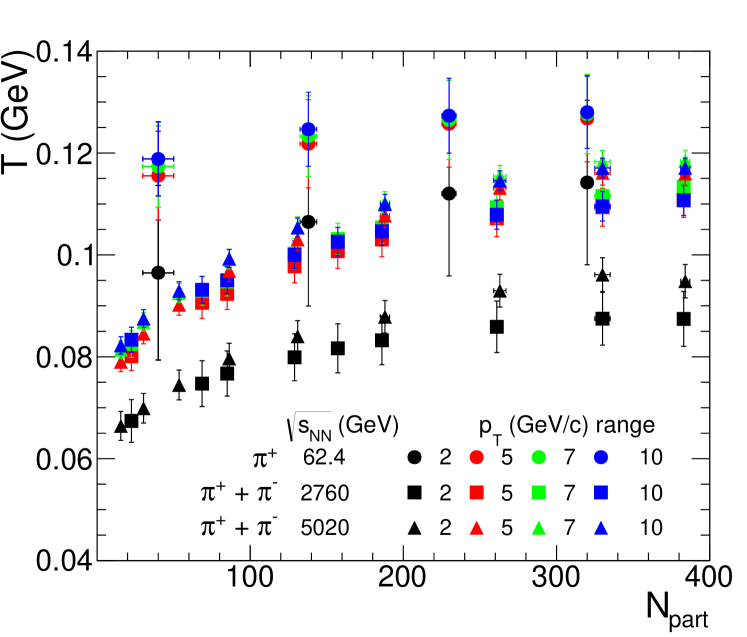
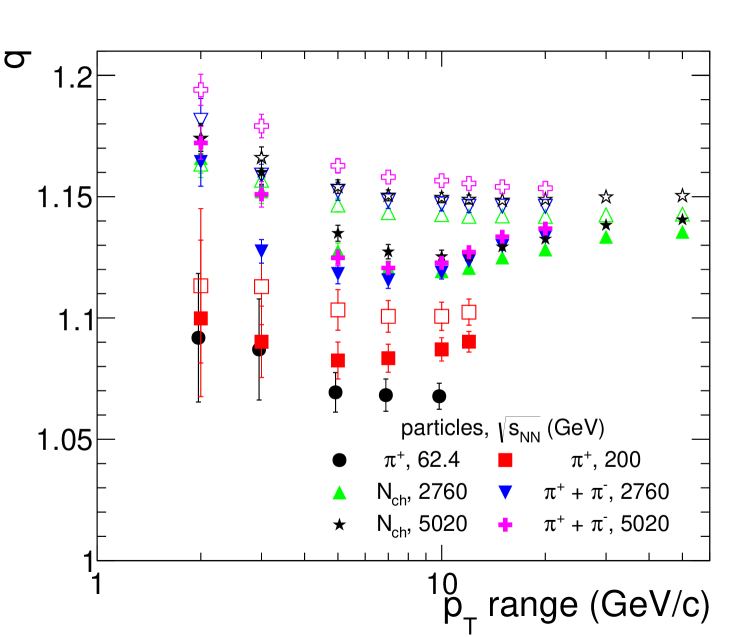
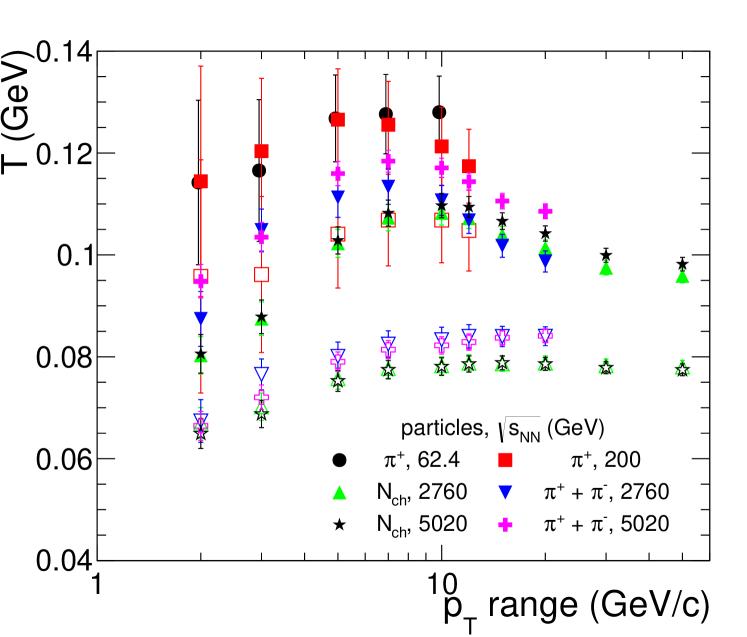
The Tsallis function has been shown to be successful in fitting distributions over a broad range. In Fig. 8 we present the variation of the Tsallis fit parameters (, and ) for charged pions as a function of centrality for different collision energies and for a set of fitting ranges ( GeV/, GeV/, GeV/, and GeV/). In the figure, different energies are labeled by different markers whereas ranges are indicated using different colour schemes. We observe that:
-
•
the fit parameters, , depend on the fitting range in for all centralities and collision energies. For the low- region, values have a big rise and values have a drop from RHIC to LHC energies. At mid- region ( GeV/), and are similar (within the uncertainties) at all energies.
-
•
for all centralities, values are different at low- region(2 GeV/), whereas, at mid- region (5–10 GeV/) those are same within the uncertainties with higher values. In most of the cases, decreases from peripheral to central collisions for all ranges.
-
•
the temperature, , is almost constant at mid- region (5–10 GeV/) with a higher value than low- fitting range (2 GeV/) for all collision energies. increases from peripheral to central collisions for all ranges.
The range dependencies of the Tsallis parameters of Au-Au collisions at 200 GeV data have similar behaviour as that of the Au-Au collisions at 62.4 GeV. Since the uncertainty on these datasets are large, only the Au-Au data at 62.4 GeV are plotted.
The behaviors of the fit parameters have been explored further by plotting these as a function of the ranges for different collision energies. Depending on the availability of the experimental data, the ranges have been selected up to 2, 3, 5, 7, 10, 12, 15, 20, and 50 GeV/. The evolution of the Tsallis parameters with range selections are shown in Fig. 9. The results shown in the figure correspond to the fit values of all possible spectra at 62.4, 200, 2760 and 5020 GeV of all charged particles, , and . The open and solid markers correspond to peripheral (70–80%) and most central (0–10%) collisions respectively. We observe that,
-
•
for peripheral collisions, initially decreases up to mid- region and then remains constant. For central collisions, decreases with an increase of up to mid- region, 5–10 GeV/, after which a slow rise is observed.
-
•
for the peripheral collisions, increases slowly with and then remains constant. For central collisions, increases with up to the mid- region, and then a slow decreasing trend is observed.
The principal observation from the Fig. 9 is that depending on the collision energy and centrality, the spectra have different behaviour at different ranges. This is evident from the fact that the particle production mechanisms are different depending on the range probed. The charged pions observed at lower range are affected by resonance production, flow, coalescence, whereas at mid- region, contributions from hard pQCD processes and jets start to dominate.
5 Discussion
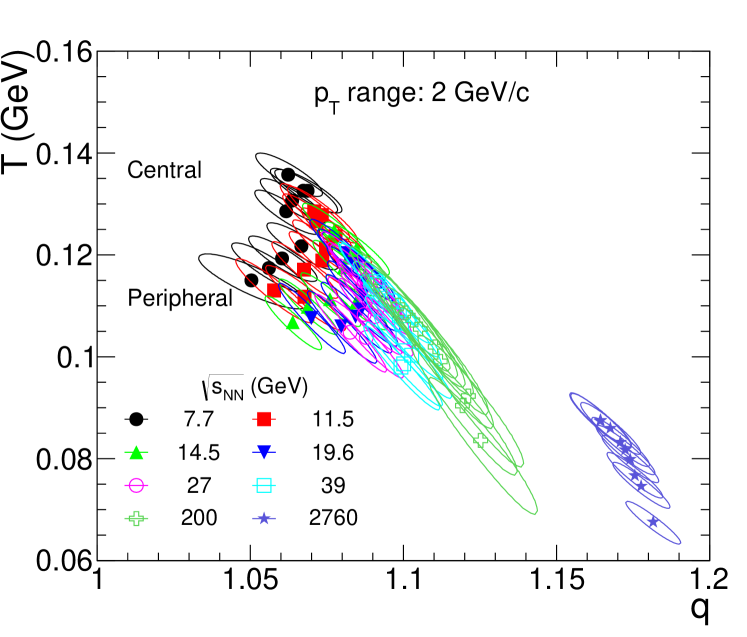
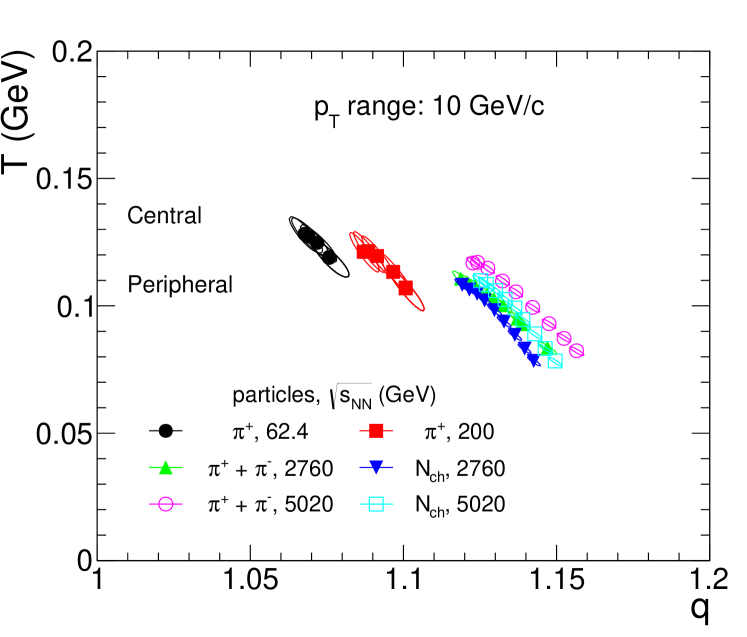
Our study shows that the Tsallis parameters obtained by fitting the distributions vary with respect to the fitting range in , centrality of the collision and collision energy. The study of Tsallis parameters with variation of centrality and collision energy as shown in Fig. 5, 6 show that there may have some correlation between the two parameters. This correlation between the Tsallis fit parameters can be better understood by making profile plots of and , as shown in Fig. 10. In the profile plots the ellipses corresponding to the one- uncertainties of the parameters and are shown. In the upper panel of Fig 10, vs. are plotted for fits up to of 2 GeV/ for pions for all collision energies and collision centralities. We observe that for a given , central collisions have higher effective temperatures compared to those of the peripheral collisions. In addition, with increasing collision energies decreases whereas increases as has been found before. In the lower panel of Fig 10, we plot the variation of and for fit ranges up to of 10 GeV/ for collision energies of 62.4 GeV and above. At the LHC energies, fit values from charged particles and identified charged pions are plotted. The observed pattern is in general, similar to what has been seen for fits with up to 2 GeV/, although the values of and are different for the same collision energies. The uncertainties ellipses of the profile plots show that the parameters, and , values have a mutual dependency and they have anti-correlation. From the lower panel of Fig 10, we observe that for the LHC energies the uncertainties ellipses are very small. Therefore, the Tsallis parameters are independent with precise values.
We have mentioned before that Boltzmann-Gibbs distribution with blast-wave formula has been popularly followed to obtain the temperature at kinetic freeze-out conditions in heavy-ion collisions STAR-BES1 ; STAR-14.5 ; ALICE-2.76-2013 ; ALICE-5.02-2020 . However, it is limited to describe only small ranges. From our study, it is observed that Tsallis distribution fits the spectra of long ranges. The study of the spectra of the identified particles in the Tsallis framework shows that the effective temperature follows a mass ordering with higher effective temperatures for particles with larger masses as observed in other study PHENIX-2004 . That can be seen from the flattening of the spectra with higher mass particles. It is also observed that spectra of peripheral collisions have better fitting compare to central collisions. This is understood as the effective temperatures from the Tsallis fit include the effect of radial flow. These observations infer that accounting for the radial flow part within the Tsallis distribution functions may better describe the spectra for particles with higher masses and central collisions where radial flow has significant contributions. The inclusion of radial flow may describe the unusual values of and for the proton spectra at the LHC energies.
6 Summary
In high-energy collisions, the transverse momentum spectra of produced particles provide useful information regarding the particle production mechanisms as well as freeze-out conditions of the system. We have analyzed the spectra of identified and all charged particles produced in Au–Au collisions at eight energies at RHIC and Pb–Pb collisions at two energies at LHC using a the non-extensive Tsallis statistics. The Tsallis function is found to be successful to fit a wide range in , with fit parameters, , which is the entropy index measuring the degree of non-additivity of the entropy of the system, effective temperature, , and a normalization parameter which is proportional to the volume of the system.
For each collision centrality, with the increasing of the collision energy, systematically increases and decreases. In the centrality dependency study we found that is almost constant with an increasing trend for peripheral collisions in LHC energy. The values of increase from peripheral to central collisions. The parameter, , increases monotonically with centrality and collision energy. Dependence of the parameters, , on the fitting range in has been observed, which also depends on the collision energy. For central collisions the fit parameters are found to have a strong dependence on the fitting ranges of , however, for peripheral collisions there is a minor dependency on . At mid- range, the Tsallis parameters are found to be constant within the uncertainty. At low ranges, the particle production is dominated by soft processes, whereas at mid ranges, pQCD processes will have a larger effect. So, this observation may be interpreted as the effect of different physics processes dominating different domains, which also depend on centrality. The profile plot of vs. with the uncertainties ellipses shows an anti-correlation of the Tsallis parameters.
In literature, fits of distributions with Tsallis function are found to be successful in describing identified and all charged particles in collision system. In the present study, we have found that in heavy-ion collision systems, the Tsallis distribution gives good fits for spectra of pions for full transverse momentum ranges, but the fits are not as satisfactory for kaons and protons, particularly in central collisions. We have also found that the Tsallis distribution provides good fits for full spectra in case of all charged particles. This result is obvious as the pions are the most abundant particles in all charged particles spectra. The centrality dependent mass ordering in the effective temperature has been observed, which suggests that the contribution of radial flow might need to be incorporated into the standard Tsallis distribution function. Further investigation is needed to include radial flow contributions in order to understand the full nature of the evolving system and freeze-out in relativistic heavy-ion collisions.
References
- [1] B. Abelev et al., (STAR Collaboration), Phys. Rev. C 79, 034909 (2009).
- [2] L. Adamczyk et al., (STAR Collaboration), Phys. Rev. C 96, 044904 (2017).
- [3] Y.-Q. Gao et al., Pramana J. Phys. 79, 1407 (2012).
- [4] C. Y. Wong et al., Phys. Rev. D 91 114027 (2015).
- [5] M. D. Azmi and J. Cleymans, Eur. Phys. J. C 75, 430 (2015).
- [6] T. Bhattacharyya et al., J. Phys. G: Nucl. Part. Phys. 45, 055001 (2018).
- [7] M. D. Azmi et al., J. Phys. G: Nucl. Part. Phys. 47 045001 (2020).
- [8] J.Cleymans and D. Worku, Eur. Phys. J. A 48, 160 (2012).
- [9] G.Arnison et al., UA1 Collaboration, Phys. Lett. B 118, 167 (1982).
- [10] R. Hagedorn, Riv. Nuovo Cim.6N10, 1 (1983).
- [11] B. Abelev et al., Eur. Phys. J. C 73, 2662 (2013).
- [12] C. Tsallis, J. Stat. Phys. 52, 479 (1988).
- [13] C. Tsallis et al., Physica A 261, 534 (1998).
- [14] H. Zheng and Lilin Zhu, Advances in High Energy Phys. 2016, 9632126 (2016).
- [15] R. Rath et al., J. Phys. G: Nucl. Part. Phys. 47, 055111 (2020).
- [16] E. Schnedermann, J. Sollfrank and U. W. Heinz, Phys. Rev. C 48, 2462 (1993).
- [17] J. Adam et al., (STAR Collaboration), Phys. Rev. C 101, 024905 (2020).
- [18] B. Abelev et al., (ALICE Collaboration), Phys. Rev. C 88, 044910 (2013).
- [19] S. Acharya et al., (ALICE Collaboration), Phys. Rev. C 101 044907 (2020).
- [20] S. S. Adler et al., (PHENIX Collaboration), Phys. Rev. C 69, 034909 (2004).
- [21] H. Wei et al., Eur. Phys. J. A 52, 102 (2016).
- [22] H. Lao et al., NUCL SCI TECH 29, 82 (2018).
- [23] J.Cleymans and D. Worku, J Phys. G: Nucl. Part. Phys. 39, 025006 (2012).
- [24] B. I. Abelev et al., (STAR Collaboration), Phys. Rev. C 75, 064901 (2007).
- [25] A. Adare et al., (PHENIX Collaboration), Phys. Rev. C 83, 052004, (2010).
- [26] A. Adare et al., (PHENIX Collaboration), Phys. Rev. C 83, 064903 (2011).
- [27] G. Aad et al., (ATLAS collaboration), New J. Phys. 13, 053033 (2011).
- [28] A. M. Sirunyan et al., (CMS Collaboration) Phys. Rev. D 96 112003 (2017).
- [29] K. Aamodt, et al., (ALICE Collaboration), Eur. Phys. J. C 71 1655 (2011).
- [30] B. Abelev et al., (ALICE Collaboration), Phys. Lett. B, 717, 162 (2012).
- [31] S. Acharya et al., (ALICE Collaboration), Eur. Phys. J. C 78, 263 (2018).
- [32] S. Acharya et al., (ALICE Collaboration), Eur. Phys. J. C 80, 167 (2020).
- [33] D. Mishra Ph.D. thesis: “Particle Production Studies in Au+Au and U+U Collisions Using the Detector at RHIC and Understanding the Freeze-out Dynamics”.
- [34] B. Abelev et al., (STAR Collaboration), Phys. Lett. B 655, 104 (2007).
- [35] B. Abelev et al., (STAR Collaboration), Phys. Rev. Lett. 97, 152301 (2006).
- [36] S. S. Adler et al., (PHENIX Collaboration), Phys. Rev. C 69, 034909 (2004).
- [37] J. Adam et al., (ALICE Collaboration), Phys. Rev. C 93, 034913 (2016).
- [38] B. Abelev et al., (ALICE Collaboration), Phys. Lett. B 720, 52 (2013).
- [39] S. Acharya et al., (ALICE Collaboration), J. High Energy Phys. 11 013 (2018).
- [40] Aleksas Mazeliauskas and Vytautas Vislavicius, Phys. Rev. C 101, 014910 (2020).