Supersaturation in the Wake of a Precipitating Hydrometeor and its Impact on Aerosol Activation
Abstract
The secondary activation of aerosols impacts the life cycle of a cloud. A detailed understanding is necessary for reliable climate prediction. Recent laboratory experiments demonstrate that aerosols can be activated in the wake of precipitating hydrometeors. However, many quantitative aspects of this wake-induced activation remain unclear. Here, we report a detailed numerical investigation of the activation potential of wake-induced supersaturation. By Lagrangian tracking of aerosols we show that a significant fraction of aerosols are activated in the supersaturated wake. These ‘lucky aerosols’ are entrained in the wake’s vortices and reside in the supersaturated environment sufficiently long to be activated. Our analyses show that wake-induced activation can contribute at a level similar to other well known secondary production processes.
Geophysical Research Letters
Department of Applied Science and Technology, Politecnico di Torino, Torino, Italy Laboratory for Fluid Physics, Pattern Formation and Biocomplexity, Max Planck Institute for Dynamics and Self-Organization, Göttingen, Germany Department of Mechanical and Aerospace Engineering, Politecnico di Torino, Torino, Italy Institute for Dynamics of Complex Systems, University of Göttingen, Göttingen, Germany Laboratory of Solid State Physics, Cornell University, Ithaca, NY, USA
Yong Wangyong.wang@ds.mpg.de \correspondingauthorGholamhossein Bagherigholamhossein.bagheri@ds.mpg.de
This study shows how wake-induced supersaturation in clouds activates aerosols in an equal level of other secondary production processes.
The parameter space for wake-induced supersaturation behind precipitating spherical hydrometeors is detailed.
It is described how lucky aerosols are activated in such supersaturated wake of the precipitating hydrometeors.
Plain Language Summary
We numerically investigate how new water droplets or ice particles are formed within a cloud. Out of several proposed physical processes for droplet generation, recent experimental studies have shown that a large droplet can nucleate aerosols in the wake behind it when falling under gravity. We present a detailed analysis of various physical factors that lead to an excess of water vapor behind the hydrometeors (e.g., droplets, sleet or hail) and investigate the effectiveness of this process on activation of aerosols to create new cloud particles.
1 Introduction
The dynamics of atmospheric clouds remains a major source of uncertainty in weather and climate models [Stevens \BBA Bony (\APACyear2013)] due to the interplay of many physical processes over a wide range of scales [Bodenschatz \BOthers. (\APACyear2010)]. Especially the activation of aerosols and species therein controls the lifetime of a cloud [Kreidenweis \BOthers. (\APACyear2019)] in which fractions of cloud condensation nuclei (CCN) and ice nucleating particles (INP) develop into new hydrometeors [M\BPBIB. Baker (\APACyear1997)]. Physical processes contributing to the activation [Field \BOthers. (\APACyear2017)] within a mature cloud can not explain the observed discrepancies between the measured activation and the observed hydrometeor population, which is several orders of magnitude higher than expected [Pruppacher \BBA Klett (\APACyear2010), Y. Huang \BOthers. (\APACyear2017)]. One possible explanation of this riddle might be the recently discovered wake-induced supersaturation and activation of aerosols behind large precipitating hydrometeors, i.e. heterogeneous wake-induced nucleation [Prabhakaran \BOthers. (\APACyear2017), Chouippe \BOthers. (\APACyear2019), Prabhakaran \BOthers. (\APACyear2020)]. The experimental investigation by \citeAPrabhakaran2017 of falling drops (diameter of mm) in near critical point conditions of pressurized sulfur-hexafluoride showed evidences of homogeneous nucleation in the wake. \citeAPrabhakaran2020 conducted a follow-up experiment on heterogeneous nucleation using sodium chloride and silver iodide aerosols under atmosphere-like conditions. Warm droplets with a diameter of mm were able to induce the activation of ice aerosols in their wake when precipitating through a subsaturated colder environment. Earlier, a numerical analysis of supersaturation in the wake of a warmer hydrometeor moving through various colder environments was performed by \citeAChouippe2019. Their work confirms the existence of a supersaturated region in the wake of a hydrometeor that settles through a colder saturated environment. The maximum supersaturation observed in the wake was higher the larger the temperature difference between the hydrometeor and the ambient was. In a more recent study, \citeAChouippe2020 extended their earlier work \citeAChouippe2019 and explicitly estimated the influence of wake supersaturation on the ice enhancement factor using a model based on a power law dependence of the local supersaturation [Huffman (\APACyear1973), B\BPBIA. Baker (\APACyear1991)] and concluded that the local ice nucleation enhancement alone cannot produce a sufficient number of activated ice nuclei to solve the observed number discrepancy. Although the development of supersaturation was studied numerically, the direct calculation of nucleation remained quite difficult due to the large number of parameters that include size distribution [Dusek \BOthers. (\APACyear2006)], number concentration [M\BPBIB. Baker (\APACyear1997)], chemical composition [Curtius (\APACyear2009), DeMott \BOthers. (\APACyear2018)], porosity or solubility [Kanji \BOthers. (\APACyear2017)] of aerosols etc. The complexity in the nucleation of aerosols is further complicated in mixed-phase clouds containing both water and ice phase hydrometeors. Ice nucleation through deposition and condensation freezing can occur on an aerosol during supersaturation in the ice phase at sub-zero temperatures [Meyers \BOthers. (\APACyear1992)]. Activation of aerosols by immersion freezing on a CCN or by contact freezing on a supercooled water drop can also be observed [Kanji \BOthers. (\APACyear2017)].
The above mentioned studies elucidated some aspects of wake supersaturation and aerosol initiation. In this letter, we present a comprehensive numerical study covering the parameter space relevant for atmospheric situations. We quantify the influence of ambient humidity and ambient/hydrometeor temperatures on the supersaturation within the wake for different sizes and phases of spherical hydrometeors. Next, with Lagrangian tracking of aerosols as passive tracers around such sedimenting hydrometeors we quantify the residence time and supersaturation experienced by individual aerosols as a function of the governing parameters. Finally, we discuss how these results can help to quantify the likelihood and significance of heterogeneous wake-induced nucleation in atmospheric clouds.
2 Model and Methods
We numerically simulate the flow around a solid spherical hydrometeor with diameter and temperature falling in air (ambient: temperature , relative humidity , density and pressure ) with constant velocity . While in general the shape of the hydrometeor will not be spherical and solid we expect this to be a good approximation. In the simulation all parameters are assumed to be constant, as the hydrometeor’s and environment’s properties vary slowly compared to that of the momentary flow (for more details see supporting information S2 and S3).
In dimensionless form the incompressible Navier-Stokes (NS) equations and the one-way coupled advection-diffusion (AD) equations for temperature and water vapor density are,
| (1) | |||||
| (2) | |||||
| (3) | |||||
| (4) |
where is the dimensionless pressure , is the Reynolds number (with being the kinematic viscosity of air), is the Prandtl number (with being the thermal diffusivity of air), is Schmidt number (with being the water vapor diffusivity). Following \citeAKotouc2009 and \citeAChouippe2020, as a first approximation, we neglect evaporation feedback on the momentum and particle temperature in the simulations(see S4).
We solve the model equations with the lattice Boltzmann method (LBM) [Succi (\APACyear2001), Qian \BOthers. (\APACyear1992), Guo \BOthers. (\APACyear2002), Silva \BBA Semiao (\APACyear2012), Krüger \BOthers. (\APACyear2017), Tian \BOthers. (\APACyear2018)] within the open-source LBM library Palabos [Latt \BOthers. (\APACyear2020)]. The simulation domain, with reference frame in the center of the hydrometeor, extends with a uniform Cartesian mesh of grid size . The surface of the hydrometeor is no-slip at zero velocity and with a constant temperature and water vapor density which is saturated at according to Maxwell diffusion model.
3 Results
We analyze the flow at different Reynolds numbers in the steady axisymmetric wake () and in the steady oblique wake () (see \citeAJohnson1999, and \citeATomboulides2000), with and according to the values of the atmospheric standard conditions [Montgomery (\APACyear1947), Michaelides (\APACyear2006)]. In the case of a liquid hydrometeor of density this corresponds to a particle with a diameter between and falling with terminal velocities between and . The ambient relative humidity is varied from nearly saturated () within the cloud [Siebert \BBA Shaw (\APACyear2017)] to a highly subsaturated in the open atmosphere (see also \citeAPrabhakaran2020). The supersaturation is computed with respect to the water phase when and with respect to the ice phase when by using the following empirical Equations (5) and (6) for liquid and frozen hydrometeors respectively [J. Huang (\APACyear2018)].
| (5) | |||||
| (6) |
We identify each simulations with a defined nomenclature, like for example, ‘LC 0 15 90’. Here the first letter indicates the hydrometeor phase (L liquid or I ice), the second letter indicates the sign of the temperature difference between the hydrometeor and the ambient (W warmer hydrometeor or C colder hydrometeor), and the three following numbers give the hydrometeor temperature (in degrees Celsius), the modulus of referred as (in degrees Celsius) and the ambient relative humidity (in %). Thus, ‘LC 0 15 90’ is a liquid hydrometeor colder than the ambient, with a surface temperature of in an ambient air with a temperature of and a relative humidity equal to 90%.
3.1 Supersaturation in the wake
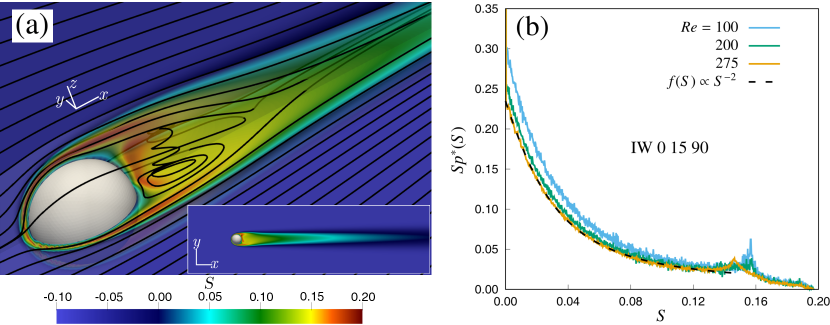
Figure 1(a) shows an example of a visualization of the supersaturation field at in an ambient relative humidity of with respect to ice phase for a warm hydrometeor (IW 0 15 90). High supersaturation is clearly visible in the boundary layer of the droplet and in the near wake, as well as, in the large region downstream of the hydrometeor. In this oblique regime, some streamlines pass through the wake’s vortices, a feature consistent with the results of \citeAJohnson1999 for the oblique wake vortex structures. The overall distribution of supersaturation in the entire three dimensional domain above a supersaturation threshold of is shown in Figure 1(b). There the supersaturation spectrum is normalized by the hydrometeor volume and the supersaturated volume is an integral of . To avoid numerical round-off errors around the surface of the hydrometeor, where , the supersaturation threshold is defined as , with being the maximum supersaturation obtained in a simulation. The statistics of the bright colored supersaturated region in Figure 1(a) shows the evolution in Figure 1(b). The trend of ceases around , which is the highest magnitude of reached within the boundary layer and in the recirculating zone behind the hydrometeor in Figure 1(a). decreases slightly with increasing Reynolds number, which implies a reduction in the volume of the supersaturated region with respect to the hydrometeor volume, due to gradual thinning of the boundary layer and a correlated shrinking of the lateral extent of the wake. Although a volumetric change in is observed with different , the magnitudes of remain almost constant for a specific thermodynamic state, independent of .
The evolution of as a function of and other thermodynamic parameters is shown in Figure 2(a) for exemplary cases presenting a temperature difference of and . For full details on the evolution of in a whole range of , , , hydrometeor phase (I or L), and warmer (W) or cooler (C) setups, see S5. In general, a frozen hydrometeor (solid lines) produces a significantly larger supersaturated region than a liquid hydrometeor (dashed lines). This is partly due to the lower magnitude of the saturation vapor pressure in the ice phase compared to its magnitude in the liquid water phase at temperatures of (e.g., lower at ). The evolution of , as shown in Figure 2(a), with respect to the hydrometeor phase and its warmer or colder state also applies to all other and , as detailed in the supporting information. Figure 2(a) also shows that warmer liquid droplets, as for example, ‘LW 15 15 95’ in produce almost times larger than ice hydrometeors like ’IC -15 15 95’. This is generally true also for other and . This signifies that the warmer hydrometeors produce larger than the colder ones for similar , and . This phenomenon can be further explained by analytically solving the normalized and equations (see S6) for , where warmer liquid droplets like ‘LW 15 15 ’ also produce larger than the colder frozen hydrometeors as ‘IC -15 15 ’ for various conditions. It is further observed that a minimum of is necessary to produce , which are merely thin supersaturated boundary layers around the hydrometeor. For hydrometeors that are colder than the ambient, needs to be at least to produce a similar volume of .
In all cases, the supersatured volume can be fitted by the following scaling function (goodness of fit ) for the whole range of the Reynolds number, despite the change in the wake structure around .
| (7) |
The fitting coefficient represents an asymptotic value, which depends on the thermodynamic parameters of the ambient and the hydrometeor , i.e., , , (I) ice or (L) liquid, (W) warm or (C) colder temperature than the ambient. The coefficient and the exponent show a minor sensitivity to the thermodynamic parameters, as, is between and is for our simulations. The data only deviates significantly when the supersaturated region is not completely within the computational domain (e.g., the case of warmer ice hydrometeors at higher Reynolds number and in almost saturated ambient) and we thus consider this a numerical artifact. We observed that the scaling of the supersaturated volume closely follows the scaling of the drag coefficient with the Reynolds number in the investigated range of [Clift \BOthers. (\APACyear1978)]. Thus the decrease in follows the dynamics of the wake, as also Figure 1(a) suggests. This aspect requires, however, further quantitative investigation.

Figure 2(b) shows the development of the maximum supersaturation over a wide range of hydrometeor temperature and ambient temperature at a fixed Reynolds number and an ambient relative humidity for both (I) frozen and (L) liquid hydrometeors with both (W) warmer or (C) colder temperature than the ambient. The diagonal in white dashed line corresponds to and divides the plane into the colder hydrometeor case (top left) and the warmer hydrometeor case (bottom right). The temperature difference plays a crucial role, since increases almost exponentially with it at constant . Similar to , warmer hydrometeors generally produce a higher supersaturation maximum than colder hydrometeors at the same , regardless of their frozen or liquid state. The only exception happens in a nearly saturated ambient at , because the warmer hydrometeor is a liquid one while the colder one is frozen. In addition, evolves almost independently of for various thermodynamic conditions. For details see S7.
3.2 Residence time of aerosols in the wake
Atmospheric aerosols, which can be activated as CCN or INP, behave as passive tracers due to their negligible Stokes number. To understand the possible role of the supersaturated hydrometeor wake on the aerosol activation, we have analyzed the trajectories of passive tracers injected upstream of the hydrometeor. Since only tracers starting their motion near the center line can enter the supersaturated regions, two injection patterns are used: a coarse pattern where tracers are injected uniformly over an area of [] and a fine pattern where tracers are injected uniformly over an area of [] in the inlet around the hydrometeor center line. An adaptive Runge-Kutta 4-5 method is used for time integration of the trajectories. Velocity, temperature and vapor density at the tracer position are obtained by tri-linear interpolation.
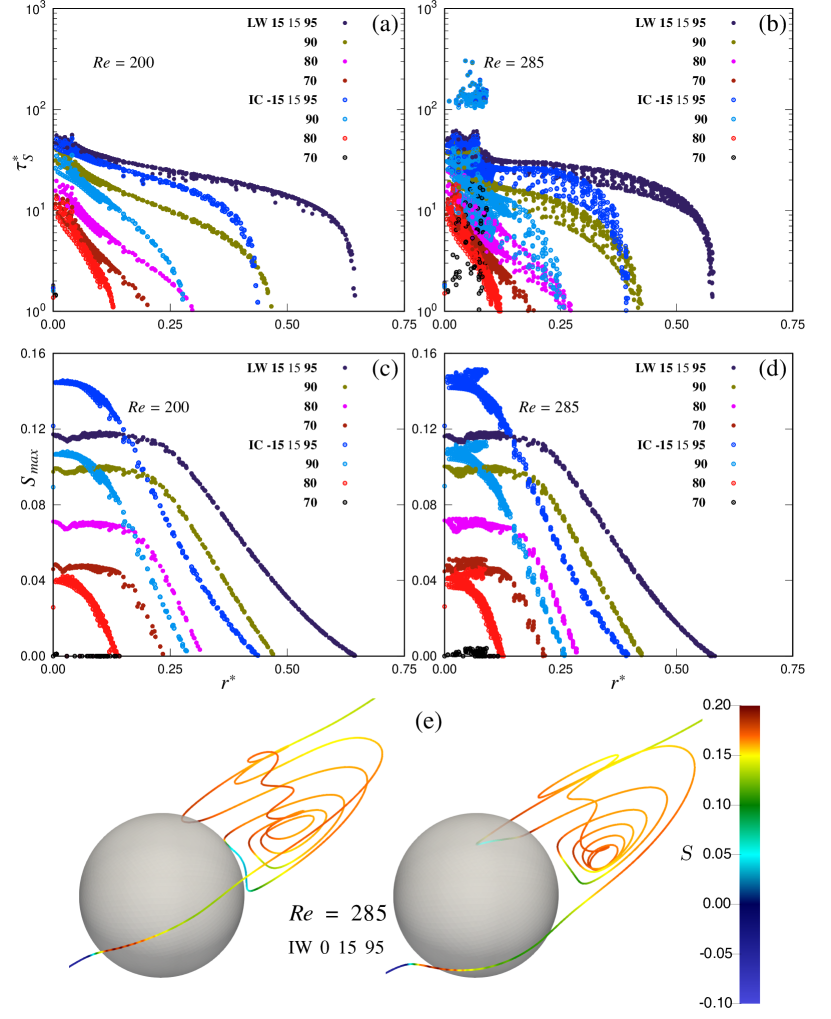
The possibility of an aerosol being activated as a CCN or an INP depends both on the instantaneous supersaturation it experiences and on the time it spends in highly supersaturated regions (residence time), so that it reaches a critical size that prevents its complete evaporation/sublimation according to the Köhler curve [Seinfeld \BBA Pandis (\APACyear2006)]. In Figure 3 we therefore plot the residence time that a tracer spends within the supersaturated wake in panels (a) and (b), and that it sees in (c) and (d) as a function of the initial radial distance of the tracer from the hydrometeor center line for axisymmetric () and oblique () wakes, respectively. The different structure of the wake creates clearly visible differences in the supersaturation experienced by the tracers. The tracers, which stay for the longer time in the supersaturated region of axisymmetric wake, are introduced near the center line as shown in Figure 3(a), so that they move through the supersaturated boundary layer and along the border of the wake. However, no tracers could enter the closed recirculating region, resulting at most in the order of for .
In the oblique wake regime of , shown exemplary in Figure 3(b), tracers injected far from the axis show no significant qualitative difference in and they experience lower in Figure 3(d) for a short time. However, ‘lucky tracers’ injected near the center line can enter the near wake vortical region and therefore remain trapped in the supersaturated recirculating zone for a longer time before moving downstream. This increases by a factor between 2.5 to 9 with respect to the bulk of the tracers injected from the same radial distance in the symmetric or oblique wake regimes. We quantify the extent of the injection region of lucky tracers with , which is confined to a radial distance of . The ‘capture efficiency’ , which is defined as the ratio between the total frontal area of the tracers with and the frontal area of the hydrometeor , is about for , while it is almost zero in the steady axisymmetric regime. The scatter in Figure 3(b) for , which produces petal-like patterns at low , is due to the lack of axial symmetry in the oblique wake regime. The larger extent of the supersaturated region generated by a warmer hydrometeor (solid dots) compared to a colder hydrometeor (empty dots) for the same and is also visible in Figure 3. This is evident from the lower decay of and with for warmer hydrometeors.
The mechanism allowing long residence times in the case of an oblique wake can be inferred from Figure 3(e), which shows two sample tracer trajectories with and , respectively, each of which enter the vortical oblique wake region at . The colors of the trajectories represent the instantaneous supersaturation the tracers experience. Such lucky tracers, introduced very near the hydrometeor center line, experience a sudden maximum of supersaturation , for a short time as they move through the boundary layer on the front of the sphere. Then the supersaturation gradually decreases along the trajectory to about . Later, when the tracer is entrained within the recirculating oblique wake zone, it experiences higher supersaturation again, but for a longer time due to the low velocity and complex three dimensional flow structures of this region. However, such entrainment phenomenon is only observed when the wake loses its symmetry, i.e. in the oblique wake regime from in our simulations.
4 Implications for the Nucleation in Clouds
The extent of the supersaturated volume, the maximum supersaturation and the residence time of an aerosol in the supersaturated wake of precipitating hydrometeors provide important insights on aerosol activation in the atmosphere. For the aerosol entrainment in the wake, the precipitating hydrometeor has to generate an oblique wake, which occurs for a precipitating spherical raindrop when the diameter is at least . Since raindrops exceeding a diameter of to are very rare and occur mostly in thunderstorms [Pruppacher \BBA Klett (\APACyear2010)], and also to satisfy the need for higher temperature difference; it is evident that wake-induced supersaturation can happen mainly in deep convective clouds with fully glaciated, mixed phased as well as various liquid phase hydrometeors due to a large temperature variation [Yuan \BOthers. (\APACyear2010)]. From the results of the previous section, the entertainment rate of ‘lucky aerosols’, which enter per unit time into the frontal capture area of a hydrometeor and thus experience a long residence time inside the supersaturated wake, is estimated as
Here is the capture efficacy, which is about for and almost zero in the steady axisymmetric regime. is the typical aerosol concentration, which varies from to within the continental clouds, and from to within the remote marine clouds [Pruppacher \BBA Klett (\APACyear2010)]. Therefore, aerosols in continental clouds and aerosols in remote marine clouds experience a higher residence time and higher supersaturation in the wake when a raindrop of at least diameter settles at its terminal velocity (). Measurements of the number density of raindrops above show a wide variability, which can be estimated to be in the range of drops per cubic metre [<]e.g.,¿[and others]Waldvogel1974,Adirosi2016. This leads to an entrainment rate of aerosols in the drop wakes between and . Since the capture efficiency increases with the Reynolds number (we use the of ), this could be considered a conservative estimate.
The critical supersaturation required for activation of aerosols is achieved by solving the Köhler equation for its chemical compositions and size [<]e.g.,¿[and others]Seinfeld2006,McFiggans2006,Lohmann2015. Since critical supersaturation needed for the heterogeneous nucleation of common atmospheric aerosols rarely exceed in a uniform environment, we may estimate the aerosol growth (see S8) during its residence time within the supersaturated wake by considering the average supersaturation, which is much higher than for a temperature difference of between the hydrometeor and the ambient. Such estimation shows that inside such a supersaturated wake, an aerosol can grow well above its critical radius and therefore be activated. During a convective precipitation process of typically 20 minutes, new aerosols can therefore be activated in the wake of the precipitating hydrometeors, which replenish the activated particle concentration in clouds that typically vary in [Rosenfeld \BOthers. (\APACyear2016)]. This rate of secondary activation is well comparable with the experiment of \citeAMossop1976 on secondary ice production during the growth of a graupel by rimming splintering and with the in cloud measurements of secondary ice particles by \citeAHeymsfield2014. However, for an explicit quantification of wake-induced nucleation, a detailed micro-physical study is required taking into account the full details of the changing atmospheric conditions and the particle evolution while falling through the convective cloud. In addition, the effects of other influencing factors, such as cloud free stream turbulence [Bagchi \BBA Kottam (\APACyear2008)], strong convective motions like central updraft or entrainment induced mixing [<]e.g.,¿[and others]Grabowski2013,Nair2020,Bhowmick2019, or strong downdraft during precipitation [Wang \BOthers. (\APACyear2016)] may further influence this nucleation and activation rate, which needs to be carefully investigated.
5 Summary and Concluding Remarks
In this letter a detailed analysis of the supersaturation field and aersol activation around a spherical hydrometeor, which settles at its terminal velocity, for different atmospheric conditions is presented. The Navier-Stokes equation for the flow velocity and the one-way coupled advection-diffusion equations for temperature and density of water vapor are solved with the lattice Boltzmann method. The supersaturated volume in the wake of steady axisymmetric regime () and oblique regime () shows a decrease for the same thermodynamic conditions. Whereas, is very sensitive to the temperature difference between the hydrometeor and the ambient and its relative humidity condition , so that at constant increases as increases, which means that a small amount of vapor diffusion from a warmer hydrometeor or cooling by a colder hydrometeor can easily supersaturate an almost saturated wake volume. However, when is fixed, plays a crucial role in , since without an adequate a negligible supersaturated volume is generated. In addition, persistently warmer hydrometeors than the ambient produced larger than the colder ones. The supersaturation maximum behaves qualitatively similar to .
Lagrangian tracking of aerosols as passive tracers shows how the complex flow pattern of the oblique wake allows some lucky aerosols to be entrained within the recirculating wake, resulting in a higher residence time within the highly supersaturated vortical zone. Importantly, We found that such a long residence time within the highly supersaturated wake not only exposes the aerosols to a higher level of supersaturation compared to its nucleation barrier, but also provides enough time for the growth by deposition of water vapor to exceed its critical size, and therefore to be activated as a CCN or INP. The frontal area of these lucky tracers entering the vortical but highly supersaturated oblique wake has a capture efficiency of with respect to the hydrometeor frontal area at . Our analysis shows that wake-induced nucleation of aerosols during a convective precipitation of minutes can generate new CCNs and INPs, which is in order of magnitude comparable to other secondary ice production mechanisms, and thus contribute to the life cycle of clouds.
Acknowledgements.
This research was funded by the Marie - Skłodowska Curie Actions (MSCA) under the European Union’s Horizon 2020 research and innovation programme (grant agreement no. 675675), and an extension to programme COMPLETE by Department of Applied Science and Technology, Politecnico di Torino. Scientific activities are carried out in Max Planck Institute for Dynamics and Self-Organization (MPIDS) and computational resources from HPC@MPIDS are gratefully acknowledged. First author wishes to acknowledge Giuliana Donini, Guido Saracco, Mario Trigiante and Paolo Fino for support.References
- Adirosi \BOthers. (\APACyear2016) \APACinsertmetastarAdirosi2016{APACrefauthors}Adirosi, E., Volpi, E., Lombardo, F.\BCBL \BBA Baldini, L. \APACrefYearMonthDay2016. \BBOQ\APACrefatitleRaindrop size distribution: Fitting performance of common theoretical models Raindrop size distribution: Fitting performance of common theoretical models.\BBCQ \APACjournalVolNumPagesAdvances in Water Resources96290 - 305. {APACrefDOI} 10.1016/j.advwatres.2016.07.010 \PrintBackRefs\CurrentBib
- Bagchi \BBA Kottam (\APACyear2008) \APACinsertmetastarBagchi2008{APACrefauthors}Bagchi, P.\BCBT \BBA Kottam, K. \APACrefYearMonthDay2008. \BBOQ\APACrefatitleEffect of freestream isotropic turbulence on heat transfer from a sphere Effect of freestream isotropic turbulence on heat transfer from a sphere.\BBCQ \APACjournalVolNumPagesPhysics of Fluids207073305. {APACrefDOI} 10.1063/1.2963138 \PrintBackRefs\CurrentBib
- B\BPBIA. Baker (\APACyear1991) \APACinsertmetastarBaker1991{APACrefauthors}Baker, B\BPBIA. \APACrefYearMonthDay1991. \BBOQ\APACrefatitleOn the Nucleation of Ice in Highly Supersaturated Regions of Clouds On the nucleation of ice in highly supersaturated regions of clouds.\BBCQ \APACjournalVolNumPagesJournal of the Atmospheric Sciences48161904-1907. {APACrefDOI} 10.1175/1520-0469(1991)048¡1905:OTNOII¿2.0.CO;2 \PrintBackRefs\CurrentBib
- M\BPBIB. Baker (\APACyear1997) \APACinsertmetastarBaker1997{APACrefauthors}Baker, M\BPBIB. \APACrefYearMonthDay1997. \BBOQ\APACrefatitleCloud Microphysics and Climate Cloud microphysics and climate.\BBCQ \APACjournalVolNumPagesScience27653151072–1078. {APACrefDOI} 10.1126/science.276.5315.1072 \PrintBackRefs\CurrentBib
- Bhowmick \BBA Iovieno (\APACyear2019) \APACinsertmetastarBhowmick2019{APACrefauthors}Bhowmick, T.\BCBT \BBA Iovieno, M. \APACrefYearMonthDay2019. \BBOQ\APACrefatitleDirect Numerical Simulation of a Warm Cloud Top Model Interface: Impact of the Transient Mixing on Different Droplet Population Direct numerical simulation of a warm cloud top model interface: Impact of the transient mixing on different droplet population.\BBCQ \APACjournalVolNumPagesFluids43. {APACrefDOI} 10.3390/fluids4030144 \PrintBackRefs\CurrentBib
- Bodenschatz \BOthers. (\APACyear2010) \APACinsertmetastarBodenschatz2010{APACrefauthors}Bodenschatz, E., Malinowski, S\BPBIP., Shaw, R\BPBIA.\BCBL \BBA Stratmann, F. \APACrefYearMonthDay2010. \BBOQ\APACrefatitleCan We Understand Clouds Without Turbulence? Can we understand clouds without turbulence?\BBCQ \APACjournalVolNumPagesScience3275968970–971. {APACrefDOI} 10.1126/science.1185138 \PrintBackRefs\CurrentBib
- Chouippe \BOthers. (\APACyear2019) \APACinsertmetastarChouippe2019{APACrefauthors}Chouippe, A., Krayer, M., Uhlmann, M., Dušek, J., Kiselev, A.\BCBL \BBA Leisner, T. \APACrefYearMonthDay2019. \BBOQ\APACrefatitleHeat and water vapor transfer in the wake of a falling ice sphere and its implication for secondary ice formation in clouds Heat and water vapor transfer in the wake of a falling ice sphere and its implication for secondary ice formation in clouds.\BBCQ \APACjournalVolNumPagesNew Journal of Physics214043043. {APACrefDOI} 10.1088/1367-2630/ab0a94 \PrintBackRefs\CurrentBib
- Clift \BOthers. (\APACyear1978) \APACinsertmetastarClift1978{APACrefauthors}Clift, R., Grace, J.\BCBL \BBA Weber, M. \APACrefYear1978. \APACrefbtitleBubbles, Drops, and Particles Bubbles, drops, and particles. \APACaddressPublisherAcademic Press. \PrintBackRefs\CurrentBib
- Curtius (\APACyear2009) \APACinsertmetastarCurtius2009{APACrefauthors}Curtius, J. \APACrefYearMonthDay2009. \BBOQ\APACrefatitleNucleation of atmospheric particles Nucleation of atmospheric particles.\BBCQ \APACjournalVolNumPagesEur. Phys. J. Conferences1199-209. {APACrefDOI} 0.1140/epjconf/e2009-00921-0 \PrintBackRefs\CurrentBib
- DeMott \BOthers. (\APACyear2018) \APACinsertmetastarDeMott2018{APACrefauthors}DeMott, P\BPBIJ., Möhler, O., Cziczo, D\BPBIJ., Hiranuma, N., Petters, M\BPBID., Petters, S\BPBIS.\BDBLZenker, J. \APACrefYearMonthDay2018. \BBOQ\APACrefatitleThe Fifth International Workshop on Ice Nucleation phase 2 (FIN-02): laboratory intercomparison of ice nucleation measurements The fifth international workshop on ice nucleation phase 2 (fin-02): laboratory intercomparison of ice nucleation measurements.\BBCQ \APACjournalVolNumPagesAtmospheric Measurement Techniques11116231–6257. {APACrefDOI} 10.5194/amt-11-6231-2018 \PrintBackRefs\CurrentBib
- Dusek \BOthers. (\APACyear2006) \APACinsertmetastarDusek2006{APACrefauthors}Dusek, U., Frank, G\BPBIP., Hildebrandt, L., Curtius, J., Schneider, J., Walter, S.\BDBLAndreae, M\BPBIO. \APACrefYearMonthDay2006. \BBOQ\APACrefatitleSize Matters More Than Chemistry for Cloud-Nucleating Ability of Aerosol Particles Size matters more than chemistry for cloud-nucleating ability of aerosol particles.\BBCQ \APACjournalVolNumPagesScience31257781375–1378. {APACrefDOI} 10.1126/science.1125261 \PrintBackRefs\CurrentBib
- Field \BOthers. (\APACyear2017) \APACinsertmetastarfield2017{APACrefauthors}Field, P\BPBIR., Lawson, R\BPBIP., Brown, P\BPBIR\BPBIA., Lloyd, G., Westbrook, C., Moisseev, D.\BDBLSullivan, S. \APACrefYearMonthDay2017. \BBOQ\APACrefatitleSecondary Ice Production: Current State of the Science and Recommendations for the Future Secondary ice production: Current state of the science and recommendations for the future.\BBCQ \APACjournalVolNumPagesMeteorological Monographs587.1-7.20. {APACrefDOI} 10.1175/AMSMONOGRAPHS-D-16-0014.1 \PrintBackRefs\CurrentBib
- Grabowski \BBA Wang (\APACyear2013) \APACinsertmetastarGrabowski2013{APACrefauthors}Grabowski, W\BPBIW.\BCBT \BBA Wang, L\BHBIP. \APACrefYearMonthDay2013. \BBOQ\APACrefatitleGrowth of Cloud Droplets in a Turbulent Environment Growth of cloud droplets in a turbulent environment.\BBCQ \APACjournalVolNumPagesAnnual Review of Fluid Mechanics451293-324. {APACrefDOI} 10.1146/annurev-fluid-011212-140750 \PrintBackRefs\CurrentBib
- Guo \BOthers. (\APACyear2002) \APACinsertmetastarGuo2002{APACrefauthors}Guo, Z., Zheng, C.\BCBL \BBA Shi, B. \APACrefYearMonthDay2002. \BBOQ\APACrefatitleAn extrapolation method for boundary conditions in lattice Boltzmann method An extrapolation method for boundary conditions in lattice boltzmann method.\BBCQ \APACjournalVolNumPagesPhysics of Fluids1462007-2010. {APACrefDOI} 10.1063/1.1471914 \PrintBackRefs\CurrentBib
- Heymsfield \BBA Willis (\APACyear2014) \APACinsertmetastarHeymsfield2014{APACrefauthors}Heymsfield, A.\BCBT \BBA Willis, P. \APACrefYearMonthDay2014. \BBOQ\APACrefatitleCloud Conditions Favoring Secondary Ice Particle Production in Tropical Maritime Convection Cloud Conditions Favoring Secondary Ice Particle Production in Tropical Maritime Convection.\BBCQ \APACjournalVolNumPagesJournal of the Atmospheric Sciences71124500-4526. {APACrefDOI} 10.1175/JAS-D-14-0093.1 \PrintBackRefs\CurrentBib
- J. Huang (\APACyear2018) \APACinsertmetastarHuang2018{APACrefauthors}Huang, J. \APACrefYearMonthDay2018. \BBOQ\APACrefatitleA Simple Accurate Formula for Calculating Saturation Vapor Pressure of Water and Ice A simple accurate formula for calculating saturation vapor pressure of water and ice.\BBCQ \APACjournalVolNumPagesJournal of Applied Meteorology and Climatology5761265-1272. {APACrefDOI} 10.1175/JAMC-D-17-0334.1 \PrintBackRefs\CurrentBib
- Y. Huang \BOthers. (\APACyear2017) \APACinsertmetastarHuang2017{APACrefauthors}Huang, Y., Blyth, A\BPBIM., Brown, P\BPBIR\BPBIA., Choularton, T\BPBIW.\BCBL \BBA Cui, Z. \APACrefYearMonthDay2017. \BBOQ\APACrefatitleFactors controlling secondary ice production in cumulus clouds Factors controlling secondary ice production in cumulus clouds.\BBCQ \APACjournalVolNumPagesQuarterly Journal of the Royal Meteorological Society1437031021-1031. {APACrefDOI} 10.1002/qj.2987 \PrintBackRefs\CurrentBib
- Huffman (\APACyear1973) \APACinsertmetastarHuffman1973{APACrefauthors}Huffman, P\BPBIJ. \APACrefYearMonthDay1973. \BBOQ\APACrefatitleSupersaturation Spectra of AgI and Natural Ice Nuclei Supersaturation spectra of agi and natural ice nuclei.\BBCQ \APACjournalVolNumPagesJournal of Applied Meteorology1261080-1082. {APACrefDOI} 10.1175/1520-0450(1973)012¡1080:SSOAAN¿2.0.CO;2 \PrintBackRefs\CurrentBib
- Johnson \BBA Patel (\APACyear1999) \APACinsertmetastarJohnson1999{APACrefauthors}Johnson, T\BPBIA.\BCBT \BBA Patel, V\BPBIC. \APACrefYearMonthDay1999. \BBOQ\APACrefatitleFlow past a sphere up to a Reynolds number of 300 Flow past a sphere up to a reynolds number of 300.\BBCQ \APACjournalVolNumPagesJournal of Fluid Mechanics37819–70. {APACrefDOI} 10.1017/S0022112098003206 \PrintBackRefs\CurrentBib
- Kanji \BOthers. (\APACyear2017) \APACinsertmetastarKanji2017{APACrefauthors}Kanji, Z\BPBIA., Ladino, L\BPBIA., Wex, H., Boose, Y., Burkert-Kohn, M., Cziczo, D\BPBIJ.\BCBL \BBA Krämer, M. \APACrefYearMonthDay2017. \BBOQ\APACrefatitleOverview of Ice Nucleating Particles Overview of Ice Nucleating Particles.\BBCQ \APACjournalVolNumPagesMeteorological Monographs581.1-1.33. {APACrefDOI} 10.1175/AMSMONOGRAPHS-D-16-0006.1 \PrintBackRefs\CurrentBib
- Kotouč \BOthers. (\APACyear2009) \APACinsertmetastarKotouc2009{APACrefauthors}Kotouč, M., Bouchet, G.\BCBL \BBA Dušek, J. \APACrefYearMonthDay2009. \BBOQ\APACrefatitleTransition to turbulence in the wake of a fixed sphere in mixed convection Transition to turbulence in the wake of a fixed sphere in mixed convection.\BBCQ \APACjournalVolNumPagesJournal of Fluid Mechanics625205–248. {APACrefDOI} 10.1017/S0022112008005557 \PrintBackRefs\CurrentBib
- Krayer \BOthers. (\APACyear2020) \APACinsertmetastarChouippe2020{APACrefauthors}Krayer, M., Chouippe, A., Uhlmann, M., Dušek, J.\BCBL \BBA Leisner, T. \APACrefYearMonthDay2020. \BBOQ\APACrefatitleOn the ice-nucleating potential of warm hydrometeors in mixed-phase clouds On the ice-nucleating potential of warm hydrometeors in mixed-phase clouds.\BBCQ \APACjournalVolNumPagesAtmospheric Chemistry and Physics Discussions20201–21. {APACrefDOI} 10.5194/acp-2020-136 \PrintBackRefs\CurrentBib
- Kreidenweis \BOthers. (\APACyear2019) \APACinsertmetastarKreidenweis2019{APACrefauthors}Kreidenweis, S\BPBIM., Petters, M.\BCBL \BBA Lohmann, U. \APACrefYearMonthDay2019. \BBOQ\APACrefatitle100 Years of Progress in Cloud Physics, Aerosols, and Aerosol Chemistry Research 100 Years of Progress in Cloud Physics, Aerosols, and Aerosol Chemistry Research.\BBCQ \APACjournalVolNumPagesMeteorological Monographs5911.1-11.72. {APACrefDOI} 10.1175/AMSMONOGRAPHS-D-18-0024.1 \PrintBackRefs\CurrentBib
- Krüger \BOthers. (\APACyear2017) \APACinsertmetastarKruger2017{APACrefauthors}Krüger, T., Kusumaatmaja, H., Kuzmin, A., Shardt, O., Silva, G.\BCBL \BBA Viggen, E\BPBIM. \APACrefYear2017. \APACrefbtitleLattice Boltzmann Method: Fundamentals and Engineering Applications with Computer Codes Lattice boltzmann method: Fundamentals and engineering applications with computer codes. \APACaddressPublisherSpringer, Cham. {APACrefDOI} 10.1007/978-3-319-44649-3_8 \PrintBackRefs\CurrentBib
- Latt \BOthers. (\APACyear2020) \APACinsertmetastarLatt2020{APACrefauthors}Latt, J., Malaspinas, O., Kontaxakis, D., Parmigiani, A., Lagrava, D., Brogi, F.\BDBLChopard, B. \APACrefYearMonthDay2020. \BBOQ\APACrefatitlePalabos: Parallel Lattice Boltzmann Solver Palabos: Parallel lattice boltzmann solver.\BBCQ \APACjournalVolNumPagesComputers & Mathematics with Applications. {APACrefDOI} 10.1016/j.camwa.2020.03.022 \PrintBackRefs\CurrentBib
- Lohmann (\APACyear2015) \APACinsertmetastarLohmann2015{APACrefauthors}Lohmann, U. \APACrefYearMonthDay2015. \BBOQ\APACrefatitleAEROSOLS — Aerosol–Cloud Interactions and Their Radiative Forcing Aerosols — aerosol–cloud interactions and their radiative forcing.\BBCQ \BIn G\BPBIR. North, J. Pyle\BCBL \BBA F. Zhang (\BEDS), \APACrefbtitleEncyclopedia of Atmospheric Sciences (Second Edition) Encyclopedia of atmospheric sciences (second edition) (\PrintOrdinalSecond Edition \BEd, \BPG 17 - 22). \APACaddressPublisherOxfordAcademic Press. {APACrefDOI} 10.1016/B978-0-12-382225-3.00052-9 \PrintBackRefs\CurrentBib
- McFiggans \BOthers. (\APACyear2006) \APACinsertmetastarMcFiggans2006{APACrefauthors}McFiggans, G., Artaxo, P., Baltensperger, U., Coe, H., Facchini, M\BPBIC., Feingold, G.\BDBLWeingartner, E. \APACrefYearMonthDay2006. \BBOQ\APACrefatitleThe effect of physical and chemical aerosol properties on warm cloud droplet activation The effect of physical and chemical aerosol properties on warm cloud droplet activation.\BBCQ \APACjournalVolNumPagesAtmospheric Chemistry and Physics692593–2649. {APACrefDOI} 10.5194/acp-6-2593-2006 \PrintBackRefs\CurrentBib
- Meyers \BOthers. (\APACyear1992) \APACinsertmetastarMayers1992{APACrefauthors}Meyers, M\BPBIP., DeMott, P\BPBIJ.\BCBL \BBA Cotton, W\BPBIR. \APACrefYearMonthDay1992. \BBOQ\APACrefatitleNew Primary Ice-Nucleation Parameterizations in an Explicit Cloud Model New primary ice-nucleation parameterizations in an explicit cloud model.\BBCQ \APACjournalVolNumPagesJournal of Applied Meteorology317708-721. {APACrefDOI} 10.1175/1520-0450(1992)031¡0708:NPINPI¿2.0.CO;2 \PrintBackRefs\CurrentBib
- Michaelides (\APACyear2006) \APACinsertmetastarMichaelides2006{APACrefauthors}Michaelides, E\BPBIE. \APACrefYear2006. \APACrefbtitleParticles, Bubbles and Drops Particles, bubbles and drops. \APACaddressPublisherWorld Sceintific. {APACrefDOI} 10.1142/6018 \PrintBackRefs\CurrentBib
- Montgomery (\APACyear1947) \APACinsertmetastarMontgomery1947{APACrefauthors}Montgomery, R\BPBIB. \APACrefYearMonthDay1947. \BBOQ\APACrefatitleViscosity and Thermal Conductivity of Air and Diffusivity of Water Vapor in Air Viscosity and thermal conductivity of air and diffusivity of water vapor in air.\BBCQ \APACjournalVolNumPagesJournal of Meteorology46193-196. {APACrefDOI} 10.1175/1520-0469(1947)004¡0193:VATCOA¿2.0.CO;2 \PrintBackRefs\CurrentBib
- Mossop (\APACyear1976) \APACinsertmetastarMossop1976{APACrefauthors}Mossop, S\BPBIC. \APACrefYearMonthDay1976. \BBOQ\APACrefatitleProduction of secondary ice particles during the growth of graupel by riming Production of secondary ice particles during the growth of graupel by riming.\BBCQ \APACjournalVolNumPagesQuarterly Journal of the Royal Meteorological Society10243145-57. {APACrefDOI} 10.1002/qj.49710243104 \PrintBackRefs\CurrentBib
- Nair \BOthers. (\APACyear2020) \APACinsertmetastarNair2020{APACrefauthors}Nair, V., Heus, T.\BCBL \BBA van Reeuwijk, M. \APACrefYearMonthDay2020. \BBOQ\APACrefatitleDynamics of Subsiding Shells in Actively Growing Clouds with Vertical Updrafts Dynamics of Subsiding Shells in Actively Growing Clouds with Vertical Updrafts.\BBCQ \APACjournalVolNumPagesJournal of the Atmospheric Sciences7741353-1369. {APACrefDOI} 10.1175/JAS-D-19-0018.1 \PrintBackRefs\CurrentBib
- Prabhakaran \BOthers. (\APACyear2020) \APACinsertmetastarPrabhakaran2020{APACrefauthors}Prabhakaran, P., Kinney, G., Cantrell, W., Shaw, R\BPBIA.\BCBL \BBA Bodenschatz, E. \APACrefYearMonthDay2020. \BBOQ\APACrefatitleHigh Supersaturation in the Wake of Falling Hydrometeors: Implications for Cloud Invigoration and Ice Nucleation High supersaturation in the wake of falling hydrometeors: Implications for cloud invigoration and ice nucleation.\BBCQ \APACjournalVolNumPagesGeophysical Research Letters4710e2020GL088055. {APACrefDOI} 10.1029/2020GL088055 \PrintBackRefs\CurrentBib
- Prabhakaran \BOthers. (\APACyear2017) \APACinsertmetastarPrabhakaran2017{APACrefauthors}Prabhakaran, P., Weiss, S., Krekhov, A., Pumir, A.\BCBL \BBA Bodenschatz, E. \APACrefYearMonthDay2017. \BBOQ\APACrefatitleCan Hail and Rain Nucleate Cloud Droplets? Can hail and rain nucleate cloud droplets?\BBCQ \APACjournalVolNumPagesPhys. Rev. Lett.119128701. {APACrefDOI} 10.1103/PhysRevLett.119.128701 \PrintBackRefs\CurrentBib
- Pruppacher \BBA Klett (\APACyear2010) \APACinsertmetastarPruppacher2010{APACrefauthors}Pruppacher, H\BPBIR.\BCBT \BBA Klett, J\BPBID. \APACrefYear2010. \APACrefbtitleMicrophysics of Clouds and Precipitation Microphysics of clouds and precipitation (\PrintOrdinalsecond \BEd). \APACaddressPublisherSpringer, Dordrecht. {APACrefDOI} 10.1007/978-0-306-48100-0 \PrintBackRefs\CurrentBib
- Qian \BOthers. (\APACyear1992) \APACinsertmetastarQian1992{APACrefauthors}Qian, Y., D’Humières, D.\BCBL \BBA Lallemand, P. \APACrefYearMonthDay1992. \BBOQ\APACrefatitleLattice BGK models for Navier-Stokes equation Lattice BGK models for Navier-Stokes equation.\BBCQ \APACjournalVolNumPagesEurophysics Letters176479–484. \PrintBackRefs\CurrentBib
- Rosenfeld \BOthers. (\APACyear2016) \APACinsertmetastarRosenfeld2016{APACrefauthors}Rosenfeld, D., Zheng, Y., Hashimshoni, E., Pöhlker, M\BPBIL., Jefferson, A., Pöhlker, C.\BDBLAndreae, M\BPBIO. \APACrefYearMonthDay2016. \BBOQ\APACrefatitleSatellite retrieval of cloud condensation nuclei concentrations by using clouds as CCN chambers Satellite retrieval of cloud condensation nuclei concentrations by using clouds as ccn chambers.\BBCQ \APACjournalVolNumPagesProceedings of the National Academy of Sciences113215828–5834. {APACrefDOI} 10.1073/pnas.1514044113 \PrintBackRefs\CurrentBib
- Seinfeld \BBA Pandis (\APACyear2006) \APACinsertmetastarSeinfeld2006{APACrefauthors}Seinfeld, J.\BCBT \BBA Pandis, S. \APACrefYear2006. \APACrefbtitleAtmospheric Chemistry and Physics: From Air Pollution to Climate Change Atmospheric chemistry and physics: From air pollution to climate change (\PrintOrdinal2 \BEd). \APACaddressPublisherJohn Wiley & Sons, New York. \PrintBackRefs\CurrentBib
- Siebert \BBA Shaw (\APACyear2017) \APACinsertmetastarSiebert_2017{APACrefauthors}Siebert, H.\BCBT \BBA Shaw, R\BPBIA. \APACrefYearMonthDay2017. \BBOQ\APACrefatitleSupersaturation Fluctuations during the Early Stage of Cumulus Formation Supersaturation fluctuations during the early stage of cumulus formation.\BBCQ \APACjournalVolNumPagesJournal of the Atmospheric Sciences744975-988. {APACrefDOI} 10.1175/JAS-D-16-0115.1 \PrintBackRefs\CurrentBib
- Silva \BBA Semiao (\APACyear2012) \APACinsertmetastarSilva2012{APACrefauthors}Silva, G.\BCBT \BBA Semiao, V. \APACrefYearMonthDay2012. \BBOQ\APACrefatitleFirst- and second-order forcing expansions in a lattice Boltzmann method reproducing isothermal hydrodynamics in artificial compressibility form First- and second-order forcing expansions in a lattice boltzmann method reproducing isothermal hydrodynamics in artificial compressibility form.\BBCQ \APACjournalVolNumPagesJournal of Fluid Mechanics698282–303. {APACrefDOI} 10.1017/jfm.2012.83 \PrintBackRefs\CurrentBib
- Stevens \BBA Bony (\APACyear2013) \APACinsertmetastarstevens2013climate{APACrefauthors}Stevens, B.\BCBT \BBA Bony, S. \APACrefYearMonthDay2013. \BBOQ\APACrefatitleWhat are climate models missing? What are climate models missing?\BBCQ \APACjournalVolNumPagesScience34061361053–1054. {APACrefDOI} 10.1126/science.1237554 \PrintBackRefs\CurrentBib
- Succi (\APACyear2001) \APACinsertmetastarsucci2011{APACrefauthors}Succi, S. \APACrefYear2001. \APACrefbtitleLattice Boltzmann equation for fluid dynamics and beyond Lattice Boltzmann equation for fluid dynamics and beyond. \APACaddressPublisherOxfordClarendon Press. \PrintBackRefs\CurrentBib
- Tian \BOthers. (\APACyear2018) \APACinsertmetastarTian2018{APACrefauthors}Tian, F\BHBIB., Wang, Y., Liu, H.\BCBL \BBA Zhang, Y. \APACrefYearMonthDay2018. \BBOQ\APACrefatitleThe lattice Boltzmann method and its applications in complex flows and fluid–structure interactions The lattice Boltzmann method and its applications in complex flows and fluid–structure interactions.\BBCQ \APACjournalVolNumPagesProceedings of the Institution of Mechanical Engineers, Part C: Journal of Mechanical Engineering Science2323403–404. {APACrefDOI} 10.1177/0954406218754913 \PrintBackRefs\CurrentBib
- Tomboulides \BBA Orszag (\APACyear2000) \APACinsertmetastarTomboulides2000{APACrefauthors}Tomboulides, A\BPBIG.\BCBT \BBA Orszag, S\BPBIA. \APACrefYearMonthDay2000. \BBOQ\APACrefatitleNumerical investigation of transitional and weak turbulent flow past a sphere Numerical investigation of transitional and weak turbulent flow past a sphere.\BBCQ \APACjournalVolNumPagesJournal of Fluid Mechanics41645–73. {APACrefDOI} 10.1017/S0022112000008880 \PrintBackRefs\CurrentBib
- Waldvogel (\APACyear1974) \APACinsertmetastarWaldvogel1974{APACrefauthors}Waldvogel, A. \APACrefYearMonthDay1974. \BBOQ\APACrefatitleThe N0 Jump of Raindrop Spectra The N0 Jump of Raindrop Spectra.\BBCQ \APACjournalVolNumPagesJournal of the Atmospheric Sciences3141067-1078. {APACrefDOI} 10.1175/1520-0469(1974)031¡1067:TJORS¿2.0.CO;2 \PrintBackRefs\CurrentBib
- Wang \BOthers. (\APACyear2016) \APACinsertmetastarWang2016{APACrefauthors}Wang, J., Krejci, R., Giangrande, S., Kuang, C., Barbosa, H\BPBIM\BPBIJ., Brito, J.\BDBLMartin, S\BPBIT. \APACrefYearMonthDay2016. \BBOQ\APACrefatitleAmazon boundary layer aerosol concentration sustained by vertical transport during rainfall Amazon boundary layer aerosol concentration sustained by vertical transport during rainfall.\BBCQ \APACjournalVolNumPagesNature (London)5397629. {APACrefDOI} 10.1038/nature19819 \PrintBackRefs\CurrentBib
- Yuan \BOthers. (\APACyear2010) \APACinsertmetastarYuan2010{APACrefauthors}Yuan, T., Martins, J\BPBIV., Li, Z.\BCBL \BBA Remer, L\BPBIA. \APACrefYearMonthDay2010. \BBOQ\APACrefatitleEstimating glaciation temperature of deep convective clouds with remote sensing data Estimating glaciation temperature of deep convective clouds with remote sensing data.\BBCQ \APACjournalVolNumPagesGeophysical Research Letters378. {APACrefDOI} 10.1029/2010GL042753 \PrintBackRefs\CurrentBib