Present address: ]Northrop Grumman Corporation, Linthicum, Maryland 21090, USA
High-Fidelity Measurement of a Superconducting Qubit using an On-Chip Microwave Photon Counter
Abstract
We describe an approach to the high-fidelity measurement of a superconducting qubit using an on-chip microwave photon counter. The protocol relies on the transient response of a dispersively coupled measurement resonator to map the state of the qubit to “bright” and “dark” cavity pointer states that are characterized by a large differential photon occupation. Following this mapping, we photodetect the resonator using the Josephson Photomultipler (JPM), which transitions between classically distinguishable flux states when cavity photon occupation exceeds a certain threshold. Our technique provides access to the binary outcome of projective quantum measurement at the millikelvin stage without the need for quantum-limited preamplification and thresholding at room temperature. We achieve raw single-shot measurement fidelity in excess of 98% across multiple samples using this approach in total measurement times under 500 ns. In addition, we show that the backaction and crosstalk associated with our measurement protocol can be mitigated by exploiting the intrinsic damping of the JPM itself.
I Introduction
Fast, accurate state measurement is critical to the implementation of quantum error correction Fowler et al. (2012), and global optimization of a large-scale quantum processor demands minimization of physical resources required for qubit measurement McDermott et al. (2018). Prior work on the measurement of superconducting qubits has focused on suppression of errors through combined improvements in measurement speed Jeffrey et al. (2014); Walter et al. (2017); Heinsoo et al. (2018) and near-quantum-limited preamplification of the measurement signal Mutus et al. (2014); Macklin et al. (2015); however, the physical footprint of the superconducting amplifiers, nonreciprocal circuit elements, and heterodyne detectors required to implement high-fidelity amplifier-based qubit measurement represents a significant obstacle to scaling. There have been efforts to minimize the hardware overhead associated with qubit measurement using Josephson circulators and directional amplifiers Sliwa et al. (2015); Lecocq et al. (2017); Chapman et al. (2017); Thorbeck et al. (2017); Abdo et al. (2019), but the instantaneous bandwidths of these elements are at present too small to support multiplexed qubit measurement, the primary advantage of amplifier-based approaches Jeffrey et al. (2014); Heinsoo et al. (2018). In related work, state-of-the-art measurement efficiencies were achieved by directly embedding a qubit within a Josephson parametric amplifier Eddins et al. (2019); however, this approach is not amenable to integration with large-scale multiqubit arrays. While continued research in these directions is certainly essential, it is clear that there are major obstacles to be overcome.
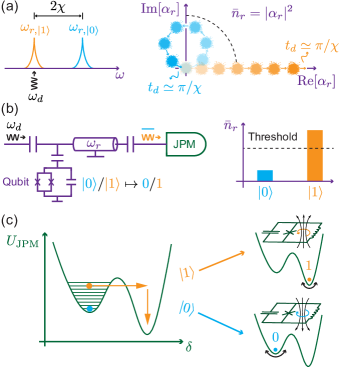
In this work, we pursue an alternative approach to the measurement of superconducting qubits based on integrated microwave photon counters. The measurement protocol relies on the transient response of a dispersively coupled linear resonator to map the state of the qubit onto “bright” and “dark” cavity pointer states characterized by a large differential photon occupation Blais et al. (2004); Govia et al. (2014) [Fig. 1(a)]. Following this mapping, we photodetect the resonator using the Josephson Photomultipler (JPM) Chen et al. (2011); Opremcak et al. (2018), which operates as a threshold detector of microwave photon occupation [Fig. 1(b)]. The JPM is based on a capacitively shunted rf Superconducting QUantum Interference Device (SQUID) with circuit parameters chosen to yield a double-well potential energy landscape Barone and Paternò (1982). JPM photodetection involves resonant transfer of energy from the bright pointer state of the readout cavity to the JPM mode, followed by a tunneling transition that changes the flux state of the JPM [Fig. 1(c)]; when the readout cavity is prepared in the dark state, no tunneling transition occurs. The flux state of the JPM represents a classical bit – the outcome of projective quantum measurement – that in principle can be accessed at the millikelvin stage, without the need for heterodyne detection and thresholding at room temperature. Without any fine tuning of qubit or JPM parameters, we achieve raw single shot measurement fidelities (uncorrected for qubit relaxation and initialization errors) in excess of 98% for total measurement times around 500 ns. While the current experiments involve chips comprising two qubits, each with its own dedicated JPM, the approach can be scaled to arbitrary system size, as the physical footprint of the JPM is well matched to the footprint of the qubit. JPM-based measurement requires at most one additional flux bias line per qubit channel, while greatly relaxing the physical resources needed downstream of the millikelvin stage.
This manuscript is organized as follows. In Section II, we discuss the design and characterization of our qubit-JPM circuit and provide a detailed description of the qubit measurement sequence. In Section III, we describe optimization of photon number contrast of the cavity pointer states with respect to resonator drive parameters. In Section IV, we analyze the performance of the JPM-based measurement protocol and present a detailed fidelity budget. In addition, we discuss the long-term stability of the measurement and demonstrate the robustness of our protocol with respect to device-to-device variation. In Section V, we discuss backaction and measurement crosstalk, and we demonstrate that intrinsic damping of the JPM itself is a resource that can be exploited to suppress initialization and crosstalk errors. In addition, we explore the degradation of measurement fidelity as the measurement cycle time is pushed below 10 s. Finally, in Section VI, we conclude and discuss prospects for the construction of a scalable quantum-to-classical interface at millikelvin temperatures.
II Circuit Design and Bring-up
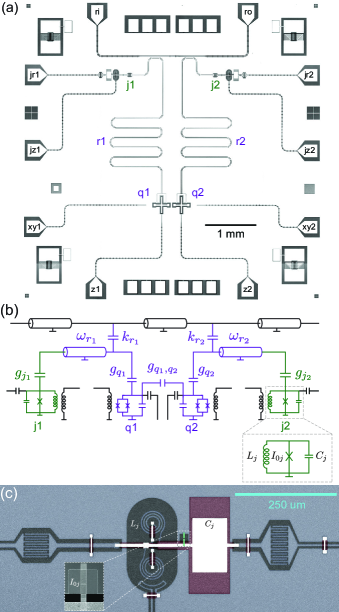
Our circuit consists of two coupled qubit-JPM systems integrated onto a single silicon chip as shown in the micrograph of Fig. 2(a). The circuit schematic is shown in Fig. 2(b), which introduces notation that will be used throughout the text. In this section, we report the parameters of qubit-JPM pair q1-j1 on chip #1; parameters for the other qubit-JPM pairs can be found in Table 4. For information about sample fabrication and control wiring, see Appendices A and B, respectively.
The qubit-JPM system incorporates a frequency-tunable transmon that is dispersively coupled to a half-wave coplanar waveguide (CPW) measurement resonator Wallraff et al. (2005); Koch et al. (2007); Barends et al. (2013) with bare frequency and qubit-resonator coupling strength . The total energy decay rate of the measurement resonator , which is approximately two orders of magnitude smaller than that for a typical Purcell-filtered design Jeffrey et al. (2014); Walter et al. (2017); Heinsoo et al. (2018). The transmon has a maximum transition frequency and an anharmonicity . To avoid Purcell suppression of the qubit energy relaxation time Houck et al. (2008), we operate at qubit frequencies below , which corresponds to a Purcell limit to qubit of . We remark on a distinct advantage of our approach to qubit measurement compared to amplifier-based implementations: by reading out the measurement resonator with the JPM, we avoid the usual tradeoff between measurement speed and Purcell limit to , as coupling of the measurement resonator to its readout environment can be tuned over a broad range on nanosecond timescales by appropriate variation of the JPM bias point. In principle, the value of can be made arbitrarily small without affecting the measurement speed; as a practical matter, however, a balance must be struck to ensure that the power delivered to the measurement resonator is sufficient for creation of the bright pointer state.
At the opposite voltage antinode, the measurement resonator is capacitively coupled to the JPM with coupling strength . This coupling strength is optimal, as it corresponds to a half-swap period and is thus compatible with GS/s waveform generation and comparable to the energy relaxation time of the JPM . The JPM circuit is formed by the parallel combination of a 3+3-turn gradiometric loop with inductance , a parallel-plate capacitance , and a single Al-AlO-Al Josephson junction with critical current [see Fig. 2(b, c)]. The plasma frequency of the JPM is tunable with external flux from 4 to 7.3 GHz, allowing for both resonant and far-detuned interactions with the measurement resonator. To retrieve qubit measurement results from the JPM, the circuit is read out in reflection using the capacitively coupled readout port labeled jr1(2) in Fig. 2(a). The two metastable flux states of the JPM correspond to distinct plasma frequencies; therefore, microwave reflectometry in the vicinity of these resonances encodes the JPM flux onto the amplitude and phase of the reflected signal.
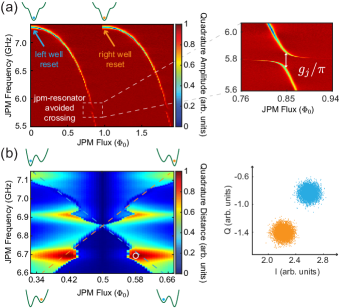
Device bring-up begins with JPM spectroscopy versus external flux, which yields the locations of the reset bias points that initialize the JPM in the left and right wells of its double-well potential along with the JPM-resonator avoided level crossing [see Fig. 3(a)]. Next, we maximize contrast of JPM reflectometry for states prepared in the left and right wells over the space of JPM readout flux, measurement frequency, and JPM drive power [Fig. 3(b)]. Using optimized parameters, the fidelity with which we read out the flux state of the JPM is better than 99.99%. In the following, we always initialize the JPM in the left well of its potential and refer to the probability of a transition to the right well as the tunneling probability.
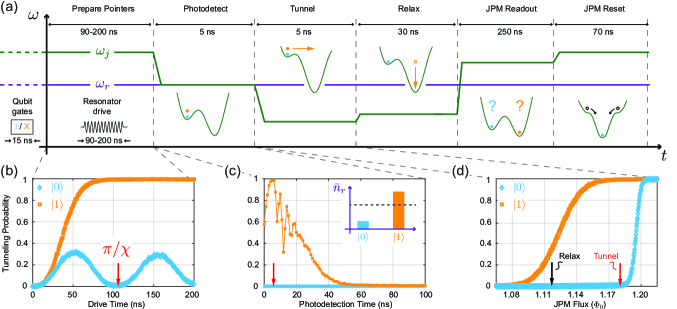
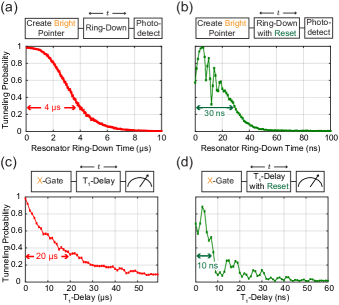
A timing diagram of the qubit measurement sequence is shown in Fig. 4(a); the cartoon insets depict the evolution of the JPM phase particle during critical steps of the measurement sequence. The duration of each step is indicated at the top of each panel; for clarity, the time axis is not drawn to scale. During qubit operations prior to measurement, the JPM is biased at its flux-insensitive upper sweet spot to minimize JPM-induced damping of the measurement resonator. We prepare the target qubit state by applying the -gate (-gate); to achieve high-fidelity single-qubit gates, we implement fast (15 ns-long) cosine-shaped derivative reduction by adiabatic gate (DRAG) pulses with a static detuning correction Motzoi et al. (2009); Lucero et al. (2010); Chen et al. (2016). At the start of the measurement sequence, microwave drive at frequency is used to prepare the bright (dark) pointer state. In Fig. 4(b), we show the time evolution of optimized pointer states as detected by the JPM (see Section III for methods); the resonator drive time for the datasets shown in Fig. 4(c, d). Next, the JPM is biased into resonance with the measurement resonator to induce intrawell excitations of the phase particle conditioned on the qubit state Hofheinz et al. (2008). The energy transferred into the JPM is maximal for a photodetection time of [Fig. 4(c)]. This timescale is independent of the photon occupation in the resonator, as one expects for coupled harmonic systems: at the JPM-resonator avoided level crossing, the left well of the JPM supports approximately 50 bound states. Immediately following photodetection, the JPM is biased towards the critical flux at which the shallow minimum in the potential energy landscape vanishes in order to induce interwell tunneling of excited states [Fig. 4(d)] Cooper et al. (2004). The duration and amplitude of this bias pulse are chosen to maximize tunneling contrast between qubit excited and ground states; the optimal tunnel bias point is indicated by the red arrow in Fig. 4(d). We then adjust the JPM bias to the location indicated by the black arrow in Fig. 4(d) to allow the tunneled phase particle to relax for 30 ns. Without this step, a small fraction () of the tunneled population migrates back into the left well, resulting in a degradation of measurement fidelity. To retrieve the qubit measurement results, we read out the JPM state using the methods discussed in Fig. 3(b). Finally, the JPM is reset into the left-well state for use in subsequent experiments.
III Pointer State Preparation
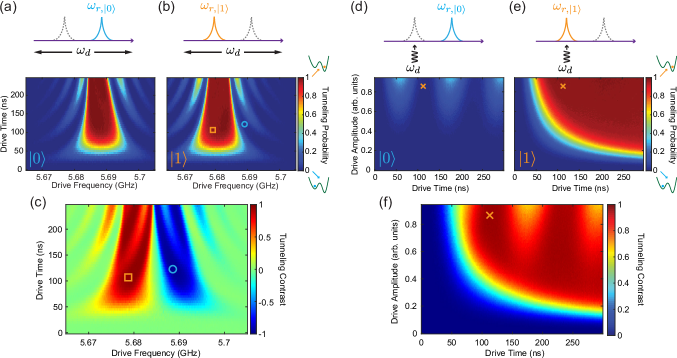
The success of our measurement protocol hinges on our ability to create high-contrast microwave cavity pointer states conditioned on the state of the qubit [see Fig. 1]. To achieve this experimentally, we need to determine the optimal resonator drive frequency, time, and amplitude. To optimize pointer state preparation, we begin with two-dimensional scans of the resonator with sweeps of both drive frequency and time, as shown in Fig. 5(a, b). Both datasets are taken over identical ranges and differ only in the prepared qubit state. The cartoons above each plot indicate that we are scanning over a range of frequencies containing both dressed resonances of the cavity, with the dressed resonance corresponding to the prepared qubit state drawn using a solid line. Optimal measurement contrast is achieved at drive parameters that maximize the difference in tunneling probability for the prepared qubit states and [Fig. 5(c)]; the optimal parameters correspond roughly to cavity drive at frequency (overlaid squares) and (overlaid circles) for a duration . Slight deviation of the optimal drive frequency from the two dressed cavity resonance frequencies and of the optimal drive time from can be understood as the result of nonlinearity of the measurement resonator inherited from the qubit; this nonlinearity similarly limits the size of the bright pointer state that can be created with a naive cavity ringup pulse applied at fixed frequency. As the dressed cavity resonance corresponding to qubit disperses less strongly with power than the resonance corresponding to qubit , we achieve best measurement fidelity with cavity drive , meaning that the qubit () state is mapped onto the bright (dark) cavity pointer state.
Next, we perform two-dimensional scans of the resonator with sweeps of both drive amplitude and time, as shown in Fig. 5(d, e). The cartoons above each plot indicate the frequency of the cavity drive with respect to the dressed cavity resonances. Taking the difference between these scans yields the optimal drive amplitude and time as shown in Fig. 5(f). Scans of type Fig. 5(a, b) and Fig. 5(d, e) are repeated iteratively to optimize single-shot measurement fidelity over the space of resonator drive time, frequency, and amplitude, with the final results displayed in Fig. 4(b). This method converges on a drive frequency that is detuned from , leading to a decrease in the resonator drive time as compared to . The bright pointer state corresponds to a mean resonator occupation , determined via the ac Stark effect (see Appendix C for further detail). Ultimately, photon number contrast is limited by imperfect preparation of the dark pointer state: as occupation of the dark pointer becomes comparable to the critical photon number Blais et al. (2004), the nonlinearity of the resonator prevents coherent oscillation back to the vacuum state Khezri et al. (2016); Khezri and Korotkov (2017), contributing an infidelity around 0.6% (see discussion in the next section). We expect that it will be straightforward to suppress this source of infidelity by a slightly more complicated ringup sequence involving either composite pulses or a chirped frequency drive.
IV Measurement Fidelity

We analyze the performance of JPM-based measurement in terms of the fidelity
| (1) |
where is the probability of measuring the qubit in state given that it was nominally prepared in state Gambetta et al. (2007); here, detection of a tunneling transition from the left well to the right well of the JPM constitutes measurement of the qubit state, while the absence of a tunneling transition constitutes measurement of qubit . Using the measurement sequence described in Fig. 4, we perform a standard Rabi experiment to identify values for and as shown in Fig. 6(a); assuming that leakage errors are negligible, we have . In order to faithfully estimate the conditional probabilities , the measurement sequence is repeated 5,000 times. Prior to each measurement, an active qubit reset step is performed to extract unwanted excess population from the qubit (see Appendix E for further detail); without this step, the excess state population of our qubits is approximately .
To characterize the long-term stability of JPM-based measurement, we perform 20,000 independent determinations of evenly spaced over the span of twelve hours; the results are shown in the histogram of Fig. 6(b). We achieve an average raw measurement fidelity , uncorrected for state preparation, relaxation, or gate errors. A detailed budget of measurement infidelity is shown in Table 1. The nonvanishing contains contributions both from qubit initialization errors and from imperfect dark pointer state preparation. Using the methods described in Appendix D, we infer an excess population of 0.3% following active qubit reset. This initialization infidelity degrades both and , contributing an overall infidelity of 0.6% to our measurement. We attribute the remaining portion of to imperfect dark pointer state preparation, for which we obtain 0.6%. Nonvanishing contains additional contributions from qubit relaxation and -gate error. Qubit relaxation with timescale = 16.9 s contributes an infidelity = 0.3%, where = 105 ns is the drive time for pointer state preparation. Finally, we use interleaved randomized benchmarking (IRB) Magesan et al. (2012) to characterize the infidelity of our -gate, for which we find 0.1%.
We have characterized measurement fidelity for system q1-j1 on chip #1 over a range of qubit operating points, corresponding to a range of optimal resonator drive times from 90-200 ns; results are shown in rows 1-4 of Table 2. For all experiments, we maintain the same readout parameters calibrated at the initial qubit bringup point GHz, apart from the resonator drive frequency and the resonator drive time, which must be matched to . We maintain similar performance across all four qubit frequencies. This demonstrates that fine-tuning of JPM bias parameters is not needed to address qubits that resonate over a broad range of frequencies.
While the above results were obtained for the single qubit-JPM pair q1-j1 on chip #1, we observe similar performance for the three other qubit-JPM pairs that we have examined; measurement fidelities for these devices are reported in rows 5-7 of Table 2. The durations of the flux bias parameters determined from our bring-up of pair q1-j1 on chip #1 were used for all remaining qubit-JPM pairs, without full optimization of each separate qubit-JPM system. The raw single-shot measurement fidelity averaged over the four qubit-JPM pairs is 98%.
| Source of Infidelity | Infidelity | Calculation Method |
|---|---|---|
| Excess population | 0.6% | low power drive |
| Imperfect dark pointer | 0.6% | high power drive |
| Qubit relaxation | 0.3% | |
| -gate | 0.1% | IRB Magesan et al. (2012) |
| Chip # | Qubit-JPM Pair | (GHz) | Resonator Drive Time | Measurement Fidelity |
|---|---|---|---|---|
| 1 | q1-j1 | 5.037 | 105 ns | 98.4% |
| 1 | q1-j1 | 5.098 | 90 ns | 98.3% |
| 1 | q1-j1 | 4.980 | 150 ns | 97.1% |
| 1 | q1-j1 | 4.833 | 200 ns | 98.1% |
| 1 | q2-j2 | 5.069 | 147 ns | 98.0% |
| 2 | q1-j1 | 5.068 | 128 ns | 97.6% |
| 2 | q2-j2 | 5.062 | 163 ns | 98.3% |
V Backaction and Crosstalk
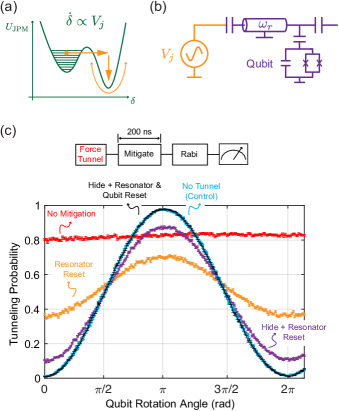
JPM tunneling events deposit an energy of order 100 photons on chip as the phase particle relaxes to the global minimum of the potential McDermott et al. (2005); Opremcak et al. (2018) [see Fig. 7(a)]. The associated transient contains spectral components at the frequencies of the readout resonator and the qubit, and as a result can transfer energy to these modes [Fig. 7(b)]. It is therefore critical to characterize the backaction and crosstalk associated with JPM tunneling events.
We begin with a study of JPM-induced backaction using the Rabi experiment described in Fig. 7(c). Prior to the qubit drive pulse, we force a tunneling event in the JPM and perform a deterministic reset of the JPM in the left well. In the absence of mitigation, the Rabi scan yields a nearly constant tunneling probability of 80% as a function of the qubit rotation angle, indicating severe corruption of the qubit and the readout resonator by the JPM tunneling event. Next, we perform JPM-assisted resonator reset prior to the Rabi experiment as a potential mitigation strategy. Namely, we bias the JPM into resonance with the readout cavity for 100 ns as a means to deplete the cavity of photons released by the JPM tunneling event Opremcak et al. (2018). With resonator reset, we recover Rabi oscillations with low visibility . In a further refinement, we adjust the bias point of the qubit during the JPM tunneling event from 5.1 GHz down to 4.4 GHz in order to minimize the spectral content of the tunneling transient at the qubit frequency; we refer to this as a hide bias step. By concatenating the hide bias step with resonator reset, we obtain a Rabi visibility . Finally, we append a JPM-assisted qubit reset step to the end of the mitigation sequence. With full mitigation, we recover all but 0.2% of the measurement fidelity compared to the situation with no forced JPM tunneling event. The resonator and qubit reset steps take a combined time of 200 ns (see Appendix E).
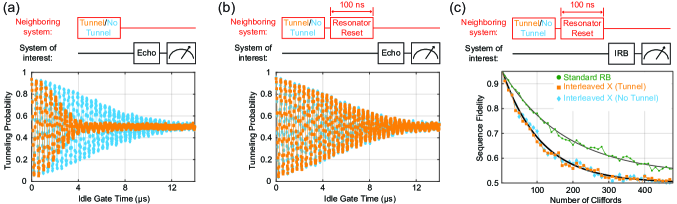
We characterize JPM-induced crosstalk to the unmeasured qubit by performing a spin-echo experiment on one qubit following a forced JPM tunneling event on the neighboring qubit-JPM pair [see Fig. 8(a)]. We use spin-echo to probe qubit coherence as opposed to a conventional Ramsey experiment in order to suppress the contribution to dephasing from low-frequency magnetic flux noise Martinis et al. (2003); Bylander et al. (2011); Hutchings et al. (2017). We measure a factor of 2.6 reduction in the Gaussian decay time of the spin-echo fringes with respect to our control experiment 111The spin-echo decay envelope obtained from modeling photon shot noise dephasing using our circuit parameters is well described by a Gaussian function of the idle gate time, indicating the presence of unwanted crosstalk between systems. We speculate that the enhanced dephasing is due to spurious photon occupation in the measurement resonator of the tunneled JPM, leading to photon shot noise dephasing of the neighboring qubit via parasitic coupling Sears et al. (2012); Yan et al. (2016, 2018). To test this hypothesis, we add a resonator reset step following the forced tunneling event as shown in Fig. 8(b). With resonator reset, we recover identical spin-echo fringes with respect to the control experiment. To confirm that resonator reset fully mitigates crosstalk of the JPM-based measurement, we use IRB to quantify single-qubit gate error with and without a prior forced JPM tunneling event in the neighboring qubit-JPM system [Fig. 8(c)] Magesan et al. (2012). With resonator reset following the JPM tunneling event, we measure identical interleaved gate fidelities for the tunnel and no tunnel cases, as summarized in Table 3.
| Interleaved Gate | Gate Fidelity (Tunnel) | Gate Fidelity (No Tunnel) |
|---|---|---|
| 99.8 0.3% | 99.8 0.2% | |
| 99.9 0.3% | 99.9 0.2% | |
| 99.9 0.1% | 99.9 0.1% |
To implement a practical error-corrected superconducting quantum computer based on the two-dimensional surface code, measurement repetition rates of order will be required Andersen et al. (2019, 2020). For this reason, we analyze the dependence of JPM-based measurement fidelity on the time between experiments using the measurement sequence depicted in Fig. 9(a). We find that as the time between experiments decreases, the fidelity with which we detect the bright pointer state degrades, with a characteristic time for recovery of fidelity of 13 s [see Fig. 9(b)]. We speculate that the degradation in fidelity is due to enhanced loss in both the qubit and the JPM at high measurement repetition rates. To separately examine the contributions of the JPM and the qubit to the loss of fidelity, we switch the roles of the bright and dark pointer states as shown in Fig. 9(c). With the qubit state mapped to the dark cavity pointer, the measurement fidelity is insensitive to enhanced loss in the JPM, since an elevated JPM relaxation rate would preserve the correct outcome for measurement of the dark pointer state (namely, no tunneling event). However, in this case we do see enhanced for measurement duty cycles below 5 s, indicating a contribution to infidelity either from enhanced qubit relaxation or from qubit initialization errors. Similarly, when we map the qubit state to the bright cavity pointer, the tunneling probability is insensitive to qubit loss and dominated by enhanced loss in the JPM element that prevents mapping of the bright pointer state to a tunneling event. We conclude that the enhanced measurement infidelity observed at high repetition rate is dominated by loss in the JPM, with a small contribution from increased qubit errors at the highest repetition rates kHz. While the physics that drives this degradation in fidelity is not presently understood, we speculate that the enhanced loss in both the qubit and the JPM is mediated by the transfer of energy released in the tunneling event to nonequilibrium quasiparticles Lenander et al. (2011); Wenner et al. (2013) or to dielectric two-level states (TLS) in the lossy bulk oxides of the JPM or in the surface oxides of the qubit. Possible mitigation strategies to preserve measurement fidelity at repetition rates approaching 1 MHz include incorporation of quasiparticle traps into the circuit Patel et al. (2017); Riwar and Catelani (2019) or a modification of the JPM energy landscape to reduce the energy released by the tunneling event.

VI Conclusion
We have developed and characterized a fast, accurate state measurement technique for superconducting qubits using on-chip microwave photon counters. Our technique provides access to the binary result of projective quantum measurement at the millikelvin stage of a dilution refrigerator; furthermore, it eliminates the need for nonreciprocal circuit components between the qubit and the measurement apparatus Opremcak et al. (2018). While our achieved raw single-shot measurement fidelity already compares favorably with the current state of the art Arute et al. (2019), straightforward improvements in pointer state preparation and suppression of qubit relaxation and initialization errors should push raw single-shot measurement fidelity beyond 99%. Our study of achievable measurement repetition rate revealed an anomalous source of loss associated with JPM tunneling events; this topic merits further investigation. We anticipate that straightforward modifications to our circuit design will provide a path to higher measurement repetition rates.
The physical footprint of the JPM is well matched to the dimensions of the qubit, so that it would be straightforward to integrate a single JPM element with every qubit in a large-scale multiqubit processor; in such an architecture, each cell in the array would require one additional flux bias line for JPM control. Microwave-based readout of the classical flux state of the JPM is amenable to multiplexing for the efficient measurement of large multiqubit arrays with low hardware overhead; alternatively, it is possible to encode the flux state of the JPM in a propagating fluxon Herr et al. (2007); Fedorov et al. (2014); Howington et al. (2019) that could then be passed to a proximal classical Josephson digital circuit for error monitoring of the qubit array, postprocessing of the measurement results, and low-latency feedback. Combined with digital approaches to coherent control McDermott and Vavilov (2014); Leonard et al. (2019), this approach to measurement could form the basis for a scalable quantum–classical interface for next-generation superconducting qubit arrays McDermott et al. (2018).
Acknowledgements.
We thank Mostafa Khezri, Zijun Chen, Ofer Naaman, and John Martinis for stimulating discussions. We thank Tom McJunkin for assistance with device imaging. Portions of this work were supported by Google. R.M and B.L.T.P acknowledge funding from the National Science Foundation under Grants QIS-1720304 and QIS-1720312, respectively. A.O. was additionally funded by NSF award DMR-1747426. The authors gratefully acknowledge use of facilities and instrumentation at the UW-Madison Wisconsin Centers for Nanoscale Technology (wcnt.wisc.edu), which is partially supported by the NSF through the University of Wisconsin Materials Research Science and Engineering Center (DMR-1720415).Appendix A Sample Fabrication
These samples were fabricated on a high-resistivity () silicon substrate with 100 crystal orientation. Prior to base layer deposition, the substrate is dipped in dilute (2%) hydrofluoric acid for one minute to remove native oxide from the surface. We then load the substrate into a dc magnetron sputter tool and deposit a 70 nm-thick film of Nb. The first patterning step defines all Nb features including the control wiring, measurement resonators, qubit capacitors, and spiral inductors. This pattern is then transferred into the Nb using an inductively coupled plasma etcher with Cl2/BCl3 chemistry. Next, we pattern the sample for liftoff and deposit the insulator used for crossover wiring and parallel-plate capacitors. The 180 nm-thick film of SiO2 is deposited using an electron beam evaporator at an oxygen partial pressure Torr. In the final photolithography step, we pattern the sample for counterelectrode liftoff. We then deposit a 200 nm-thick Al counterelectrode using an electron beam evaporator after performing an in situ ion mill clean to ensure good metallic contact to the base wiring layer. Finally, the JPM and qubit junctions are formed using a Dolan-bridge process Dolan (1977) involving an MMA/PMMA resist stack patterned using a 100 keV electron-beam writer. The Al-AlO-Al junctions are shadow evaporated in an electron beam evaporator following an in situ ion mill clean. This completes the device. Circuit parameters for the chip are listed in Table 4 with component labels indicated in Fig. 2(b).
Appendix B Measurement Setup
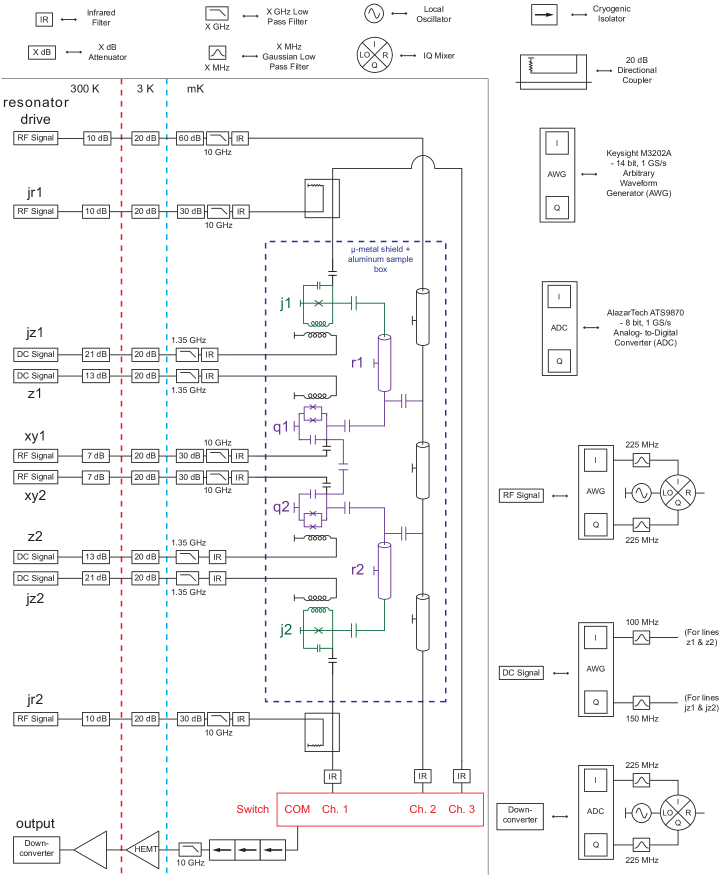
The wiring diagram for our measurement setup is shown in Fig. 13. The waveforms for JPM readout (jr1/2), qubit excitation (xy1/2), and resonator drive are generated via single sideband mixing. Keysight M3202A arbitrary waveform generators (AWGs; 14 bit, 1 GS/s) produce intermediate frequency (IF) signals that are mixed with a local oscillator (LO) to generate shaped pulses at microwave frequencies. The qubit and JPM flux-bias waveforms (z1/2 and jz1/2, respectively) are directly synthesized using the AWGs. Signal rise times on the jz1/2 waveforms are critical to the success of the qubit measurement sequence [see Fig. 4(a)]. The state of the JPM is read out in reflection using a directional coupler. The reflected signal is passed through several stages of isolation and filtering prior to amplification by a high electron mobility transistor (HEMT) amplifier at the 3 K stage of the cryostat. Following additional room temperature amplification, the signal is sent to the RF port of an IQ mixer where it is down converted and digitized using an AlazarTech ATS9870 analog-to-digital converter (ADC; 8 bit, 1 GS/s). Further signal processing and thresholding are performed in software in order to extract the amplitude and phase of the reflected signal. The fidelity with which we measure the flux state of the JPM is better than 99.99%; see Fig. 3(b).
Appendix C Stark Calibration
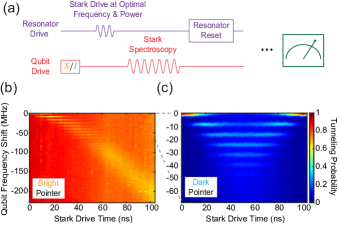
We use the ac Stark effect Schuster et al. (2005, 2007) to estimate photon occupation of the bright and dark pointer states; the pulse sequence is shown in Fig. 10(a). First, we prepare the qubit in () through the application of an -gate (-gate). Next, we drive the measurement resonator at the optimal frequency and power found in Fig. 5 but for a variable amount of time, populating the measurement cavity with a mean number of photons . At the end of the Stark drive, a low-power, 500 ns-long Stark spectroscopy pulse is applied to determine the qubit frequency shift . Because the photon lifetime in the readout cavity is relatively long , can be considered static on the timescale of the spectroscopy experiment. We then reset the resonator using the JPM to deplete the remaining photon occupation (see Appendix E). Finally, we measure the qubit using the sequence described in Fig. 4. The results are shown in Fig. 10(b, c). We find that the bright pointer state corresponds to a mean photon occupation of , where at the optimal drive time () and is the Stark shift per photon. Similarly, the dark pointer acquires a maximum photon occupation halfway through the drive pulse, but at the end of the resonator drive it returns to a state that is very close to vacuum. For this qubit operation point, the critical photon number . We note that these estimates of photon occupation neglect the effect of photon loss during the Stark spectroscopy pulse and the dependence of on .
Appendix D Fidelity Budget
The nonvanishing contains contributions both from qubit initialization errors and from imperfect dark pointer state preparation. In order to separately quantify these errors, we performed a series of measurements following active reset of the qubit with resonator drive amplitude swept from its optimal value down to zero [Fig. 11(a)]; for comparison with Fig. 10, the calibration described in that figure was performed at a drive amplitude of 0.885 arb. units. As a result, we can be sure that for drive amplitude 0.4 arb. units, the maximum photon occupation of the dark pointer is less than one photon, which is much less than over the entire course of driven evolution; at this level of cavity occupation, the dressed resonance corresponding to the qubit state is well approximated by a linear mode. Therefore, we can attribute all of the tunneling at low resonator drive amplitude to excess population alone, eliminating contributions caused by the Kerr nonlinearity of the resonator that occur at full drive strength. In Fig. 11(b, c), we show linear fits to the data of Fig. 11(a) for resonator drive amplitudes ranging between 0.25-0.4 arb. units. The ratio of the slopes extracted from these fits gives an estimate of excess population of 0.3% for nominal preparation of the state. We attribute the remaining contribution to to imperfect dark pointer preparation, with infidelity 0.6%.

Appendix E JPM-Assisted Resonator and Qubit Reset
The intrinsic damping of the JPM provides an efficient method for the rapid reset of the resonator and qubit modes. This is accomplished by simply biasing the JPM into resonance with the mode of interest for a brief period of time. The data shown in Fig. 12(a, b) demonstrate reset of the measurement resonator. In Fig. 12(a) we plot JPM tunneling probability following photodetection of the bright pointer state after a variable ring-down delay. We observe that passive resonator reset requires to complete, a consequence of the high- measurement resonator used in our design. To accelerate resonator reset, we bias the JPM into resonance with the measurement resonator during the ring-down delay, as shown in Fig. 12(b). With the JPM and resonator fully hybridized, the energy decay time of the mode is suppressed to around 10 ns, allowing for rapid on-demand depletion of the measurement resonator. We find that JPM-assisted resonator reset is accomplished in under 100 ns.
We extend this idea to qubit reset in the experiments described in Fig. 12(c, d). In each of these datasets, qubit occupation is measured after the application of an -gate followed by a variable delay. We find that passive reset based on qubit relaxation requires approximately 20 . However, when the JPM is biased into resonance with the qubit during reset, accurate qubit initialization is accomplished in under 100 ns. Throughout the experiments described in this manuscript, JPM-assisted qubit reset was used to suppress excess state population from a baseline value of 4% to 0.3%.
| Label | Description | Value | Method of Determination |
|---|---|---|---|
| JPM-resonator coupling strength for j1-r1 | 62 MHz | JPM spectroscopy versus flux | |
| JPM-resonator coupling strength for j2-r2 | 63 MHz | JPM spectroscopy versus flux | |
| Qubit-resonator coupling strength for q1-r1 | 90 MHz | Qubit and resonator spectroscopy | |
| Qubit-resonator coupling strength for q2-r2 | 92 MHz | Qubit and resonator spectroscopy | |
| Bare frequency for resonator r1 | 5.693 GHz | High power resonator spectroscopy with j1 maximally detuned | |
| Bare frequency for resonator r2 | 5.825 GHz | High power resonator spectroscopy with j2 maximally detuned | |
| Total energy decay rate of resonator r1 | 1/(1.53 s) | VNA measurements with j1 maximally detuned | |
| Total energy decay rate of resonator r2 | 1/(1.51 s) | VNA measurements with j2 maximally detuned | |
| Qubit-qubit coupling strength | 16 MHz | Qubit spectroscopy about the avoided level crossing (degeneracy at 5.1 GHz) | |
| Energy relaxation time of the JPM | 5 ns | VNA measurements with the JPM detuned from the resonator | |
| Geometric inductance of the JPM | 1.3 nH | JPM spectroscopy versus flux | |
| Self-capacitance of the JPM | 2.2 pF | JPM spectroscopy versus flux | |
| Reflection capacitor of the JPM | 33 fF | JPM spectroscopy versus flux | |
| Critical current of the JPM | 1.4 A | JPM spectroscopy versus flux and 4-wire resistance measurements of cofabricated test junctions | |
| Mutual inductance between the JPM and external bias circuitry | 4.8 pH | JPM spectroscopy versus flux | |
| Total critical current of the transmon dc SQUID loop | 43 nA | Qubit spectroscopy versus flux | |
| Mutual inductance between the qubit and external bias circuitry | 1.4 pH | Resonator spectroscopy versus qubit flux | |
| Qubit anharmonicity | -225 MHz | Qubit spectroscopy of the and transitions | |
| Qubit excitation capacitance | 40 aF | Sonnet simulation |
References
- Fowler et al. (2012) A. G. Fowler, M. Mariantoni, J. M. Martinis, and A. N. Cleland, Phys. Rev. A 86, 032324 (2012).
- McDermott et al. (2018) R. McDermott, M. G. Vavilov, B. L. T. Plourde, F. K. Wilhelm, P. J. Liebermann, O. A. Mukhanov, and T. A. Ohki, Quantum Sci. Technol. 3, 024004 (2018).
- Jeffrey et al. (2014) E. Jeffrey, D. Sank, J. Y. Mutus, T. C. White, J. Kelly, R. Barends, Y. Chen, Z. Chen, B. Chiaro, A. Dunsworth, A. Megrant, P. J. J. O’Malley, C. Neill, P. Roushan, A. Vainsencher, J. Wenner, A. N. Cleland, and J. M. Martinis, Phys. Rev. Lett. 112, 190504 (2014).
- Walter et al. (2017) T. Walter, P. Kurpiers, S. Gasparinetti, P. Magnard, A. Potočnik, Y. Salathé, M. Pechal, M. Mondal, M. Oppliger, C. Eichler, and A. Wallraff, Phys. Rev. Applied 7, 054020 (2017).
- Heinsoo et al. (2018) J. Heinsoo, C. K. Andersen, A. Remm, S. Krinner, T. Walter, Y. Salathé, S. Gasparinetti, J.-C. Besse, A. Potočnik, A. Wallraff, and C. Eichler, Phys. Rev. Applied 10, 034040 (2018).
- Mutus et al. (2014) J. Y. Mutus, T. C. White, R. Barends, Y. Chen, Z. Chen, B. Chiaro, A. Dunsworth, E. Jeffrey, J. Kelly, A. Megrant, C. Neill, P. J. J. O’Malley, P. Roushan, D. Sank, A. Vainsencher, J. Wenner, K. M. Sundqvist, A. N. Cleland, and J. M. Martinis, Appl. Phys. Lett. 104, 263513 (2014).
- Macklin et al. (2015) C. Macklin, K. O’Brien, D. Hover, M. E. Schwartz, V. Bolkhovsky, X. Zhang, W. D. Oliver, and I. Siddiqi, Science 350, 307 (2015).
- Sliwa et al. (2015) K. M. Sliwa, M. Hatridge, A. Narla, S. Shankar, L. Frunzio, R. J. Schoelkopf, and M. H. Devoret, Phys. Rev. X 5, 041020 (2015).
- Lecocq et al. (2017) F. Lecocq, L. Ranzani, G. A. Peterson, K. Cicak, R. W. Simmonds, J. D. Teufel, and J. Aumentado, Phys. Rev. Applied 7, 024028 (2017).
- Chapman et al. (2017) B. J. Chapman, E. I. Rosenthal, J. Kerckhoff, B. A. Moores, L. R. Vale, J. A. B. Mates, G. C. Hilton, K. Lalumière, A. Blais, and K. W. Lehnert, Phys. Rev. X 7, 041043 (2017).
- Thorbeck et al. (2017) T. Thorbeck, S. Zhu, E. Leonard, R. Barends, J. Kelly, J. M. Martinis, and R. McDermott, Phys. Rev. Applied 8, 054007 (2017).
- Abdo et al. (2019) B. Abdo, N. T. Bronn, O. Jinka, S. Olivadese, A. D. Córcoles, V. P. Adiga, M. Brink, R. E. Lake, X. Wu, D. P. Pappas, and J. M. Chow, Nat. Commun. 10, 3154 (2019).
- Eddins et al. (2019) A. Eddins, J. M. Kreikebaum, D. M. Toyli, E. M. Levenson-Falk, A. Dove, W. P. Livingston, B. A. Levitan, L. C. G. Govia, A. A. Clerk, and I. Siddiqi, Phys. Rev. X 9, 011004 (2019).
- Blais et al. (2004) A. Blais, R.-S. Huang, A. Wallraff, S. M. Girvin, and R. J. Schoelkopf, Phys. Rev. A 69, 062320 (2004).
- Govia et al. (2014) L. C. G. Govia, E. J. Pritchett, C. Xu, B. L. T. Plourde, M. G. Vavilov, F. K. Wilhelm, and R. McDermott, Phys. Rev. A 90, 062307 (2014).
- Chen et al. (2011) Y.-F. Chen, D. Hover, S. Sendelbach, L. Maurer, S. T. Merkel, E. J. Pritchett, F. K. Wilhelm, and R. McDermott, Phys. Rev. Lett. 107, 217401 (2011).
- Opremcak et al. (2018) A. Opremcak, I. V. Pechenezhskiy, C. Howington, B. G. Christensen, M. A. Beck, E. Leonard, J. Suttle, C. Wilen, K. N. Nesterov, G. J. Ribeill, T. Thorbeck, F. Schlenker, M. G. Vavilov, B. L. T. Plourde, and R. McDermott, Science 361, 1239 (2018).
- Barone and Paternò (1982) A. Barone and G. Paternò, Physics and Applications of the Josephson Effect (Wiley, 1982).
- Wallraff et al. (2005) A. Wallraff, D. I. Schuster, A. Blais, L. Frunzio, J. Majer, M. H. Devoret, S. M. Girvin, and R. J. Schoelkopf, Phys. Rev. Lett. 95, 060501 (2005).
- Koch et al. (2007) J. Koch, T. M. Yu, J. Gambetta, A. A. Houck, D. I. Schuster, J. Majer, A. Blais, M. H. Devoret, S. M. Girvin, and R. J. Schoelkopf, Phys. Rev. A 76, 042319 (2007).
- Barends et al. (2013) R. Barends, J. Kelly, A. Megrant, D. Sank, E. Jeffrey, Y. Chen, Y. Yin, B. Chiaro, J. Mutus, C. Neill, P. O’Malley, P. Roushan, J. Wenner, T. C. White, A. N. Cleland, and J. M. Martinis, Phys. Rev. Lett. 111, 080502 (2013).
- Houck et al. (2008) A. A. Houck, J. A. Schreier, B. R. Johnson, J. M. Chow, J. Koch, J. M. Gambetta, D. I. Schuster, L. Frunzio, M. H. Devoret, S. M. Girvin, and R. J. Schoelkopf, Phys. Rev. Lett. 101, 080502 (2008).
- Motzoi et al. (2009) F. Motzoi, J. M. Gambetta, P. Rebentrost, and F. K. Wilhelm, Phys. Rev. Lett. 103, 110501 (2009).
- Lucero et al. (2010) E. Lucero, J. Kelly, R. C. Bialczak, M. Lenander, M. Mariantoni, M. Neeley, A. D. O’Connell, D. Sank, H. Wang, M. Weides, J. Wenner, T. Yamamoto, A. N. Cleland, and J. M. Martinis, Phys. Rev. A 82, 042339 (2010).
- Chen et al. (2016) Z. Chen, J. Kelly, C. Quintana, R. Barends, B. Campbell, Y. Chen, B. Chiaro, A. Dunsworth, A. G. Fowler, E. Lucero, E. Jeffrey, A. Megrant, J. Mutus, M. Neeley, C. Neill, P. J. J. O’Malley, P. Roushan, D. Sank, A. Vainsencher, J. Wenner, T. C. White, A. N. Korotkov, and J. M. Martinis, Phys. Rev. Lett. 116, 020501 (2016).
- Hofheinz et al. (2008) M. Hofheinz, E. M. Weig, M. Ansmann, R. C. Bialczak, E. Lucero, M. Neeley, A. D. O’Connell, H. Wang, J. M. Martinis, and A. N. Cleland, Nature 454, 310 (2008).
- Cooper et al. (2004) K. B. Cooper, M. Steffen, R. McDermott, R. W. Simmonds, S. Oh, D. A. Hite, D. P. Pappas, and J. M. Martinis, Phys. Rev. Lett. 93, 180401 (2004).
- Khezri et al. (2016) M. Khezri, E. Mlinar, J. Dressel, and A. N. Korotkov, Phys. Rev. A 94, 012347 (2016).
- Khezri and Korotkov (2017) M. Khezri and A. N. Korotkov, Phys. Rev. A 96, 043839 (2017).
- Gambetta et al. (2007) J. Gambetta, W. A. Braff, A. Wallraff, S. M. Girvin, and R. J. Schoelkopf, Phys. Rev. A 76, 012325 (2007).
- Magesan et al. (2012) E. Magesan, J. M. Gambetta, B. R. Johnson, C. A. Ryan, J. M. Chow, S. T. Merkel, M. P. da Silva, G. A. Keefe, M. B. Rothwell, T. A. Ohki, M. B. Ketchen, and M. Steffen, Phys. Rev. Lett. 109, 080505 (2012).
- McDermott et al. (2005) R. McDermott, R. W. Simmonds, M. Steffen, K. B. Cooper, K. Cicak, K. D. Osborn, S. Oh, D. P. Pappas, and J. M. Martinis, Science 307, 1299 (2005).
- Martinis et al. (2003) J. M. Martinis, S. Nam, J. Aumentado, K. M. Lang, and C. Urbina, Phys. Rev. B 67, 094510 (2003).
- Bylander et al. (2011) J. Bylander, S. Gustavsson, F. Yan, F. Yoshihara, K. Harrabi, G. Fitch, D. G. Cory, Y. Nakamura, J.-S. Tsai, and W. D. Oliver, Nat. Phys. 7, 565 (2011).
- Hutchings et al. (2017) M. D. Hutchings, J. B. Hertzberg, Y. Liu, N. T. Bronn, G. A. Keefe, M. Brink, J. M. Chow, and B. L. T. Plourde, Phys. Rev. Applied 8, 044003 (2017).
- Note (1) The spin-echo decay envelope obtained from modeling photon shot noise dephasing using our circuit parameters is well described by a Gaussian function of the idle gate time.
- Sears et al. (2012) A. P. Sears, A. Petrenko, G. Catelani, L. Sun, H. Paik, G. Kirchmair, L. Frunzio, L. I. Glazman, S. M. Girvin, and R. J. Schoelkopf, Phys. Rev. B 86, 180504 (2012).
- Yan et al. (2016) F. Yan, S. Gustavsson, A. Kamal, J. Birenbaum, A. P. Sears, D. Hover, T. J. Gudmundsen, D. Rosenberg, G. Samach, S. Weber, J. L. Yoder, T. P. Orlando, J. Clarke, A. J. Kerman, and W. D. Oliver, Nat. Commun. 7, 12964 (2016).
- Yan et al. (2018) F. Yan, D. Campbell, P. Krantz, M. Kjaergaard, D. Kim, J. L. Yoder, D. Hover, A. Sears, A. J. Kerman, T. P. Orlando, S. Gustavsson, and W. D. Oliver, Phys. Rev. Lett. 120, 260504 (2018).
- Andersen et al. (2019) C. K. Andersen, A. Remm, S. Lazar, S. Krinner, J. Heinsoo, J.-C. Besse, M. Gabureac, A. Wallraff, and C. Eichler, npj Quantum Inf. 5, 69 (2019).
- Andersen et al. (2020) C. K. Andersen, A. Remm, S. Lazar, S. Krinner, N. Lacroix, G. J. Norris, M. Gabureac, C. Eichler, and A. Wallraff, Nature Physics 16, 875 (2020).
- Lenander et al. (2011) M. Lenander, H. Wang, R. C. Bialczak, E. Lucero, M. Mariantoni, M. Neeley, A. D. O’Connell, D. Sank, M. Weides, J. Wenner, T. Yamamoto, Y. Yin, J. Zhao, A. N. Cleland, and J. M. Martinis, Phys. Rev. B 84, 024501 (2011).
- Wenner et al. (2013) J. Wenner, Y. Yin, E. Lucero, R. Barends, Y. Chen, B. Chiaro, J. Kelly, M. Lenander, M. Mariantoni, A. Megrant, C. Neill, P. J. J. O’Malley, D. Sank, A. Vainsencher, H. Wang, T. C. White, A. N. Cleland, and J. M. Martinis, Phys. Rev. Lett. 110, 150502 (2013).
- Patel et al. (2017) U. Patel, I. V. Pechenezhskiy, B. L. T. Plourde, M. G. Vavilov, and R. McDermott, Phys. Rev. B 96, 220501 (2017).
- Riwar and Catelani (2019) R.-P. Riwar and G. Catelani, Phys. Rev. B 100, 144514 (2019).
- Arute et al. (2019) F. Arute, K. Arya, R. Babbush, D. Bacon, J. C. Bardin, R. Barends, R. Biswas, S. Boixo, F. G. S. L. Brandao, D. A. Buell, B. Burkett, Y. Chen, Z. Chen, B. Chiaro, R. Collins, W. Courtney, A. Dunsworth, E. Farhi, B. Foxen, A. Fowler, C. Gidney, M. Giustina, R. Graff, K. Guerin, S. Habegger, M. P. Harrigan, M. J. Hartmann, A. Ho, M. Hoffmann, T. Huang, T. S. Humble, S. V. Isakov, E. Jeffrey, Z. Jiang, D. Kafri, K. Kechedzhi, J. Kelly, P. V. Klimov, S. Knysh, A. Korotkov, F. Kostritsa, D. Landhuis, M. Lindmark, E. Lucero, D. Lyakh, S. Mandrà, J. R. McClean, M. McEwen, A. Megrant, X. Mi, K. Michielsen, M. Mohseni, J. Mutus, O. Naaman, M. Neeley, C. Neill, M. Y. Niu, E. Ostby, A. Petukhov, J. C. Platt, C. Quintana, E. G. Rieffel, P. Roushan, N. C. Rubin, D. Sank, K. J. Satzinger, V. Smelyanskiy, K. J. Sung, M. D. Trevithick, A. Vainsencher, B. Villalonga, T. White, Z. J. Yao, P. Yeh, A. Zalcman, H. Neven, and J. M. Martinis, Nature 574, 505 (2019).
- Herr et al. (2007) A. Herr, A. Fedorov, A. Shnirman, E. Il’ichev, and G. Schön, Supercond. Sci. Tech. 20, S450 (2007).
- Fedorov et al. (2014) K. G. Fedorov, A. V. Shcherbakova, M. J. Wolf, D. Beckmann, and A. V. Ustinov, Phys. Rev. Lett. 112, 160502 (2014).
- Howington et al. (2019) C. Howington, A. Opremcak, R. McDermott, A. Kirichenko, O. A. Mukhanov, and B. L. T. Plourde, IEEE Trans. Appl. Supercond. 29, 1 (2019).
- McDermott and Vavilov (2014) R. McDermott and M. G. Vavilov, Phys. Rev. Applied 2, 014007 (2014).
- Leonard et al. (2019) E. Leonard, M. A. Beck, J. Nelson, B. G. Christensen, T. Thorbeck, C. Howington, A. Opremcak, I. V. Pechenezhskiy, K. Dodge, N. P. Dupuis, M. D. Hutchings, J. Ku, F. Schlenker, J. Suttle, C. Wilen, S. Zhu, M. Vavilov, B. L. T. Plourde, and R. McDermott, Phys. Rev. Applied 11, 014009 (2019).
- Dolan (1977) G. J. Dolan, Appl. Phys. Lett. 31, 337 (1977).
- Schuster et al. (2005) D. I. Schuster, A. Wallraff, A. Blais, L. Frunzio, R.-S. Huang, J. Majer, S. M. Girvin, and R. J. Schoelkopf, Phys. Rev. Lett. 94, 123602 (2005).
- Schuster et al. (2007) D. I. Schuster, A. A. Houck, J. A. Schreier, A. Wallraff, J. M. Gambetta, A. Blais, L. Frunzio, J. Majer, B. Johnson, M. H. Devoret, S. M. Girvin, and R. J. Schoelkopf, Nature 445, 515 (2007).