Magnetic structure of a new quantum magnet SrCuTe2O6
Abstract
SrCuTe2O6 consists of a 3-dimensional arrangement of spin- Cu2+ ions. The 1st, 2nd and 3rd neighbor interactions respectively couple Cu2+ moments into a network of isolated triangles, a highly frustrated hyperkagome lattice consisting of corner sharing triangles and antiferromagnetic chains. Of these, the chain interaction dominates in SrCuTe2O6 while the other two interactions lead to frustrated inter-chain coupling giving rise to long range magnetic order at suppressed temperatures. In this paper, we investigate the magnetic properties in SrCuTe2O6 using muon relaxation spectroscopy and neutron diffraction and present the low temperature magnetic structure.
Interesting magnetic behaviour in Heisenberg spin systems originates from a network of some elementary motifs such as triangles or tetrahedra, where spins at their vertices interact with each other via antiferromagnetic (AF) interactions. The frustration in such systems often leads to exotic ground states such as spin liquids [1, 2] and spin ice states [3, 4] where long-range magnetic order (LRO) is suppressed to low temperatures or completely eliminated. In the case where order still occurs it can provide insights into the underlying physics and the new states arising from the frustration. There are many experimental examples for the three dimensional (3D) networks of corner-shared tetrahedra (pyrochlore [3, 4, 5] and spinel structures [6, 7]) such as Gd2Hf2O7 [8], 3D networks of corner-shared triangles are relatively less explored despite the expectation of novel ground states. The simplest possibility of the latter is known as a hyperkagome lattice and has been observed in the compound Na4Ir3O8 where every Ir2+ spin is involved in two triangles. Although initial studies suggested a highly frustrating magnetic lattice with QSL behaviour [9], a glassy magnetic ground state has been observed in the muon relaxation studies [10, 11].
PbCuTe2O6 is an example of a highly connected hyperkagome lattice, also known as the hyper-hyperkagome lattice, formed by the highly frustrated first and second nearest neighbour (NN) interactions between Cu2+ spins [12]. Experimental and theoretical studies of this compound reveal evidence for quantum spin liquid behaviour down to 20 mK, a rare observation in three dimensional magnetic lattices [13, 14, 12], confirming the strong frustration in the system. However, density functional theory calculations also suggest significant non-frustrated third and fourth NN magnetic interactions in PbCuTe2O6 whose role in the QSL phase diagram is less understood.
SrCuTe2O6 is a promising quantum magnet, iso-structural to PbCuTe2O6 , that can give insights into the hyper-hyperkagome frustration mechanism responsible for the QSL ground state. SrCuTe2O6 crystallizes in cubic symmetry at room temperature (space group P4132 [15]) with the magnetic spin- Cu2+ ions occupying a single Wyckoff site. The Cu2+ ions are coupled together by exchange interactions , and . These three interactions couple them into isolated equilateral triangles, a hyperkagome lattice and uniform chains (running parallel to the a, b and c axes) respectively. If these interactions are antiferromagnetic they can give rise to a frustrated network of spin- chains. DC susceptibility of SrCuTe2O6 yields a negative Curie-Weiss temperature of K revealing predominantly antiferromagnetic exchange interactions [16, 17], and shows a broad maximum at 32 K. This feature has been attributed to a one-dimensional spin- Heisenberg antiferromagnetic chain revealing K [16, 17] as the dominant interaction. However, two sharp features occur in the susceptibility at lower temperatures K and K, where a sharp -type anomaly is also observed in the heat capacity, indicating the onset of magnetic transitions in the system. These anomalies reveal non-negligible frustrated inter-chain coupling due to the finite and [16, 17]. In addition, the compound exhibits magneto-dielectric coupling at and [18] attributed to the non-centro-symmetric nature of the structural symmetry. Furthermore, specific heat, magnetization and dielectric constant measurements as a function of applied magnetic field reveal a complex phase diagram with an additional field induced phase [16, 17].
Although SrCuTe2O6 reveals interesting magneto-dielectric and magnetoelectric properties around the magnetic transitions, the origins of the magnetic order and the nature of the magnetic structure below the transition temperatures is not known. Here, we present the field-temperature phase diagram for three different directions of the single crystalline samples of SrCuTe2O6 that shed light on the magnetic properties of the compound. Further, we investigate the polycrystalline samples with muon spin resonance (SR) and neutron powder diffraction measurements and propose a model for the zero-field magnetic structure in the ordered state. The results reveal that the first neighbor triangle interaction provides the interchain coupling and is responsible for the long-range order in the system.
I Samples & Experimental Methods
| Atom |
|
x/a | y/a | z/a | Biso | ||
| Te | 24e | 0.33775 | 0.91970 | 0.05890 | 0.46001 | ||
| Sr1 | 8c | 0.05335 | 0.05335 | 0.05335 | 0.65537 | ||
| Sr2 | 4b | 0.87500 | 0.87500 | 0.87500 | 0.61456 | ||
| Cu | 12d | 0.12500 | 0.77446 | 0.02445 | 0.47196 | ||
| O1 | 24e | 0.57936 | 0.92944 | 0.37654 | 0.25773 | ||
| O2 | 24e | 0.26670 | 0.81156 | 0.97806 | 0.49215 | ||
| O3 | 24e | 0.22239 | 0.97760 | 0.12925 | 0.53796 |
Polycrystalline powder of SrCuTe2O6 was prepared from stoichiometric mixture of high purity powders of SrCO3 (99.99%), CuO (99.995%) and TeO2 (99.99%) by solid state reactions at 650∘C in a vacuum furnace under Argon flow. For crystal growth, first stoichiometric amounts of high purity SrCO3, CuO and TeO2 were mixed as above and sintered twice for 12 hours at 600∘C in Argon flow with intermediate grinding. Then a feed rod (diameter6 mm, length7-8 cm) was prepared from the stoichiometric powder and densified by pressing in a Cold Isostatic press in 2000 bars and subsequent sintering at 650∘C in Argon flow. Crystal growth was done using the feed-rod by the Floating zone technique in a four mirror type optical image furnace (Crystal Systems Corp., Japan). Growth was done at a rate of 1 mm/hr in Argon atmosphere at ambient pressure. The as-grown crystal is approximately 5 mm diameter and 3.5 cm in length. It was checked by X-ray Laue diffraction for single crystallinity and confirmed by polarized optical microscopy to be free of inclusions. The quality of the crystal has also been analyzed for phase purity by grinding a small piece of the crystal into powder upon which x-ray diffraction was performed. These single crystals reveal a small quantity of non-magnetic impurity in the form of Sr2Te3O8 amounting to less than 1%. The single crystals were then characterized by magnetic susceptibility, magnetization and heat capacity in the temperature range of 1.8400 K and an external field of 07 T using a Physical Property Measurement System (PPMS). The sample synthesis and characterization took place at the Core Lab for quantum Materials, Helmholz-Zentrum Berlin, Germany.
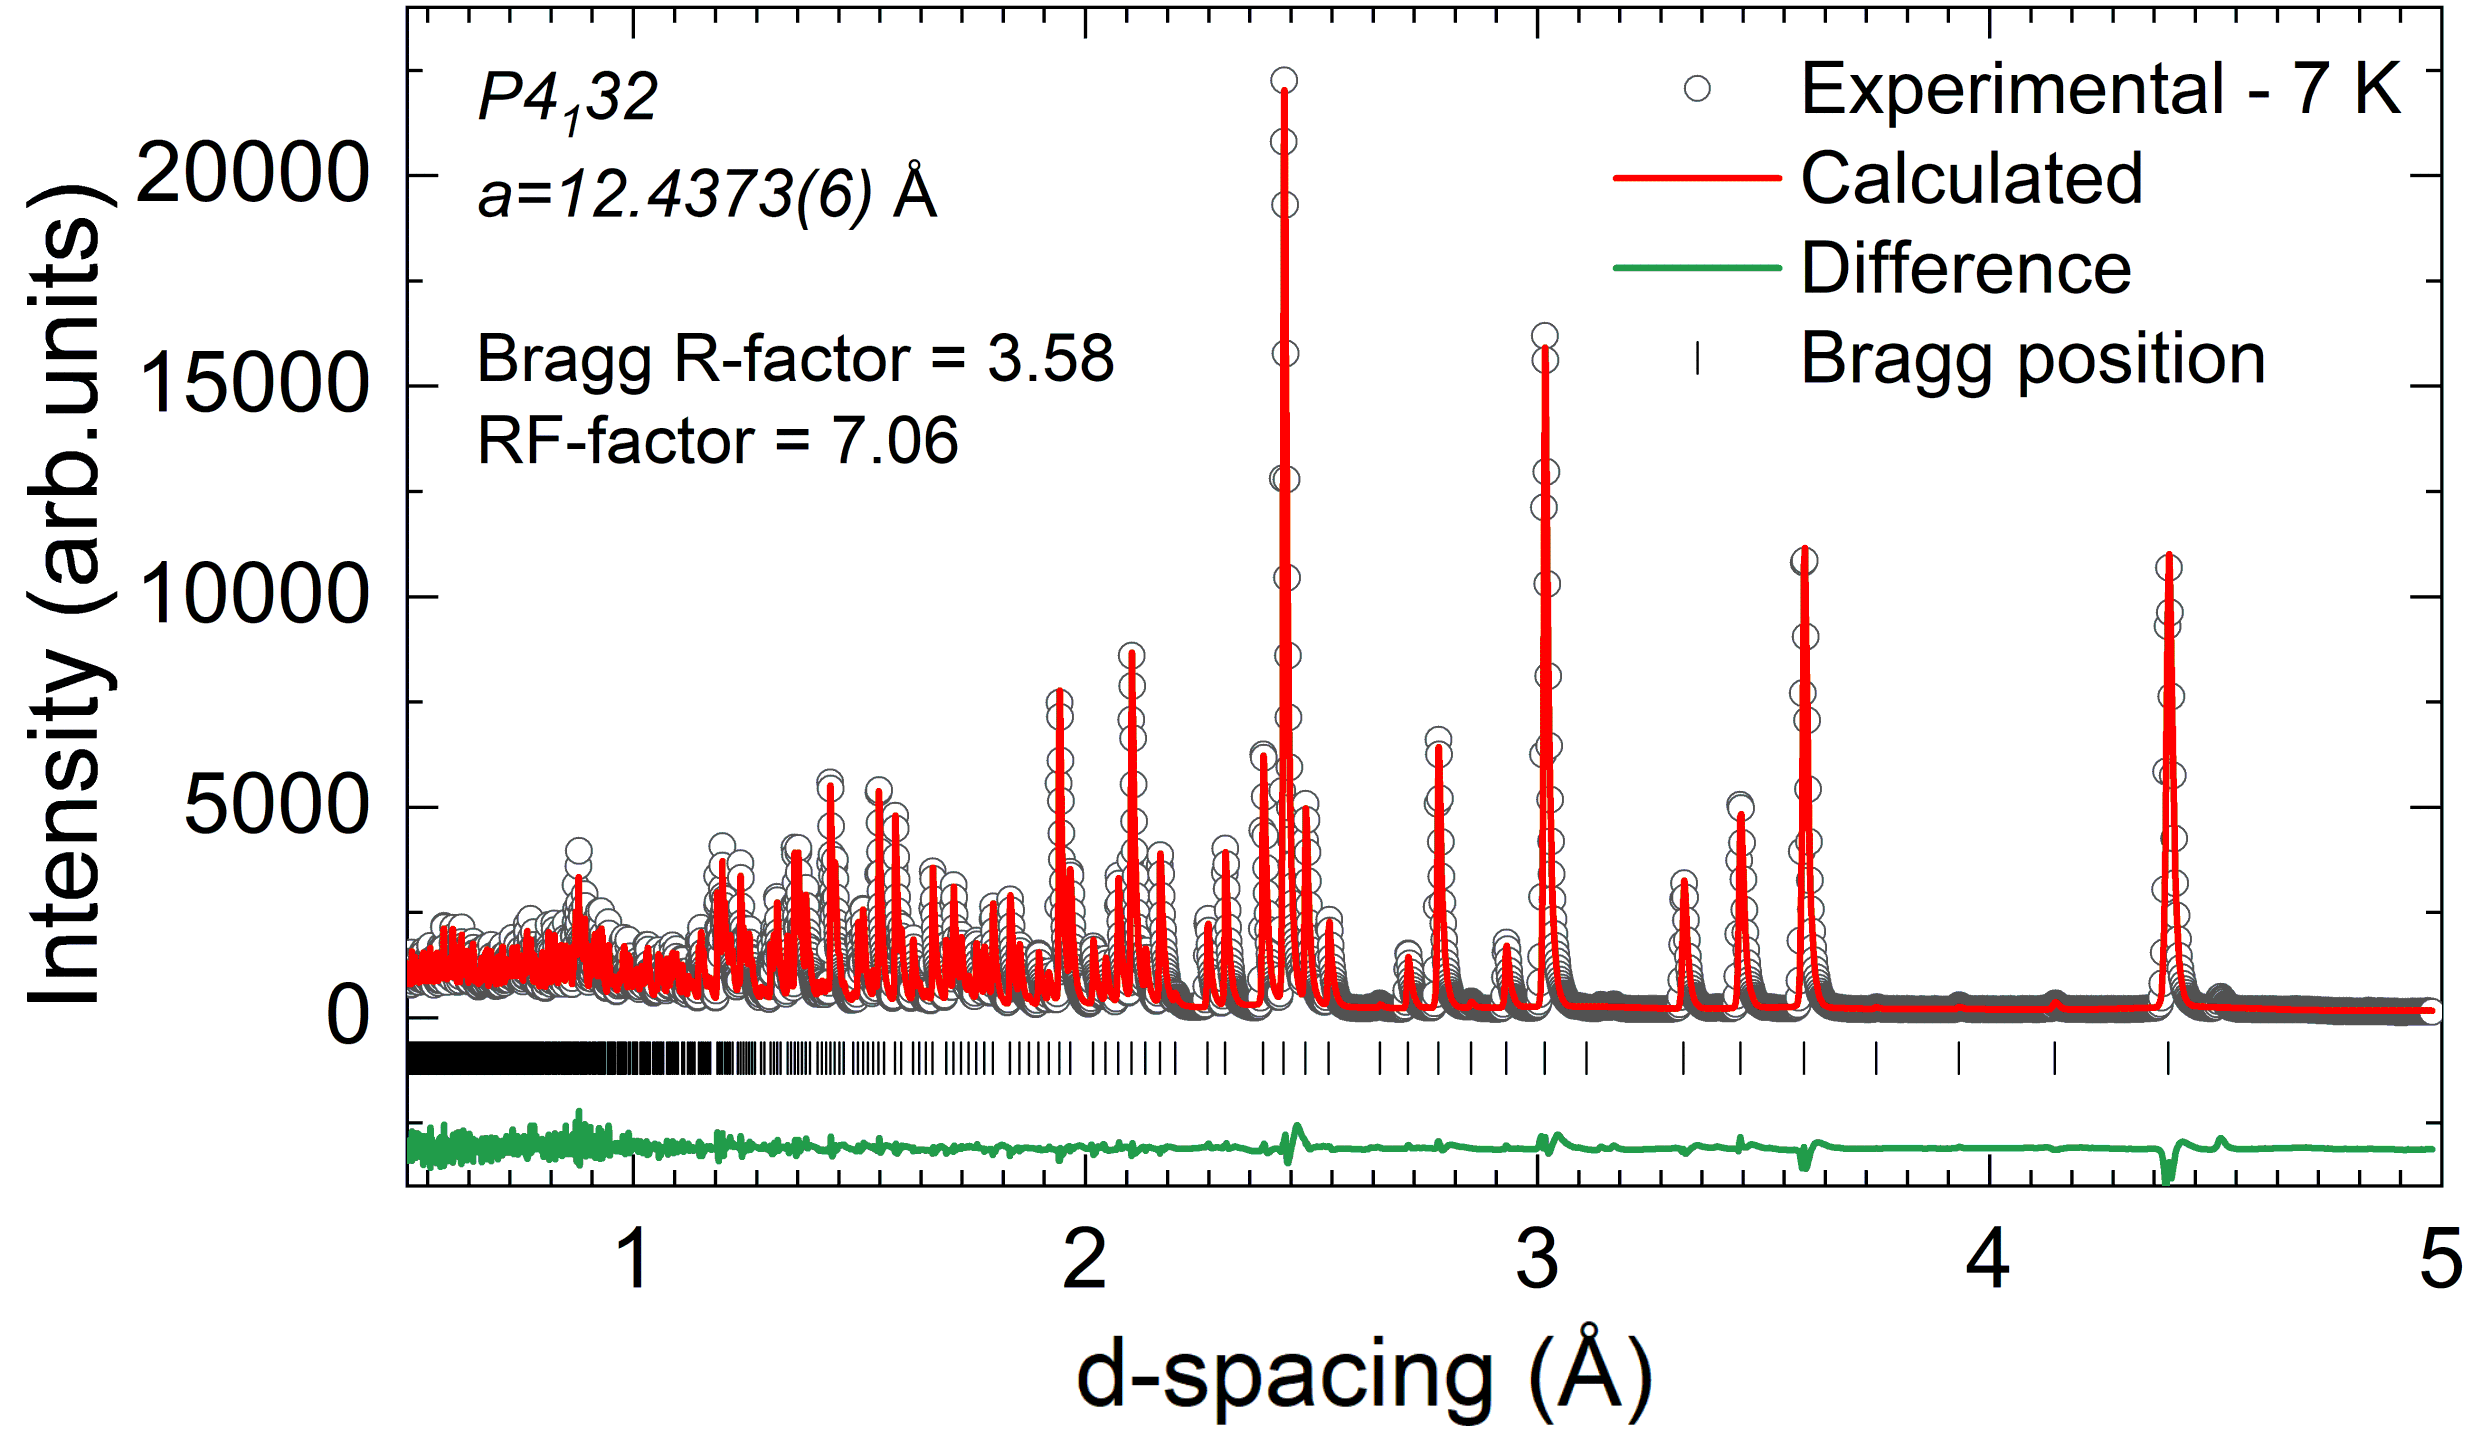
SR measurements on the polycrystalline SrCuTe2O6 were performed at the General purpose Spectrometer (GPS) at the SMuS facility in Paul Scherrer Institut down to 1.6 K in zero field. The nuclear and magnetic structure of SrCuTe2O6 was investigated between 20 K and 1.6 K by obtaining neutron diffraction patterns on powder sample of 10 g. An initial search for the magnetic Bragg peaks was carried out at the DMC diffractometer [19] at the Paul Scherrer Institut, Switzerland using two incident wavelengths Å and 4.504 Å (PG002 monochromator) covering a momentum transfer Q in the range of ÅQ Å-1 and ÅQ Å-1 respectively. The diffraction patterns were collected at 1.6 K, 5.2 K and 20 K. Detailed temperature dependence of the nuclear and magnetic structure on the powder sample was performed at the time-of-flight diffractometer WISH [20] at the ISIS facility, UK. The patterns were collected for temperatures between 1.5 K and 15 K and momentum transfer ÅQ Å-1. In both cases, the powder was loaded into a cylindrical vanadium can and the temperature was controlled using a typical orange cryostat. The patterns are refined using the Rietveld method in the Fullprof package [21] and magnetic symmetry analysis was performed using a combination of BasiReps and Bilbao crystal server software packages [22]. Figure. 1 shows the neutron powder diffraction of the nuclear structure taken at 7 K at the WISH diffractometer. The refinement agrees with the non centro-symmetric cubic structure space group: P4132, consistent with previously reported results [16, 17] at room temperature. The lattice constant at 7 K is found to be 12.4373(2) Å. The refined values of the coordinates and thermal factors are listed in Table. 1.
II Results
II.1 Magnetic properties of single crystal
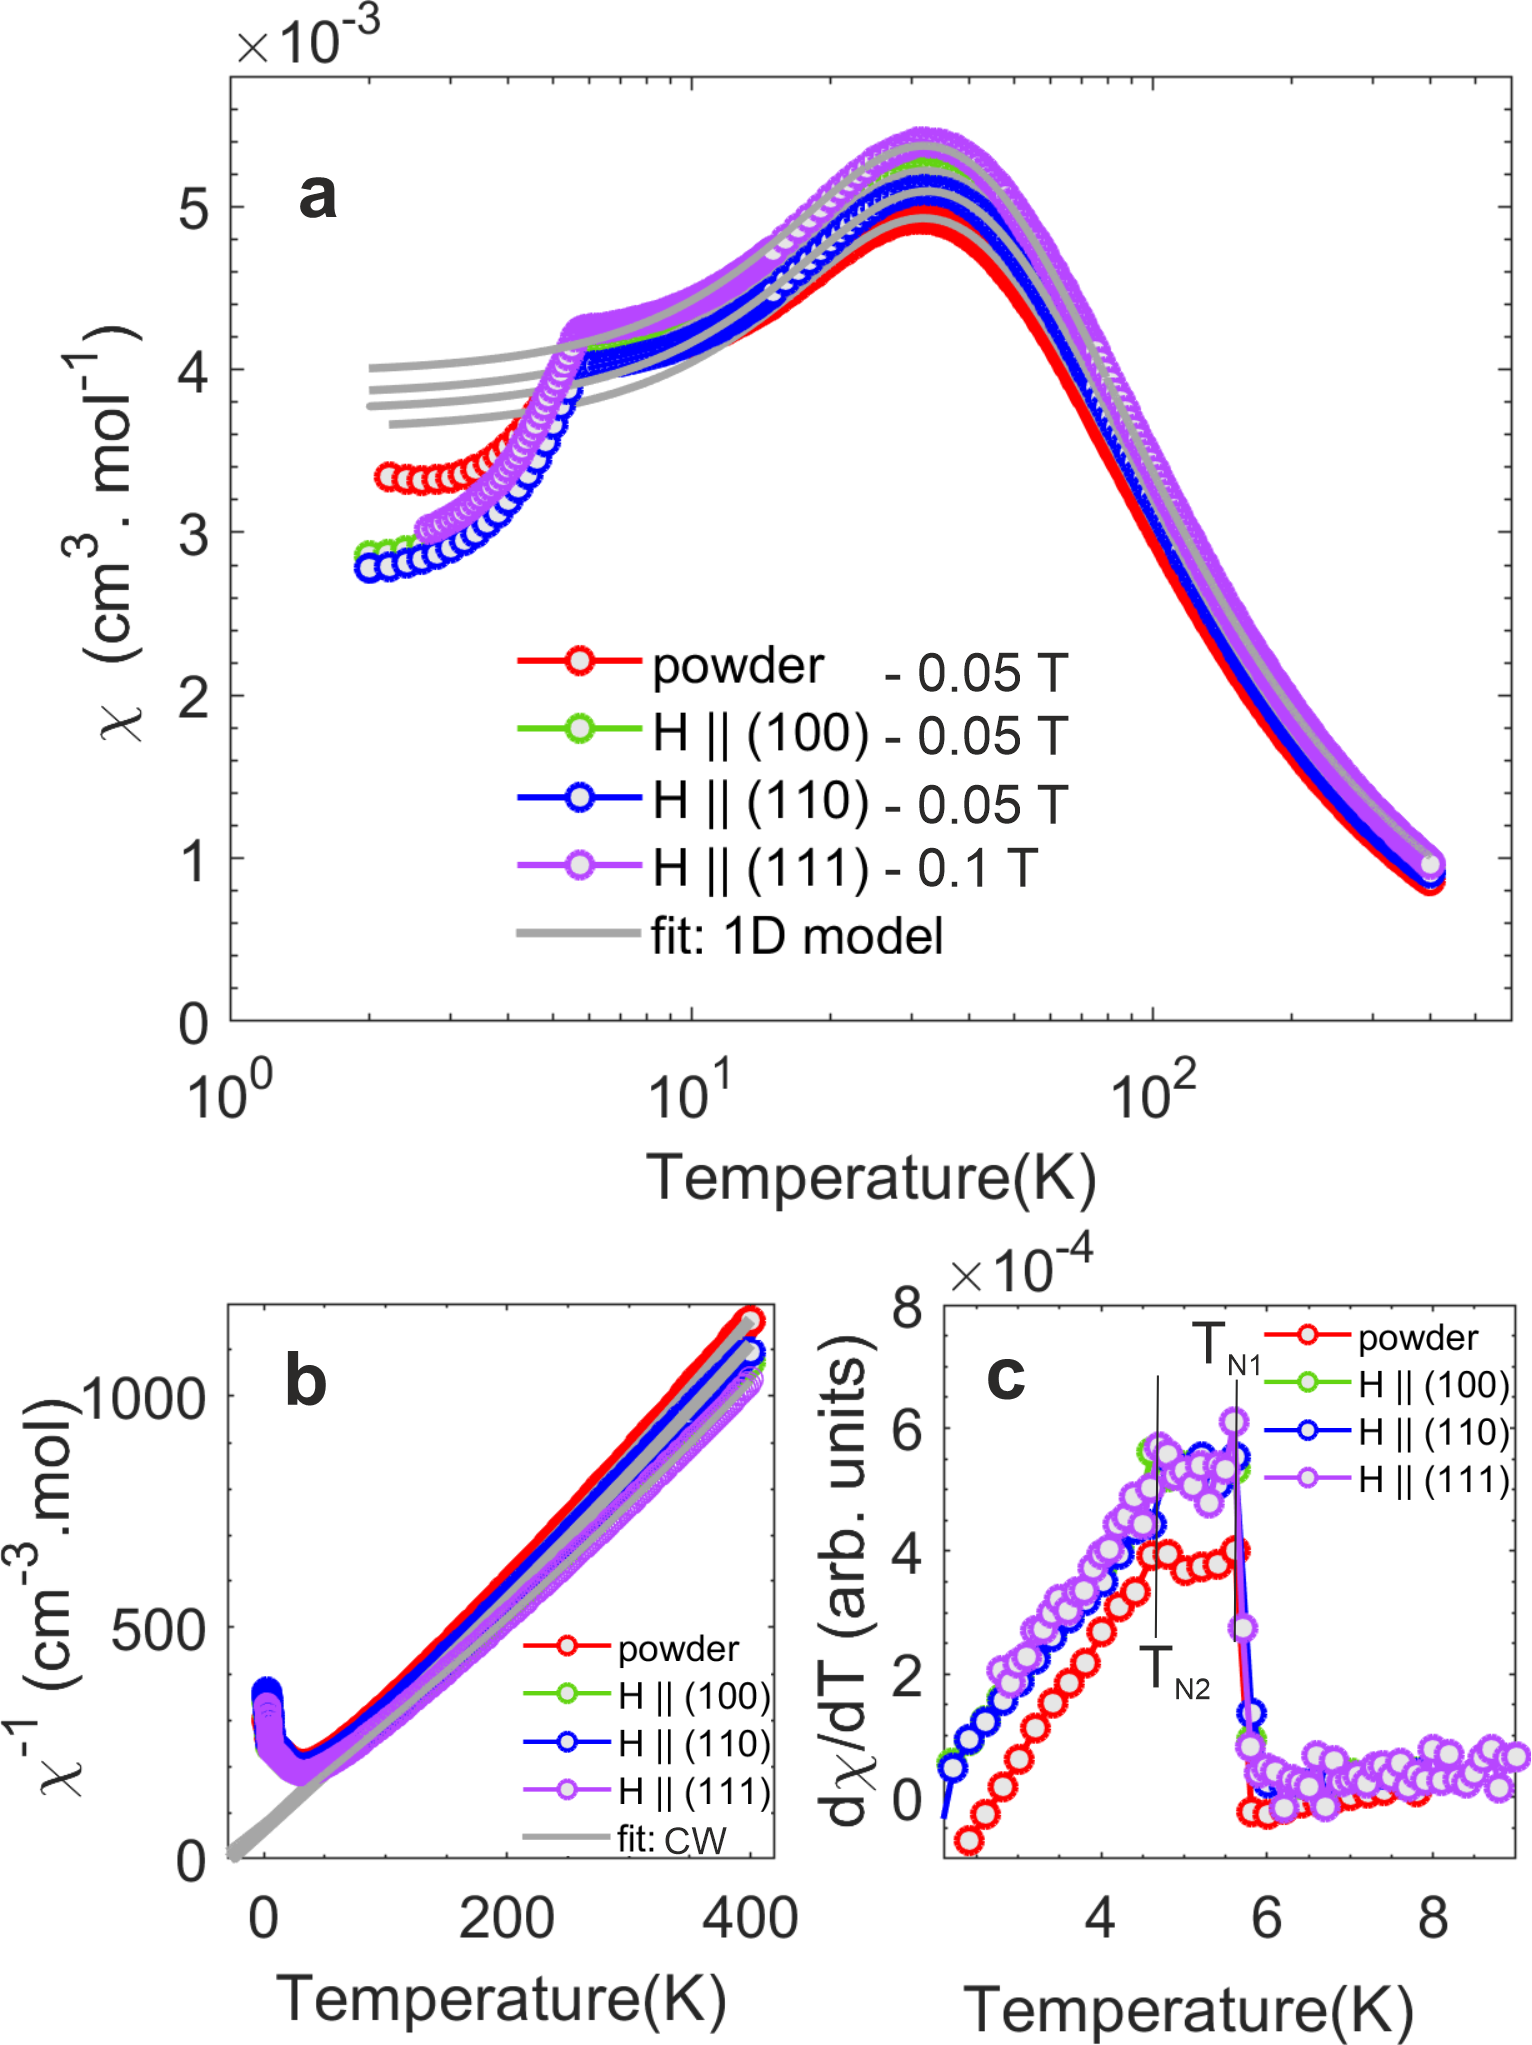
Figure. 2a shows the zero-field-cooled dc-magnetic susceptibility of the polycrystalline and single crystal samples in a bias field of H T revealing several important clues to the magnetic state of the system (1.8 K-400 K). At high temperatures, the inverse susceptibility is linear (fig. 2b) and can be fitted to paramagnetic Curie-Weiss (CW) behaviour: , where cm3. mol-1 is the diamagnetic contribution from the core non-magnetic ions Te4+ ions and refers to Van Vleck paramgnetism. In order to obtain reliable values of the Curie-Weiss temperature , we have varied the lower bound of the temperature range of the fits from 100 K to 200 K. The best fits are obtained for 140 K400 K and the resulting fit parameters , Curie-Weiss constant , along with the derived and factor are tabulated in Table. 2. The values of are: 28 0.3 K, 28 1 K, 26 1 K and 27.5 1.5 K for polycrystalline and crystalline (100), (110) and (111) axes respectively. Within the sensitivity of the measurement and of demagnetization effects due to the shape of the crystal, the single crystal susceptibility in all crystalline directions follows that of the polycrystalline sample hence confirming the isotropic nature of the Cu2+ spins in SrCuTe2O6 . Furthermore, the negative values confirm the predominant antiferromagnetic interactions in the system. The effective moment calculated from the Curie-Weiss constant is 1.85 which is very close to the full moment of the free Cu2+ spin. Accordingly, the derived factor is close to 2.1 in the four measurements assuming spin-. We find that the values are smaller than the previously reported K in polycrystalline samples [16, 17]. The discrepancy could be attributed to the sensitivity of the to the fitted temperature range.
| Sample |
|
|
|
|
|
||||||||||
|---|---|---|---|---|---|---|---|---|---|---|---|---|---|---|---|
| Powder | 4.49 0.01 | 0.413 0.008 | 28.44 0.3 | 1.82 | 2.1 | ||||||||||
| (100) | 6.95 0.05 | 0.436 0.003 | 27.94 1 | 1.87 | 2.16 | ||||||||||
| (110) | 5.38 0.06 | 0.426 0.003 | 26.15 1 | 1.85 | 2.13 | ||||||||||
| (111) | 11.72 1.1 | 0.421 0.005 | 27.5 1.5 | 1.84 | 2.12 |
In the intermediate temperature range, all the four data sets exhibit a broad hump around 32 K indicative of short-range magnetic correlations, characteristic of 1D Heisenberg spin- chain compounds. The solid grey lines in fig. 2a are a fit (T15 K) to the high-temperature series expansion for the DC susceptibility of a spin- Heisenberg antiferromagnetic chain [23, 24]:
| (1) |
where Jchain in is the chain interaction which is also the 3rd nearest-neighbour interaction in the case of SrCuTe2O6 . The g-factor and are also fitted within this model and the resulting parameters are tabulated in Table. 3. The model yields a chain interaction J K and a g-factor of 2.2 in the single crystal. The observed g-factor, although slightly higher than the fully isotropic spin system, it is consistent with the values obtained from high temperature Curie-Weiss behaviour. In Heisenberg systems the Curie-Weiss temperature is the weighted sum of all the relevant magnetic interactions:
| (2) |
taking K, the triangle-based inter-chain couplings in SrCuTe2O6 sum to K suggesting that they are antiferromagnetic and frustrated. As a result, SrCuTe2O6 exhibits magnetic transitions at the temperatures K, K which are much lower than the Curie-Weiss temperature. They are revealed as peaks in the first derivative of the susceptibilities plotted in fig. 2c.
| Sample |
|
g-factor |
|
||||
|---|---|---|---|---|---|---|---|
| Powder | 3.85 0.1 | 2.12 0.005 | 49.10.02 | ||||
| (100) | 3.41 0.1 | 2.19 0.006 | 49.840.02 | ||||
| (110) | 1.59 0.11 | 2.18 0.006 | 50.090.02 | ||||
| (111) | 10.3 0.13 | 2.15 0.001 | 50.090.03 |
To confirm the presence of magnetic transitions, heat capacity of the single crystal has also been measured. As shown in the fig. 3, the phonon contribution (Cphonon) of the high temperature heat capacity is very well described by a sum of one Debye integral and two Einstein terms given in eq. 3 (fit range 40 K200 K) allowing the extraction of the dominant magnetic contribution at low temperatures.
| (3) |
Here, R J. mol-1. K-1 is the gas constant, , , , are the no. of atoms per unit cell, Debye temperature, no. of Einstein modes and corresponding Einstein temperatures respectively.
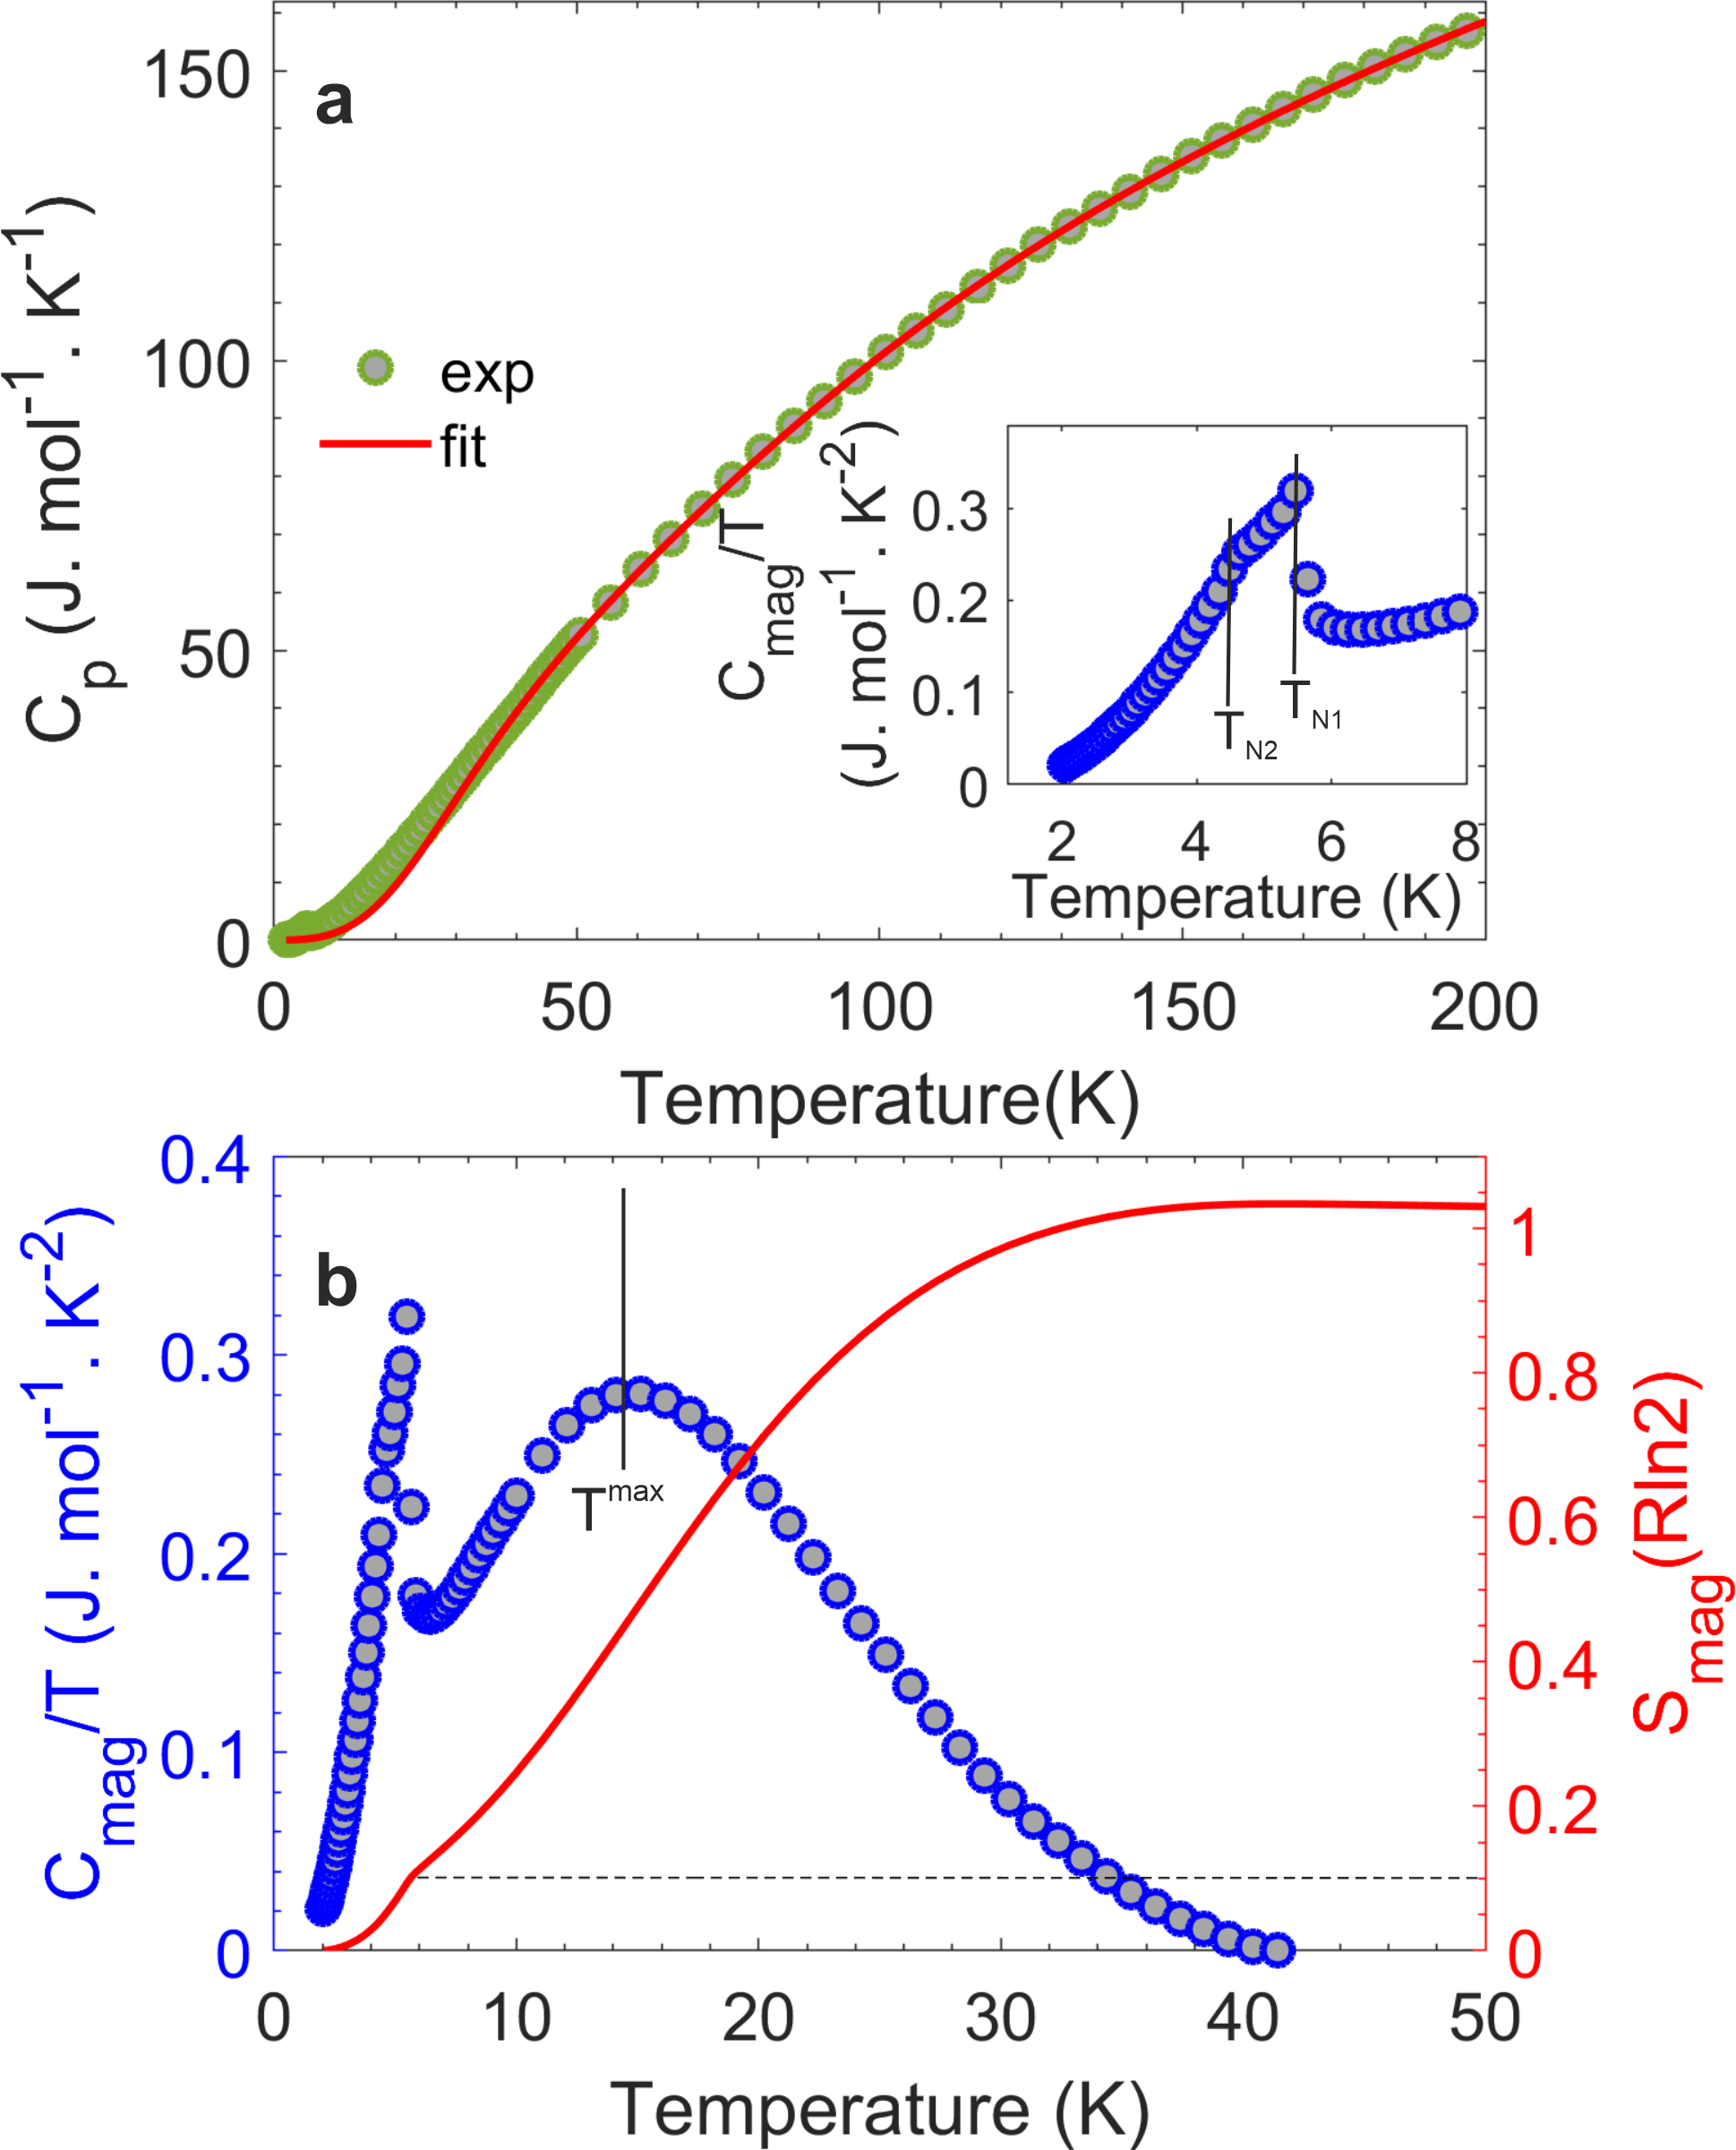
The obtained magnetic quantity , where , shows two -like anomalies are observed at lower temperatures K and K (inset of fig. 3a). These transitions are consistent with the previous reports in the polycrystalline samples. Above the magnetic transitions, shows a broad peak at K (left y-axis of fig. 3b). This is a characteristic feature observed in Heisenberg spin-1/2 antiferromagnetic chains [25, 24] which relates to the chain interaction Jchain as:
| (4) |
giving J K, in close agreement with the results from susceptibility. Although the magnitude of the magnetic contribution at higher temperatures varies with the fit range of the phonon contribution, we find that the magnetic entropy at lower temperatures ( K) is unaffected by this artifact (right y-axis of the fig. 3b). We find that only 10% of the total magnetic entropy is released across the magnetic transitions ( K K) . Therefore, the remaining 90% of the entropy can be associated with the short range magnetic correlations corresponding to the one-dimensional nature of the Cu2+ spins above the magnetic transition.
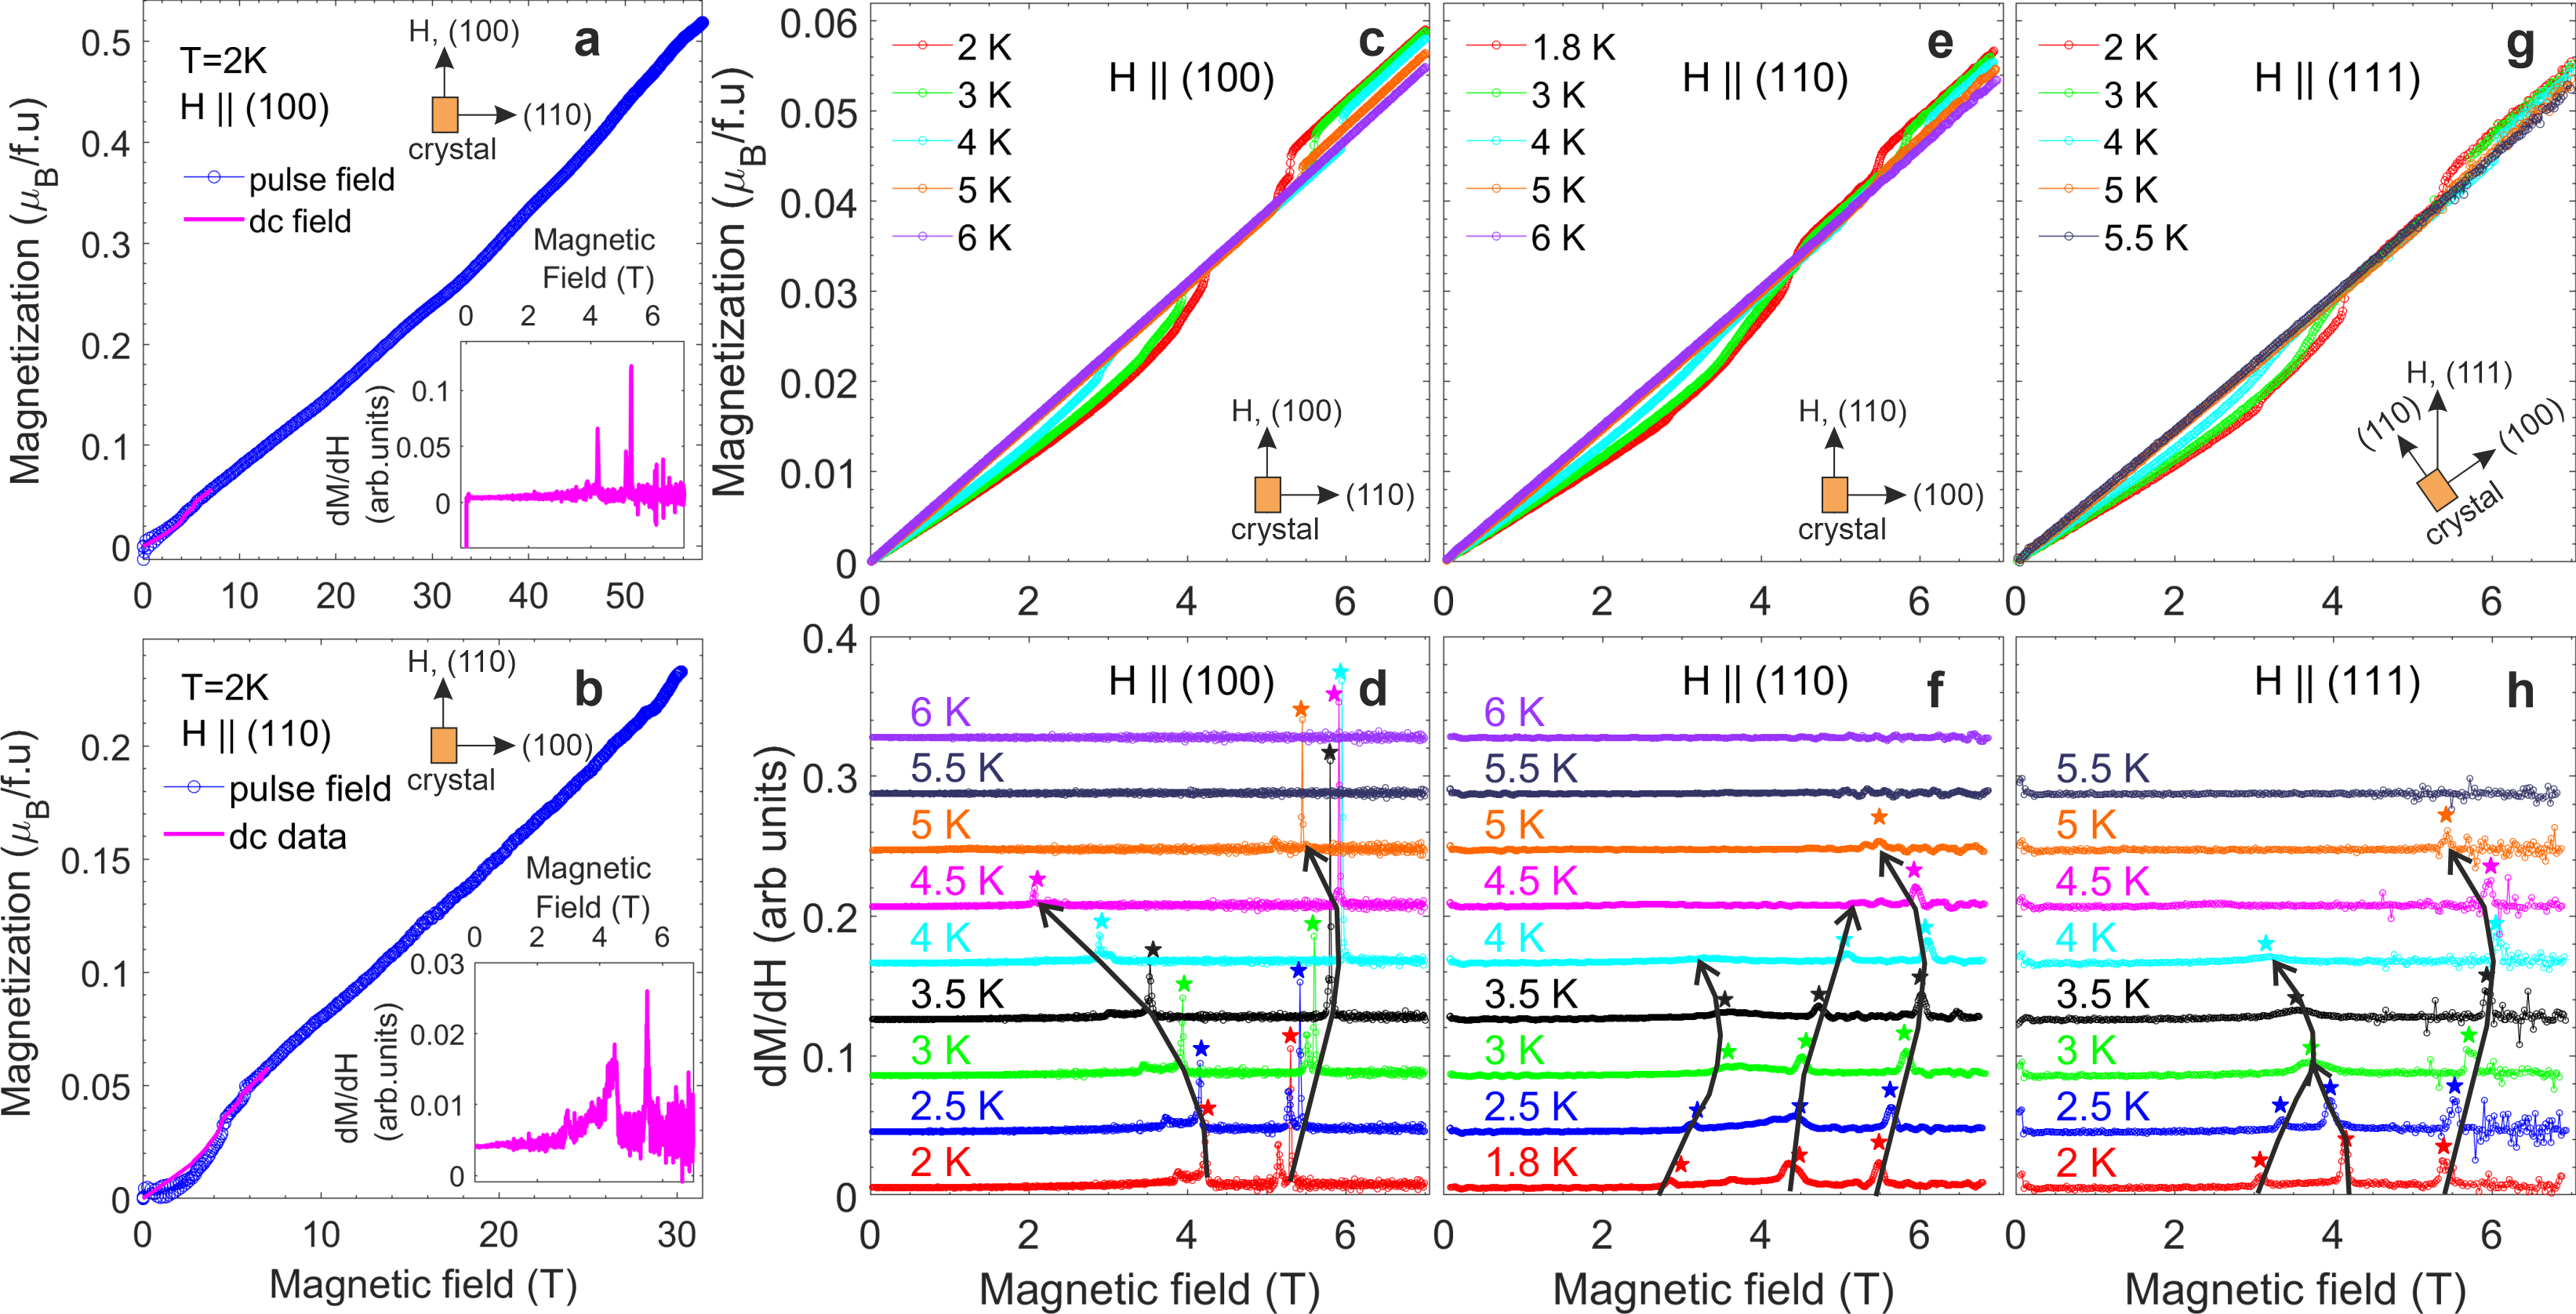
In order to explore the effects of magnetic field on SrCuTe2O6 , magnetization measurements were performed at various temperatures. High field magnetization at K using a pulsed magnet, as well as lower field DC magnetization measurements along the (100) and (110) direction respectively are presented in fig. 4a-b. The pulsed field measurements were normalized by the DC magnetization and reveal that the Cu2+ moment reaches 0.5 at 56 T. Considering a linear extrapolation, the saturation field can be expected at 110 T.
At lower fields, two sets of anomalies are observed in the derivative of magnetization (in dc-field) along the (100) direction indicating possible field-induced magnetic transitions in the single crystal of SrCuTe2O6 . As shown in the inset of fig. 4a, these anomalies occur at 4.2 T and 5.5 T accompanied by shoulder peaks at 3.98 T and 5.13 T. Magnetization along crystalline (110) direction at 2 K (see inset of fig. 4b) also reveals three anomalies at 3 T, 4.2 T and 5.5 T. These anomalies were followed as a function of temperature for the three directions of the single crystal (see fig. 4c, e, g)) as well as for the polycrystalline sample. The derivative of magnetization dM/dH in Fig. 4d shows that the anomalies give rise to sharp and strong peaks when the field is applied along the (100) direction. With increasing temperature, the lower peak shifts to lower fields up to K whereas the higher peak (5.5 T) shows a slight shift towards higher fields and disappears above 5 K. We observe that the shoulder peaks essentially move along with the main peaks. We believe this is due to a smaller crystallite within the sample with a misaligned (100) direction.
Along the (110) direction, the peaks in the dM/dH are much weaker compared to the (100) direction, however, their position moves towards higher fields gradually up to K where the highest field peak reaches a maximum of 6 T as shown in fig. 4f. Only the highest field anomaly survives in the intermediate phase between K and K similar to the (100) direction. Finally, magnetization along the crystalline (111) direction (fig. 4g-h) shows characteristics of behaviour along (110) as well as (100) direction. At base temperature K, the magnetization resembles mainly that of the (110) direction with anomalies in the dM/dH observed at 3.1 T, 4.1 T and 5.4 T. However, the two lower field anomalies merge at 3 K above which the peak shifts to lower fields and vanish above K. On the other hand, the higher field anomaly stays between 5 T and 6 T similar to the other two directions.
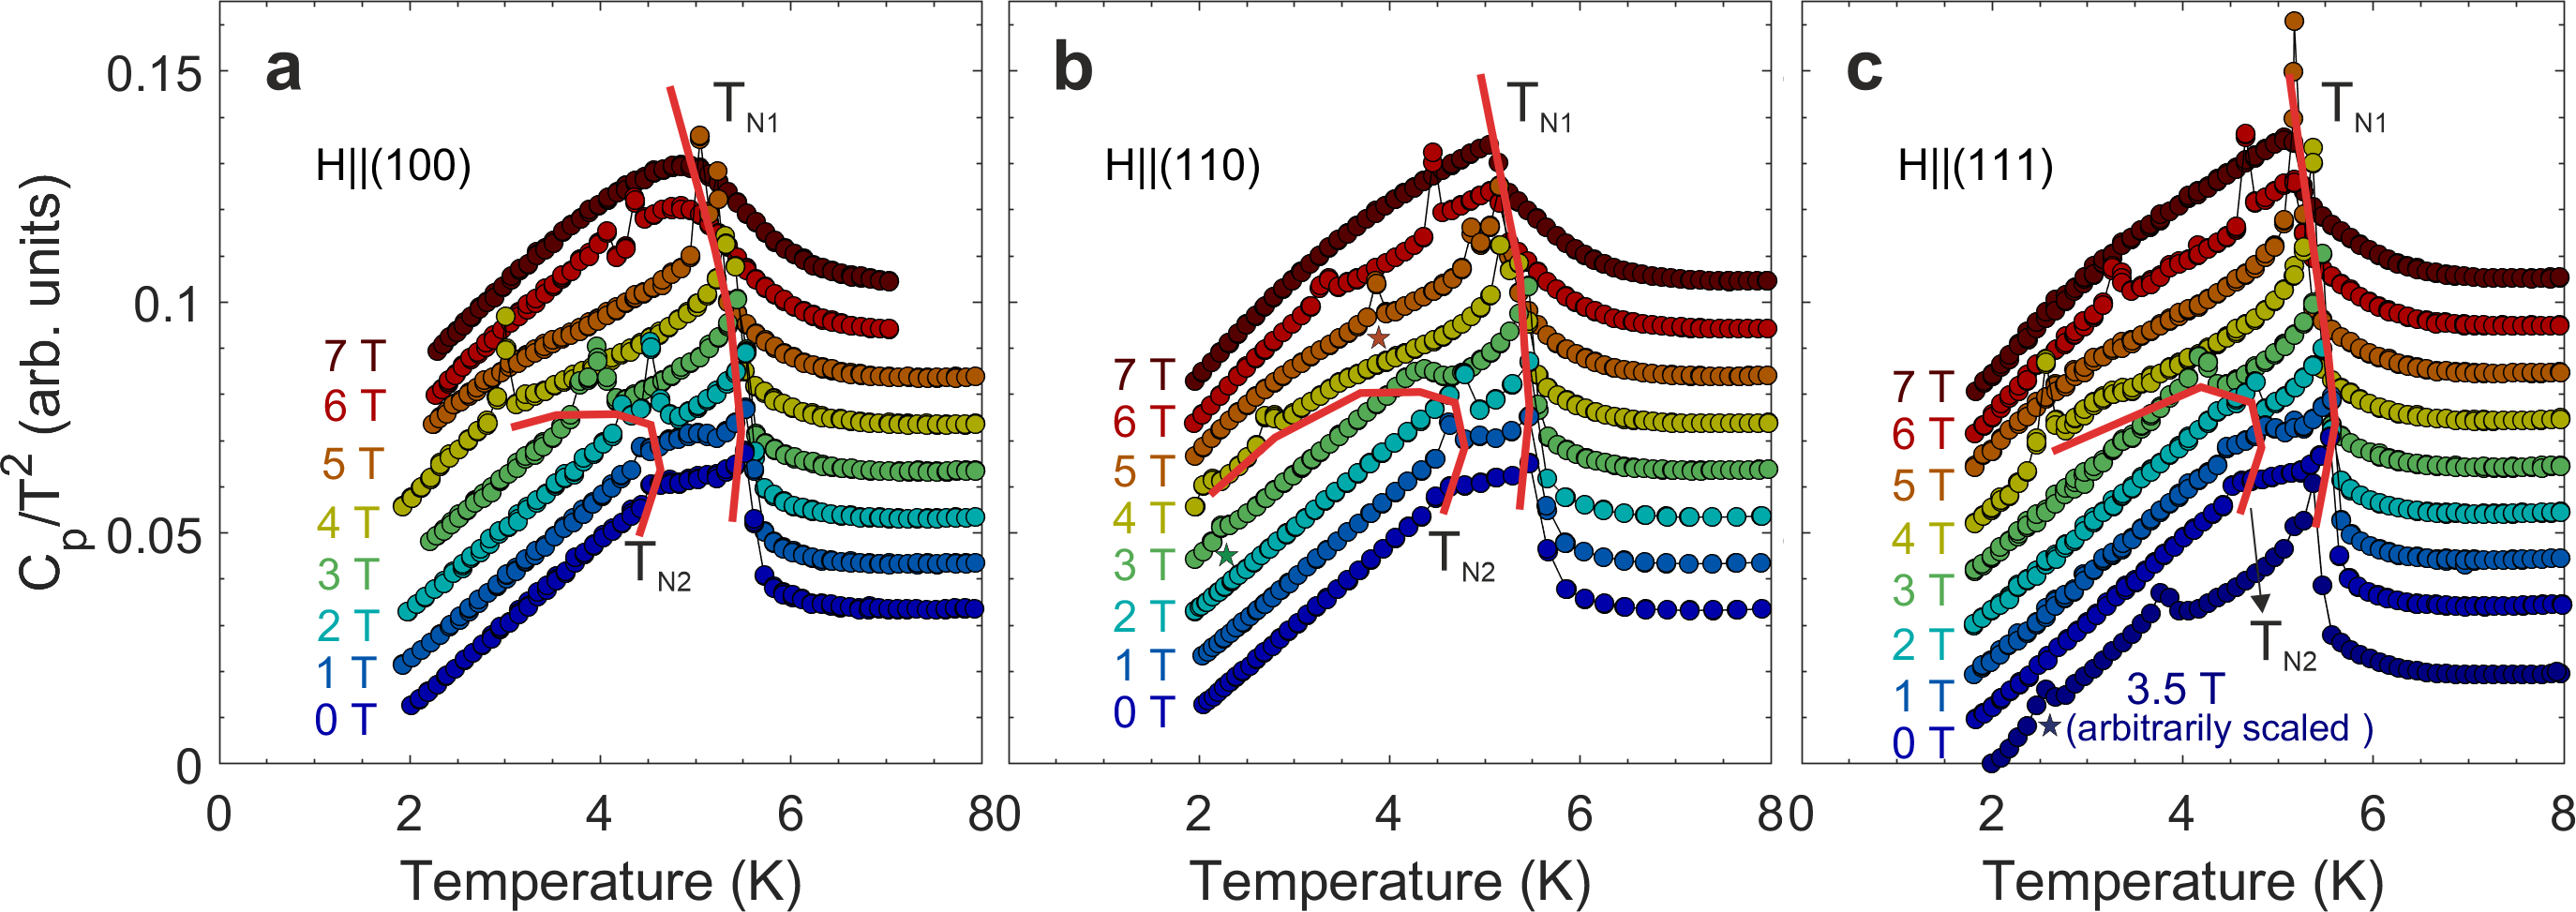
These results are corroborated in the heat capacity measurements. The -like features corresponding to and in the specific heat also exhibit a significant field dependence in the three directions (see fig. 5). We observe that the respective anomalies along (100) direction become sharper (indicated by solid red lines in fig. 5a) in the external field. The transition disappears above 4 T and a new transition anomaly is observed at 6 T. Above this field, a single, broad anomaly is seen at . While the behaviour of these transitions is similar along the (110) direction (fig. 5b), two additional transition anomalies are observed at 2.1 K and 3.9 K in 3 T and 5 T field respectively (indicated by stars). These transitions are consistent with the anomalies observed in the magnetization of the crystal along (110) direction. The (111) direction of the crystal shows one additional peak at 2.6 K in 3.5 T field (blue star in fig. 5c) while largely retaining the peaks corresponding to and from the (100) direction. However, the transition remains sharp along (110) and (111) directions at fields H T unlike along the (100) direction. Combining these observations, the phase diagram is then constructed for each of the crystal directions separately along with the polycrystalline sample.
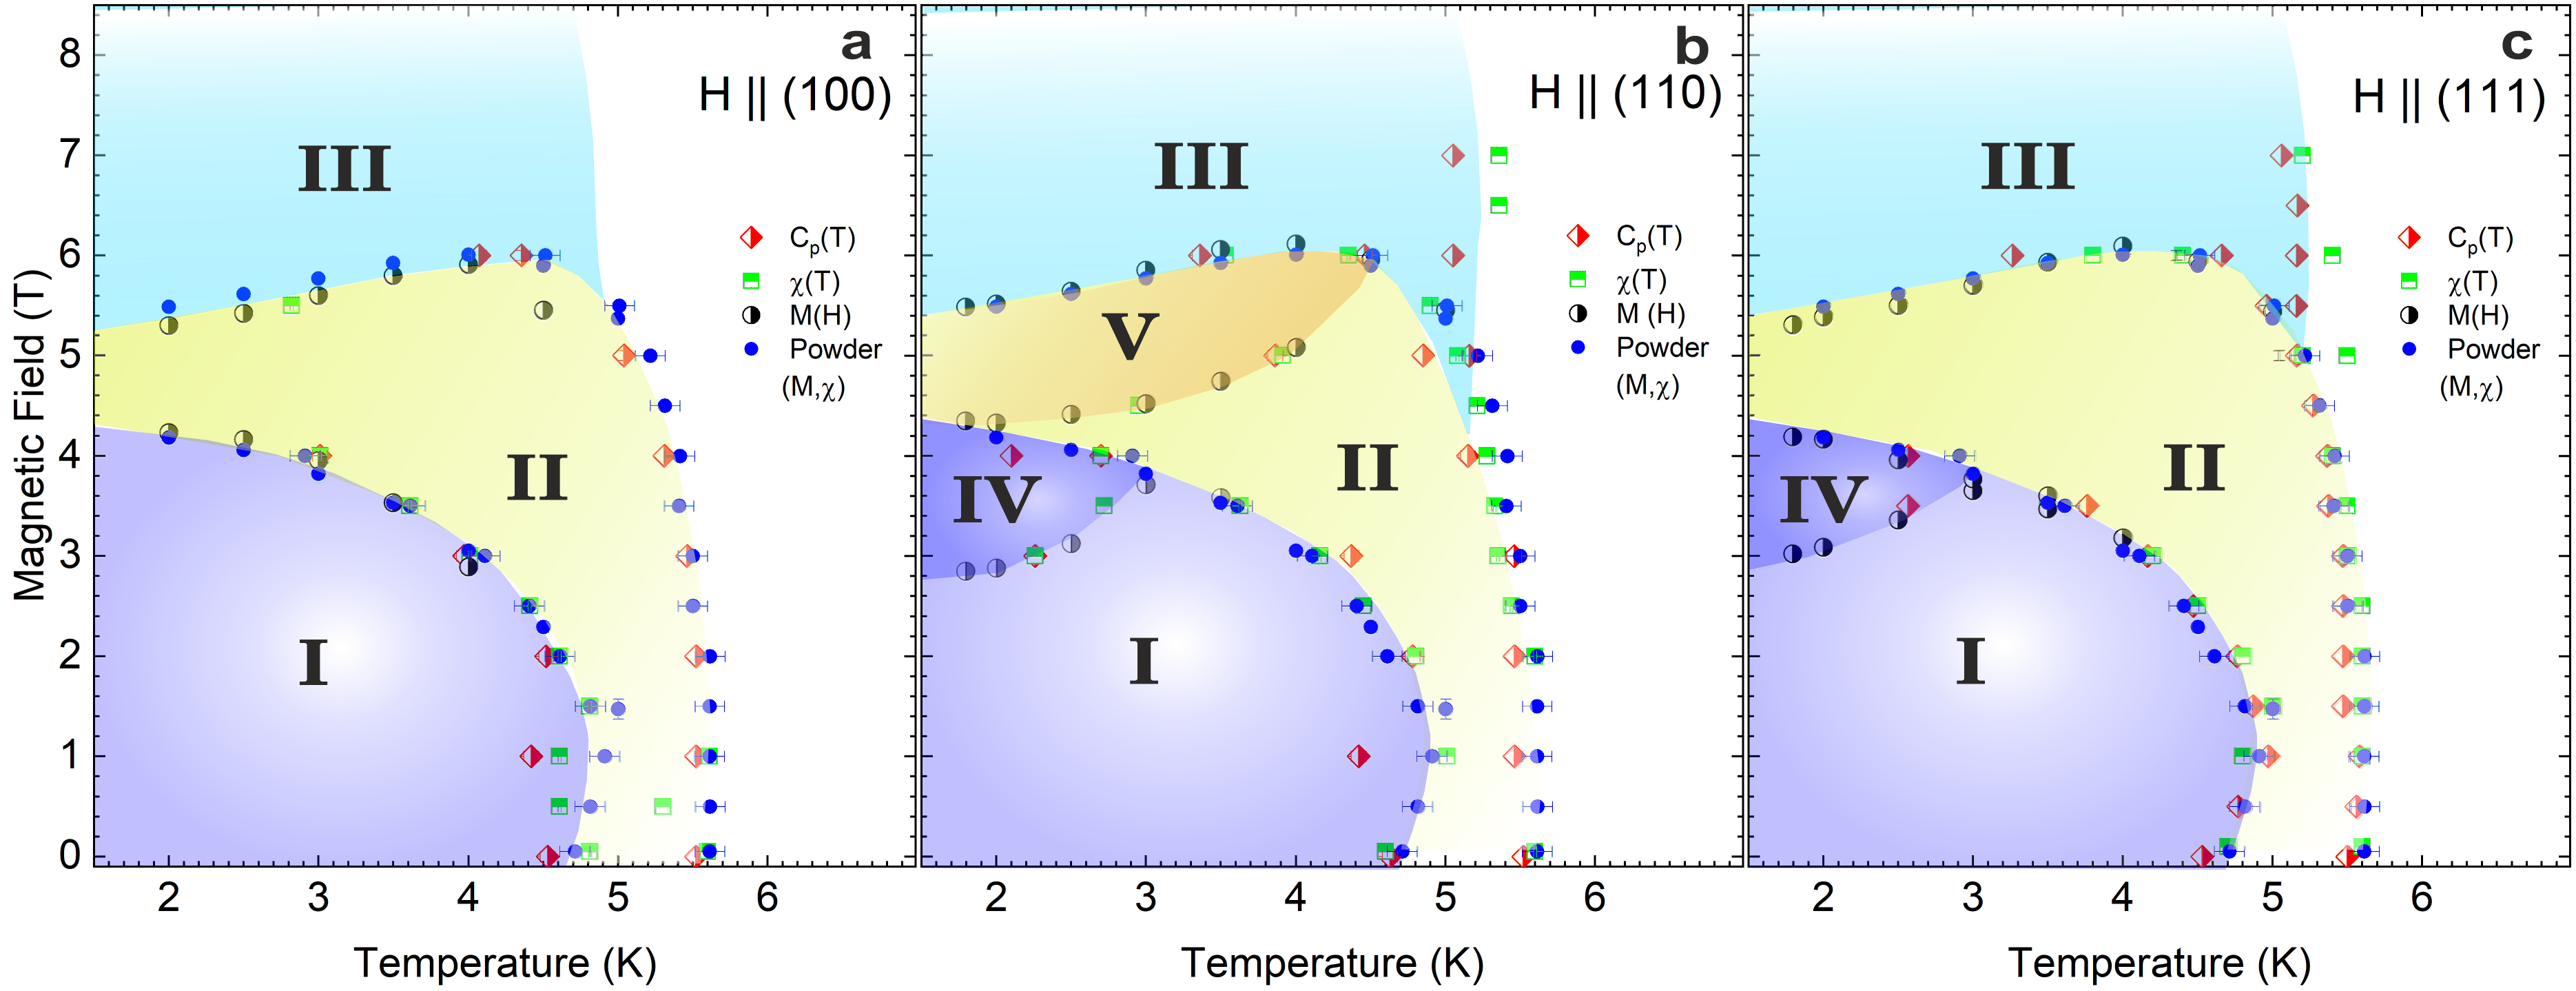
Figure. 6a shows that phase diagram of the single crystalline SrCuTe2O6 along (100) direction identifies three possible magnetic phases in the system. Here, phase-I refers to the magnetic ground state, phase-II is an intermediate phase and the phase-III, where heat capacity shows a broad , refers to ferromagnetic canting of the spins. These results are similar for the polycrystalline sample and in good agreement with the previously reported results [16, 17, 18]. Two additional phase-IV and phase-V are also observed when the field is applied along the (110) direction. Field along the (111) direction reveals phase-IV as well as the phases observed along the (100) direction. These additional phase transitions indicate a preferential orientation of the spins along the (110) direction which undergoes the most phase transitions whereas the presence (phase-IV along (111)) or absence (along (100)) of these additional phases could be attributed to the energy difference required to rotate the spins from (110) to (111) (35∘ rotation) or from (110) to (100) (55∘ rotation).
II.2 Muon Spin Relaxation
To obtain more insight into the nature of the magnetic order below the two transitions and in SrCuTe2O6 we further probe the material with muon spin relaxation (SR) experiments in zero magnetic field between 2 K and 10 K. Figure. 7a-e show the SR spectra of SrCuTe2O6 as a function of decay time at several temperatures in the ordered state ( K) and in the paramagnetic state K. At base temperature, the spectrum clearly reveals the oscillatory behavior of the asymmetry resulting from the Larmor precession of the muon spin around the local internal field set by the magnetic ordering in the system. Furthermore, the remnant relaxation at long time-scales saturates at of the initial value of the asymmetry. These observations are typical indications of static magnetic order in the system.
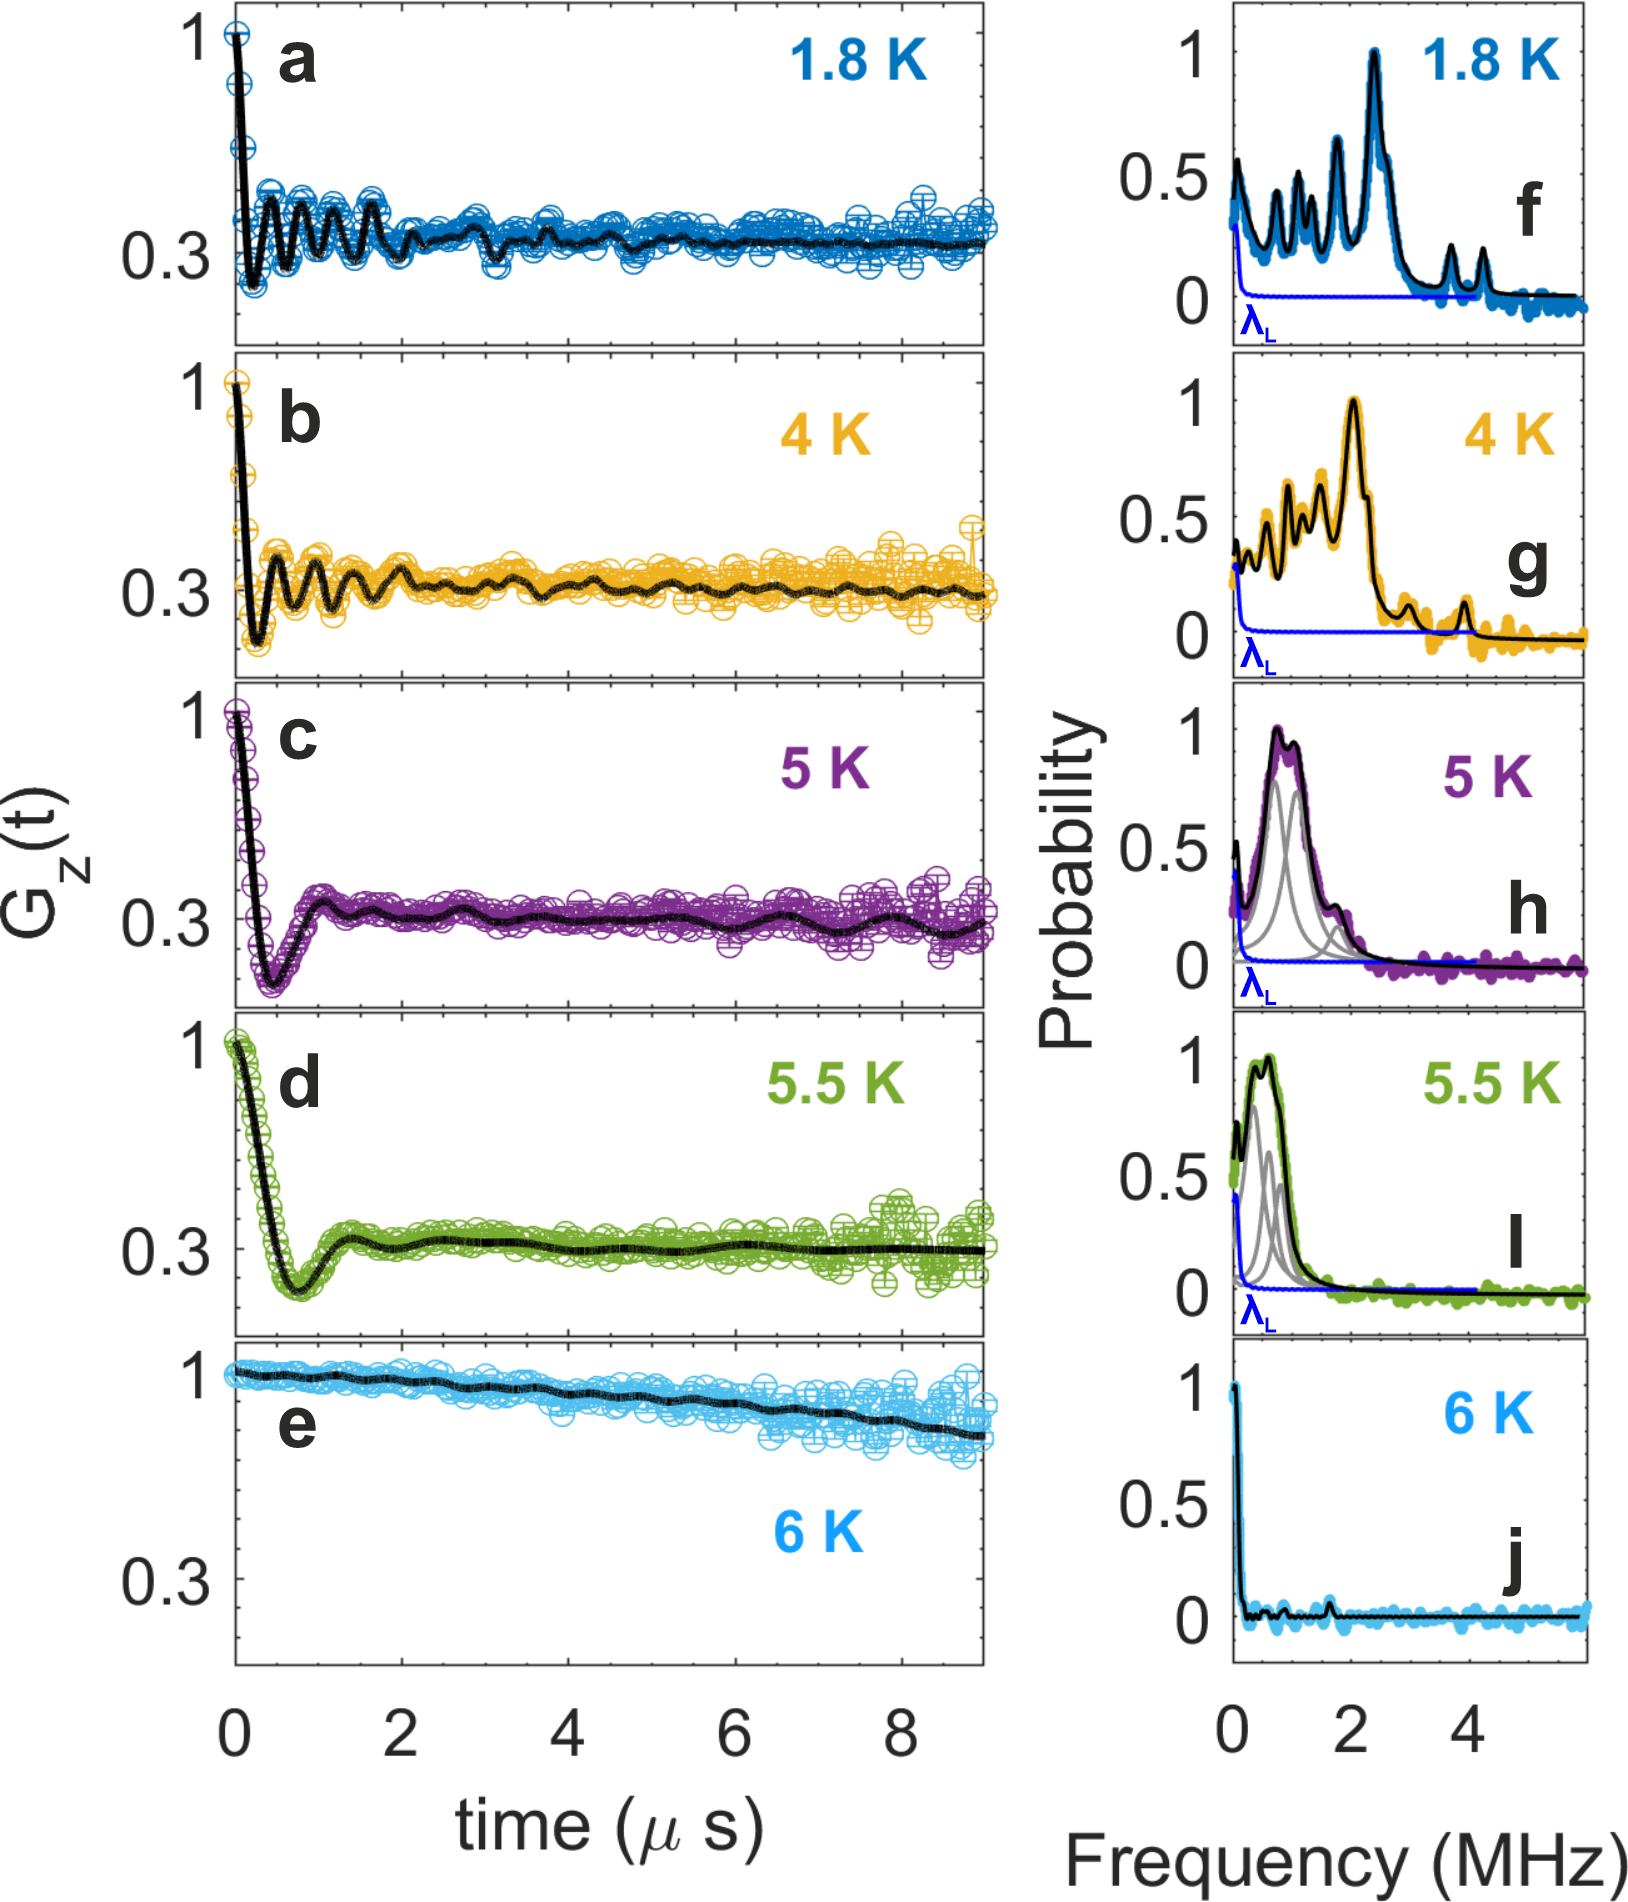
The Fourier transform (FFT) of the oscillating spectra reveals nine frequency components at base temperature as shown in fig. 7f and their distribution varies as the temperature increases towards (fig. 7f-g). Therefore, all the spectra below are fitted by considering a superposition of nine Gaussian-distributed internal magnetic fields to describe the precessing part of the spectrum as described in the following model:
| (5) |
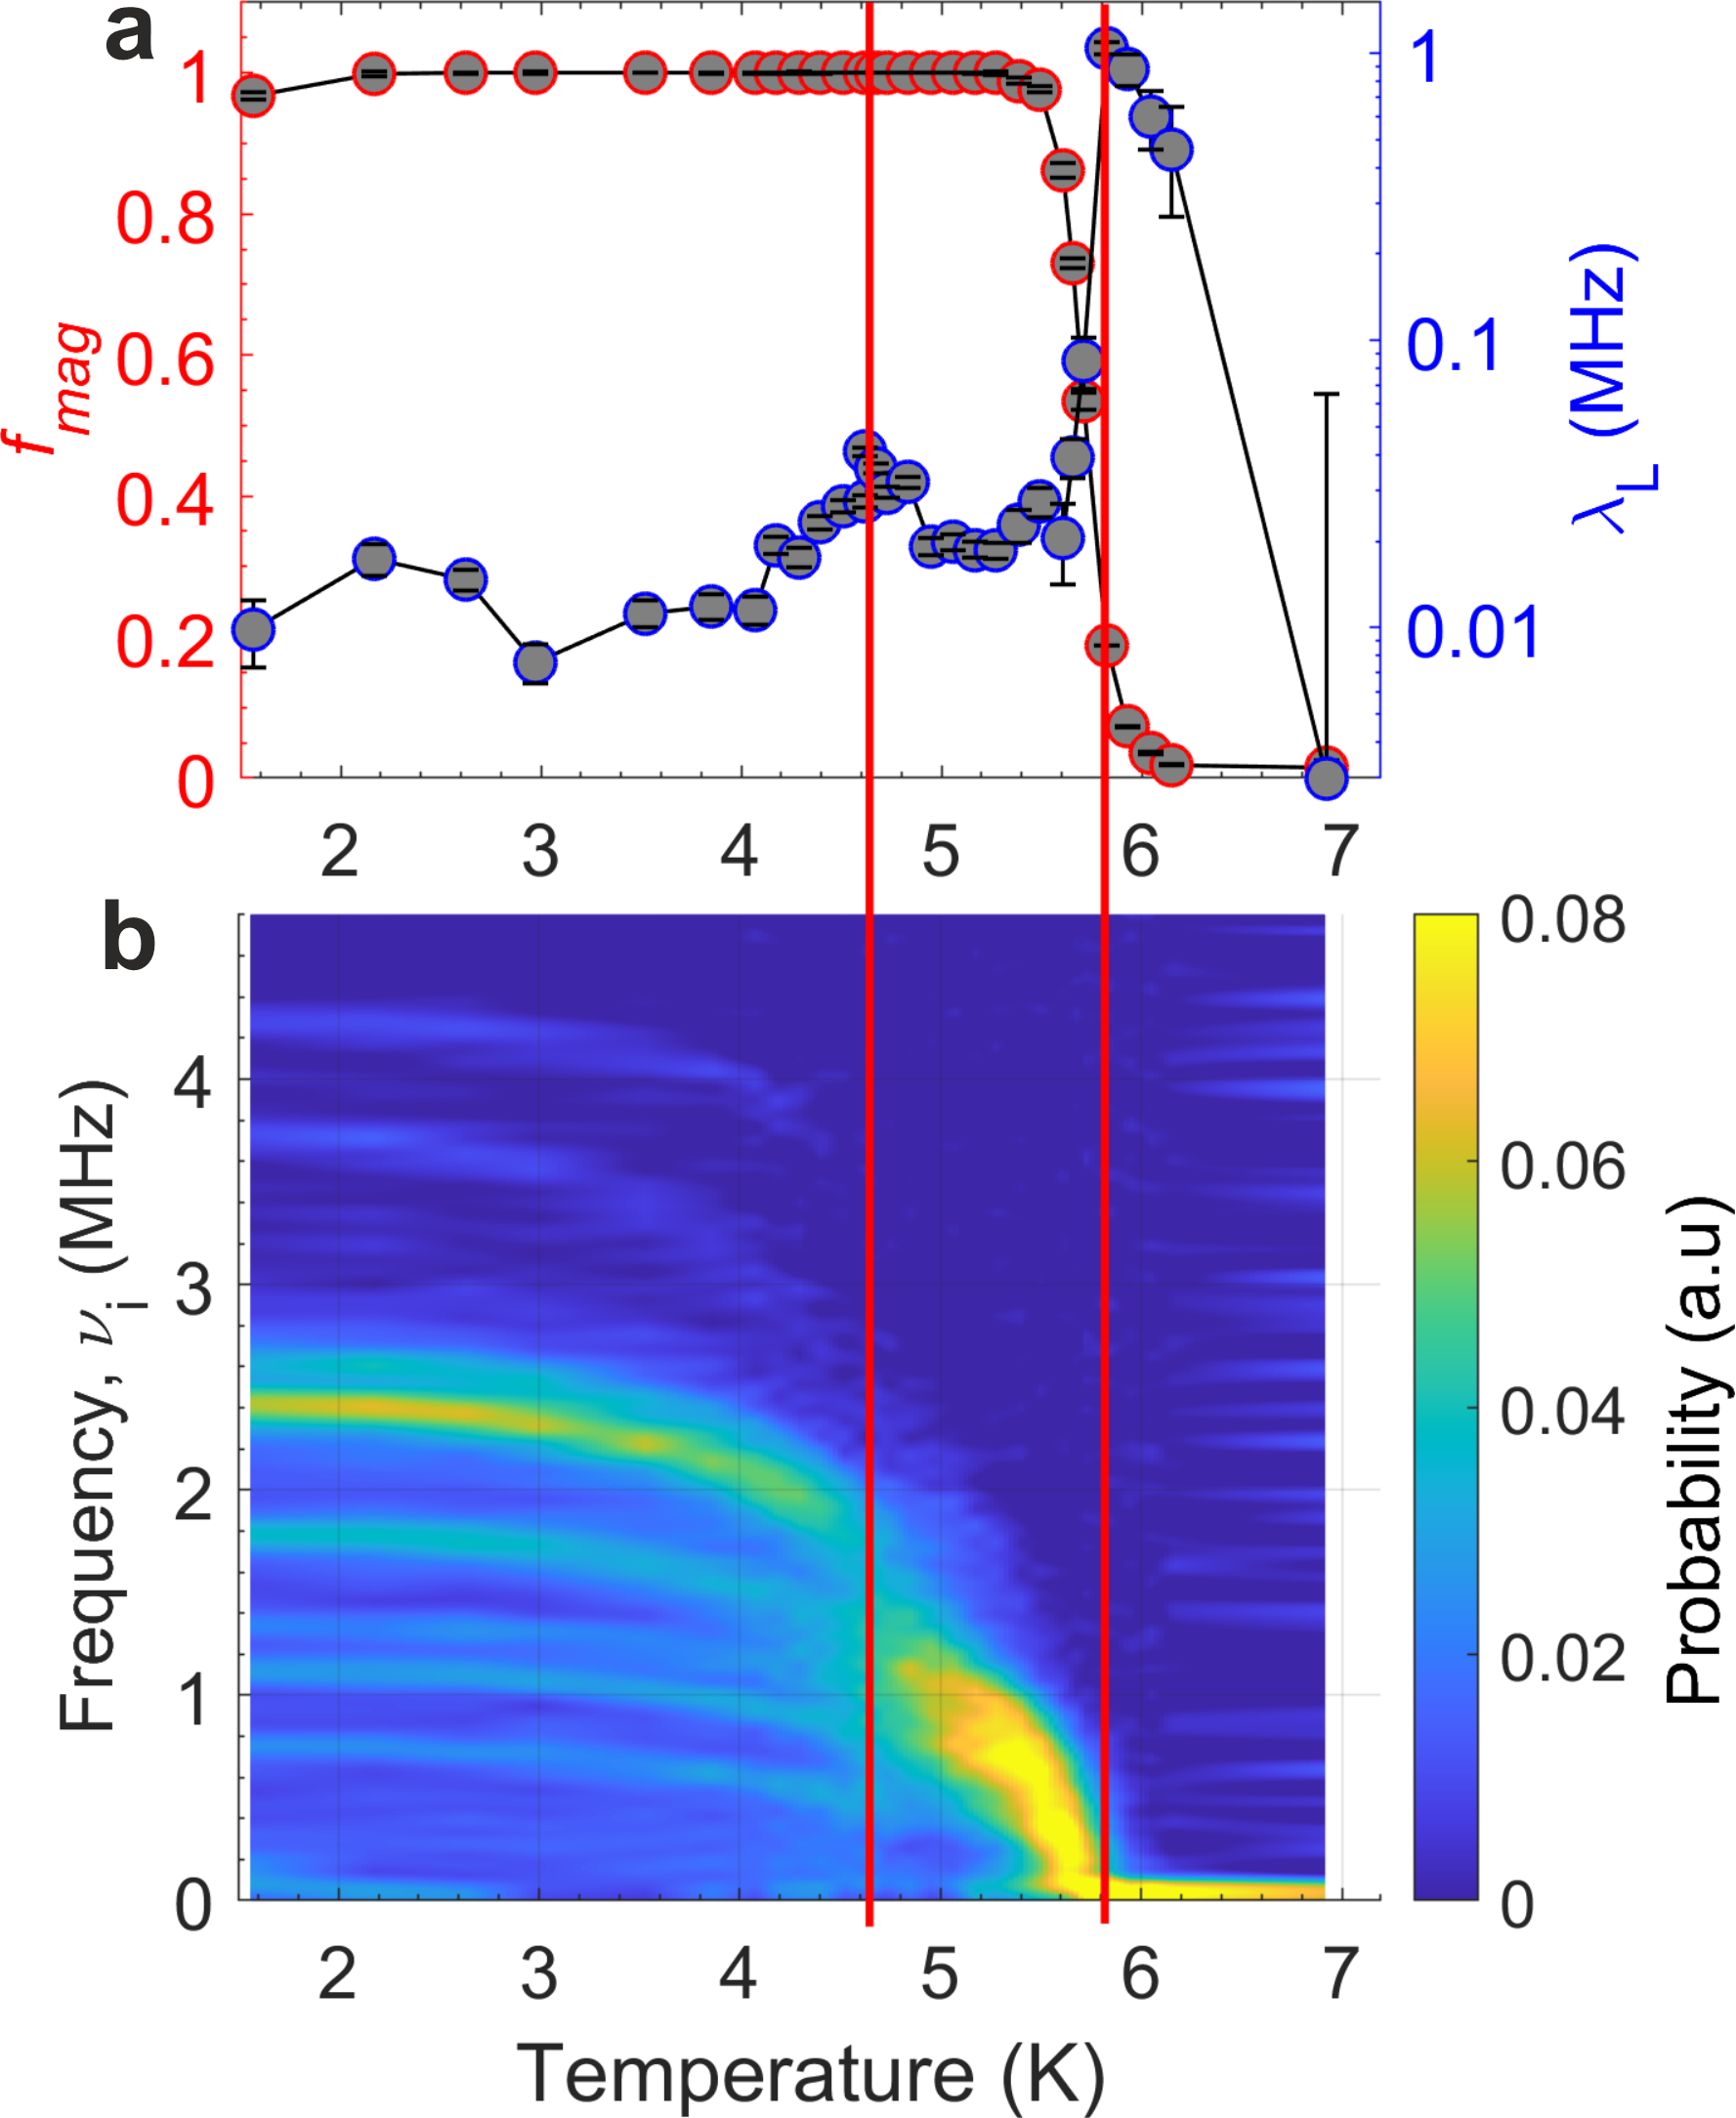
where is the Gaussian Kubo-Tayabe function that describes the asymmetry due to nuclear moments in the paramagnetic state and is the magnetic contribution due to electronic spin ordering in the system. The magnetic part is further separated into Cosine-oscillating term consisting of nine frequency contributions () with weight fractions , and non-oscillating relaxing term at long time-scales. The former term describes a homogeneous Gaussian distribution of internal fields and the latter term implies the relaxation () of those muons whose spin is longitudinal to the internal field at the time of decay and hence is indicative of the spin dynamics in the system. Upon approaching from high temperatures the magnetic fraction reaches a value of unity (left y-axis of fig. 8a) confirming that all of the Cu2+ in SrCuTe2O6 undergo magnetic transition and eliminating the possibility of phase separation. Consequently, peaks up at K and K and as shown in the right y-axis of fig. 8a reflecting the critical dynamics at the magnetic transitions in SrCuTe2O6 . These transition temperatures are in close agreement with the values observed in the magnetic heat capacity and susceptibility measurements.
The field distribution below is clearly separated into nine components (as explained above) with the strongest frequency at base temperature occurring at =2.4 MHz. This refers to an internal field of 0.18 kOe with a small field distribution (gaussian width) of MHz mOe. Above , the nine frequency components collapse into a broad peak (fig. 8b). To further understand the distribution of the field in this region two spectra, namely 4.8 K and 5 K, have been fitted by considering one, two and three Gaussian terms respectively with 3-Gaussian (fig. 7h,i) resulting in a best fit. This model also sufficiently describes all the temperatures between (). For consistency, the broad field distribution in this range has also been analyzed using a zeroth order Bessel function that points to an incommensurate spin density wave model [26]. The resulting was found to be 2.6 clearly indicating that the model is not applicable in SrCuTe2O6 . With increasing temperature the broad Gaussian gradually moves to smaller frequencies and completely vanishes above the highest transition at K.
We may attribute the origin of these frequencies to a composite of the muon sites around three inequivalent Oxygen sites (Tab. 1) (with three Cu-O bond lengths: 1.939 Å, 1.943 Å and 3.086 Å) and local spin directions of the 12 Cu moments with respect to the incoming spin. However, a confirmation of the same requires a detailed calculation of muon sites based on the Coulomb potential. Nevertheless, the ZF-SR data clearly reveal two different magnetic phases with distinguishing internal field distributions in zero-field.
II.3 Magnetic structure
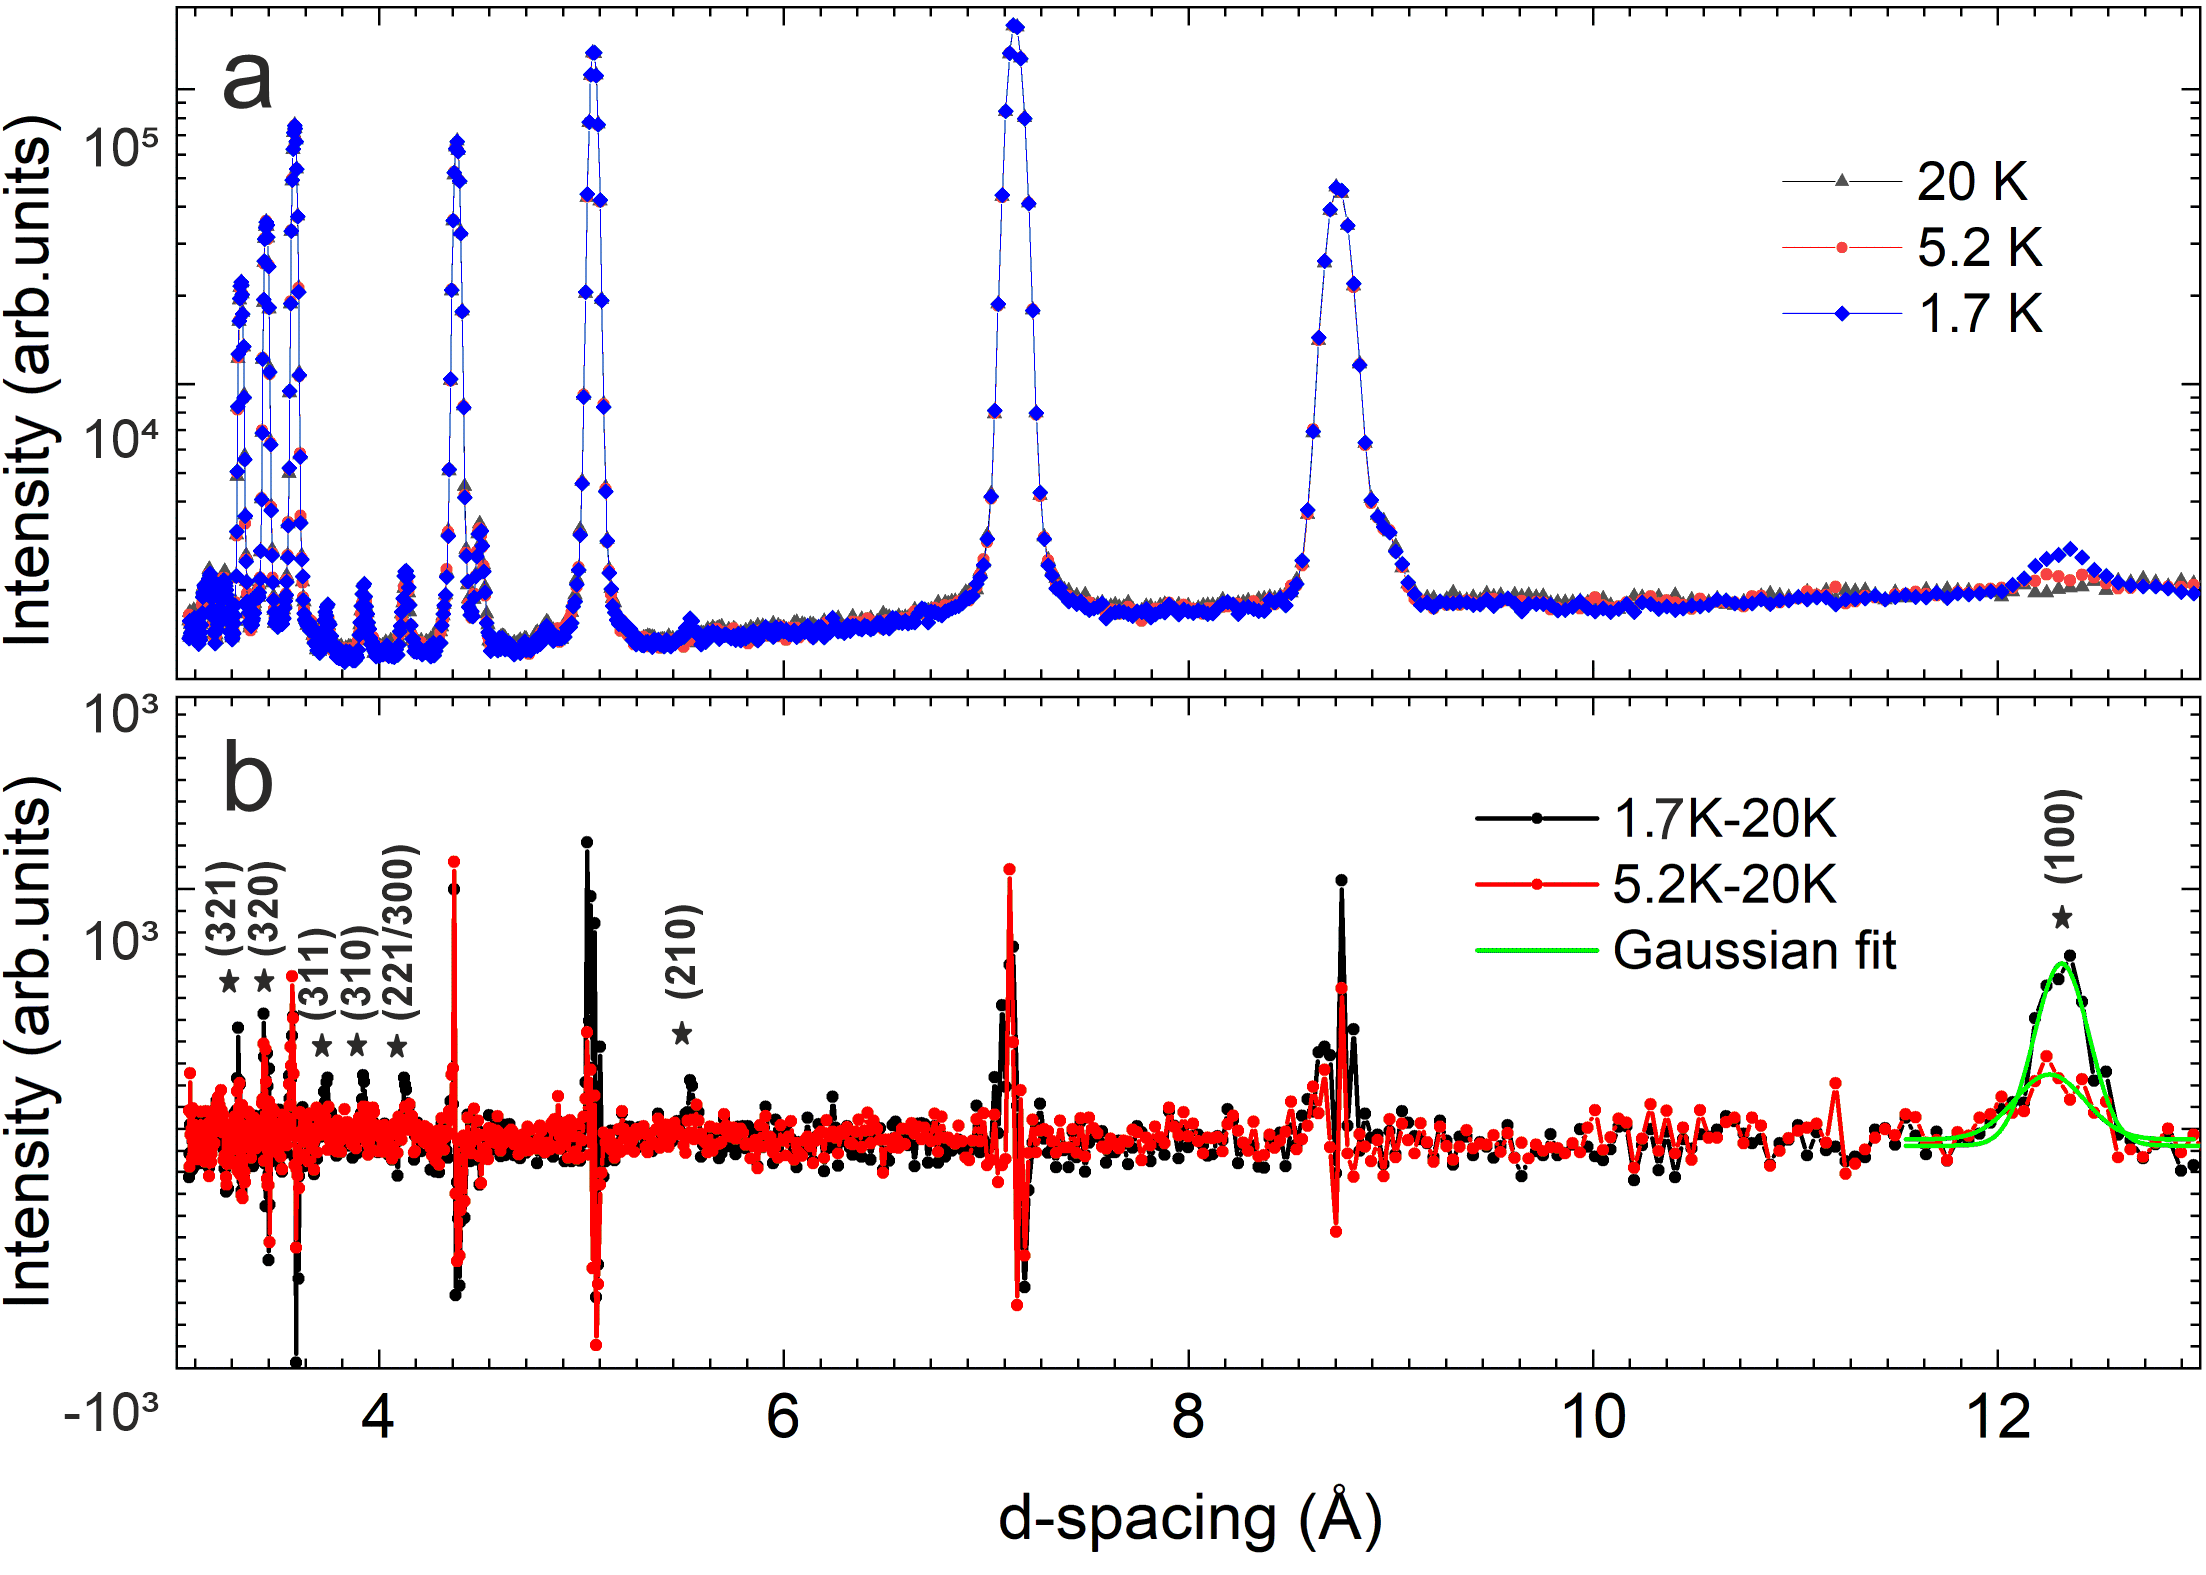
To investigate the magnetic structure of SrCuTe2O6 in the ground state, i.e., below K, several powder diffraction patterns are obtained between temperatures 1.7 K and 7 K. Representative low temperature diffraction patterns of SrCuTe2O6 obtained on the DMC diffractometer are plotted in fig. 9a for a polycrystalline sample at the base temperature 1.7 K, in the intermediate magnetic phase at 5.2 K and in the paramagnetic state at 20 K. These patterns reveal that the nuclear structure of the SrCuTe2O6 remains unchanged even below the magnetic transition. Additionally, a new Bragg peak is observed at Å corresponding to the (1,0,0) reflection below the magnetic transition at 1.7 K. The patterns subtracted from data at high temperature (see fig. 9b) clearly shows that the (100) peak survives even at 5.2 K. Furthermore, Gaussian fit of the peak (solid green line in fig. 9b) reveals that its position and FWHM remain unchanged within the error bars at the two temperatures (0.41 0.08 Å and 0.32 0.03 Å respectively for 5.2 K and 1.7 K). The subtracted patterns also reveal additional magnetic intensities clearly visible on the weak nuclear peaks (2,1,0), (3,0,0)+(2,2,1), (3,1,0) and (3,1,1) at the d-spacing of 5.6 Å, 4.2 Å, 4 Å and 3.8 Å respectively. However, the contribution of magnetic intensity on the strong nuclear peaks is ambiguous. Although the structural peaks at (2h+1,0,0) are allowed for the primitive type of unit cell, the four-fold screw symmetry of space group P4132 forbids these peaks while allowing only those with hn. Therefore, the magnetic propagation vector can be identified as .
Representation analysis for the propagation vector (0,0,0) reveals that the reducible magnetic representations () associated with the 12d Wyckoff position of Cu decomposes into direct sum of five irreducible representations (IRs) denoted as (). We use superscript to indicate dimensionality of the IRs:
| (6) |
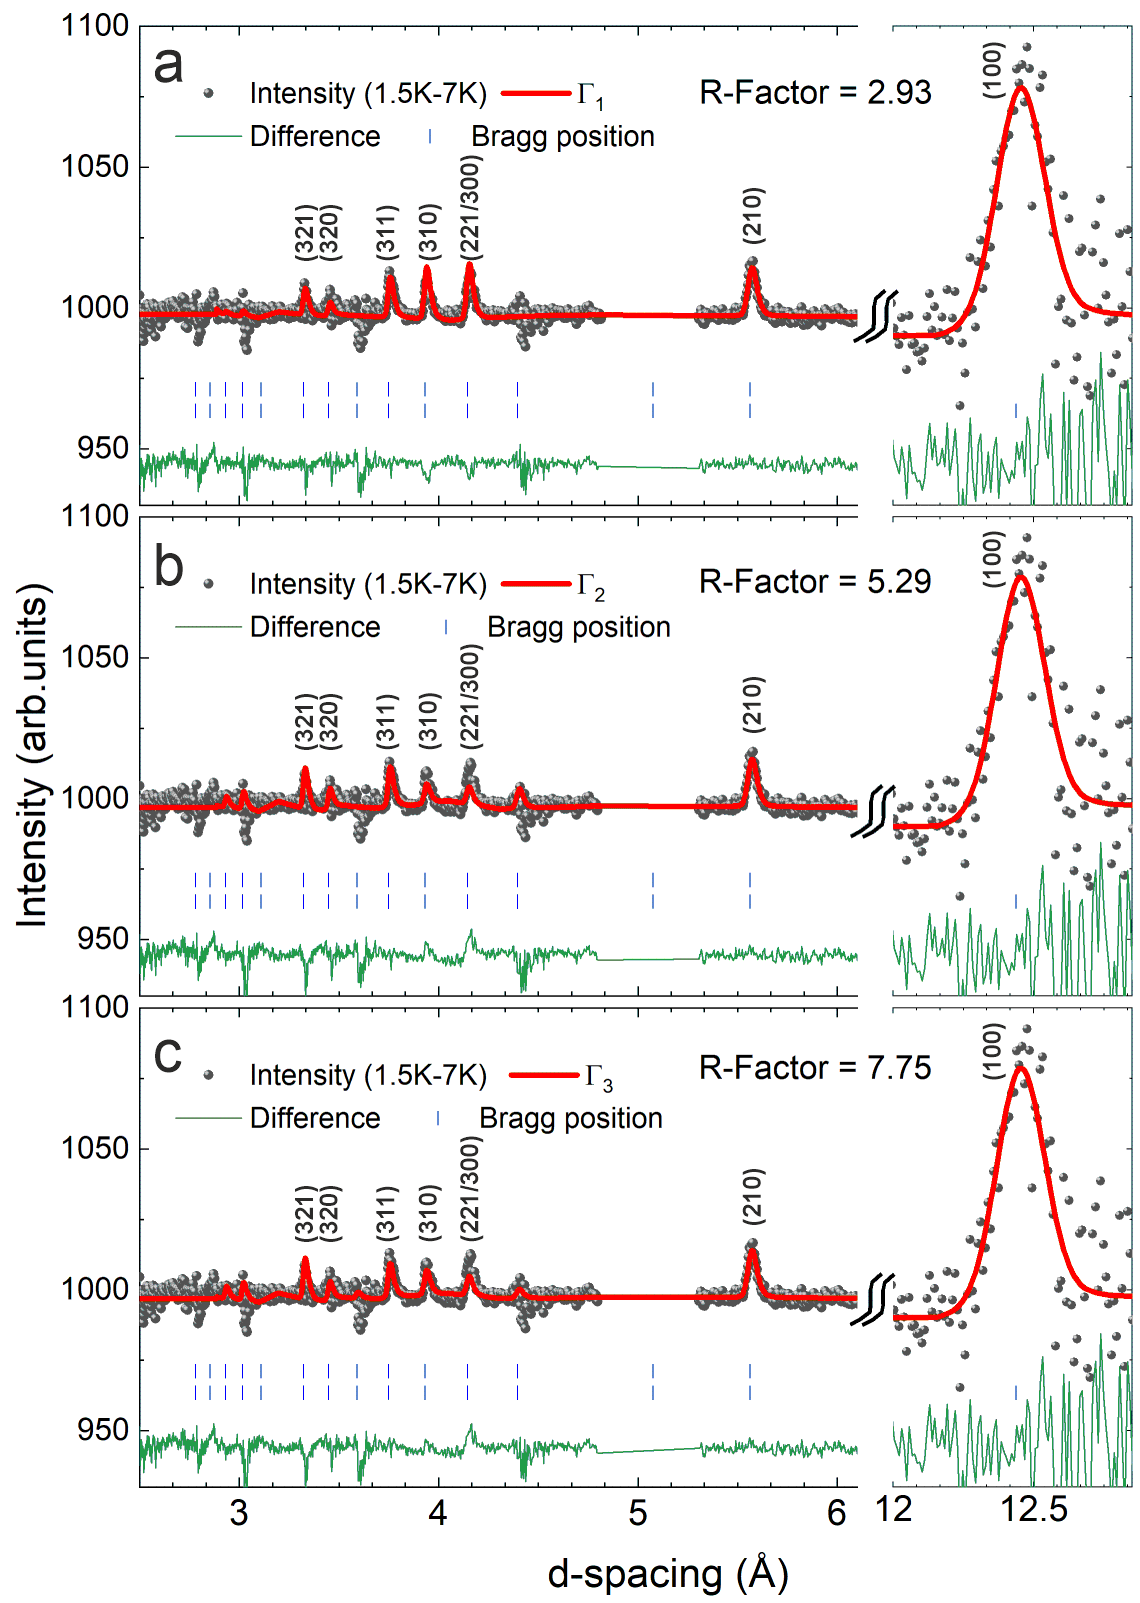
Following the standard approach, the solution of the magnetic structure was searched assuming a single IR (irreducible magnetic order parameter). For the three-dimensional IRs and , only high-symmetry combinations of the basis functions corresponding to maximal isotropy subgroups [27], were tested. The low-symmetry magnetic structures require a strongly first order phase transition and are unlikely from the thermodynamic point of view. The systematic absence of the (2h,0,0) magnetic reflections is inconsistent with the and IRs, while discrimination between , and were more challenging. As the changes on the strong nuclear peaks such as (1,1,0), (1,1,1) and (2,1,1) are not clear, these regions are excluded from the analysis while refining the magnetic structure. For this we used high intensity datasets collected on the WISH time-of-flight diffractometer. The magnetic intensity was obtained by subtracting the 7K data from the 1.5 K dataset.
Figure. 10a-c show individual refinements of the magnetic peaks for IRs , and respectively. All the three representations reproduce the strongest magnetic peak (100) (at d=12.438Å) very well with the differences in fit quality appearing only at high-Q peaks such as (2,2,1)+(3,0,0) ( Å) and (3,1,0) ( Å) resulting in a best magnetic Bragg-factor (2.93) from the first IR, . The corresponding magnetic structure implies the cubic magnetic symmetry P4132 (213.63) with the basis and origin defined with respect to the paramagnetic space group as: (1,0,0), (0,1,0), (0,0,1) and (-1/4,-1/4,-1/4), respectively. In this magnetic structure, each of the Cu-spins is aligned along a local (1,1,0) direction. Here, the third nearest neighbours of Cu2+ forms antiferromagnetic spin- chains running along the three mutually perpendicular crystallographic a-, b- and c- axes. Furthermore, we observe two parallel chains per cubic direction, as shown in fig. 11a for chains along a- axis, whose spins take on two perpendicular spin directions in the b-c plane, (0,1,1) and (0,1,-1). This results in a total of 6 spin directions in the ordered state of SrCuTe2O6 so that the frustrated first nearest-neighbour interaction forms co-planar 120∘ triangles as shown fig. 11b. Although these triangles are isolated from each other, spins on the vertices of the every triangle participates in coupling the three perpendicular spin-chains leading to three dimensional magnetic order in the system. It is clear that the rather than the hyperkagome interactions , are responsible for the inter-chain coupling.
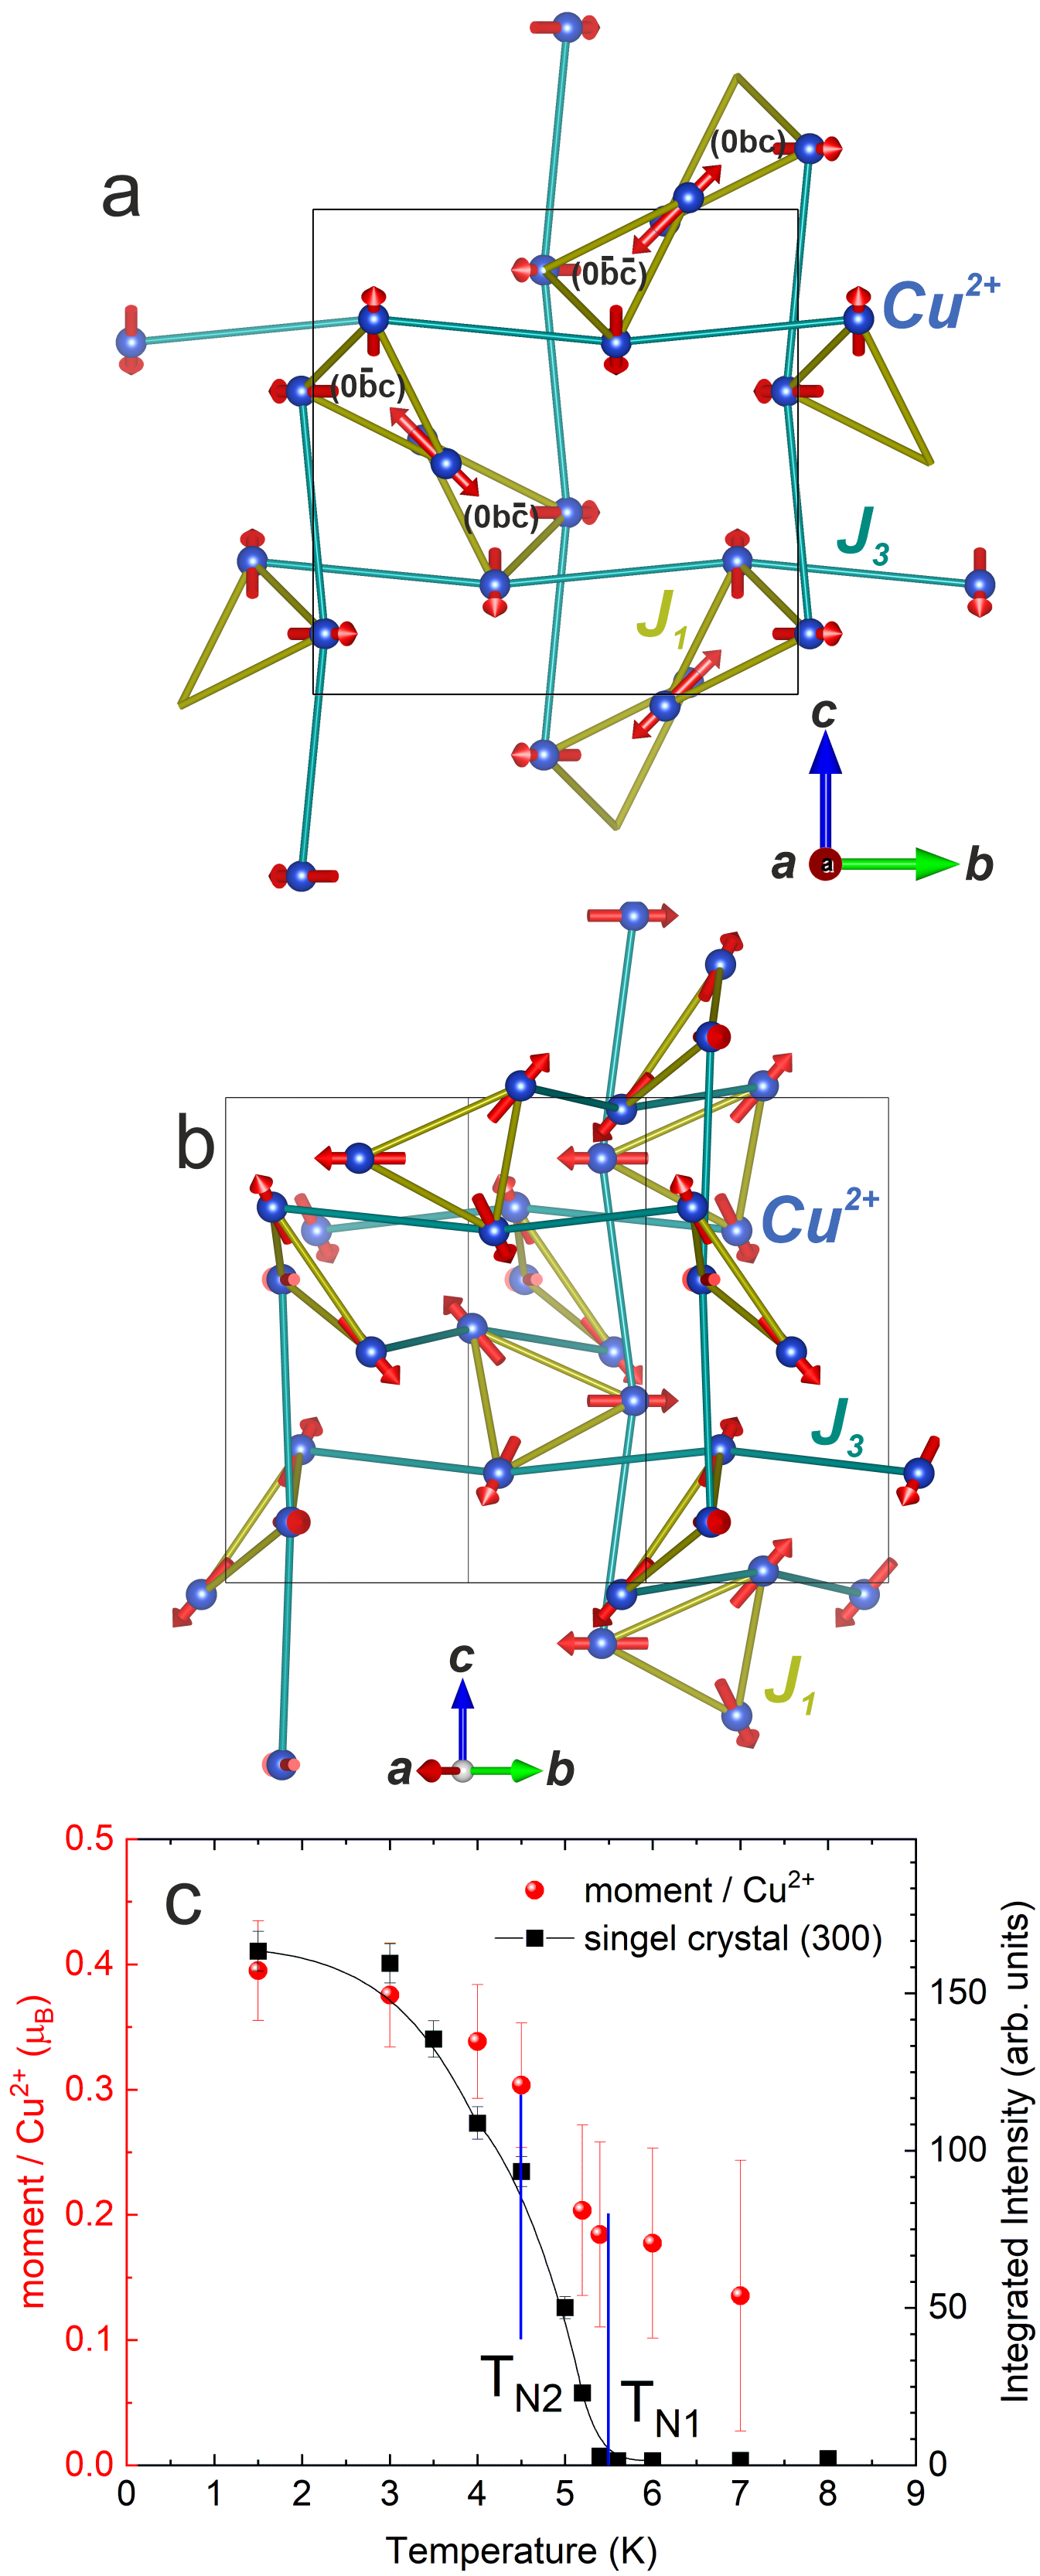
We observe that the magnetic propagation vector remains unchanged even in the intermediate phase within the instrumental resolution. Therefore, the pattern in this temperature range is also refined by the same magnetic structure resulting from . Figure. 11c shows the evolution of Cu2+ moments as a function of temperature which reaches a maximum ordered moment of 0.4 at 1.6 K. The total ordered moment calculated by Schulz et al., [28] for Heisenberg spin-1/2 chain with interchain coupling Jinter using mean-field-theory is given as:
| (7) |
which yields a value of for SrCuTe2O6 considering K and K. While this value is consistent with the experimental moment at the base temperature, it also confirms the presence of weak antiferromagnetic inter-chain coupling responsible for the loss of 60% of full moment expected for fully ordered Cu2+ spin as would be found in a 3D ferromagnet. As the error bars of the moment obtained from powder diffraction are high, we have also followed the intensity of the magnetic Bragg peak (300) in the single crystal of SrCuTe2O6 (right y-axis of fig. 11c) which clearly indicates a non-zero intensity below the first magnetic transition K. However, no significant changes are observed at the lower transition K.
Discussion
The magnetic, thermodynamic properties and SR measurements clearly identify two magnetic phases in SrCuTe2O6 in zero field at 5.5 K and 4.5 K. The low temperature phase (Phase-I in fig. 6) below is described by a co-planar 120∘ structure of the Cu spins coupling three mutually perpendicular AF chains so that each of the spins points along a local (110) direction as explained in the sec. II.3. The intermediate phase (phase-II in fig. 6) between and is associated with broad local field distribution around the muon site. However, we note that there is no indication for an incommensurate spin structure as the field distribution is always Gaussian-like pointing to a homogenous local internal field instead of continuous fields centered around 0 T expected for a helical/chiral spin structure or spin density wave type of modulation [26, 29].
The preferential local (110) direction of the spin structure in the ground state is also apparent in the H-T phase diagram. When the field is applied along (110) direction i.e., parallel to one of the local ordered spin directions, five different phases can be identified. Whereas field along (111) and (100) result in four and three phases respectively as shown in fig. 6. While heat capacity data reveals sharp peaks at the phase boundaries in all the three directions (see see fig. 5), the changes in magnetization are sharpest along (100) direction (see fig. 4) and weakest along the (110) direction suggesting that the latter is also a preferred magnetization direction. Additionally, the presence of phase-IV along (111) also reveals its component along the preferred (110) direction. However, the boundary of the paramagnetic phase (above ) to phase-III in all the three directions is weak compared to that of paramagnetic to phase-I revealing that phase-III consists of weak ferromagnetic behaviour due to canting of the spins along applied field.
The small ordered moment in the ground state (only 40% of each spin orders in zero field) indicates that the spins are either highly frustrated or highly one dimensional. If the former, strong frustration would imply a strong hyperkagome interaction which would be incompatible with the antiferromagnetic alignment in the chains and an incommensurate magnetic order might be expected in the ground state. However, the SR and diffraction experiments rule out this possibility. Furthermore, we find that only 10% of the magnetic entropy is released at the magnetic transition while the other 90% is recovered below 40 K where one-dimensional magnetism is relevant, revealing that the is weak and possibly its net effect is cancelled. Whereas in the latter case, the chain interaction is strong and dominates the magnetic structure giving rise to the antiferromagnetic chain, while the weaker triangle interaction which is compatible with this order, couples mutually perpendicular chains together into a 120∘ spin arrangement.
This observation is clearly in contrast to the strong frustration observed in PbCuTe2O6 due to the hyper-hyperkagome interactions (where the and interactions are dominant, antiferromagnetic and of equal strength.) [12] despite the structural similarity. However, some differences between these two compounds still remain in the form of bond angles responsible for the super-exchange pathways as proposed by Koteswararao et al. [16]. For instance the ratio of bond angles responsible for (Sr: 92.5∘, Pb: 97∘) and (Sr: 162.2∘, Pb: 156∘), Jangle/Jangle, is 9% higher in PbCuTe2O6 compared to SrCuTe2O6 . In addition, the extra lone-pair in PbCuTe2O6 might play a key role in the weaker chain interaction due to the hybridization of the Pb-O bonds, involved in the superexchange path (O-Pb2-O), that may have extra strain effects as in ferroelectric perovskite systems [30]. Confirmation of this needs a detailed investigation into the electronic band structure of both the systems, which is beyond the scope of this work.
Koteswararao et al. [18] find magnetoelectric effects in the form of electric polarization at magnetic transitions in SrCuTe2O6 in an applied magnetic field manifesting a strong coupling between magnetism and lattice. The field-induced polarization also resulted in a similar phase diagram as that of the magnetic phase transitions observed in polycrystalline and crystalline (100) directions as a function of field. It would therefore not be surprising if antiferromagnetic order also influenced the structure so that structural changes occur at the transitions to the long-range magnetic order. These changes are likely to be much smaller in zero field such as symmetry allowed displacements which retain the nuclear space group. Hence, no visible changes were observed on the nuclear peaks in the powder diffraction patterns. However, heat capacity results in field (see fig. 5) reveal a sharper -anomaly above 3 T at , consistent with the field induced electric polarization. Therefore, investigation of magnetic structure of SrCuTe2O6 in an external field would give insight into the origin of the spin-lattice coupling.
Summary
In summary, we have studied magnetic properties of SrCuTe2O6 in polycrystalline and single crystal samples and investigated the magnetic structure. The field-dependent phase diagram in single crystals reveals additional magnetic phases for the (110), (111) directions whereas the (100) direction replicates the phase diagram of the polycrystalline sample. We propose a magnetic structure of SrCuTe2O6 where, acts as an inter-chain coupling to the AF chains formed by leading to three dimensional magnetic ordering in the system below .
Note: As this paper was being finalized we became aware of a similar investigation of SrCuTe2O6 on arXiv [31]. While there are some differences in the techniques employed, the results of that paper are in broad agreement with this paper.
Acknowledgements
S.C thanks M. Reehuis for discussion on the magnetic symmetry analysis, J. Schröter, K. Siemensmeyer and R. Feyerherm for supporting the thermodynamic and magnetometry measurements. B.L acknowledges the support of the Deutsche Forschungsgemeinschaft (DFG) through the project B06 of the SFB-1143 (ID:247310070). We acknowledge the support of the HLD at HZDR, member of the European Magnetic Field Laboratory (EMFL).
References
- Han et al. [2012] T.-H. Han, J. S. Helton, S. Chu, D. G. Nocera, J. A. Rodriguez-Rivera, C. Broholm, and Y. S. Lee, Nature 492, 406 (2012).
- Balz et al. [2016] C. Balz, B. Lake, J. Reuther, H. Luetkens, R. Schönemann, T. Herrmannsdörfer, Y. Singh, A. T. M. N. Islam, E. M. Wheeler, J. A. Rodriguez-Rivera, T. Guidi, G. G. Simeoni, C. Baines, and H. Ryll, Nature Phys. 12, 942 (2016).
- Benton et al. [2012] O. Benton, O. Sikora, and N. Shannon, Phys. Rev. B 86, 075154 (2012).
- Gingras and McClarty [2014] M. J. P. Gingras and P. A. McClarty, Rep. Prog. Phys. 77, 056501 (2014).
- Clark et al. [2014] L. Clark, G. J. Nilsen, E. Kermarrec, G. Ehlers, K. S. Knight, A. Harrison, J. P. Attfield, and B. D. Gaulin, Phys. Rev. Lett. 113, 117201 (2014).
- Higo et al. [2017] T. Higo, K. Iritani, M. Halim, W. Higemoto, T. U. Ito, K. Kuga, K. Kimura, and S. Nakatsuji, Phys. Rev. B 95, 174443 (2017).
- Chamorro et al. [2018] J. R. Chamorro, L. Ge, J. Flynn, M. A. Subramanian, M. Mourigal, and T. M. McQueen, Phys. Rev. Materials 2, 034404 (2018).
- Durand et al. [2008] A. M. Durand, Klavins, and L. R. Corruccini, Journal of Physics: Condensed Matter 20, 235208 (2008).
- Zhou et al. [2008] Y. Zhou, P. A. Lee, T.-K. Ng, and F.-C. Zhang, Phys. Rev. Lett. 101, 197201 (2008).
- Bergholtz et al. [2010] E. J. Bergholtz, A. M. Läuchli, and R. Moessner, Phys. Rev. Lett. 105, 237202 (2010).
- Dally et al. [2014] R. Dally, T. Hogan, A. Amato, H. Luetkens, C. Baines, J. Rodriguez-Rivera, M. J. Graf, and S. D. Wilson, Phys. Rev. Lett. 113, 247601 (2014).
- Chillal et al. [2020] S. Chillal, Y. Iqbal, H. O. Jeschke, J. A. Rodriguez-Rivera, R. Bewley, P. Manuel, D. Khalyavin, P. Steffens, R. Thomale, A. T. M. N. Islam, J. Reuther, and B. Lake, Nat. Comm. 11, 2348 (2020).
- Koteswararao et al. [2014] B. Koteswararao, R. Kumar, P. Khuntia, S. Bhowal, S. K. Panda, M. R. Rahman, A. V. Mahajan, I. Dasgupta, M. Baenitz, K. H. Kim, and F. C. Chou, Phys. Rev. B 90, 035141 (2014).
- Khuntia et al. [2016] P. Khuntia, F. Bert, P. Mendels, B. Koteswararao, A. V. Mahajan, M. Baenitz, F. C. Chou, C. Baines, A. Amato, and Y. Furukawa, Phys. Rev. Lett. 116, 107203 (2016).
- Wulff and Müller-Buschbaum [1997] L. Wulff and H. Müller-Buschbaum, Zeitschrift für Naturforschung B 52, 1341 (1997).
- Koteswararao et al. [2015] B. Koteswararao, S. K. Panda, R. Kumar, K. Yoo, A. V. Mahajan, I. Dasgupta, B. H. Chen, K. H. Kim, and F. C. Chou, Journal of Physics: Condensed Matter 27, 426001 (2015).
- Ahmed et al. [2015] N. Ahmed, A. A. Tsirlin, and R. Nath, Phys. Rev. B 91, 214413 (2015).
- Koteswararao et al. [2016] B. Koteswararao, , K. Yoo, F. C. Chou, and K. H. Kim, APL Materials 4, 036101 (2016).
- Schefer et al. [1990] J. Schefer, P. Fischer, H. Heer, A. Isacson, M. Koch, and R. Thut, Nuclear Instruments and Methods in Physics Research Section A: Accelerators, Spectrometers, Detectors and Associated Equipment 288, 477 (1990).
- Chapon et al. [2011] L. C. Chapon, P. Manuel, P. G. Radaelli, C. Benson, L. Perrott, S. Ansell, N. J. Rhodes, D. Raspino, D. Duxbury, E. Spill, and J. Norris, Neutron News 22, 22 (2011).
- Rodríguez-Carvajal [1993] J. Rodríguez-Carvajal, Physica B: Condensed Matter 192, 55 (1993).
- Aroyo et al. [2011] M. I. Aroyo, J. M. Perez-Mato, D. Orobengoa, E. Tasci, G. de la Flor, and A. Kirov, Bulg. Chem. Comm. 43, 183 (2011).
- Eggert et al. [1994] S. Eggert, I. Affleck, and M. Takahashi, Phys. Rev. Lett. 73, 332 (1994).
- Johnston et al. [2000] D. C. Johnston, R. K. Kremer, M. Troyer, X. Wang, A. Klümper, S. L. Bud’ko, A. F. Panchula, and P. C. Canfield, Phys. Rev. B 61, 9558 (2000).
- Klümper [1998] A. Klümper, Eur. Phys. J. B 5, 677 (1998).
- Savici et al. [2002] A. T. Savici, Y. Fudamoto, I. M. Gat, T. Ito, M. I. Larkin, Y. J. Uemura, G. M. Luke, K. M. Kojima, Y. S. Lee, M. A. Kastner, R. J. Birgeneau, and K. Yamada, Phys. Rev. B 66, 014524 (2002).
- Campbell et al. [2006] B. J. Campbell, H. T. Stokes, D. E. Tanner, and D. M. Hatch, Journal of Applied Crystallography 39, 607 (2006).
- Schulz [1996] H. J. Schulz, Phys. Rev. Lett. 77, 2790 (1996).
- Yaouanc et al. [2017] A. Yaouanc, P. Dalmas de Réotier, A. Maisuradze, and B. Roessli, Phys. Rev. B 95, 174422 (2017).
- Cohen [1992] R. E. Cohen, Nature 358, 136 (1992).
- Saeaun et al. [2020] P. Saeaun et al., Arxiv (2020).