The absolute proper motions of the Arches and Quintuplet clusters
Abstract
Arches and Quintuplet are two young, massive clusters projected near the Galactic Center. To date, studies focused on understanding their origin have been based on proper motions (PMs) derived in the clusters’ reference frames and required some assumptions about their 3D motion. In this paper, we combine public PM catalogs of these clusters with the Gaia DR2 catalog and, for the first time, transform the relative PMs of the Arches and Quintuplet clusters onto an absolute reference system. We find that the absolute PM of the Arches is mas yr-1, and that of the Quintuplet is mas yr-1. These values suggest that these systems are moving almost parallel to the Galactic plane. A measurement of the clusters’ distances is still required to meaningfully constrain the clusters’ orbits and shed light on the origin of the Arches and Quintuplet.
keywords:
Galaxy: center – Galaxy: open clusters and associations: individual: Arches – Galaxy: open clusters and associations: individual: Quintuplet – Proper motions1 Introduction
The Galactic Center (GC) represents a unique ecosystem in our Galaxy. Indeed, despite the harsh environment around the supermassive black hole Sgr A*, at least three young, massive clusters and several massive isolated stars are present in the region. The recent star formation suggested by the presence of these objects is still a conundrum. Either “in-situ” or “accreted” formation scenarios have been proposed so far, but the observational pieces of information at our disposal cannot firmly rule out either of these theories (see, e.g., the review of Genzel, Eisenhauer & Gillessen, 2010, and references therein).
Two of the most studied among these young objects are the Arches and Quintuplet clusters. Arches and Quintuplet (2.5 Myr and 4 Myr, respectively Najarro et al., 2004; Figer, McLean & Morris, 1999a) are massive (; e.g., Figer et al., 1999b; Harfst, Portegies Zwart & Stolte, 2010) clusters located close to the Galactic plane at a projected distance of about 20–30 pc from the GC. Where these clusters formed and how they have survived in such a dense region is, however, still a puzzle.
In order to find the exact birth sites of the Arches and Quintuplet clusters, it is necessary to compute their orbits backward in time. The computation of an orbit requires six kinematic coordinates: position, distance, proper motion (PM) and radial velocity (RV). For these clusters, three of them (position and RV) are known. While the distance is still the most difficult observable piece of information to obtain, the PMs of Arches and Quintuplet clusters have been measured in the past by different authors (e.g., Clarkson et al., 2012; Stolte et al., 2014, 2015; Hosek et al., 2019; Rui et al., 2019, and references therein).
The orbits of the Arches and Quintuplet clusters presented to date are, however, based on the relative PM between cluster stars and field objects, and are based on the assumption that field stars are on average at rest with respect to the GC. Furthermore, the field-star distribution in the vector-point diagram (VPD) is often modeled with a single 2D-Gaussian distribution, a representation that cannot properly describe the true, complex kinematic scene in the GC region. These assumptions can result in large systematic errors and lack of accuracy.
In this paper, we take advantage of the Gaia Data Release 2 (DR2, Gaia Collaboration et al., 2016, 2018) catalog and compute the first estimate of the absolute PMs of the Arches and Quintuplet clusters by transforming the public relative PMs of Stolte et al. (2015, hereafter S15) onto an absolute reference frame. We also briefly investigate some orbits implied by the absolute PMs of these objects, and discuss their possible origin site (Appendix B).
2 Data sets
We made use of the catalogs of S15, to which we refer for a complete description of the data reduction. PMs were derived by means of multi-epoch (3–5 yr of temporal baseline) -filter images obtained with the NAOS-CONICA (NACO) system at the VLT. PMs were computed relative to the bulk motion of the clusters, i.e., the average motion of cluster stars in the VPD is consistent with zero, while Bulge and Disk stars are located in different parts of the VPD111We compared the VPDs obtained with the catalogs of S15 with VPDs presented in other papers focused on the Arches and Quintuplet clusters (e.g., Hosek et al., 2019; Rui et al., 2019) and with those obtained from the Gaia DR2 catalog. We found that the PM distribution of the field stars along the direction obtained with the S15 catalogs has an opposite sign from what is expected for Disk/Bulge stars in these fields. Therefore, we changed the sign of in the catalogs of S15..
As described in S15, all images of a given epoch were initially combined with the drizzle method (Fruchter & Hook, 2002) without applying any geometric distortion correction. The positions of the stars measured in these stacked images of each epoch were then transformed onto the reference frame of the first epoch by means of second-order polynomial functions, which should solve for the relative rotation, offset, scale and distortion between the frames.
Habibi (2014) and S15 stated that there is not a uniform distortion solution for the NACO detector because it depends on the isoplanatic angle and on the adaptive-optics correction. According to S15, the relative astrometric uncertainties were minimized in their paper thanks to the small-dither offsets between images and by keeping the same observational setup in all epochs. Furthermore, the usage of second-order polynomials to transform the positions between frames had probably absorbed part of the distortion.
Plewa et al. (2015) solved for the distortion of NACO detector in the same configuration as that used by S15. The typical distortion of this camera is of 0.2 pixel ( mas), but it can be as large as 0.7 pixel ( mas) in the lower-left corner of the detector.
The analysis and correction of possible systematics in the PMs of S15 is not straightforward. The transformations between frames were computed by using cluster stars. This means that we need to analyze the PM of cluster members to detect possible systematic errors in the PMs. However, the identification of cluster stars in the VPD is not always unambiguous, especially in the outer fields of the two clusters where most of the stars considered in the analysis in Sect. 3 are located. Therefore, we chose to compute the absolute PMs of Arches and Quintuplet clusters by using the original PMs of S15.
3 The absolute PMs of Arches and Quintuplet clusters
Relative PMs can be directly converted into an absolute reference system by zero-pointing them to the PMs of very-distant objects like quasars or galaxies (e.g., Libralato et al., 2018a), or indirectly by relying on external catalogs. The former approach is not feasible toward the GC because of the high extinction.
We derived the first estimate of the absolute PMs of the Arches and Quintuplet clusters by linking the relative PMs of S15 to an absolute reference system using the Gaia DR2 PMs. The depth of the Gaia catalog toward regions of high extinction like the GC is a few kpc, which means that the only stars in common between S15 and Gaia are Disk stars (as shown in the CMDs in Figs. 2 and 2).
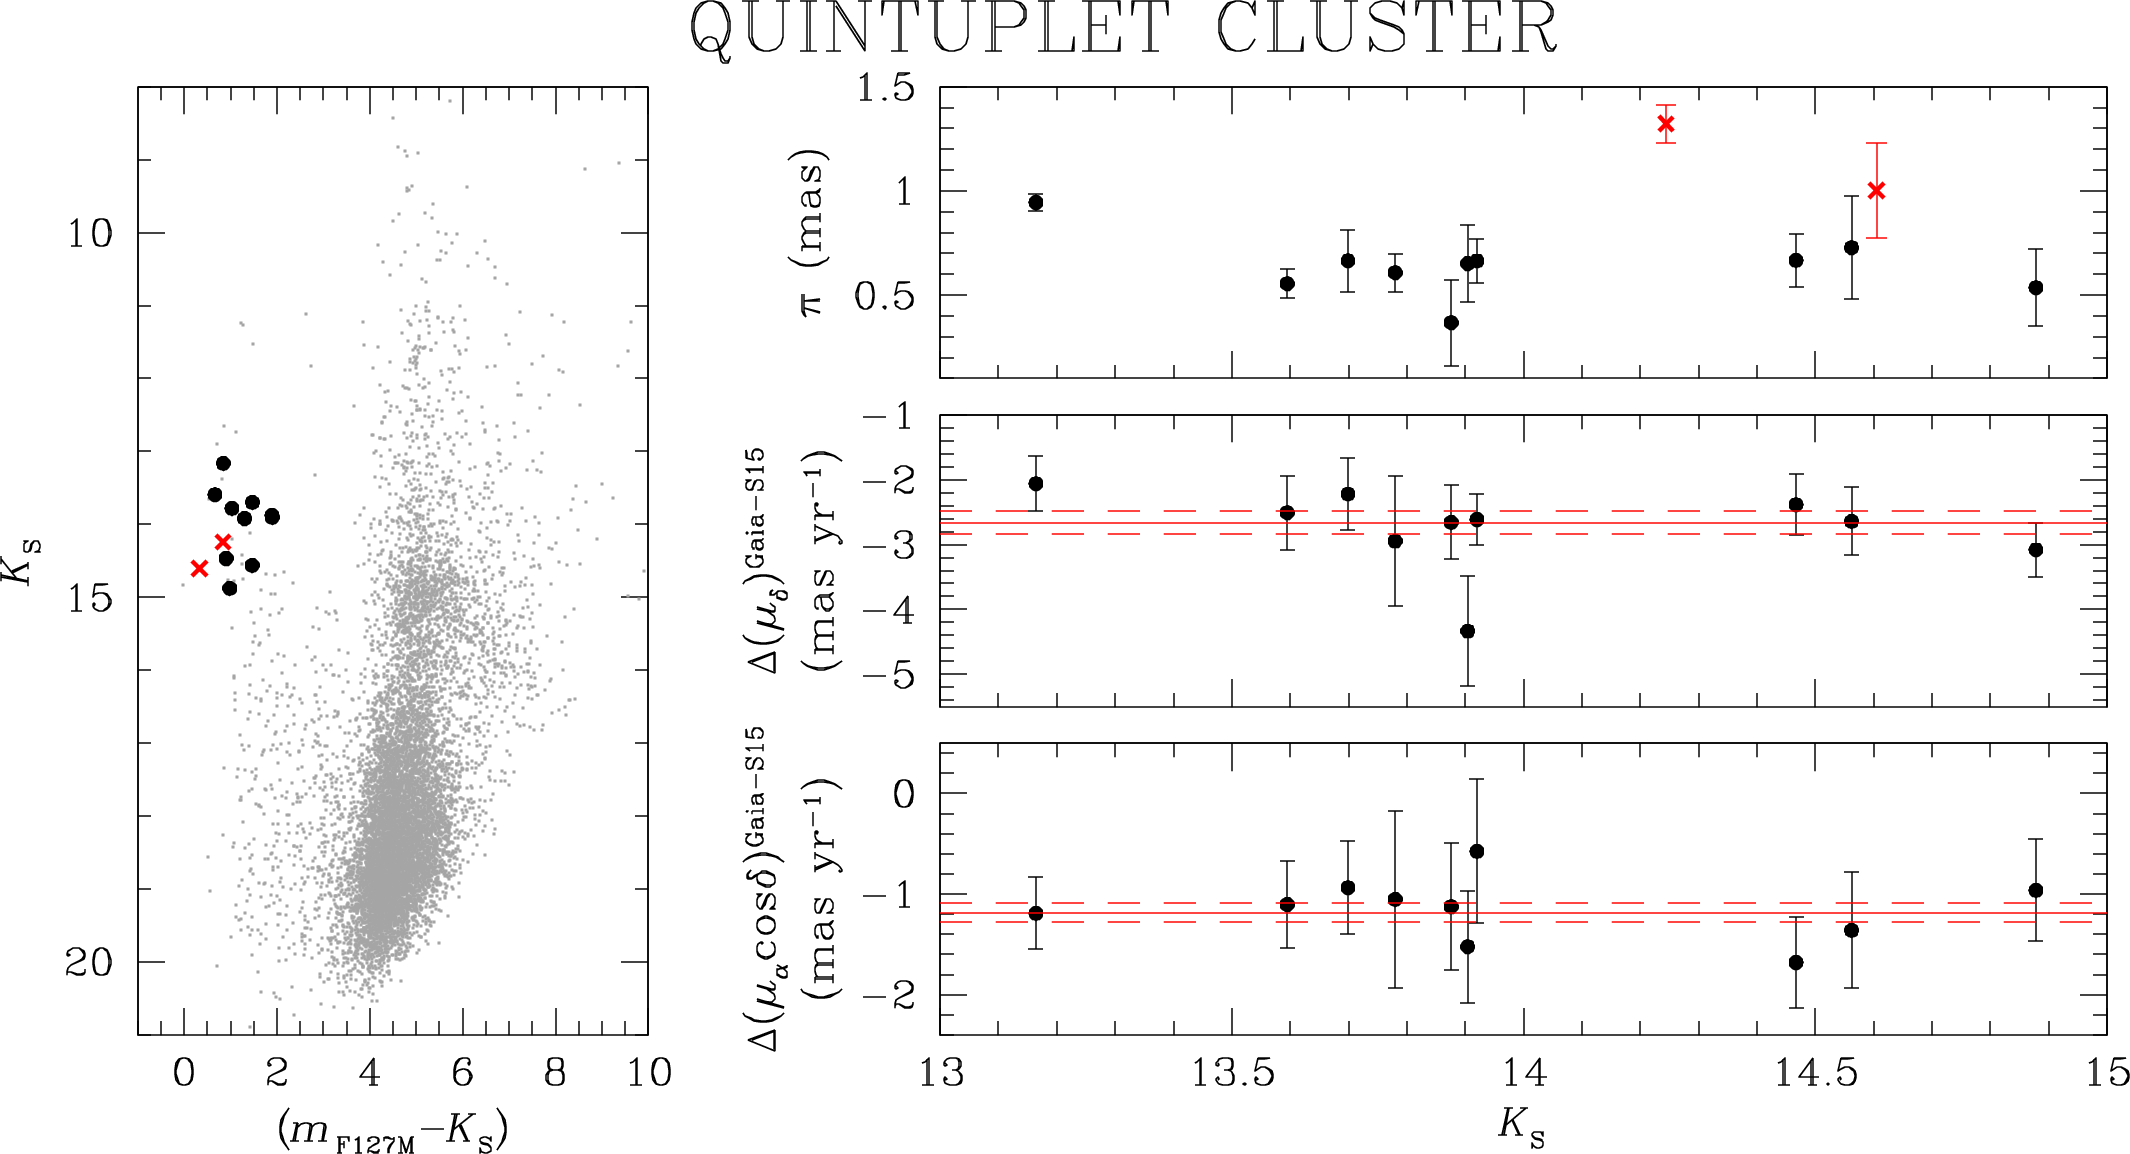
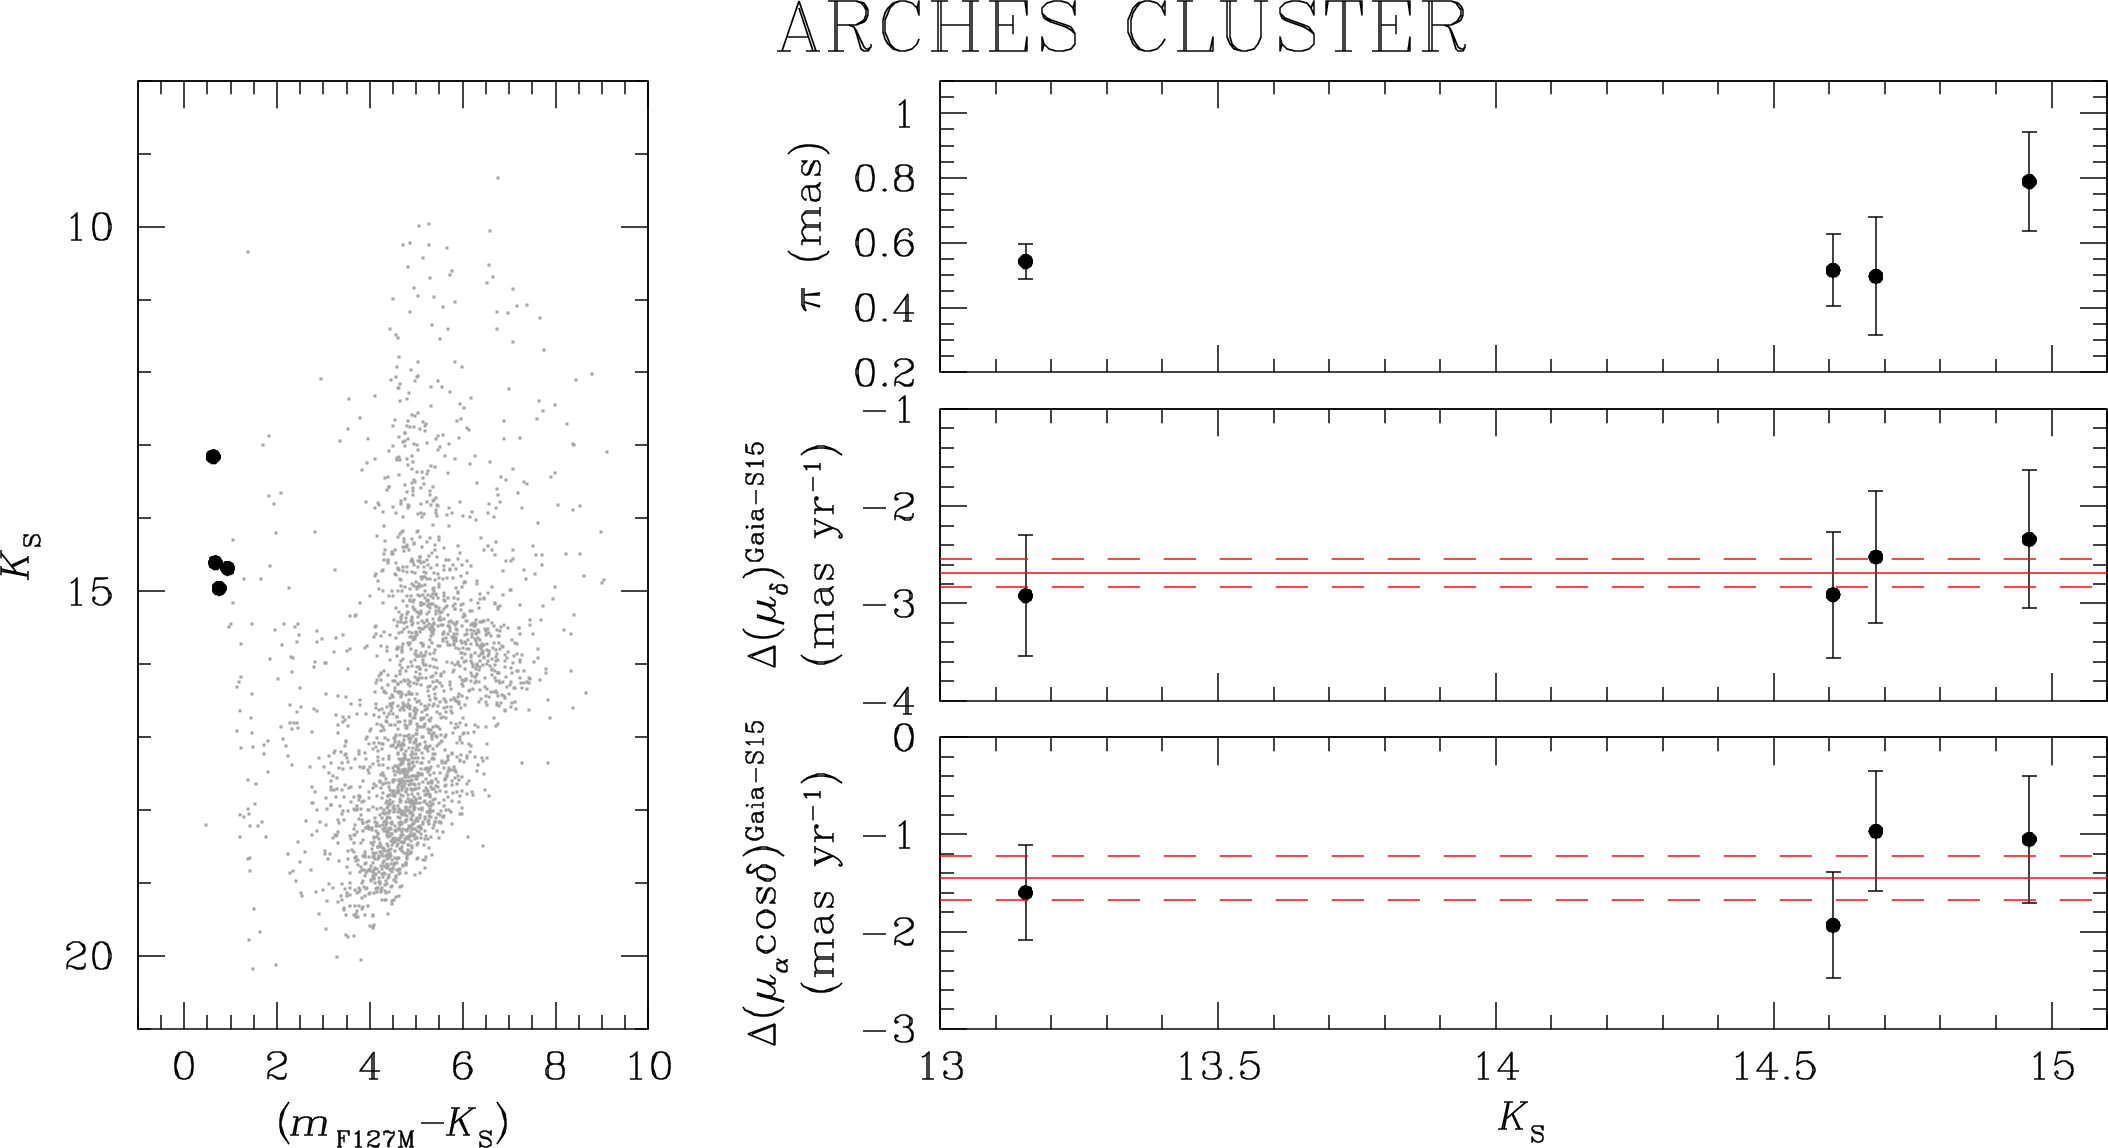
We considered in the analysis stars in the Gaia DR2 catalog that have a PM error in both coordinates lower than 1.0 mas yr-1 and are brighter than . We excluded stars in the S15 catalogs that are brighter than (very bright stars suffer from non-linearity effects in the NACO data), fainter than (the same magnitude threshold adopted by S15 to select reference stars in the PM computation) or have a PM error greater than 1.0 mas yr-1 in either coordinates. For the Arches cluster, we also excluded all stars in their outermost field “2”, which is not part of the NACO mosaic, where the number of cluster stars is low and the high fraction of field stars might have biased the computation of the relative PMs. After these selections, we ended up with four and twelve Gaia stars in common with the Arches and Quintuplet catalogs, respectively.
Finally, to keep the two samples as homogeneous as possible, we additionally excluded stars with a parallax larger than 1 mas (distance from the Sun smaller than 1 kpc). The surviving four and ten stars in the Arches and Quintuplet catalogs, respectively, have a distance from the Sun between 1 and 2.8 kpc (see top-right panels in Figs. 2 and 2).
We computed the 3.5-clipped weighted average difference between Gaia and S15 PMs (middle- and bottom-right panels in Figs. 2 and 2). The weights are defined as the sum in quadrature of Gaia and S15 PM errors. Since the PMs of S15 are relative to the bulk motion of the clusters, these Gaia-S15 weighted-average PM differences are the absolute PMs of the Arches and Quintuplet clusters. We find:
| (1) |
| (2) |
These PMs represent the first estimate of the absolute PMs of the Arches and Quintuplet clusters. The quoted errors are the standard errors of the mean of the Gaia-S15 PM difference. We have not included the effects of the systematic errors in the Gaia DR2, as these are significantly smaller than the statistical errors calculated here (Lindegren et al., 2018).
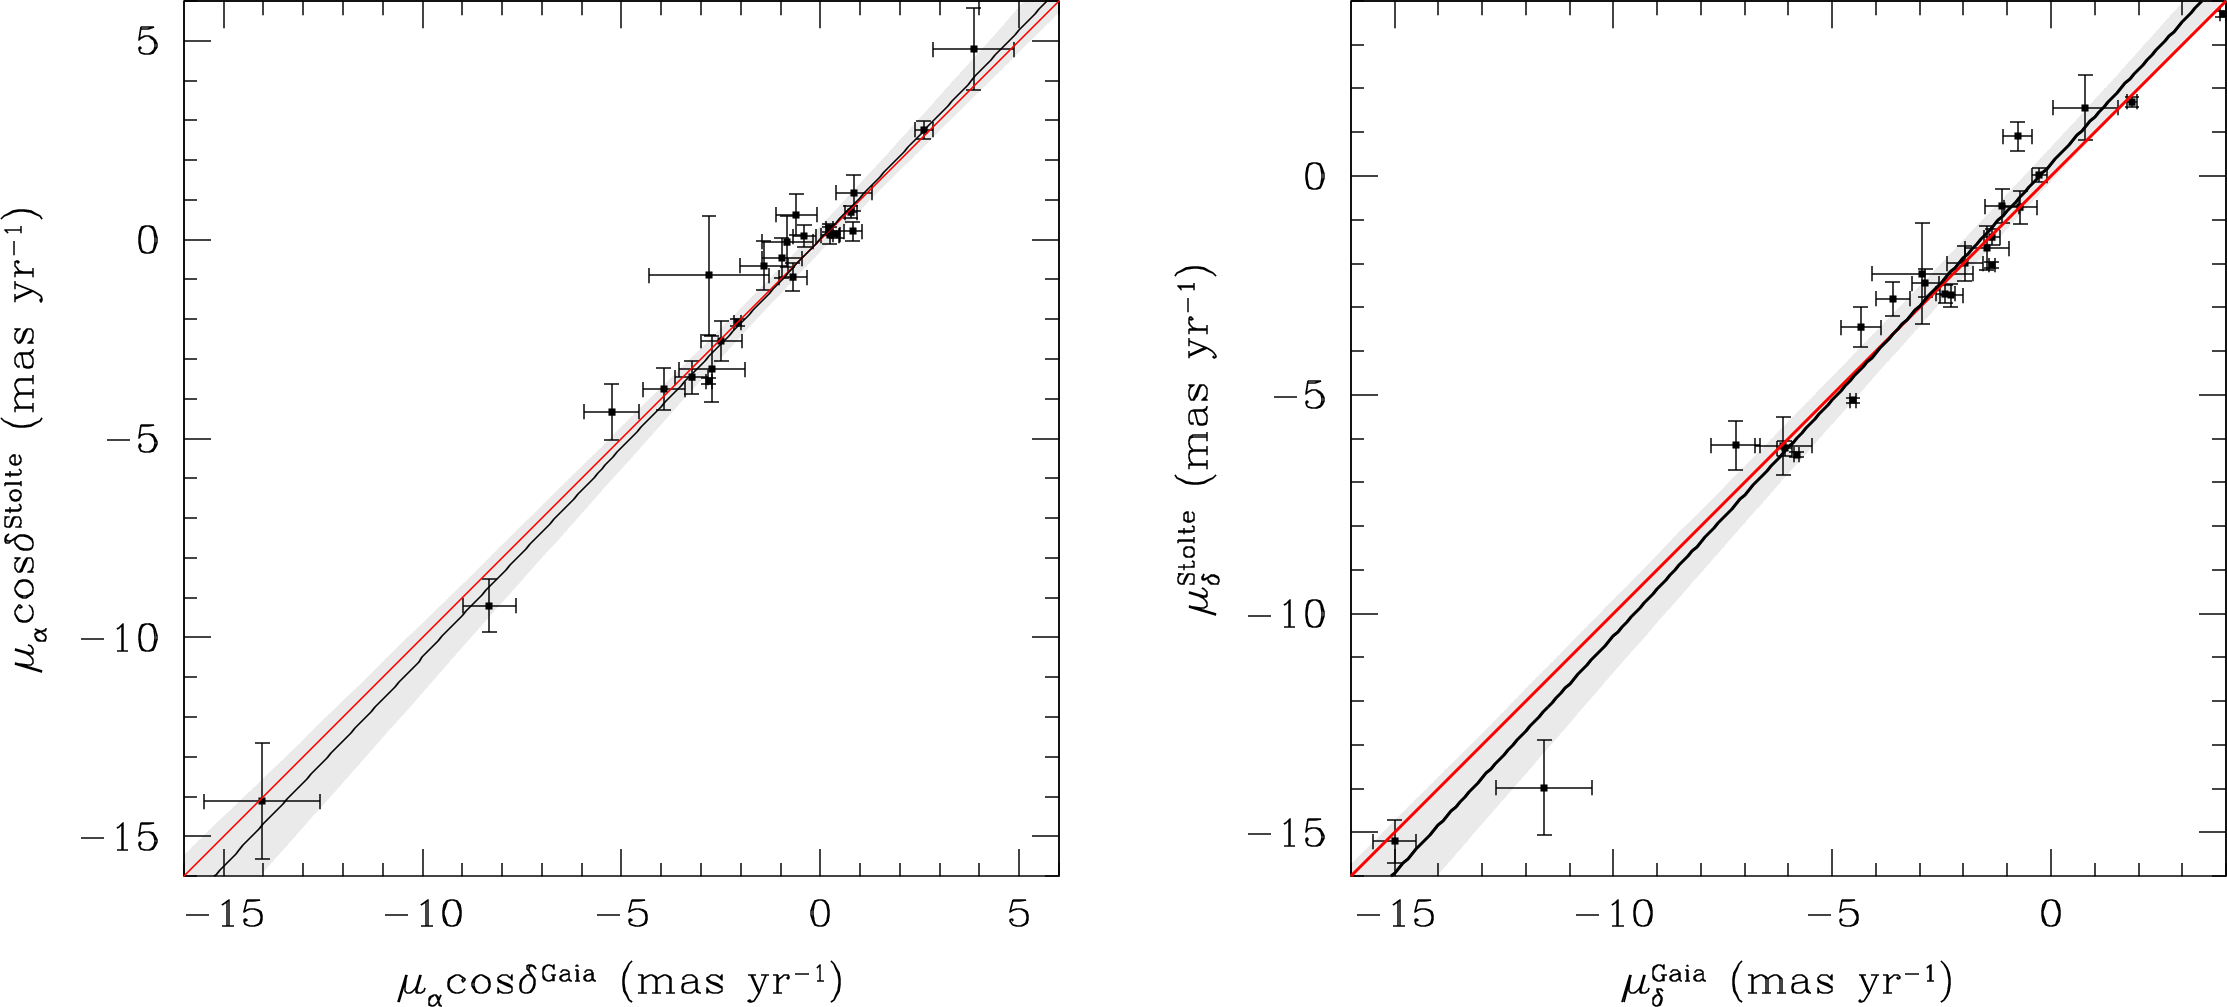
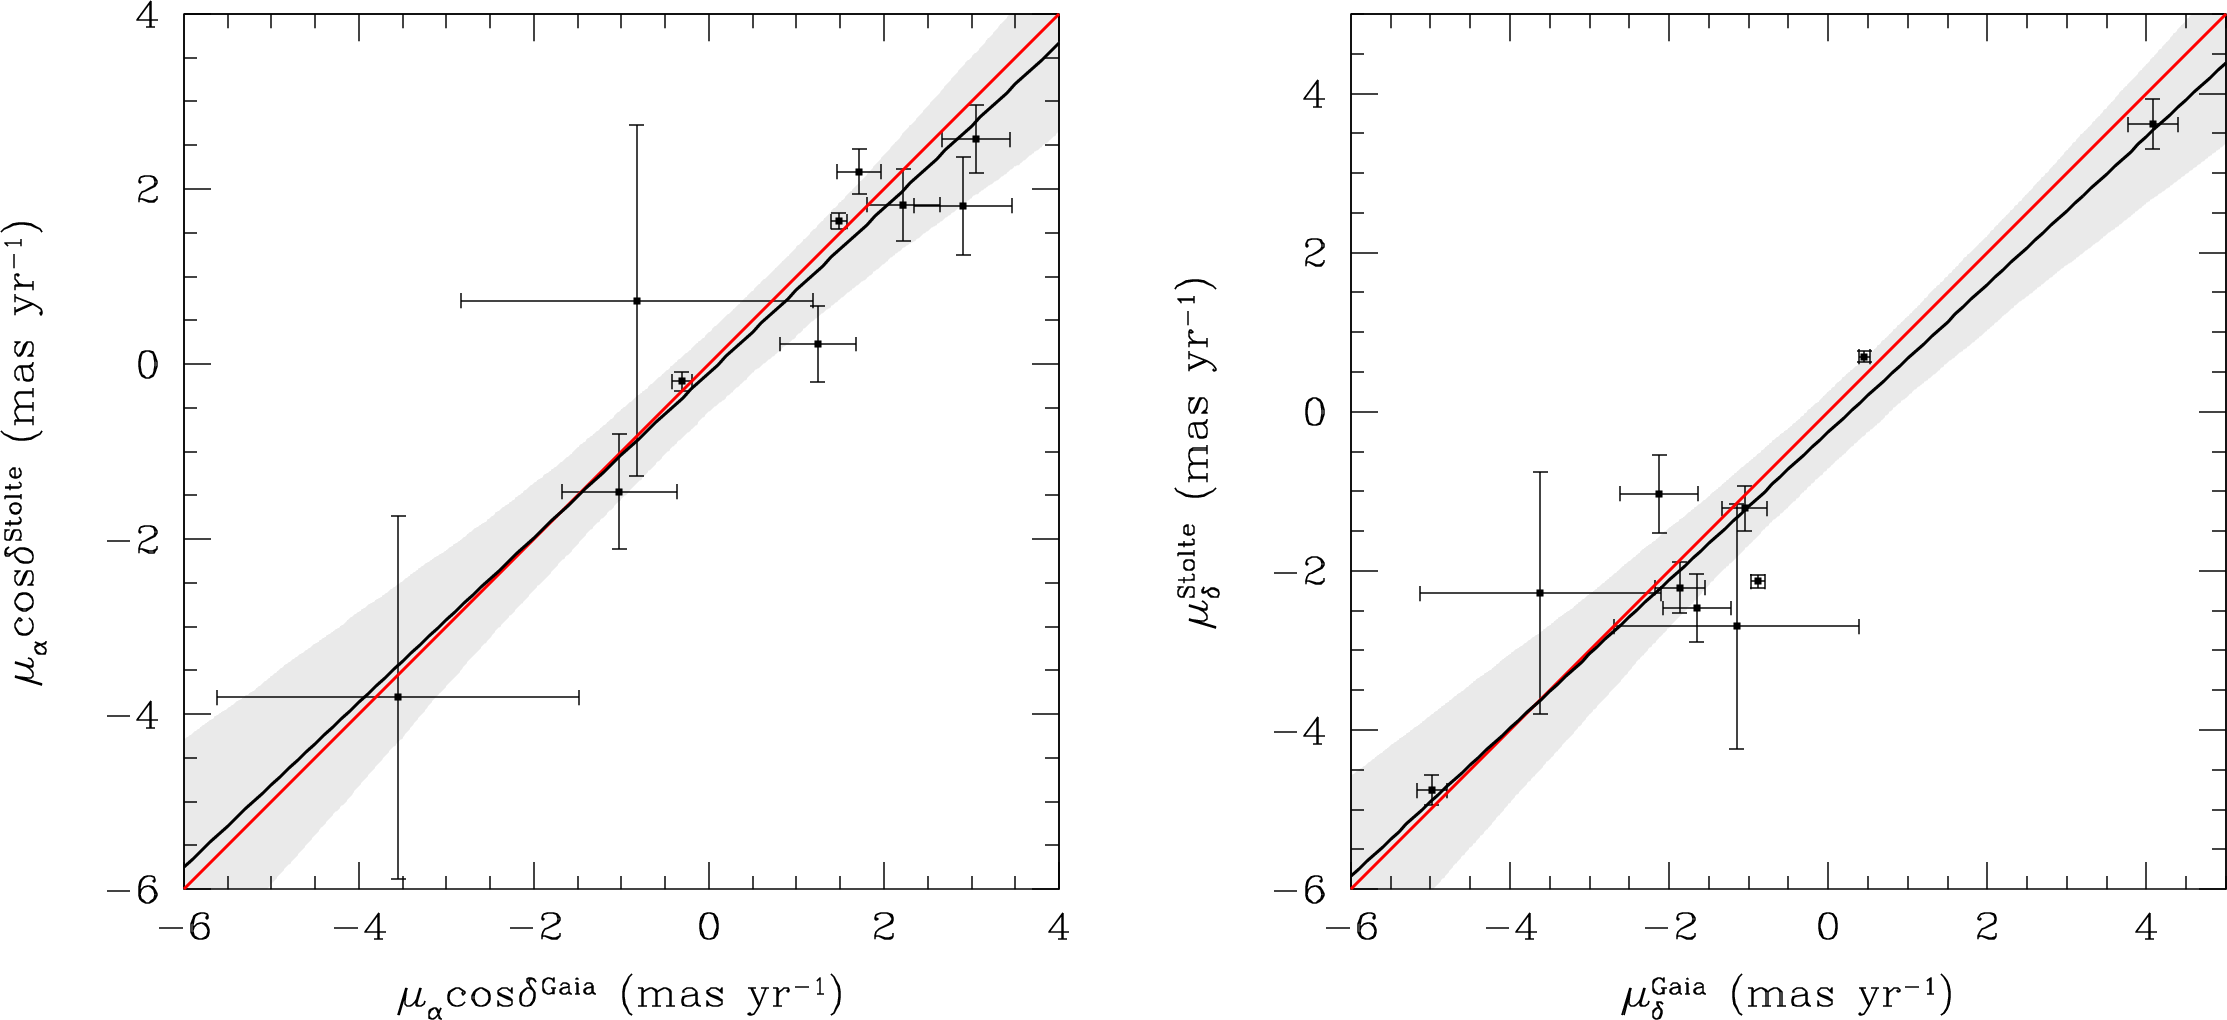
In Fig. 4 and 4 we show a comparison between the PMs of the Gaia DR2 catalog and those of S15 after they have been converted to absolute values. All stars in common between these catalogs were used in the comparison (except for those in the outermost field “2” of the Arches mosaic). The red line represents the plane bisector. The black line is the best fit to the points, the gray region is the 1-error region. The two sets of PMs are in agreement at the 1 level, thus further confirming the reliability of the PMs of S15 even without a geometric-distortion correction of the NACO data.
We converted the absolute PMs of the Arches and Quintuplet clusters from Equatorial to Galactic coordinates. The Equatorial-to-Galactic conversion of the PMs is represented by a rotation matrix, but the exact transformation of the PM-error ellipses is not as trivial. Therefore, we followed a Monte Carlo approach. For each cluster, we used 10 000 samples and assumed Gaussian distributions for and with average and equal to the absolute PMs and errors in Equatorial coordinates. We then converted the PMs of these samples to the Galactic reference system and defined as the best estimate and uncertainties the average value and the standard deviation of the obtained distributions, respectively. The resulting absolute PMs in Galactic coordinates are:
| (3) |
| (4) |
3.1 Comparison with the literature
Even though there are no previous estimates of the absolute PMs for the Arches and Quintuplet clusters, we can still make a qualitative comparison with the literature by assuming that the Bulge stellar components identified in other works have mean zero velocity with respect to the GC.
The PM of Sgr A* is mas yr-1 (Reid & Brunthaler, 2020). From (1) and (2), we have that the PMs of the Arches and Quintuplet clusters with respect to Sgr A* are:
| (5) |
| (6) |
We did not include the PM errors of Sgr A* in the error budget because they are too small to be significant.
Several estimates of the Arches/Quintuplet PMs have been made over the years. Here we compare the most recent estimates of the PMs for each cluster, which are based on completely different data sets from those of S15 and previous papers from the same authors (Stolte et al., 2008, 2014).
Hosek et al. (2019) and Rui et al. (2019) recently computed the relative PMs of the Arches and Quintuplet clusters, respectively, using Hubble Space Telescope (HST) data. The authors modeled the distribution of the field stars in the VPD as the sum of different Gaussian distributions, thus obtaining a sophisticated and reliable representation of the motion of the Bulge stars in these fields. If we assume that the Bulge stars are, on average, at rest with respect to Sgr A*, this means that the relative PM of the clusters with respect to Sgr A* is given by the average PM of Bulge stars in the relative-PM VPD, with opposite sign.
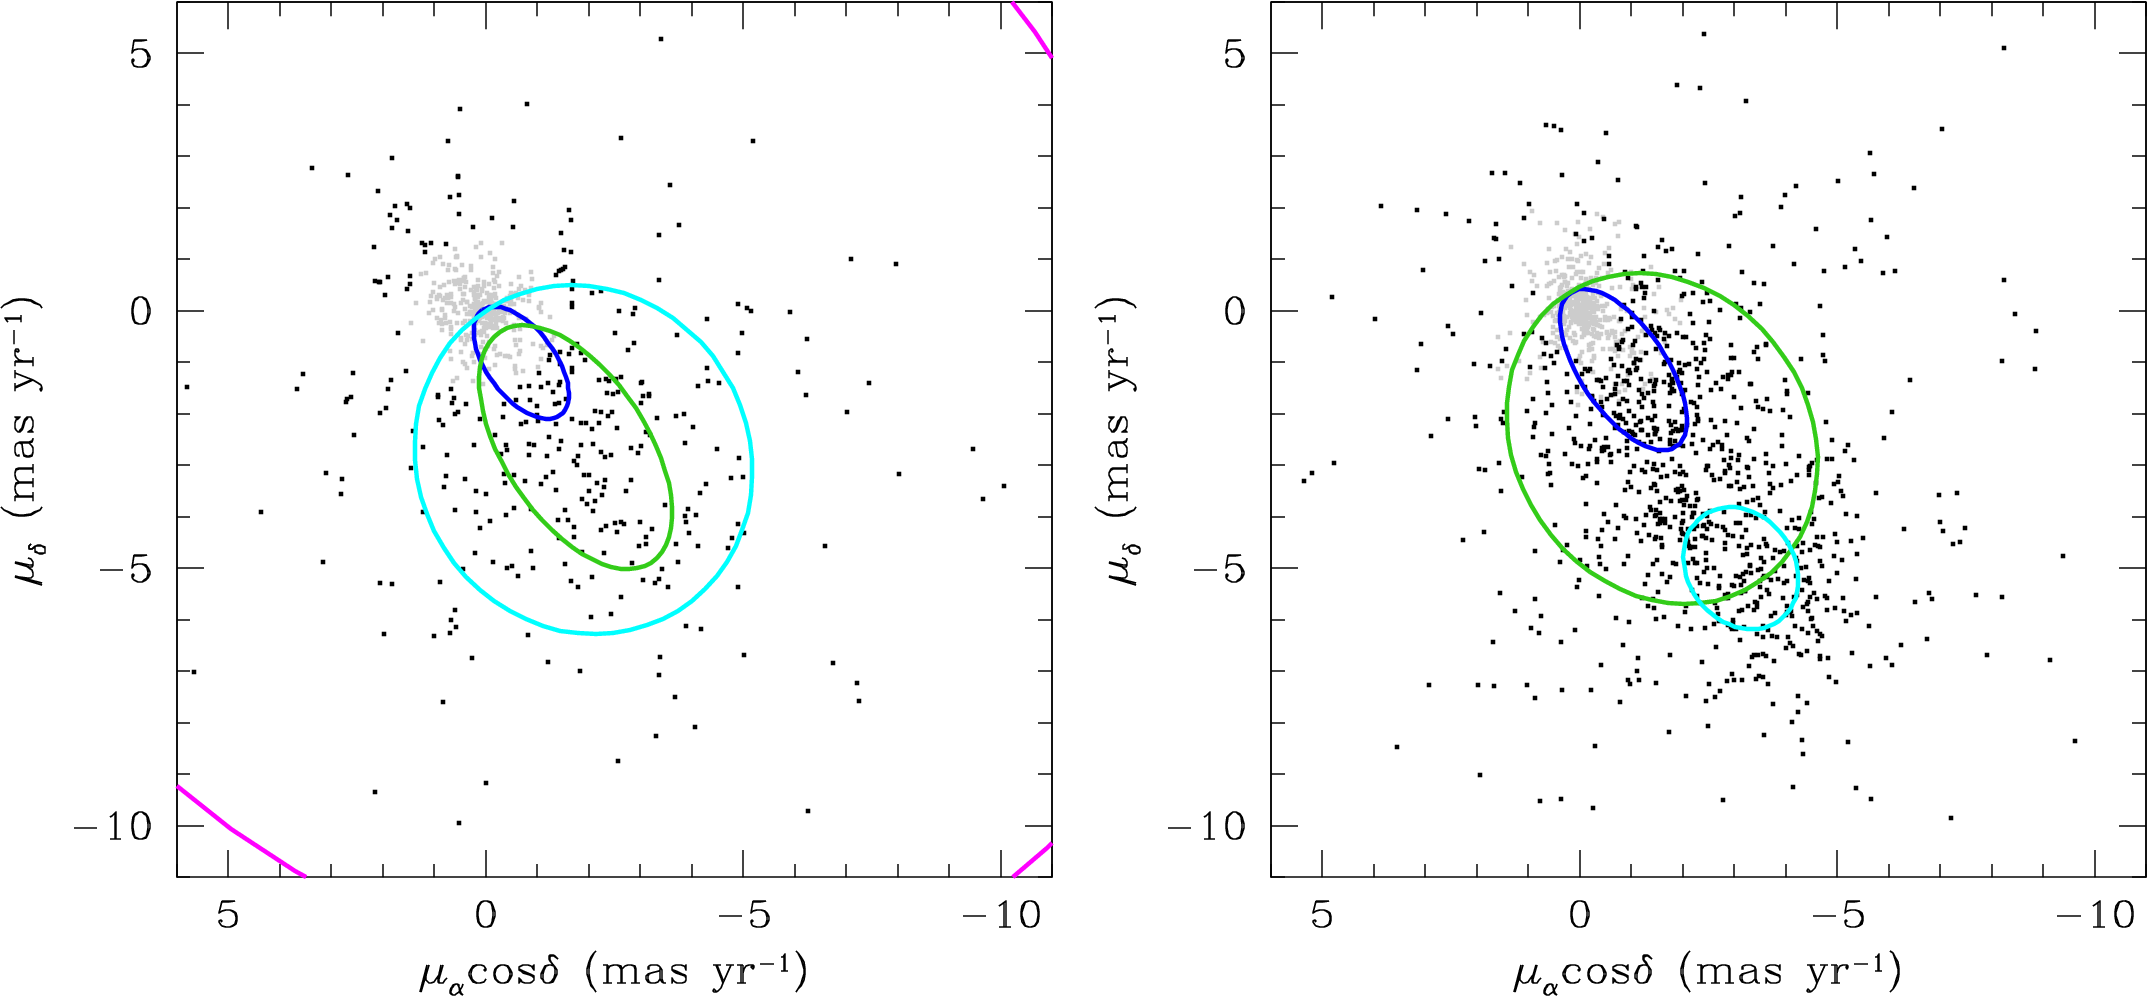
Looking at Fig. 4 of Hosek et al. (2019), the cyan Gaussian (the field Gaussian 3) seems to fairly represent the PM distribution of Bulge stars in the VPD of the Arches cluster. Hence, the relative PM of the Arches cluster with respect to Sgr A* is defined by the center of Gaussian 3 in their Table 7, with opposite sign:
| (7) |
This value is in agreement with our independent estimate given in (5).
We made a similar computation for the Quintuplet cluster using the details provided in Rui et al. (2019). The center of the field stars in the VPD shown in their Fig. 7 seems to be between the centers of the blue and cyan Gaussians (the field Gaussians 1 and 3). By means of the values given in their Table 2, the resulting relative PM of the Quintuplet cluster with respect to Sgr A* is:
| (8) |
This estimate is also consistent with our estimate in (6) at the level.
For the sake of completeness, Fig. 5 shows the VPDs of the relative PMs of S15 for the Arches (left panel) and Quintuplet (right panel) catalogs. Black points represent a sample of bright Bulge stars selected according to their location in the versus color-magnitude diagram, i.e., redder than (see, e.g., the CMDs in Figs. 2 and 2). The ellipses depicted in these plots represent the Gaussian contours defined in Hosek et al. (2019) for the Arches cluster and in Rui et al. (2019) for the Quintuplet cluster.
4 Conclusions
We took advantage of the public PM catalogs of S15 and of the Gaia DR2 to compute the first estimate of the absolute PMs of the Arches and Quintuplet clusters. One of the main advantages of PMs is that they enable orbit calculations. We explore this topic in Appendix B through approximate calculations in an axisymmetric potential. This provides some insights into plausible dynamical histories and origins of the clusters. However, the properties of the orbits are strongly affected by the unknown distances of the Arches and the Quintuplet clusters. Hence, strong conclusions are not possible until after it becomes feasible to better constrain the distances.
By combining the already-known clusters’ positions and the newly-computed absolute PMs, one important implication is clear without the need for orbit calculations: the clusters not only both lie close to the Disk plane, but also both move nearly parallel to it. This strongly suggests orbits compatible with the general motion of cold Galactic gas, as might be expected for young clusters, and argues against more exotic origins of the clusters such as formation in minor mergers or cooling halo gas. Assuming the same sense of rotation as that of the gas, the motion towards positive (in a frame where the GC is at rest) implies a location in front of the GC.
Acknowledgments
ML, MF and AB acknowledge support from STScI grants GO 12915 and 13771. DJL acknowledges support from the Spanish Government Ministerio de Ciencia, Innovación y Universidades through grants PGC-2018-091 3741-B-C22 and from the Canarian Agency for Research, Innovation and Information Society (ACIISI), of the Canary Islands Government, and the European Regional Development Fund (ERDF), under grant with reference ProID2017010115. This work has made use of data from the European Space Agency (ESA) mission Gaia (https://www.cosmos.esa.int/gaia), processed by the Gaia Data Processing and Analysis Consortium (DPAC, https://www.cosmos.esa.int/web/gaia/dpac/consortium). Funding for the DPAC has been provided by national institutions, in particular the institutions participating in the Gaia Multilateral Agreement. This research made use of Astropy,222http://www.astropy.org a community-developed core Python package for Astronomy (Astropy Collaboration et al., 2013, 2018). This research has made use of the SIMBAD database, operated at CDS, Strasbourg, France.
Appendix A PM systematics
As described in Sect. 2, bona-fide cluster members were used by S15 to compute the transformations between frames in different epochs. The average PM of cluster stars should be consistent with zero regardless of the magnitude and of the position in the field of view of these objects.
We initially looked for possible magnitude-dependent systematics in the PMs of S15. We computed the 3.5-clipped median value of the PM of cluster objects along and directions in 0.5- magnitude bins. Cluster stars were defined by means of the membership flag given in the S15 catalogs. We also refined the samples of members by considering as cluster stars only those objects within 1 mas yr-1 from the origin of the VPD.
We found a systematic PM offset for cluster stars with with respect to the origin of the VPD that can be as large as 0.5 mas yr-1 in the central field of the Arches cluster. This offset might be due to non-linearity effects in the NACO data, an imperfect combination of long and short exposures (which happens at according to Fig. 3 of S15, ), or simply because of a large contamination of field stars among the bona-fide cluster members. We corrected the PMs of S15 by linearly interpolating between the median-PM bin values.
We also searched for spatially-variable systematics, i.e., local offsets of the bulk motion of the cluster stars across the field of view, and corrected for these effects as described in Bellini et al. (2014) and Libralato et al. (2018b, 2019). Most of the systematics are located toward the center of the clusters and in overlapping regions between the different fields.
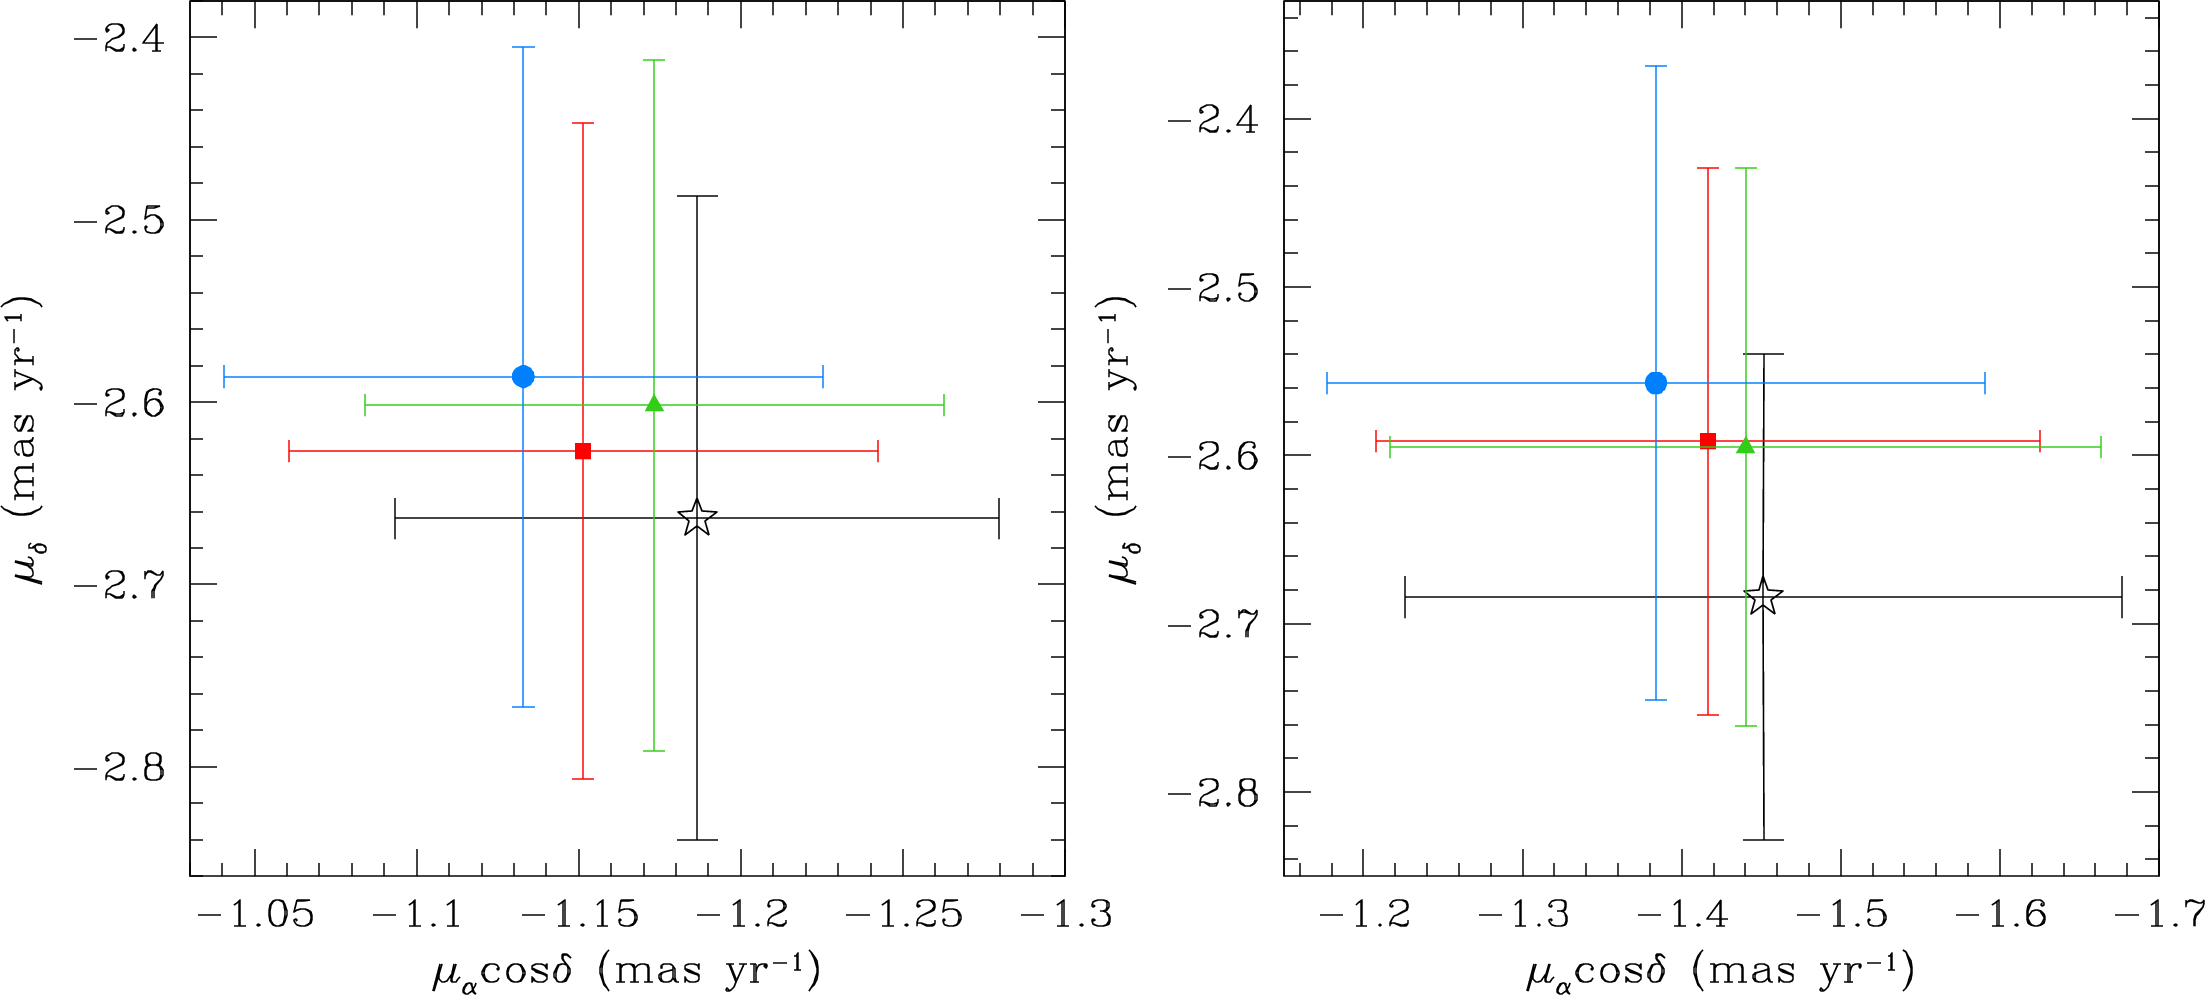
In Fig. 6, we show the absolute PM values of the Quintuplet (left panel) and Arches (right panel) clusters obtained as described in Sect. 3 by using: (i) the original PMs of S15 (black stars), (ii) the PMs corrected for the magnitude-dependent systematics (red squares), (iii) the PMs corrected for the spatially-variable systematics (green triangles), and (iv) the PMs corrected for both magnitude- and spatial-dependent systematic effects (azure dots).
It is clear that all measurements are in agreement within . Most of the stars in common with the Gaia DR2 catalog are located outside the centermost fields, i.e., where the PM systematics are larger. Therefore, the aforementioned corrections do not significantly change the values of the absolute PMs of the two clusters.
Appendix B The orbits of Arches and Quintuplet clusters
We briefly investigate the implications of our PM measurements by calculating some possible orbits for the Arches and Quintuplet clusters. Thanks to the addition of our PM results, five of the six kinematic coordinates of each cluster are determined with reasonable accuracy. The RVs adopted in this work are () km s-1 for the Arches cluster (Figer et al., 2002) and () km s -1 for the Quintuplet cluster (Stolte et al., 2014). The distance, however, is not well determined. The heavy extinction toward the clusters makes any distance estimates based on the brightness of cluster stars highly uncertain. This distance uncertainty completely dominates the uncertainty in our understanding of the orbits. The detailed properties of the Galatic potential affect the orbits only to a lesser degree. Therefore, we use here relatively simple axisymmetric models, ignoring the influence of the Galactic bar, and leave more sophisticated orbit modeling to a later time when the clusters’ distances are better known.
To allow orbit computations over a wide range of radii, the model for the Galactic potential we use here splices together two previously published models. In the inner region within 200 pc, we use a spherically symmetric version of the potential of Launhardt, Zylka & Mezger (2002), which includes contributions from the central black hole, the nuclear star cluster, the nuclear stellar disk, and the Galactic bulge. We use the mass profile of this model as tabulated by Kruijssen et al. (2015) and provided in the AMUSE code (Portegies Zwart et al., 2009). In the outer region, past a radius of 200 pc, we use a modified version of the MWPotentialModel2014 potential in Bovy (2015). While we keep the Miyamoto-Nagai disk and Navarro-Frenk-White halo of this model unchanged, we adopt a denser and more massive bulge in order to match the level and slope of the Launhardt, Zylka & Mezger rotation curve at 200 pc. We retain the functional form of the Bovy model’s bulge, , but with revised parameters , kpc, kpc-3, and kpc. This yields a total bulge mass of . The model roughly matches the observed circular velocity data collected in Sofue (2013), for both large and small radii. It does not match this data’s prominent peak at pc and subsequent decline out to 2.5 kpc, but Chemin et al. (2015) argue that this feature is likely an artifact of perturbations from the Galactic bar.
The axisymmetry of our potential is clearly an approximation, as orbits on scales of a few kpc are strongly affected by the bar. However, at smaller radii, the observed physical components are close to axisymmetric and the potential contours generated in physical models such as Bissantz, Englmaier & Gerhard (2003) are more rounded. Thus, axisymmetric models continue to be used to study orbits near the Galactic center (Molinari et al., 2011; Kruijssen et al., 2015; Perera et al., 2019), and we leave non-axisymmetric refinements to future work.
We integrate orbits in this potential using the package galpy333http://github.com/jobovy/galpy (Bovy, 2015). We assume Sgr A* lies fixed at the GC. We adopt a distance to Sgr A* of 8.175 kpc from Gravity Collaboration et al. (2019), and do not consider in the computation its small observed error. We first define a modified Galactic coordinate system , which uses a slight rotation around the Sun’s position to place Sgr A* exactly at , , then shift by the solar distance to obtain Galactocentric coordinates. We choose a solar motion in the Galactocentric frame of km s-1, km s-1, km s-1 that produces the observed PM of Sgr A*, mas yr-1 and mas yr-1 (Reid & Brunthaler, 2020). We use a Galactocentric convention where points from Sgr A* to the Sun.
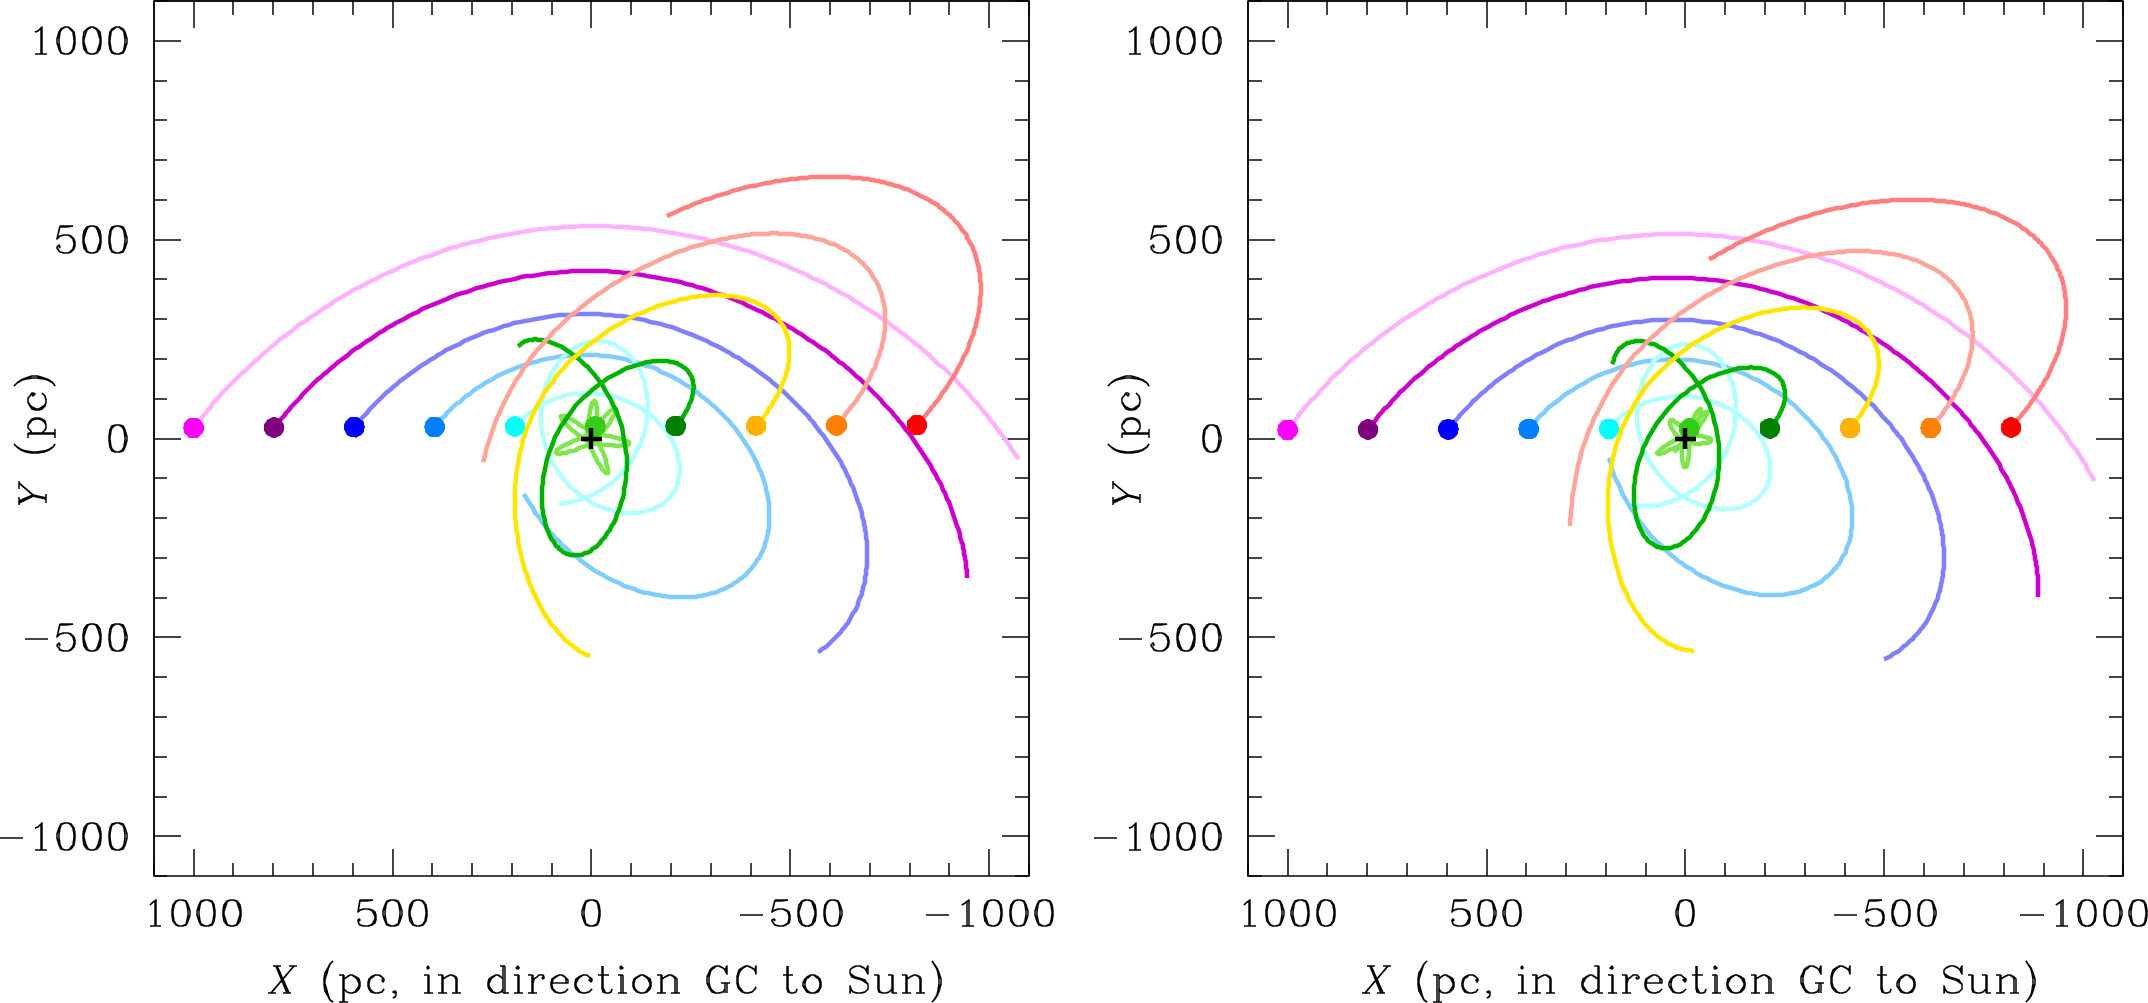
Figure 7 shows orbits of the two clusters with a series of initial distances, using our best values of the PM. Orbits starting well on the near side of the GC are highly eccentric. The eccentricity first decreases with the starting distance, then increases again as the orbits become almost radial near the GC. About 20 pc further out, the orbits become retrograde. We note none of the orbits are circular. As noted in Stolte et al. (2008), circular orbits require , which implies , radius , and circular velocity . For Quintuplet, this implies a velocity km s-1 at pc, where the uncertainties incorporate our estimated PM and RV errors. For Arches, it implies a velocity km s-1 at pc. Both of these circular velocities are comfortably above those implied by our potential, which are 108 and 98 km s-1, respectively, at these radii. They also lie well above the scatter of different observational points (Launhardt, Zylka & Mezger, 2002; Sofue, 2013). Therefore, even though our PM values imply transverse speeds that are somewhat smaller for Quintuplet than those in Stolte et al. (2014), and quite a bit smaller for Arches than in Stolte et al. (2008), we agree with the assessment in those papers that neither cluster lies on a circular orbit.
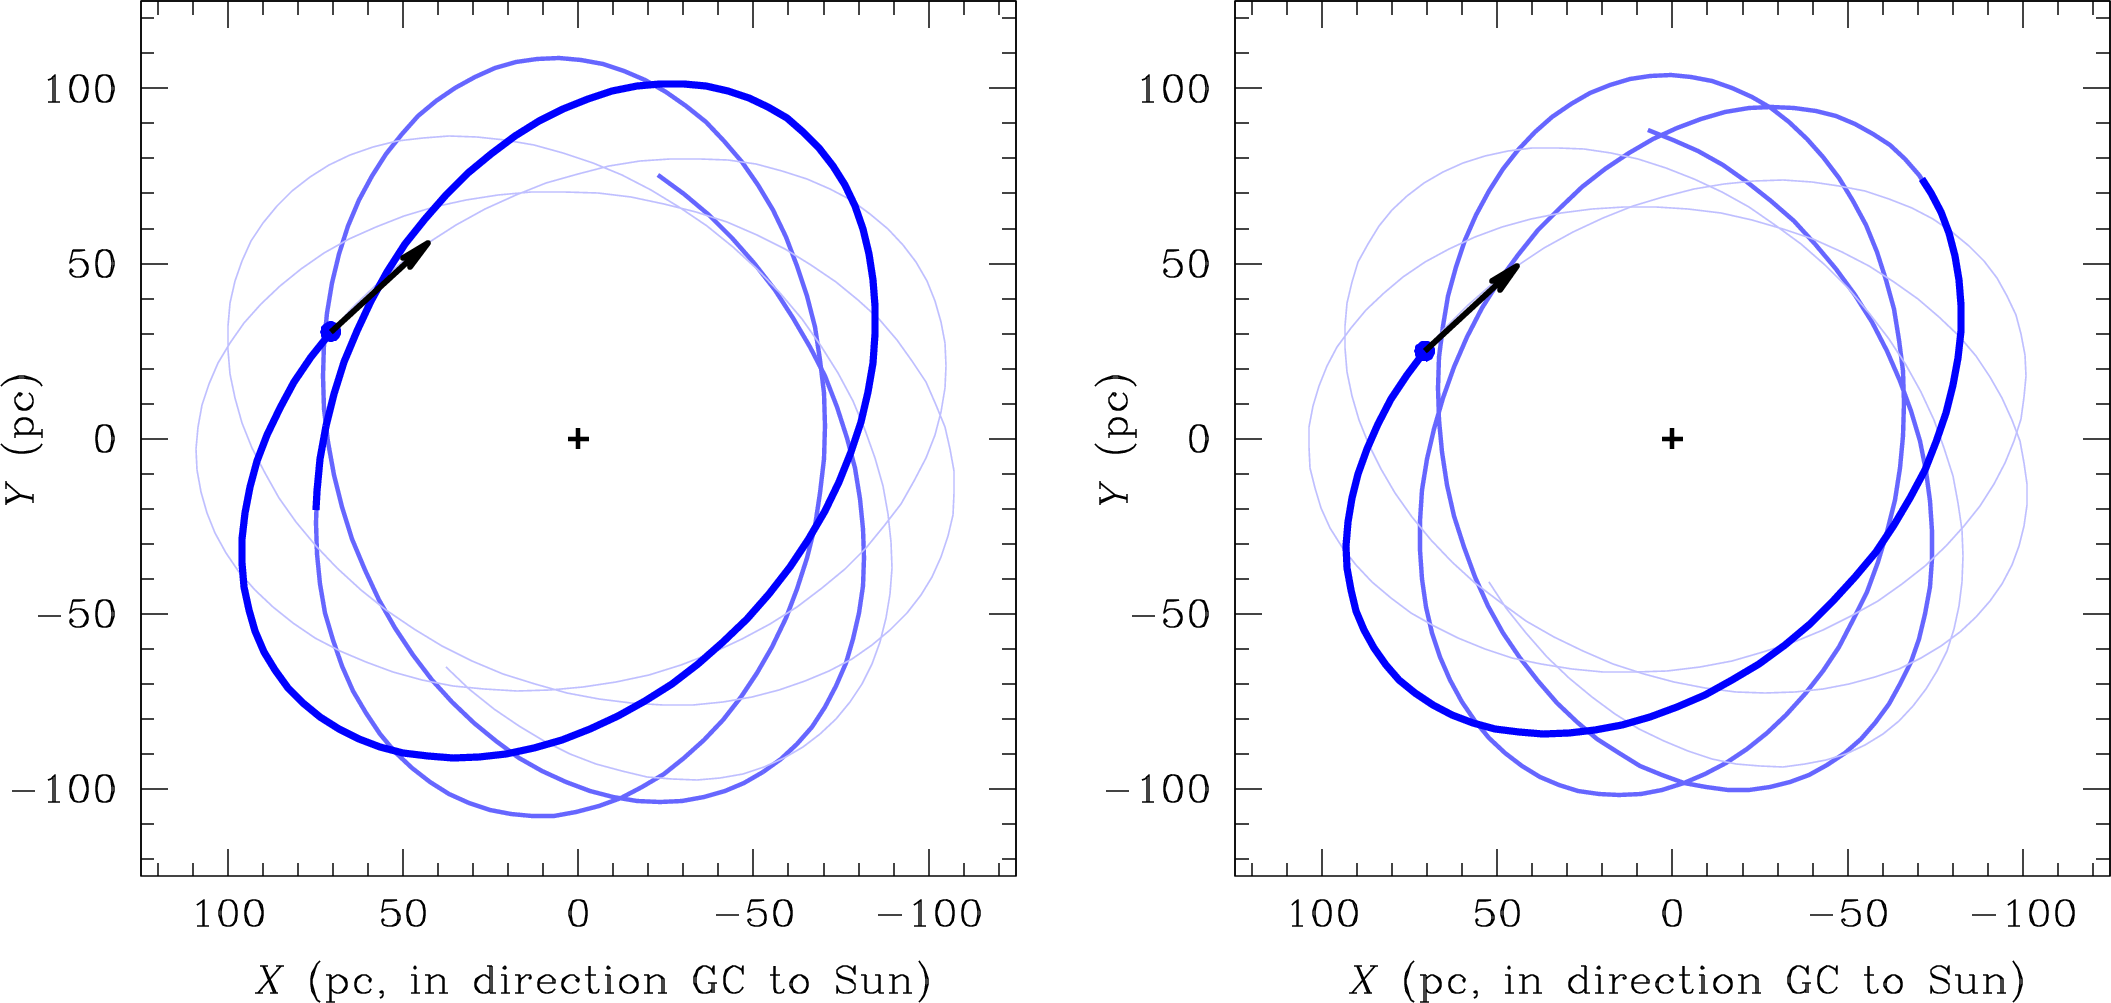
Our orbits are rather similar in character to those in Stolte et al. (2014, see their Figure 8). One possible reason for this is that their bar component (as specified in Stolte et al., 2014) only becomes strong past 200 pc, leaving the central portion nearly axisymmetric. If we presume the clusters to have been formed out of gas in circular rotation, the orbits with the minimum eccentricity may be regarded as the most plausible. These are shown in the two panels in Figure 8. For Arches, this orbit has apocenter 105 pc, pericenter 66 pc, eccentricity , and radial period 2.0 Myr. For Quintuplet, these numbers change to apocenter 110 pc, pericenter 71 pc, eccentricity 0.22, with radial period 2.0 Myr. The two orbits are thus remarkably similar. These numbers are not drastically changed by variations up to in the PM.
The orbit properties are affected above all by the uncertainty in the distance, but we can make some arguments to constrain the plausible range of this parameter. One such argument asserts that the current values of Galactocentric coordinates should not be special. The projected locations of the clusters are 27 and 31 pc away from the GC444Positions from the Simbad database (Wenger et al., 2000). in the direction for the Arches and Quintuplet clusters, respectively. We exclude here any orbit for which or are smaller than the current values less than 5% of the time. We also exclude retrograde orbits, since these young clusters are likely to have been born within prograde gas.
Orbits with a slightly greater starting distance become quite radial as the velocity vector begins to align with the Galactocentric position vector. These take the clusters onto highly disruptive orbits. Given cluster masses of and half-mass radii of pc (Portegies Zwart et al., 2002; Stolte et al., 2008), the enclosed Galactic tidal force exceeds the cluster self-gravity within 15–20 pc, which should lead to rapid tidal disruption. It also seems unlikely that star-forming gas suitable for forming these young clusters would be located on this type of orbit. This argues against cluster apocenter-pericenter ratios of greater than about 5:1 for our sample of orbits.
For both Arches and Quintuplet, application of these criteria limits the range of the current coordinate to roughly – pc, where the cluster lies on the near side of the GC. This yields orbits with apocenters of – pc and radial periods of roughly – Myr.
For some orbits, the clusters complete less than one full radial period. Portegies Zwart et al. (2002) argued that clusters near the GC rapidly decrease in surface density due to tidal losses, which may help explain why such young clusters are the only ones observed near the GC, and also favor orbits with fewer and larger pericenters. The close similarity in position and velocity suggests the clusters may actually originate from the same material. While the difference in their estimated ages might suggest otherwise, these ages are highly uncertain. Furthermore, molecular clouds are variously estimated to live for as long as Myr (Murray, 2011), though close to the GC they may have shorter lifetimes of 3–9 Myr (Jeffreson et al., 2018) and clouds may disperse within 1–5 Myr once massive stars form (Chevance et al., 2020). Therefore, it might not be impossible that the clusters could have formed out of different parts of the same large gas cloud. Indeed, it is not difficult to find orbits where they originate from the same point 4 Myr ago, our assumed age for Quintuplet. However, given their estimated masses, it is clear that the clusters are not currently gravitationally bound, as their projected separation is greater than the Jacobi radius implied by their combined mass and any pericentric radius up to pc. If the clusters are on orbits that drift away from each other only slowly with time, however, this not only could explain their apparently similar azimuth, but also makes it much less of a coincidence they are both projected so close to the GC.
Data availability
The catalogs of Stolte et al. (2015) are available at http://cdsarc.u-strasbg.fr/viz-bin/qcat?J/A+A/578/A4. The Gaia DR2 catalog is available at https://gea.esac.esa.int/archive/.
References
- Astropy Collaboration et al. (2013) Astropy Collaboration et al., 2013, A&A, 558, A33
- Astropy Collaboration et al. (2018) Astropy Collaboration et al., 2018, AJ, 156, 123
- Bellini et al. (2014) Bellini A. et al., 2014, ApJ, 797, 115
- Bissantz, Englmaier & Gerhard (2003) Bissantz N., Englmaier P., Gerhard O., 2003, MNRAS, 340, 949
- Bovy (2015) Bovy J., 2015, ApJS, 216, 29
- Chemin et al. (2015) Chemin, L., Renaud, F., & Soubiran, C. 2015, A&A, 578, A14
- Chevance et al. (2020) Chevance M., Kruijssen J. M. D., Hygate A. P. S., Schruba A., Longmore S. N., Groves B., Henshaw J. D., et al., 2020, MNRAS, 493, 2872
- Clarkson et al. (2012) Clarkson W. I. et al., 2012, ApJ, 751, 132
- Figer, McLean & Morris (1999a) Figer D. F., McLean I. S., Morris M., 1999a, ApJ, 514, 202
- Figer et al. (1999b) Figer D. F., Kim S. S., Morris M., Serabyn E., Rich R. M., McLean I. S., 1999b, ApJ, 525, 750
- Figer et al. (2002) Figer D. F. et al., 2002, ApJ, 581, 258
- Fruchter & Hook (2002) Fruchter A. S., Hook R. N., 2002, PASP, 114, 144
- Gaia Collaboration et al. (2016) Gaia Collaboration et al., 2016, A&A, 595, A1
- Gaia Collaboration et al. (2018) Gaia Collaboration et al., 2018, A&A, 616, A1
- Genzel, Eisenhauer & Gillessen (2010) Genzel R., Eisenhauer F., Gillessen S., 2010, RvMP, 82, 3121
- Gravity Collaboration et al. (2019) Gravity Collaboration et al., 2019, A&A, 625, L10
- Harfst, Portegies Zwart & Stolte (2010) Harfst S., Portegies Zwart S., Stolte A., 2010, MNRAS, 409, 628
- Habibi (2014) Habibi M., 2014, PhDT
- Hosek et al. (2019) Hosek M. W. et al., 2019, ApJ, 870, 44
- Jeffreson et al. (2018) Jeffreson S. M. R., Kruijssen J. M. D., Krumholz M. R., Longmore S. N., 2018, MNRAS, 478, 3380
- Kruijssen et al. (2015) Kruijssen, J. M. D., Dale, J. E., & Longmore, S. N. 2015, MNRAS, 447, 1059
- Launhardt, Zylka & Mezger (2002) Launhardt R., Zylka R., Mezger P. G., 2002, A&A, 384, 112
- Libralato et al. (2018a) Libralato M. et al., 2018a, ApJ, 854, 45
- Libralato et al. (2018b) Libralato M. et al., 2018b, ApJ, 861, 99
- Libralato et al. (2019) Libralato M. et al., 2019, ApJ, 873, 109
- Lindegren et al. (2018) Lindegren L. et al., 2018, A&A, 616, A2
- Lu (2018) Lu J. R., 2018, ASSL, 69, ASSL..424
- Molinari et al. (2011) Molinari S. et al., 2011, ApJL, 735, L33
- Murray (2011) Murray N., 2011, ApJ, 729, 133
- Najarro et al. (2004) Najarro F., Figer D. F., Hillier D. J., Kudritzki R. P., 2004, ApJL, 611, L105
- Plewa et al. (2015) Plewa P. M. et al., 2015, MNRAS, 453, 3234
- Perera et al. (2019) Perera B. B. P. et al., 2019, MNRAS, 487, 1025
- Portegies Zwart et al. (2002) Portegies Zwart S. F., Makino J., McMillan S. L. W., Hut P., 2002, ApJ, 565, 265
- Portegies Zwart et al. (2009) Portegies Zwart S. et al., 2009, NewA, 14, 369
- Reid & Brunthaler (2020) Reid M. J., Brunthaler A., 2020, ApJ, 892, 39
- Rui et al. (2019) Rui N. Z., Hosek M. W., Lu J. R., Clarkson W. I., Anderson J., Morris M. R., Ghez A. M., 2019, ApJ, 877, 37
- Sofue (2013) Sofue Y., 2013, PASJ, 65, 118
- Stolte et al. (2008) Stolte A., Ghez A. M., Morris M., Lu J. R., Brandner W., Matthews K., 2008, ApJ, 675, 1278
- Stolte et al. (2014) Stolte A. et al., 2014, ApJ, 789, 115
- Stolte et al. (2015) Stolte A. et al., 2015, A&A, 578, A4, S15
- Wenger et al. (2000) Wenger M. et al., 2000, A&AS, 143, 9