galaxies: evolution — galaxies: ISM — galaxies: kinematics and dynamics — radio lines: galaxies
CO Multi-line Imaging of Nearby Galaxies (COMING). X. Physical conditions of molecular gas and the local SFR-Mass relation
Abstract
We investigate the molecular gas properties of galaxies across the main sequence of star-forming (SF) galaxies in the local Universe using 12CO() (hereafter 12CO) and 13CO() (13CO) mapping data of 147 nearby galaxies obtained in the COMING project, a legacy project of the Nobeyama Radio Observatory. In order to improve signal-to-noise ratios of both lines, we stack all the pixels where 12CO emission is detected after aligning the line center expected from the first-moment map of 12CO. As a result, 13CO emission is successfully detected in 80 galaxies with a signal-to-noise ratio larger than three. The error-weighted mean of integrated-intensity ratio of 12CO to 13CO lines () of the 80 galaxies is with a standard deviation of . We find that (1) positively correlates to specific star-formation rate (sSFR) with a correlation coefficient of , and (2) both flux ratio of IRAS 60 m to 100 m () and inclination-corrected linewidth of 12CO stacked spectra () also correlate with sSFR for galaxies with the measurement. Our results support the scenario where variation is mainly caused by the changes in molecular-gas properties such as temperature and turbulence. The consequent variation of CO-to-H2 conversion factor across the SF main sequence is not large enough to completely extinguish the known correlations between sSFR and () or star-formation efficiency (SFE) reported in previous studies, while this variation would strengthen (weaken) the sSFR-SFE (sSFR-) correlation.
1 Introduction
Galaxies show distinctive distributions on the plot of stellar mass () and star-formation rate (SFR): some galaxies are on the sequence showing a positive correlation between the two values, and some locate far below the correlation in the SFR direction. The former are called the main sequence of star-forming (SF) galaxies (hereafter SF main sequence, e.g., Noeske et al., 2007; Elbaz et al., 2007; Daddi et al., 2007) and the latter are called quenched or passive galaxies. Investigating how the galaxy properties change along and across the SF main sequence leads to essential understanding of galaxy evolution (e.g., Wuyts et al., 2011). Provided that stars are formed in molecular clouds in the local Universe, it is vital to study the molecular gas properties along and across the SF main sequence.
It is reported that there are positive correlations between specific SFR (sSFR SFR/, or an offset from the SF main sequence, (MS)) with molecular gas mass () to ratio () and star-formation efficiency (SFE SFR/), i.e., galaxies with higher sSFR tend to have more abundant molecular gas and form stars more efficiently from the molecular gas (e.g., Saintonge et al., 2012; Genzel et al., 2015; Scoville et al., 2017; Tacconi et al., 2018). These correlations still hold for spatially resolved data (Lin et al. 2017; Ellison et al. 2020a, b; Kajikawa in prep.). In addition, it is known that these correlations are irrespective of the environment (Koyama et al., 2017) or mass concentration of stellar components of galaxies (Koyama et al., 2019), indicating their essentiality for galaxy evolution. Furthermore, recent studies claimed that the scatter of the SF main sequence is primarily due to the SFE variety with a secondary role of using spatially-resolved molecular-gas data and optical integral-field-unit data (Ellison et al., 2020b).
Molecular rotational transitions have been used to explore the physical properties of molecular gas in galaxies. Especially, the lowest transition lines () of carbon monoxide, 12CO and its isotopes are ideal tracers of cold ( K) molecular gas which is raw material of star formation, since the corresponding energy gaps ( where is the Planck constant and is rest frequency of the line) divided by the Boltzmann constant are K for 12CO(=1-0) ( GHz, hereafter 12CO) and K for 13CO(=1-0) ( GHz, hereafter 13CO), respectively. 12CO emission is generally optically thick but strong even in extragalactic objects, thus it is widely used to measure the molecular gas mass of galaxies by assuming CO-to-H2 conversion factors (e.g., Rickard et al., 1975; Solomon & de Zafra, 1975; Young & Scoville, 1982; Bolatto et al., 2013, and references therein). On the other hand, 13CO is used as an optically thin tracer of molecular gas and known to be well correlated with dust extinction in molecular clouds in the Milky Way (e.g., Dickman, 1978; Frerking et al., 1982; Lada et al., 1994).
Detailed studies of the line ratio of 12CO/13CO (hereafter ) have revealed a wide variety of within the Milky Way. In a giant molecular cloud (GMC) where stars are formed, is reported to be at the center and for the whole cloud (Gordon & Burton, 1976; Solomon et al., 1979; Polk et al., 1988), which are much smaller than the abundance ratio of [12CO]/[13CO] inferred from the 12C/13C ratio which has a radial gradient, where at the galaxy center and in the Solar neighbourhood (Milam et al., 2005; Halfen et al., 2017). This suggests that bulk of 12CO emission is optically thick in GMCs. On the other hand, larger values are reported in the peripheries of GMCs (, Sakamoto et al., 1994), high-latitude molecular clouds (, Blitz et al., 1984), and small molecular clouds with a size of pc (, Knapp & Bowers, 1988), suggesting lower optical depth of 12CO line in those components than in GMCs. Polk et al. (1988) obtained a relatively high value of when they calculate an average value of seven regions in the Galactic plane and suggested a non-negligible contribution of the lower optical depth (diffuse) molecular gas to large-scale 12CO emission of the Milky Way.
Since the early studies of CO isotopes of local galaxies in 1970s (Encrenaz et al. 1979, upper limits by Rickard et al. 1977), various and fairly larger values than those of GMCs have been reported in nearby galaxies, for example, a typical of in spiral galaxies (e.g., Young & Scoville, 1982; Young & Sanders, 1986; Weliachew et al., 1988; Sandqvist et al., 1988; Sage & Isbell, 1991; Wright et al., 1993; Braine et al., 1993; Aalto et al., 1994; Xie et al., 1994; Matsushita et al., 1998; Paglione et al., 2001; Hirota et al., 2010; Watanabe et al., 2011; Davis, 2014; Vila-Vilaro et al., 2015; Morokuma-Matsui et al., 2015; Cormier et al., 2018; Lee & Chung, 2018), in early-type galaxies (ETGs, e.g., Eckart et al., 1990; Sage, 1990; Wild et al., 1997; Crocker et al., 2012; Davis, 2014; Alatalo et al., 2015), in irregular galaxies (e.g., Becker & Freudling, 1991), in merging galaxies (e.g., Aalto et al., 1991; Casoli et al., 1992; Aalto et al., 1997; Taniguchi & Ohyama, 1998; Aalto et al., 2010), starburst galaxies (e.g., Stark & Carlson, 1984; Young & Scoville, 1984; Kikumoto et al., 1998), and infrared-bright galaxies (e.g., Garay et al., 1993; Aalto et al., 1995; Cao et al., 2017; Sliwa et al., 2017; Herrero-Illana et al., 2019), in Seyfert galaxies (e.g., Papadopoulos & Seaquist, 1998, 1999), and in galaxies with transitions (e.g., Henkel et al., 2010; Danielson et al., 2013; Spilker et al., 2014; Béthermin et al., 2018). The large values would reflect a presence of substantial amount of low-optical depth (diffuse) components in those galaxies (e.g., Polk et al., 1988; Aalto et al., 1995; Garcia-Burillo et al., 1992; Sakamoto et al., 1997; Hirota et al., 2010; Morokuma-Matsui et al., 2015). These studies are suggestive of a dependence of on SF activities in galaxies but the relationship between and sSFR or (MS) has not been systematically explored so far.
In this study, we compare the and sSFR of galaxies targeted in the CO Multi-line Imaging of Nearby Galaxies project (COMING, Sorai et al., 2019), a legacy project making use of the 45-m radio telescope at the Nobeyama Radio Observatory111The Nobeyama 45-m radio telescope is operated by Nobeyama Radio Observatory, a branch of National Astronomical Observatory of Japan. in order to investigate the molecular gas properties across the SF main sequence of galaxies. The COMING project simultaneously obtained 12CO, 13CO, and C18O() mapping data of 147 galaxies with various sSFR located at the distances of Mpc, which makes it one of the largest mapping surveys of galaxies in multiple CO isotopes. Provided that the 12CO and 13CO data in the COMING project are obtained in the same observing conditions including the accuracy of telescope pointings, measurements do not suffer from the relevant uncertainties.
The structure of this paper is as follows: we first briefly describe the data we used and data analysis, specifically stacking analysis, in section 2, we present the basic properties and the relationship between and sSFR of our sample galaxies in section 3, based on the results, we discuss the origin of the variation and its implication for the consequent variety in CO-to-H2 conversion factor () in local galaxies as well as high-redshift galaxies in section 4, and then we summarize this study in section 5. Throughout this study, we assume the Kroupa initial mass function (IMF) (Kroupa, 2001; Kroupa & Weidner, 2003). For a correlation check, we refer to three values, Pearson’s correlation coefficient , Spearman’s rank correlation coefficient , and Kendall’s rank correlation coefficient . The first one is a parametric measure and the latter two are non-parametric measures. Although the obtained values are different from method to method, overall trends are almost consistent in the three methods. We basically adopt the widely-used Spearman’s to discuss the correlation of two galaxy parameters in this paper.
2 Data & Analysis
In this study, we used physical parameters of the COMING galaxies such as , SFR, sSFR, , SFE, , , and velocity dispersion of stacked 12CO spectra. Here, we briefly mention the derivation of these parameters from the observed data in this section.
2.1 Molecular lines: COMING 12CO and 13CO data
We used 12CO and 13CO data obtained in the COMING project (Sorai et al., 2019) to calculate the integrated intensity ratio of:
| (1) |
where and are integrated intensities in units of K km s-1 of 12CO and 13CO emission lines, respectively. The angular and velocity resolutions of the COMING data are arcsec ( kpc at 20 Mpc) and 10 km s-1, respectively. We stacked all the 12CO and 13CO spectra of pixels where 12CO emission is detected with a signal-to-noise ratio of larger than three for each galaxy after aligning the line center expected from the first-moment map of 12CO line (hereafter, “VA” stacking, Schruba et al., 2011; Caldú-Primo et al., 2013; Morokuma-Matsui et al., 2015). The number of stacked pixels differs from galaxy to galaxy and ranges from 20 to 2431 (the median, first and third quartiles are 274.5, 154.5, and 447.5, respectively)222Since the number of galaxies with 13CO detection is even (80), the median, first and third quartiles are calculated as means of the central two values of the whole sample, the first quarter sample, and the last quarter sample, respectively when the galaxies are sorted according to the number of the stacked pixels.. With the VA stacking analysis, 13CO emission line is detected in 80 galaxies with a signal-to-noise ratio of . It should be noted that the number of galaxies with a “secure” detection of 13CO emission in the original data (more than three pixels with sigma detection in the 13CO integrated intensity and sigma detection in the 12CO integrated intensity) is only 52 (Sorai et al., 2019).
Velocity dispersions of stacked 12CO spectra, are derived by the single Gaussian fitting. Since this value encompasses both random motion among clouds and/or volume-filling gas and velocity gradient due to galactic rotation within the kpc beam, we correct the effect of inclination () by dividing the value by sin() as =/sin(). 12CO data is also used to calculate molecular gas mass of galaxies. We adopt from Sorai et al. (2019) which assumed the standard CO-to-H2 conversion factor of the Milky Way of cm-2 (K km s-1)-1 (Bolatto et al., 2013).
2.2 Stellar mass and SFR: WISE and GALEX
We adopt values derived in Sorai et al. (2019), which used m data obtained with the Wide-field Infrared Survey Explorer (WISE, Wright et al., 2010) and an empirical relation between m luminosity and presented in Wen et al. (2013) assuming the Kroupa IMF. Sorai et al. (2019) reported that their values are % lower than those calculated in the Spitzer Survey of Stellar Structure in Galaxies project (S4G Sheth et al., 2010) due to their conservative subtractions of foreground stars. SFR map of the COMING galaxies is generated using WISE m and far-ultraviolet (FUV) imaging data obtained with the Galaxy Evolution Explorer (GALEX, Martin et al., 2005) as
| (2) |
where is SFR surface densities in units of yr-1 kpc-2 and and are WISE/m and GALEX/FUV intensities, respectively, in units of MJy sr-1 (Casasola et al., 2017). The SFR calibration method adopted in Casasola et al. (2017) assumes the default IMF in STATBURST99 (Leitherer et al., 1999). To convert from the SFR with the STATBURST99 IMF to SFR with the Salpeter IMF (Salpeter, 1955), one should multiply the value by a factor of 1.59. Furthermore, to convert from the SFR with Salpeter IMF to SFR with Kroupa IMF, one should multiply the value by a factor of 0.67. Details in estimating SFR and star-formation properties will be presented in the forthcoming paper (Takeuchi et al. in prep.). In this study, we limit our sample to the COMING galaxies with both the WISE m and the GALEX FUV detections, resulting in 107 galaxies. The number of galaxies with and SFR measurements and 13CO detections reduces to . The galaxies consist of spiral galaxies (S, SA, SAB, or SB classifications in the Third Reference Catalogue of Bright Galaxies, RC3, de Vaucouleurs et al., 1991) and no interacting galaxies, irregular galaxies, nor ETGs are included.
2.3 Dust emission: IRAS m and m data
We crossmatch the 147 COMING galaxies with the IRAS Revised Bright Galaxy Sample (RBGS, Sanders et al., 2003), which lists total fluxes covering extended emission of galaxies in IRAS bands. The IRAS RBGS consists of 629 galaxies with m flux of Jy. The matching results in 111 galaxies, and 62 galaxies have all the measurements of , SFR, stacked 12CO and 13CO emissions, and IRAS fluxes at m and m.
3 Results
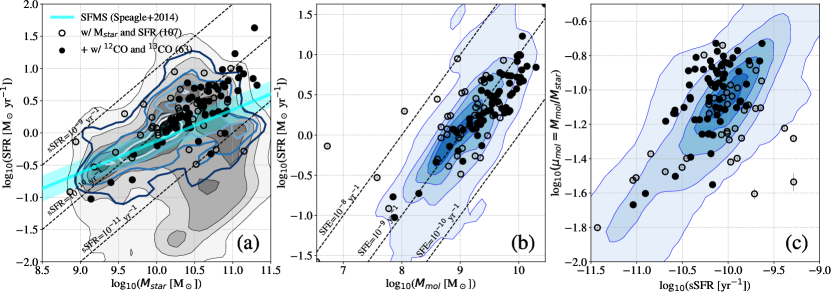
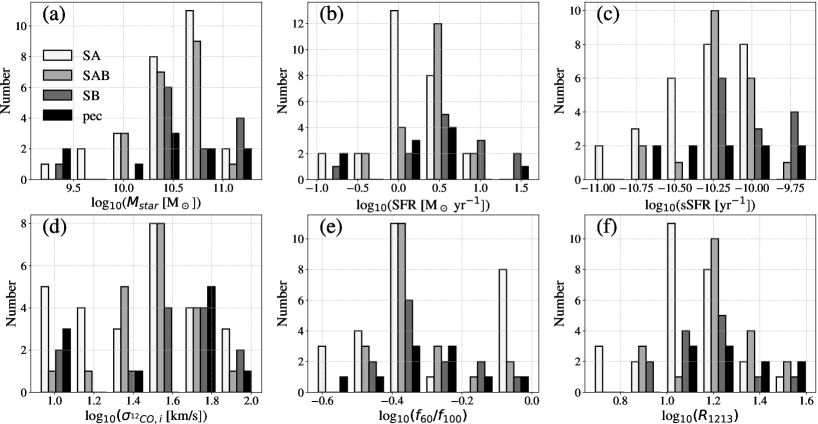
In figure 1, we present basic properties of the COMING galaxies and compare them with galaxies in the extended CO Legacy Database for GASS project (xCOLD GASS, Saintonge et al., 2011, 2017), which is the largest 12CO survey targeting 532 galaxies at . The SF main sequence at the local Universe is also indicated as a solid cyan line as a reference in the panel (a) (Speagle et al., 2014). We can see that the most COMING sample is above or on the SF main sequence and some are located on the so-called “green valley” regime. It should be noted that our sSFR estimations of the COMING galaxies are expected to be higher than those in literatures since the adopted values are known to be % lower than the previous studies as mentioned in section 2.2. Overall, the COMING and the CO-detected xCOLD-GASS galaxies share similar star-formation properties such as sSFR, SFE and . In panel (c) of the same figure, it is also seen that galaxies without 13CO detection indicated as open black circles tend to have low and/or high sSFR values.
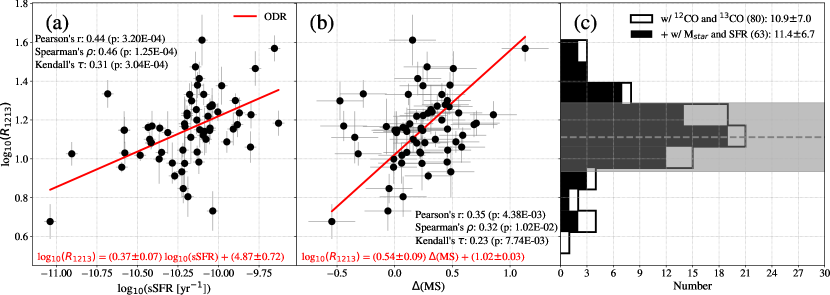
An error-weighted mean and a standard deviation of for the 80 COMING galaxies with 12CO and 13CO measurements are and , respectively. In case we limit sample to the 63 galaxies that are plotted on the figure 2a, these value becomes (mean) and (standard deviation). This is consistent with previous studies on of local star-forming galaxies (, e.g., Young & Sanders, 1986; Paglione et al., 2001; Vila-Vilaro et al., 2015). Using and sSFR of the 63 galaxies, we find a moderate correlation between these two values with a Spearman rank correlation coefficient of (see figure 2a). The possibility of a fake correlation for the -sSFR relation is discussed in the Appendix section. The fitting function by the orthogonal distance regression (ODR) is shown in this figure.
We also examine the relationship between and the SFR offset from the SF main sequence, (MS) that is calculated as
| (3) |
where SFRMS(, ) is SFR of the SF main-sequence galaxies with mass of [] at the age of the Universe of [Gyr], which is calculated as
| (4) |
(Speagle et al., 2014)333Speagle et al. (2014) compiled 64 observations of main-sequence galaxies at from 25 studies and derived the SF main sequence as a function of redshift after converting them to the same calibrations.. Here we adopt the same cosmology parameters as Speagle et al. (2014) of to calculate the age of the Universe at . seems to similarly but rather weakly correlate with (MS) compared to sSFR. It should be noted that this tendency does not change even if another widely-used definition of the SF main sequence (Whitaker et al., 2012) is adopted, where the obtained Pearson’s , Spearman’s , and Kendall’s are 0.41, 0.39, and 0.27, respectively. Since (MS) depends on the definition of the main sequence of SF galaxies, we prefer to use sSFR, a more assumption free value, rather than (MS) to see possible variations in physical properties of molecular gas across the main sequence of SF galaxies in the following sections.
4 Discussions
We found that somehow relates to sSFR (and (MS)) suggesting that physical properties of molecular gas traced by 12CO can be different across the main-sequence of SF galaxies. Here, we investigate relationship of with the other physical parameters of galaxies in section 4.1 and discuss causes of the variety in sections 4.2 and 4.3, and its implications for variety in CO-to-H2 conversion factor () in section 4.4. We also discuss possible effects of the variation across the SF main sequence of galaxies on the known relations of sSFR with SFE and in section 4.5.
4.1 Correlation plots for other parameters
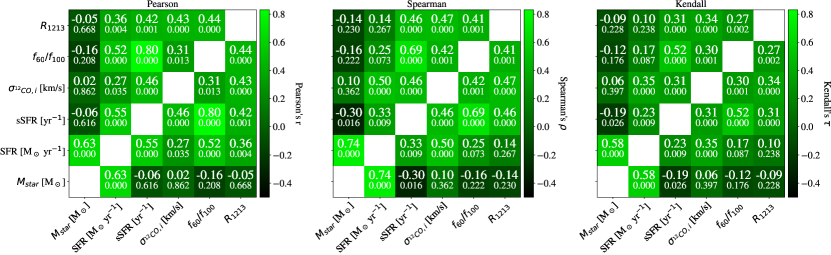
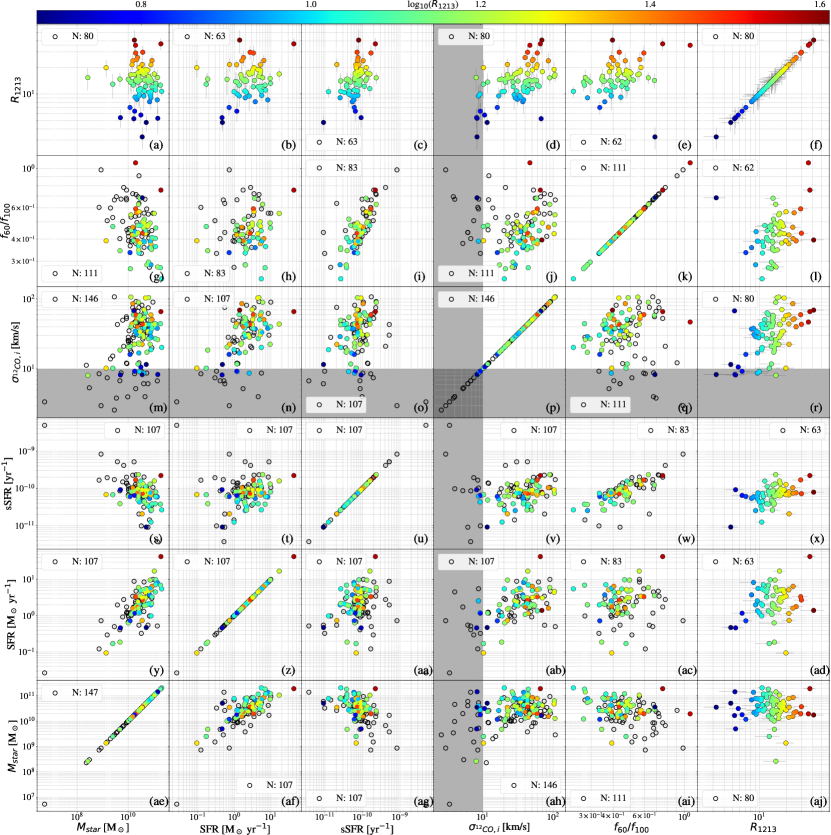
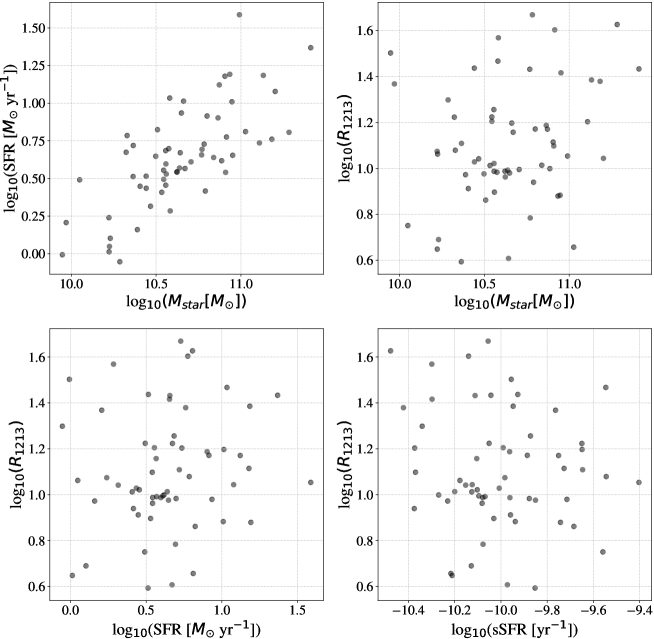
In order to investigate the -sSFR relation, we further compare and sSFR with other four parameters including SFR, , , and in figure 3. We focus on these values because SFR and are respectively a numerator and a denominator of sSFR, and and are measures of physical properties of molecular gas such as turbulence and temperature. Figure 4 shows correlation coefficients of each relation shown in figure 3, which are calculated for galaxies with and sSFR measurements on each panel, i.e., the 63 galaxies indicated as filled circles (or the 62 galaxies for the panels that are related to ).
We find moderate correlations (correlation coefficients of ) between and two parameters: , and (figures 3 and 4). Thus the variation across the main sequence of SF galaxies is likely to be related to the varieties in physical properties of molecular gas. Note that the correlation coefficients do not significantly change even if we simply use instead of . On the other hand, no correlation is found for the - and the -SFR relations. This suggests the correlation between and sSFR is not a consequence of neither a positive correlation between and SFR nor a negative correlation between and .
The strongest correlation is found in the -sSFR relation. Considering that is a measure of dust temperature, this is consistent with previous studies showing higher dust temperature for galaxies with higher sSFR (e.g., Magnelli et al., 2014; Matsuki et al., 2017). The stronger correlation of the -sSFR relation than the one of the -sSFR relation suggests that the former is more fundamental than the latter. Thus, we consider that the correlates with sSFR primarily through the correlations of the sSFR- and - relations.
may also play a role in generating the -sSFR relation. As aforementioned, positively correlates with . In panels (o) or (v) of figure 3 (a comparison of and sSFR), we can see that the bulk of galaxies including those with measurements are located on the upper left or lower right regions showing a moderate positive correlation with a Spearman’s of . There also exist some outliers with km s-1 showing a wide range of sSFR. Consequently, the overall correlation becomes quite weak when including those outliers. Note that these trends are still seen even when we used the stacked spectra of only disk region of galaxies. It should be also noted that the values of the galaxies with km s-1 are upper limits, considering the velocity resolution of km s-1 of the COMING data.
In summary, figures 3 and 4 show that (1) correlates with and , (2) the correlation coefficients for the -sSFR (0.46) and -sSFR (0.69) relations are comparable to or higher than the one for the -sSFR relation (0.46), and (3) the correlation coefficient for the -sSFR relation is higher than the one for the -sSFR relation. Therefore, the observed trend of along sSFR is considered to be mainly caused by with a secondary role of , while accurate measurements of and of those with km s-1 are required for a definite conclusion.
4.2 Causes of the variety
As a cause of the variation, four candidates have been mainly considered since the early studies of in nearby galaxies: changes in (1) physical conditions of molecular gas (density, temperature, and opacity), (2) [12CO]/[13CO] abundance due to selective photodissociation, (3) [12CO]/[13CO] abundance due to chemical fractionation, and (4) 12C/13C isotope abundance ratio due to stellar nucleosynthesis. We consider that the scenario (1) is plausible for the observed variation at least for our sample galaxies and the scenario (4) may play a secondary role. In this section, we explain each scenario and reasons why the scenarios (2)-(4) are not expected to play a major role.
can be approximated as a function of opacity of 12CO () and the abundance ratio of [12CO]/[13CO] under the local thermodynamic equilibrium (LTE) assumption as444 Some studies approximates as by assuming that is large enough (Paglione et al., 2001; Hirota et al., 2010; Cao et al., 2017).:
| (5) |
where is the optical depth of 13CO. If (where , , and are the Boltzman constant, line frequency and kinetic temperature), scales as , where and are 12CO column density and velocity dispersion, respectively. Note that non-LTE analysis also predicts that is a strong function of (Cormier et al., 2018). Thus, the variation can be considered to reflect the variation as a first approximation, and is affected by temperature and turbulence of molecular gas.
Early studies have already noticed a correlation between and (e.g., Young & Sanders 1986; Aalto et al. 1995; Crocker et al. 2012; Herrero-Illana et al. 2019, but see also Vila-Vilaro et al. 2015; Cao et al. 2017). They discussed that high gas temperatures and turbulence (as traced by dust temperature) work against large optical depths in the 12CO. However, no clear observational evidence has been found for a positive correlation between with the velocity dispersion of 12CO line. Although there are relevant studies to the - relation, such as the relationships of with velocity dispersion of 13CO line (Meier & Turner, 2004) and with inclinations of galaxies (Sage & Isbell, 1991), both studies reported null results. In this study, we re-examined and confirmed the correlation between and with the COMING data and additionally found the correlation between and when we limit the sample that are used to investigate the -sSFR correlation. These correlations also support the scenario (1), when we assume , .
The abundance ratio of [12CO]/[13CO] can also affect . The scenarios (2)-(4) are processes changing [12CO]/[13CO] ratio. The selective photodissociation is expected to be dominant basically in low density ( cm-3) domains or in dense regions with very strong radiation fields (Röllig & Ossenkopf, 2013). UV radiation dissociates CO molecules and 13CO is less effective at self-shielding against UV photons than 12CO due to its lower abundance. The chemical fractionation is expected to become important at deeper region of molecular clouds where the dust-shielding is effective for both 12CO and 13CO. In this region with lower temperature of K, 13CO is preferentially formed via the isotopic charge exchange reaction of:
| (6) |
Assuming [12CO]/[13CO]C/13C, the 12C/13C ratio is also potentially an important factor controlling . The 12C/13C ratio is a measure of the ratio of primary to secondary nucleosynthetic components, thus the ratio is expected to decrease as stellar populations evolve, and to depend on the star-formation history (e.g., Audouze et al., 1975), the slope of IMF (e.g., Romano et al., 2017), and the treatments of stellar rotation which affects mixing in stars (e.g., Limongi & Chieffi, 2018; Romano et al., 2019). It is expected that, in the early evolutionary phase of stellar population, 12C/13C is high due to efficient supply of 12C from core-collapse supernovae (SNe) of massive stars, and decrease due to 13C production from intermediate-mass asymptotic giant branch (AGB) stars, then increase due to 12C production from low-mass AGB stars, and decrease again due to type-Ia SNe (e.g., Kobayashi et al., 2011).
There are theoretical and observational studies of in normal galaxies, which contradict with scenarios (2)-(4) as a dominant factor changing . Szűcs et al. (2014) self-consistently calculated of isolated molecular clouds with hydrodynamical simulations taking into account chemical network, various interstellar radiation fields, and cooling and heating processes. They concluded that the selective photodissociation has minimal effect on and the chemical fractionation can cause a factor of decreases. Other theoretical studies also predicted that the photodissociation of CO molecule is not selective since self-shielding is found to be not important compared to dust- and H2-shielding (Krumholz, 2014; Safranek-Shrader et al., 2017).
The observed anti-correlations between and 13CO/C18O reported in various galaxies also disfavor the selective photodissociation scenario (e.g., Paglione et al., 2001; Tan et al., 2011), because the rarer C18O is expected to be more reduced than 13CO if the selective photodissociation is working. It is reported that the radial gradient of in the Milky Way is in the opposite sense of the 12C/13C abundance gradient (Paglione et al., 2001). Crocker et al. (2012) compared several line ratios using six molecular lines and various galaxy properties of 12CO-rich ETGs, and found that correlations between and the galaxy properties were similarly seen even when they used 12CO/HCN ratio (no difference in carbon isotope) instead. This suggests that the chemical fractionation and 12C/13C variation due to stellar nucleosynthesis are not the dominant processes generating the variation in these ETGs.
However, the scenario (4) is likely to become important for extreme dusty SF galaxies such as local ULIRGs, starburst galaxies (Sliwa et al., 2017; Brown & Wilson, 2019), and high- sub-milimetre galaxies (SMGs) (Danielson et al., 2013; Zhang et al., 2018). In these galaxies, high and extremely low 13CO/C18O () values have been found. Given that 18O is produced in massive stars ( M⊙) and assuming 13CO/C18O 13C/18O, the 13CO/C18O is expected to be low for young systems or for top-heavy IMF. Indeed, chemical evolution models of galaxies show that such extreme line ratio can be explained by top-heavy IMF (Romano et al., 2017; Zhang et al., 2018; Romano et al., 2019). The observed correlation between and sSFR in this study may suggest that the stellar nucleosynthesis is also important since sSFR can be a measure of ratio of massive/young and less massive/old stellar populations. The dominant process determining may be different across the SF main sequence. In order to investigate the effect of 12C/13C on the trend across the main sequence, further deep observations in optically-thin lines are required.
4.3 Dependence of the six parameters on galaxy morphologies
| RC3 morphology∗*∗*footnotemark: | SA | SAB+SB | SAB | SB | w/ pec | w/o pec |
|---|---|---|---|---|---|---|
| # of galaxies | 27 | 33 | 20 | 13 | 10 | 53 |
| [ M⊙] | 3.8∗∗**∗∗**footnotemark: | 3.8 | 3.9 | 3.1 | 2.8 | 4.1 |
| (1.8 – 7.1)∗∗∗***∗∗∗***footnotemark: | (2.4 – 7.3) | (2.3 – 6.3) | (2.6 – 11) | (1.7 – 6.9) | (2.4 – 7.3) | |
| SFR [M⊙ yr-1] | 1.9 | 3.1 | 2.7 | 4.7 | 2.0 | 2.4 |
| (1.2 – 2.7) | (1.8 – 5.2) | (1.8 – 3.8) | (2.0 – 8.3) | (1.3 – 3.4) | (1.4 – 4.9) | |
| sSFR [ yr-1] | 6.2 | 7.6 | 7.3 | 8.0 | 6.8 | 7.3 |
| (3.8 – 8.3) | (6.2 – 9.9) | (6.2 – 8.9) | (6.7 – 16) | (4.3 – 12) | (5.2 – 8.8) | |
| [km/s] | 31 | 40 | 37 | 44 | 52 | 38 |
| (18 – 47) | (27 – 53) | (26 – 45) | (37 – 58) | (13 – 59) | (22 – 46) | |
| 0.41 | 0.47 | 0.43 | 0.48 | 0.49 | 0.43 | |
| (0.37 – 1.00) | (0.40 – 0.56) | (0.39 – 0.49) | (0.46 – 0.57) | (0.41 – 0.59) | (0.39 – 0.56) | |
| 12.2 | 15.3 | 16.9 | 14.1 | 17.1 | 14.1 | |
| (10.5 – 14.9) | (13.2 – 18.6) | (14.2 – 21.4) | (12.9 – 16.6) | (13.2 – 22.8) | (10.8 – 17.2) |
There are three “S” galaxies among the 63 galaxies, i.e., no classification for bar structures.; ∗∗**∗∗**footnotemark: Median; ∗∗∗***∗∗∗***footnotemark: (1st quartile – 3rd quartile)
The turbulent and warm properties of interstellar medium (ISM) are a natural consequence for galaxies with high sSFR if star-formation feedbacks plays a major role in determining the ISM properties. Theoretical studies showed that the molecular clouds are expanded due to feedback by H ii regions and are destroyed or displaced by SNe explosion (e.g., Baba et al., 2017; Grisdale et al., 2018). It is also shown that the observed scaling relations of molecular clouds are reproduced when these feedbacks are taken into account (e.g., Grisdale et al., 2018; Fujimoto et al., 2019). However, both the spatial and velocity resolutions of our data are not high enough to resolve a single molecular cloud and to discriminate the effects of star-formation feedback from the other larger-scale processes.
The shorter dynamical (or free-fall) timescale than the star-formation timescale ( %, Kennicutt, 1998; Leroy et al., 2008) suggests that secular processes are important for star formation in galaxies. It is widely known that the bar-structures are expected to drive gas inflow by removing angular momentum of the gas and consequently induce active star formation at the central regions of galaxies (e.g., Wada & Habe, 1995; Sakamoto et al., 1999; Kuno et al., 2007). Galaxy mergers are also a key process inducing gas condensation and triggering star formation in galaxies (e.g., Sanders & Mirabel, 1996; Hopkins et al., 2005). While enhancement of star formation due to mergers or stellar bars may not be so significant ( %, Rodighiero et al., 2011; Saintonge et al., 2012), both processes help to enhance turbulence and broaden the linewidth of CO emission in galaxies (Sorai et al., 2012; Maeda et al., 2018; Sun et al., 2018; Yajima et al., 2019).
Figure 5 shows histograms of the six key values that are compared in figure 3 for subsamples with different types of bar structures (SA/SAB/SB, de Vaucouleurs et al., 1991) and table 1 summarizes medians and quartiles of these values for each subsample. The galaxies categorized as “pec” in de Vaucouleurs et al. (1991) are also separately presented in the same figure and table. According to the Kolmogorov-Smirnov (KS) test, there are no significant differences in (p-value of ), sSFR (), (), and () between barred (SAB+SB) and non-barred (SA) galaxies, whereas SFR and tend to be higher for barred galaxies than non-barred galaxies, whose -values are and , respectively. Although the -values of the KS test are not small enough, the median values of sSFR, , and are higher for barred galaxies than non-barred galaxies. Therefore, the obtained tendency where galaxies with higher sSFR have broader in this study might be partially attributed to those barred galaxies.
In terms of the morphological peculiarities indicated with the suffix of “pec”, on the other hand, we do not find a clear differences in any of the six values (figure 5 and table 1). Although no closely-interacting galaxies is included in our sample, the morphological peculiarities are generally indicative of galaxy interaction. This suggests that the galaxy interaction is unlikely to be a major cause of the wider for galaxies with higher sSFR at least in our sample. Therefore, high turbulence and temperature are likely to be primarily due to active star formation, and stellar bar might partially play some roles in driving the high turbulence of the molecular gas and the active star formation via efficient gas inflow.
4.4 Implications of the variety of CO-to-H2 conversion factor across the main sequence
We adopted a constant to estimate molecular gas mass of the COMING galaxies in this study, while the variety suggests different among the COMING galaxies. Cormier et al. (2018) showed that the relationship between and is different from galaxies to galaxies, while their non-LTE radiative transfer calculations with RADEX (van der Tak et al., 2007) predicts a clear anti-correlation between these two values, which is ascribed to variation (Sandstrom et al., 2013). Indeed, Accurso et al. (2017) found that depends not only on metallicity but also on (MS). In this subsection, we discuss a possible variety in and its impact on our results.
Our data show that galaxies with high sSFR tend to have high , suggesting low owing to high gas temperature and large linewidths. According to magnetohydrodynamic simulations of molecular clouds, it is claimed that scales with temperature and 12CO linewidth as and , respectively (Shetty et al., 2011). The dust temperatures of the COMING galaxies inferred from and a conventional modified black-body model (opacity of cm2 g-1 at =200 GHz, and emissivity index of ) ranges K. The ranges km s-1, although there also exists low- ( km s-1) galaxies in our sample. Assuming gas temperature equals to dust temperature and , these varieties could impose an variety by a factor of at most for our sample. Thus, the correlations between and in figure 1c would be actually weaker than the one obtained when using a constant . With a sophisticated technique to derive using CO, H i and dust maps of galaxies (Leroy et al., 2011; Sandstrom et al., 2013), variations among the COMING galaxies are investigated in a forthcoming paper (Yasuda et al. in prep.).
There are three caveats here: (1) the resolutions of our data are not spatially or spectroscopically high enough to resolve a single molecular cloud, (2) the “luminosity-weighted” dust temperature does not necessarily reflect the temperature of the bulk of molecular gas, and (3) contribution from diffuse molecular gas. The kpc-scale beam encompasses multiple molecular clouds and the observed velocity dispersion is likely to reflect inter-cloud velocity dispersion rather than that of a single cloud. Additionally, the dust temperature derived by SED fitting is “luminosity-weighted” temperature rather than mass-weighted (Scoville et al., 2014, 2016). But, the ranges of velocity dispersion and temperature we assumed here are not significantly different from the observed values for molecular clouds. It is known that the velocity dispersions of molecular clouds including those at the central region of the Milky Way range km s-1 (e.g., Oka et al., 2001). The multi-transitions CO observations revealed that temperature of molecular clouds is reported to range from K for quiescent clouds to K for clouds with H ii regions in M 33 (Wilson et al., 1997). The assumed varieties of and here are not so inadequate to consider the possible maximum variety in the value.
For the third point, several studies of both the Milky-Way clouds and extragalactic objects suggest that non-negligible fraction of 12CO comes from diffuse molecular component ( %; e.g., Wilson & Walker, 1994; Rosolowsky et al., 2007; Sawada et al., 2012; Pety et al., 2013; Morokuma-Matsui et al., 2015; Maeda et al., 2020; Liszt, 2020). This diffuse molecular component is considered to consist of volume-filling diffuse molecular gas and/or envelope of molecular clouds (Wilson & Walker, 1994; Meier et al., 2000; Pety et al., 2013). Considering that the diffuse component tends to have large velocity dispersion (Garcia-Burillo et al., 1992; Pety et al., 2013; Caldú-Primo et al., 2013), the positive correlations of the sSFR-and -relations indicates a larger fraction of the diffuse component for galaxies with high sSFR and . The CO-to-H2 conversion factor is reported to be similar in diffuse and dense molecular gas on average with a large scatter in the Milky Way because the small abundance ratio of [CO]/[H2] in diffuse gas is compensated by a much higher brightness per CO molecule (Liszt et al., 2010; Liszt & Pety, 2012). However, it is important to investigate a fraction of the diffuse molecular-gas component of galaxies as a function of sSFR to understand the variation across the main-sequence of SF galaxies.
4.5 Implications for galaxy evolution on the SFR-Mass parameters space and high redshift galaxies
Our results suggest that there might be an variety across the SF main sequence as a consequence of the differences in temperature and degree of turbulence of molecular gas in galaxies at least for the local Universe. This further suggests that one may need to pay special attention when discussing either of which or SFE is the dominant factor controlling sSFR (or (MS)). Previous studies found that (MS) and sSFR are correlated with both and SFE, i.e., galaxies with higher SFR at fixed have more abundant molecular gas and are forming stars more efficiently from the molecular gas (Saintonge et al., 2012; Genzel et al., 2015; Scoville et al., 2017; Tacconi et al., 2018). The possible variation by a factor of is unlikely to completely extinguish the reported correlations between sSFR and or SFE since the correlations are found over more than 2 orders of magnitude of the both values. However, a magnitude relationship of the strength of the known positive correlations between sSFR and or SFE can be affected, since is numerator and denominator of and SFE, respectively. If galaxies with higher sSFR tend to have lower , SFE would become relatively more important for the sSFR (or (MS)) variation than , as claimed in Ellison et al. (2020b).
The redshift evolution of can be discussed in the same context combined with redshift evolution of metallicity. sSFR of the main-sequence galaxies at fixed is known to increase as redshift increases (e.g., Whitaker et al., 2012; Speagle et al., 2014), making one expect higher turbulence and temperature of ISM in the higher-redshift galaxies from this study. Indeed, high-redshift galaxies tend to have more highly turbulent molecular gas (Genzel et al., 2013; Übler et al., 2018; Girard et al., 2019), higher dust temperature (Magdis et al., 2012; Magnelli et al., 2014; Schreiber et al., 2018) and lower metallicity (e.g., Savaglio et al., 2005; Shapley et al., 2005; Erb et al., 2006; Liu et al., 2008; Maiolino et al., 2008; Mannucci et al., 2009; Yuan et al., 2013; Steidel et al., 2014) than local galaxies. With the Milky-Way type , a much larger value is reported in galaxies at ( %, e.g., Daddi et al., 2010; Tacconi et al., 2013; Genzel et al., 2013; Riechers et al., 2020; Tacconi et al., 2020, and references therein) than local galaxies ( %, e.g., Saintonge et al., 2011, 2017; Bolatto et al., 2017; Sorai et al., 2019). Since value is one of the key parameters to constraint on both star-formation and feedback models in cosmological simulations and semi-analytic models of galaxy formation (e.g., Popping et al., 2012, 2014, 2015; Morokuma-Matsui & Baba, 2015; Saintonge et al., 2017), accurate estimation at higher redshifts is essential.
Taking the three parameters (metallicity, velocity dispersion, and temperature) into consideration, we roughly estimate of galaxies at high redshifts. For galaxies with M⊙ at , the metallicity, velocity dispersion of molecular gas, and dust temperature can be respectively -dex lower (Yabe et al., 2014; Zahid et al., 2014; Kashino et al., 2017)555At the redshift, massive systems with M⊙ are known to be already enriched to the level observed in local counterparts (Zahid et al., 2014; Kashino et al., 2017)., times higher (Genzel et al., 2013), and only times higher than local counterparts. In this case, the effects of metallicity and temperature are negligible (Bolatto et al., 2013) and could become lower than the local value by a factor of 2. Indeed, Carleton et al. (2017) obtained comparable for galaxies at to the local galaxies when they assume several models for redshift evolution of SFE. Future high spatial- and velocity-resolution observations in 12CO of high redshift galaxies would shed light on the variety across the SF main sequence of galaxies as a function of redshift.
5 Summary
Using the 12CO and 13CO mapping data obtained in the COMING project, we investigate the relationship between and sSFR combined with other four parameters (, SFR, , and ) of local star-forming galaxies to understand the molecular gas properties traced with 12CO line on the SFR-Mass relation of galaxies. Owing to the stacking analysis, 13CO emission is successfully detected in 80 galaxies out of the 147 COMING galaxies. The obtained results and implications are as follows:
- •
- •
- •
-
•
The correlations of the sSFR- and sSFR- relations for galaxies with measurements suggest that high turbulence and temperature of ISM are related to active star formation (section 4.1, figures 3 and 4). Stellar bars might play some roles in enhancing the turbulence and in inducing the active star formation at the central regions of galaxies via gas inflow, which is supported by slightly larger median values of and sSFR for barred galaxies than non-barred galaxies in our sample although there is a large overlap between them (section 4.3, figure 5 and table 1).
- •
-
•
The inferred variation is not likely to completely extinguish the correlations between sSFR and or SFE reported in literatures. However, a magnitude relationship of the strength of the positive correlations between sSFR and or SFE can be affected, since is numerator and denominator for and SFE, respectively (section 4.5).
We thank the anonymous referee for his/her comments which improve our paper. This work was supported by JSPS KAKENHI Grant Numbers of 19J40004, 19H01931, 17H01110 and 19H05076. This work has also been supported in part by the Sumitomo Foundation Fiscal 2018 Grant for Basic Science Research Projects (180923), and the Collaboration Funding of the Institute of Statistical Mathematics “New Development of the Studies on Galaxy Evolution with a Method of Data Science”. This publication makes use of data products from the Wide-field Infrared Survey Explorer, which is a joint project of the University of California, Los Angeles, and the Jet Propulsion Laboratory/California Institute of Technology, funded by the National Aeronautics and Space Administration.
References
- Aalto et al. (2010) Aalto, S., Beswick, R., & Jütte, E. 2010, A&A, 522, A59
- Aalto et al. (1991) Aalto, S., Black, J. H., Johansson, L. E. B., & Booth, R. S. 1991, A&A, 249, 323
- Aalto et al. (1995) Aalto, S., Booth, R. S., Black, J. H., & Johansson, L. E. B. 1995, A&A, 300, 369
- Aalto et al. (1994) Aalto, S., Booth, R. S., Black, J. H., Koribalski, B., & Wielebinski, R. 1994, A&A, 286, 365
- Aalto et al. (1997) Aalto, S., Radford, S. J. E., Scoville, N. Z., & Sargent, A. I. 1997, ApJ, 475, L107
- Accurso et al. (2017) Accurso, G., Saintonge, A., Catinella, B., et al. 2017, MNRAS, 470, 4750
- Alatalo et al. (2015) Alatalo, K., Crocker, A. F., Aalto, S., et al. 2015, MNRAS, 450, 3874
- Audouze et al. (1975) Audouze, J., Lequeux, J., & Vigroux, L. 1975, A&A, 43, 71
- Baba et al. (2017) Baba, J., Morokuma-Matsui, K., & Saitoh, T. R. 2017, MNRAS, 464, 246
- Becker & Freudling (1991) Becker, R., & Freudling, W. 1991, A&A, 251, 454
- Béthermin et al. (2018) Béthermin, M., Greve, T. R., De Breuck, C., et al. 2018, A&A, 620, A115
- Blitz et al. (1984) Blitz, L., Magnani, L., & Mundy, L. 1984, ApJ, 282, L9
- Bolatto et al. (2013) Bolatto, A. D., Wolfire, M., & Leroy, A. K. 2013, ARA&A, 51, 207
- Bolatto et al. (2017) Bolatto, A. D., Wong, T., Utomo, D., et al. 2017, ApJ, 846, 159
- Braine et al. (1993) Braine, J., Combes, F., & van Driel, W. 1993, A&A, 280, 451
- Brown & Wilson (2019) Brown, T., & Wilson, C. D. 2019, ApJ, 879, 17
- Caldú-Primo et al. (2013) Caldú-Primo, A., Schruba, A., Walter, F., et al. 2013, AJ, 146, 150
- Cao et al. (2017) Cao, Y., Wong, T., Xue, R., et al. 2017, ApJ, 847, 33
- Carleton et al. (2017) Carleton, T., Cooper, M. C., Bolatto, A. D., et al. 2017, MNRAS, 467, 4886
- Casasola et al. (2017) Casasola, V., Cassarà, L. P., Bianchi, S., et al. 2017, A&A, 605, A18
- Casoli et al. (1992) Casoli, F., Dupraz, C., & Combes, F. 1992, A&A, 264, 55
- Cormier et al. (2018) Cormier, D., Bigiel, F., Jiménez-Donaire, M. J., et al. 2018, MNRAS, 475, 3909
- Crocker et al. (2012) Crocker, A., Krips, M., Bureau, M., et al. 2012, MNRAS, 421, 1298
- Daddi et al. (2007) Daddi, E., Dickinson, M., Morrison, G., et al. 2007, ApJ, 670, 156
- Daddi et al. (2010) Daddi, E., Bournaud, F., Walter, F., et al. 2010, ApJ, 713, 686
- Danielson et al. (2013) Danielson, A. L. R., Swinbank, A. M., Smail, I., et al. 2013, MNRAS, 436, 2793
- Davis (2014) Davis, T. A. 2014, MNRAS, 445, 2378
- de Vaucouleurs et al. (1991) de Vaucouleurs, G., de Vaucouleurs, A., Corwin, Jr., H. G., et al. 1991, Third Reference Catalogue of Bright Galaxies. Volume I: Explanations and references. Volume II: Data for galaxies between 0h and 12h. Volume III: Data for galaxies between 12h and 24h.
- Dickman (1978) Dickman, R. L. 1978, ApJS, 37, 407
- Eckart et al. (1990) Eckart, A., Cameron, M., Rothermel, H., et al. 1990, ApJ, 363, 451
- Elbaz et al. (2007) Elbaz, D., Daddi, E., Le Borgne, D., et al. 2007, A&A, 468, 33
- Ellison et al. (2020a) Ellison, S. L., Thorp, M. D., Pan, H.-A., et al. 2020a, MNRAS, 492, 6027
- Ellison et al. (2020b) Ellison, S. L., Thorp, M. D., Lin, L., et al. 2020b, MNRAS, 493, L39
- Encrenaz et al. (1979) Encrenaz, P. J., Stark, A. A., Combes, F., & Wilson, R. W. 1979, A&A, 78, L1
- Erb et al. (2006) Erb, D. K., Shapley, A. E., Pettini, M., et al. 2006, ApJ, 644, 813
- Frerking et al. (1982) Frerking, M. A., Langer, W. D., & Wilson, R. W. 1982, ApJ, 262, 590
- Fujimoto et al. (2019) Fujimoto, Y., Chevance, M., Haydon, D. T., Krumholz, M. R., & Kruijssen, J. M. D. 2019, MNRAS, 487, 1717
- Garay et al. (1993) Garay, G., Mardones, D., & Mirabel, I. F. 1993, A&A, 277, 405
- Garcia-Burillo et al. (1992) Garcia-Burillo, S., Guelin, M., Cernicharo, J., & Dahlem, M. 1992, A&A, 266, 21
- Genzel et al. (2013) Genzel, R., Tacconi, L. J., Kurk, J., et al. 2013, ApJ, 773, 68
- Genzel et al. (2015) Genzel, R., Tacconi, L. J., Lutz, D., et al. 2015, ApJ, 800, 20
- Girard et al. (2019) Girard, M., Dessauges-Zavadsky, M., Combes, F., et al. 2019, A&A, 631, A91
- Gordon & Burton (1976) Gordon, M. A., & Burton, W. B. 1976, ApJ, 208, 346
- Grisdale et al. (2018) Grisdale, K., Agertz, O., Renaud, F., & Romeo, A. B. 2018, MNRAS, 479, 3167
- Halfen et al. (2017) Halfen, D. T., Woolf, N. J., & Ziurys, L. M. 2017, ApJ, 845, 158
- Henkel et al. (2010) Henkel, C., Downes, D., Weiß, A., Riechers, D., & Walter, F. 2010, A&A, 516, A111
- Herrero-Illana et al. (2019) Herrero-Illana, R., Privon, G. C., Evans, A. S., et al. 2019, A&A, 628, A71
- Hirota et al. (2010) Hirota, A., Kuno, N., Sato, N., et al. 2010, PASJ, 62, 1261
- Hopkins et al. (2005) Hopkins, P. F., Hernquist, L., Cox, T. J., et al. 2005, ApJ, 630, 705
- Kashino et al. (2017) Kashino, D., Silverman, J. D., Sanders, D., et al. 2017, ApJ, 835, 88
- Kennicutt (1998) Kennicutt, Jr., R. C. 1998, ApJ, 498, 541
- Kikumoto et al. (1998) Kikumoto, T., Taniguchi, Y., Nakai, N., et al. 1998, PASJ, 50, 309
- Knapp & Bowers (1988) Knapp, G. R., & Bowers, P. F. 1988, ApJ, 331, 974
- Kobayashi et al. (2011) Kobayashi, C., Karakas, A. I., & Umeda, H. 2011, MNRAS, 414, 3231
- Koyama et al. (2017) Koyama, S., Koyama, Y., Yamashita, T., et al. 2017, ApJ, 847, 137
- Koyama et al. (2019) —. 2019, ApJ, 874, 142
- Kroupa (2001) Kroupa, P. 2001, MNRAS, 322, 231
- Kroupa & Weidner (2003) Kroupa, P., & Weidner, C. 2003, ApJ, 598, 1076
- Krumholz (2014) Krumholz, M. R. 2014, MNRAS, 437, 1662
- Kuno et al. (2007) Kuno, N., Sato, N., Nakanishi, H., et al. 2007, PASJ, 59, 117
- Lada et al. (1994) Lada, C. J., Lada, E. A., Clemens, D. P., & Bally, J. 1994, ApJ, 429, 694
- Lee & Chung (2018) Lee, B., & Chung, A. 2018, ApJ, 866, L10
- Leitherer et al. (1999) Leitherer, C., Schaerer, D., Goldader, J. D., et al. 1999, ApJS, 123, 3
- Leroy et al. (2008) Leroy, A. K., Walter, F., Brinks, E., et al. 2008, AJ, 136, 2782
- Leroy et al. (2011) Leroy, A. K., Bolatto, A., Gordon, K., et al. 2011, ApJ, 737, 12
- Limongi & Chieffi (2018) Limongi, M., & Chieffi, A. 2018, ApJS, 237, 13
- Lin et al. (2017) Lin, L., Belfiore, F., Pan, H.-A., et al. 2017, ApJ, 851, 18
- Liszt (2020) Liszt, H. S. 2020, arXiv e-prints, arXiv:2005.10270
- Liszt & Pety (2012) Liszt, H. S., & Pety, J. 2012, A&A, 541, A58
- Liszt et al. (2010) Liszt, H. S., Pety, J., & Lucas, R. 2010, A&A, 518, A45
- Liu et al. (2008) Liu, X., Shapley, A. E., Coil, A. L., Brinchmann, J., & Ma, C.-P. 2008, ApJ, 678, 758
- Maeda et al. (2018) Maeda, F., Ohta, K., Fujimoto, Y., Habe, A., & Baba, J. 2018, PASJ, 70, 37
- Maeda et al. (2020) Maeda, F., Ohta, K., Fujimoto, Y., Habe, A., & Ushio, K. 2020, MNRAS, arXiv:2005.03019
- Magdis et al. (2012) Magdis, G. E., Daddi, E., Béthermin, M., et al. 2012, ApJ, 760, 6
- Magnelli et al. (2014) Magnelli, B., Lutz, D., Saintonge, A., et al. 2014, A&A, 561, A86
- Maiolino et al. (2008) Maiolino, R., Nagao, T., Grazian, A., et al. 2008, A&A, 488, 463
- Mannucci et al. (2009) Mannucci, F., Cresci, G., Maiolino, R., et al. 2009, MNRAS, 398, 1915
- Martin et al. (2005) Martin, D. C., Fanson, J., Schiminovich, D., et al. 2005, ApJ, 619, L1
- Matsuki et al. (2017) Matsuki, Y., Koyama, Y., Nakagawa, T., & Takita, S. 2017, MNRAS, 466, 2517
- Matsushita et al. (1998) Matsushita, S., Kohno, K., Vila-Vilaro, B., Tosaki, T., & Kawabe, R. 1998, ApJ, 495, 267
- Meier & Turner (2004) Meier, D. S., & Turner, J. L. 2004, AJ, 127, 2069
- Meier et al. (2000) Meier, D. S., Turner, J. L., & Hurt, R. L. 2000, ApJ, 531, 200
- Milam et al. (2005) Milam, S. N., Savage, C., Brewster, M. A., Ziurys, L. M., & Wyckoff, S. 2005, ApJ, 634, 1126
- Morokuma-Matsui & Baba (2015) Morokuma-Matsui, K., & Baba, J. 2015, MNRAS, 454, 3792
- Morokuma-Matsui et al. (2015) Morokuma-Matsui, K., Sorai, K., Watanabe, Y., & Kuno, N. 2015, PASJ, 67, 2
- Noeske et al. (2007) Noeske, K. G., Weiner, B. J., Faber, S. M., et al. 2007, ApJ, 660, L43
- Oka et al. (2001) Oka, T., Hasegawa, T., Sato, F., et al. 2001, ApJ, 562, 348
- Paglione et al. (2001) Paglione, T. A. D., Wall, W. F., Young, J. S., et al. 2001, ApJS, 135, 183
- Papadopoulos & Seaquist (1998) Papadopoulos, P. P., & Seaquist, E. R. 1998, ApJ, 492, 521
- Papadopoulos & Seaquist (1999) —. 1999, ApJ, 516, 114
- Pety et al. (2013) Pety, J., Schinnerer, E., Leroy, A. K., et al. 2013, ApJ, 779, 43
- Polk et al. (1988) Polk, K. S., Knapp, G. R., Stark, A. A., & Wilson, R. W. 1988, ApJ, 332, 432
- Popping et al. (2015) Popping, G., Behroozi, P. S., & Peeples, M. S. 2015, MNRAS, 449, 477
- Popping et al. (2012) Popping, G., Caputi, K. I., Somerville, R. S., & Trager, S. C. 2012, MNRAS, 425, 2386
- Popping et al. (2014) Popping, G., Somerville, R. S., & Trager, S. C. 2014, MNRAS, 442, 2398
- Rickard et al. (1977) Rickard, L. J., Palmer, P., Morris, M., Turner, B. E., & Zuckerman, B. 1977, ApJ, 213, 673
- Rickard et al. (1975) Rickard, L. J., Palmer, P., Morris, M., Zuckerman, B., & Turner, B. E. 1975, ApJ, 199, L75
- Riechers et al. (2020) Riechers, D. A., Boogaard, L. A., Decarli, R., et al. 2020, arXiv e-prints, arXiv:2005.09653
- Rodighiero et al. (2011) Rodighiero, G., Daddi, E., Baronchelli, I., et al. 2011, ApJ, 739, L40
- Röllig & Ossenkopf (2013) Röllig, M., & Ossenkopf, V. 2013, A&A, 550, A56
- Romano et al. (2019) Romano, D., Matteucci, F., Zhang, Z.-Y., Ivison, R. J., & Ventura, P. 2019, MNRAS, 490, 2838
- Romano et al. (2017) Romano, D., Matteucci, F., Zhang, Z. Y., Papadopoulos, P. P., & Ivison, R. J. 2017, MNRAS, 470, 401
- Rosolowsky et al. (2007) Rosolowsky, E., Keto, E., Matsushita, S., & Willner, S. P. 2007, ApJ, 661, 830
- Safranek-Shrader et al. (2017) Safranek-Shrader, C., Krumholz, M. R., Kim, C.-G., et al. 2017, MNRAS, 465, 885
- Sage (1990) Sage, L. J. 1990, A&A, 239, 125
- Sage & Isbell (1991) Sage, L. J., & Isbell, D. W. 1991, A&A, 247, 320
- Saintonge et al. (2011) Saintonge, A., Kauffmann, G., Kramer, C., et al. 2011, MNRAS, 415, 32
- Saintonge et al. (2012) Saintonge, A., Tacconi, L. J., Fabello, S., et al. 2012, ApJ, 758, 73
- Saintonge et al. (2017) Saintonge, A., Catinella, B., Tacconi, L. J., et al. 2017, ApJS, 233, 22
- Sakamoto et al. (1999) Sakamoto, K., Okumura, S. K., Ishizuki, S., & Scoville, N. Z. 1999, ApJ, 525, 691
- Sakamoto et al. (1997) Sakamoto, S., Handa, T., Sofue, Y., Honma, M., & Sorai, K. 1997, ApJ, 475, 134
- Sakamoto et al. (1994) Sakamoto, S., Hayashi, M., Hasegawa, T., Handa, T., & Oka, T. 1994, ApJ, 425, 641
- Salpeter (1955) Salpeter, E. E. 1955, ApJ, 121, 161
- Sanders et al. (2003) Sanders, D. B., Mazzarella, J. M., Kim, D. C., Surace, J. A., & Soifer, B. T. 2003, AJ, 126, 1607
- Sanders & Mirabel (1996) Sanders, D. B., & Mirabel, I. F. 1996, ARA&A, 34, 749
- Sandqvist et al. (1988) Sandqvist, A., Elfhag, T., & Jorsater, S. 1988, A&A, 201, 223
- Sandstrom et al. (2013) Sandstrom, K. M., Leroy, A. K., Walter, F., et al. 2013, ApJ, 777, 5
- Savaglio et al. (2005) Savaglio, S., Glazebrook, K., Le Borgne, D., et al. 2005, ApJ, 635, 260
- Sawada et al. (2012) Sawada, T., Hasegawa, T., Sugimoto, M., Koda, J., & Handa, T. 2012, ApJ, 752, 118
- Schreiber et al. (2018) Schreiber, C., Elbaz, D., Pannella, M., et al. 2018, A&A, 609, A30
- Schruba et al. (2011) Schruba, A., Leroy, A. K., Walter, F., et al. 2011, AJ, 142, 37
- Scoville et al. (2014) Scoville, N., Aussel, H., Sheth, K., et al. 2014, ApJ, 783, 84
- Scoville et al. (2016) Scoville, N., Sheth, K., Aussel, H., et al. 2016, ApJ, 820, 83
- Scoville et al. (2017) Scoville, N., Lee, N., Vanden Bout, P., et al. 2017, ApJ, 837, 150
- Shapley et al. (2005) Shapley, A. E., Coil, A. L., Ma, C.-P., & Bundy, K. 2005, ApJ, 635, 1006
- Sheth et al. (2010) Sheth, K., Regan, M., Hinz, J. L., et al. 2010, PASP, 122, 1397
- Shetty et al. (2011) Shetty, R., Glover, S. C., Dullemond, C. P., et al. 2011, MNRAS, 415, 3253
- Sliwa et al. (2017) Sliwa, K., Wilson, C. D., Aalto, S., & Privon, G. C. 2017, ApJ, 840, L11
- Solomon & de Zafra (1975) Solomon, P. M., & de Zafra, R. 1975, ApJ, 199, L79
- Solomon et al. (1979) Solomon, P. M., Scoville, N. Z., & Sanders, D. B. 1979, ApJ, 232, L89
- Sorai et al. (2012) Sorai, K., Kuno, N., Nishiyama, K., et al. 2012, PASJ, 64, 51
- Sorai et al. (2019) Sorai, K., Kuno, N., Muraoka, K., et al. 2019, PASJ, 71, S14
- Speagle et al. (2014) Speagle, J. S., Steinhardt, C. L., Capak, P. L., & Silverman, J. D. 2014, ApJS, 214, 15
- Spilker et al. (2014) Spilker, J. S., Marrone, D. P., Aguirre, J. E., et al. 2014, ApJ, 785, 149
- Stark & Carlson (1984) Stark, A. A., & Carlson, E. R. 1984, ApJ, 279, 122
- Steidel et al. (2014) Steidel, C. C., Rudie, G. C., Strom, A. L., et al. 2014, ApJ, 795, 165
- Sun et al. (2018) Sun, J., Leroy, A. K., Schruba, A., et al. 2018, ApJ, 860, 172
- Szűcs et al. (2014) Szűcs, L., Glover, S. C. O., & Klessen, R. S. 2014, MNRAS, 445, 4055
- Tacconi et al. (2020) Tacconi, L. J., Genzel, R., & Sternberg, A. 2020, arXiv e-prints, arXiv:2003.06245
- Tacconi et al. (2013) Tacconi, L. J., Neri, R., Genzel, R., et al. 2013, ApJ, 768, 74
- Tacconi et al. (2018) Tacconi, L. J., Genzel, R., Saintonge, A., et al. 2018, ApJ, 853, 179
- Tan et al. (2011) Tan, Q.-H., Gao, Y., Zhang, Z.-Y., & Xia, X.-Y. 2011, Research in Astronomy and Astrophysics, 11, 787
- Taniguchi & Ohyama (1998) Taniguchi, Y., & Ohyama, Y. 1998, ApJ, 507, L121
- Übler et al. (2018) Übler, H., Genzel, R., Tacconi, L. J., et al. 2018, ApJ, 854, L24
- van der Tak et al. (2007) van der Tak, F. F. S., Black, J. H., Schöier, F. L., Jansen, D. J., & van Dishoeck, E. F. 2007, A&A, 468, 627
- Vila-Vilaro et al. (2015) Vila-Vilaro, B., Cepa, J., & Zabludoff, A. 2015, ApJS, 218, 28
- Wada & Habe (1995) Wada, K., & Habe, A. 1995, MNRAS, 277, 433
- Watanabe et al. (2011) Watanabe, Y., Sorai, K., Kuno, N., & Habe, A. 2011, MNRAS, 411, 1409
- Weliachew et al. (1988) Weliachew, L., Casoli, F., & Combes, F. 1988, A&A, 199, 29
- Wen et al. (2013) Wen, X.-Q., Wu, H., Zhu, Y.-N., et al. 2013, MNRAS, 433, 2946
- Whitaker et al. (2012) Whitaker, K. E., van Dokkum, P. G., Brammer, G., & Franx, M. 2012, ApJ, 754, L29
- Wild et al. (1997) Wild, W., Eckart, A., & Wiklind, T. 1997, A&A, 322, 419
- Wilson & Walker (1994) Wilson, C. D., & Walker, C. E. 1994, ApJ, 432, 148
- Wilson et al. (1997) Wilson, C. D., Walker, C. E., & Thornley, M. D. 1997, ApJ, 483, 210
- Wright et al. (2010) Wright, E. L., Eisenhardt, P. R. M., Mainzer, A. K., et al. 2010, AJ, 140, 1868
- Wright et al. (1993) Wright, M. C. H., Ishizuki, S., Turner, J. L., Ho, P. T. P., & Lo, K. Y. 1993, ApJ, 406, 470
- Wuyts et al. (2011) Wuyts, S., Förster Schreiber, N. M., Lutz, D., et al. 2011, ApJ, 738, 106
- Xie et al. (1994) Xie, S., Young, J., & Schloerb, F. P. 1994, ApJ, 421, 434
- Yabe et al. (2014) Yabe, K., Ohta, K., Iwamuro, F., et al. 2014, MNRAS, 437, 3647
- Yajima et al. (2019) Yajima, Y., Sorai, K., Kuno, N., et al. 2019, PASJ, 71, S13
- Young & Sanders (1986) Young, J. S., & Sanders, D. B. 1986, ApJ, 302, 680
- Young & Scoville (1982) Young, J. S., & Scoville, N. 1982, ApJ, 258, 467
- Young & Scoville (1984) Young, J. S., & Scoville, N. Z. 1984, ApJ, 287, 153
- Yuan et al. (2013) Yuan, T. T., Kewley, L. J., & Richard, J. 2013, ApJ, 763, 9
- Zahid et al. (2014) Zahid, H. J., Kashino, D., Silverman, J. D., et al. 2014, ApJ, 792, 75
- Zhang et al. (2018) Zhang, Z.-Y., Romano, D., Ivison, R. J., Papadopoulos, P. P., & Matteucci, F. 2018, Nature, 558, 260
Possibility of fake correlation for the -sSFR relation
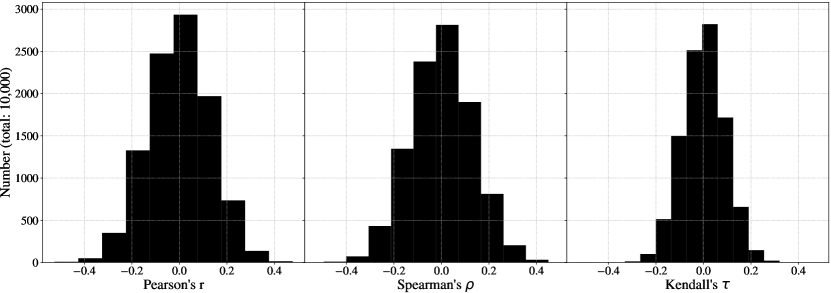
We find a moderate correlation between and sSFR for the 63 galaxies but no correlation for the -SFR (a numerator of sSFR) and - (a denominator of sSFR) relations in this study. In order to examine whether or not the obtained correlation of the -sSFR relation is fake due to the small number of galaxies, we generate 10,000 sets of mock galaxy samples based on the mean vector and the variance-covariance matrix obtained from the observed , SFR, and values of the COMING galaxies using the Multivariate_normal function of the Python module Numpy. For the number of galaxies in each set, three cases are considered : 60, 100, and 1000. Then we manually set the covariances of the - and -SFR relations to be zero. The relationship among these three values of a mock galaxy sample is shown in figure 6. Using this 10,000 mock data sets, we calculate sSFR and correlation coefficients of the resultant -sSFR relation.
Figure 7 shows the histogram of the obtained values of the Pearson’s r, Spearman’s , and Kendall’s for the 10,000 mock data sets. The largest , , and are 0.48, 0.45, and 0.32, respectively. The number of the mock dataset with larger correlation coefficients than the observed values are 5 for the Pearson’s r, 0 for the Spearman’s , and 3 for the Kendall’s , i.e., -values of , , and . We also find that the histograms become sharper for the larger number of galaxies in each data set. This result shows that the probability of fake correlation reduces as the number of galaxy sample increases. The sample number of 63 in this study is large enough to conclude that the obtained positive correlation between and sSFR with correlation coefficients is not fake.