Superconductivity at the three-dimensional Anderson metal-insulator transition
Abstract
We study a disordered weakly-coupled superconductor around the Anderson transition by solving numerically the Bogoliubov-de Gennes (BdG) equations in a three dimensional lattice of size up to in the presence of a random potential. The spatial average of the order parameter is moderately enhanced as disorder approaches the transition but decreases sharply in the insulating region. The spatial distribution of the order parameter is sensitive to the disorder strength: for intermediate disorders below the transition, we already observe a highly asymmetric distribution with an exponential tail. Around the transition, it is well described by a log-normal distribution and a parabolic singularity spectrum. These features are typical of a multifractal measure. We determine quantitatively the critical disorder at which the insulator transition occurs by an analysis of level statistics in the spectral region that contributes to the formation of the order parameter. Interestingly, spectral correlations at the transition are similar to those found in non-interacting disordered systems at the Anderson transition. A percolation analysis suggests that the loss of phase coherence may occur around the critical disorder.
I Introduction
Quantum coherence effects are of paramount importance in the dynamics of disordered and quantum chaotic systems. However, until rather recently, its effect on superconductivity has been relatively overlooked. A reason for that is the so called Anderson theorem Anderson1959 , also postulated by Gorkov Gorkov1961 , that non-magnetic impurities in metals did not break Cooper pairs and therefore have only a relatively small effect on superconductivity. In parallel, experiments in metallic superconductors Abeles1966 ; Abeles1967 were relatively well described without the need to consider these effects. However, computational advances together with an enhanced experimental control and the introduction of the scanning tunneling microscope started to reveal a completely different picture. Numerical solutions of two dimensional BdG equations in a random potential ghosal1998 ; Ghosal2001 showed an emergent granularity and strong spatial fluctuations of the order parameter even for disorder strengths within the metallic region but not far from superconductor-insulator transition. This emergent granularity was later corroborated experimentally goldman1993 ; Orr1985 ; Jaeger1986 ; Jaeger1989 ; Sacepe2011 ; Trivedi2012 ; Mondal2011 ; Lemarie2013 ; Chand2012 . Indeed, as spatial dimensionality is reduced, it was explicitly observed that quantum coherence effects became increasingly relevant xue2010 ; Uchihashi2016 . For instance, quantum size effects related to confinement were predicted theoretically Blatt1963 ; Parmenter1968a ; Shanenko2006 ; Shanenko2007 ; Garcia-Garcia2008 ; Garcia-Garcia2011 and later confirmed experimentally in Sn and Pb superconducting nano-grains Bose2010 ; Brihuega2011 .
A distinct feature of the interplay of quantum coherence and disorder in the non-interacting limit is the multifractality of eigenstates Castellani1986 ; Wegner1980 ; Falko1995 that occurs around the mobility edge separating metallic and insulating states in three and higher dimensions abraham1979 . Two dimensions (2D) is the critical dimension abraham1979 for localization. Strictly speaking, in an infinity disordered two dimensional system, all states are exponentially localized. However, for weak disorder, the localization length is exponentially large and, for smaller sizes, the system shows multifractal features Wegner1980 ; Falko1995 in a relatively large window of disorder strengths. Moreover, other effects such as spin orbit-interaction may induce a transition strictly in two dimensions ando1989 .
The interplay between weak multifractality and superconductivity in two dimensions was recently studied Mayoh2015 using a simple Bardeen-Cooper-Schrieffer (BCS) formalism that assumed that the order parameter was well described by the multifractal eigenstates of the one-body problem. It was found that the spatial distribution of the order parameter is described by a log-normal distribution. The spatial average of the distribution increases with disorder and it can be substantially larger than the order parameter in the clean limit. The qualitative effect of Coulomb interactions in this critical region, investigated earlier mirlin2013 , predicted a much dramatic enhancement. Recent experiments verdu2018 ; xue2019 in weakly disordered two dimensional NbSe2 and theoretical results based on the numerical solution of the BdG equations Bofan2020 ; Gastiasoro2018 have confirmed both the enhancement of superconductivity with disorder and the log-normal distribution of the order parameter.
In three dimensions (3D), the Anderson transition occurs for strong disorder which makes more difficult a theoretical treatment due to the absence of a small parameter. The interplay between the Anderson transition and superconductivity, was first investigated in Refs.Feigelman2007 ; Feigelman2010 , earlier than the two dimensional analysis mentioned above, by using also a BCS approach. According to their analysis, the order parameter is enhanced dramatically, up to orders of magnitude with respect to the clean limit, and its moments Feigelman2010 are consistent with those of a log-normal distribution. So far, experiments could not reproduce these features.
Here we compare these expectations with the outcome of the full numerical solution of the 3D BdG equations for different disorder strengths with an especial emphasis in the region around the superconductor-insulator transition. While the spatial average of the order parameter increases moderately with disorder, this increasing stops when the system approaches the transition. The spatial distribution of the order parameter becomes increasingly broad even for disorder strength far from the transition. Around the transition, it is close to log-normal as in the 2D case mayoh2015global .
The critical disorder is determined by the analysis of level statistics shapiro1993 ; altshuler1988 in the spectral region that contributes to the buildup of the order parameter. Spectral correlations around the transition are intermediate between those of a metal and insulator and qualitatively similar to those shapiro1993 of a non-interacting disordered metal at the Anderson transition. The disorder strength at which phase coherence is lost, estimated by a percolation analysis, is similar to that at which the superconductor-insulator transition occurs.
The paper is organized as follows. In section II, we introduce the model and determine the range of parameters where our calculation is reliable. In section III, we compute numerically the spatial average of the order parameter , and determine the range of parameters for which enhancement of superconductivity occurs. The dependence of disorder of the local density of states is the subject of section IV. Section V is devoted to the study of the spatial distribution, and the singularity spectrum of the order parameter. In section VI, we compute the overlap of eigenstates which allows us to estimate the effective spectral window around the Fermi energy which contributes significantly to the formation of the order parameter. In section VII, we estimate the critical disorder at which the superconductor-insulator transition occurs by an analysis of level statistics. We also show that level statistics around the transition is intermediate between Poisson statistics and random matrix theory as in a non-interacting disordered system at the Anderson transition. In section VIII, we carry out a percolation analysis in order to estimate the disorder strength at which phase coherence is lost. We find that the percolating transition occurs around the same disorder as the metal-insulator transition. In section IX, we summarize the main findings of the paper and enumerate a few related problems for future research.
II Disordered Bogoliubov-de Gennes equations
The following BdG equations Ghosal2001 ; DeGennes1964 ; DeGennes1966 result from the evaluation of the path integral of a disordered fermionic tight binding model in a cubic lattice with short-range attractive interactions by the saddle-point method that is only exact in the mean-field limit:
| (1) |
where
| (2) |
stands for the nearest neighboring sites, is the hopping strength, is strength of the random potential at site , extracted from an uniform distribution , incorporates the site-dependent Hartree shift. The chemical potential , is determined by the averaged density . is the pairing interaction, and . The same definition applies to . The BdG equations are completed by the self-consistency conditions for the site dependent order parameter and density ,
| (3) |
and
| (4) |
where is the cut-off energy. We solve these equations for a cubic lattice of sites, where is the side length of the sample in units of the lattice constant. In order to minimize finite size effects, we employ the periodic boundary conditions. We employ a standard iterative algorithm. Starting with an initial seed for the order parameter, we solve Eq. (1) numerically, and obtain the eigenvalues and the corresponding eigenvectors . We then use the self-consistent condition, Eqs. (3) and (4), to get the new value of and . We repeat the process until the absolute error of is smaller than or the relative error is smaller than . For convenience, all the parameters are in units of and the density is fixed at throughout the paper.
II.1 Characteristic superconducting length and choice of parameters
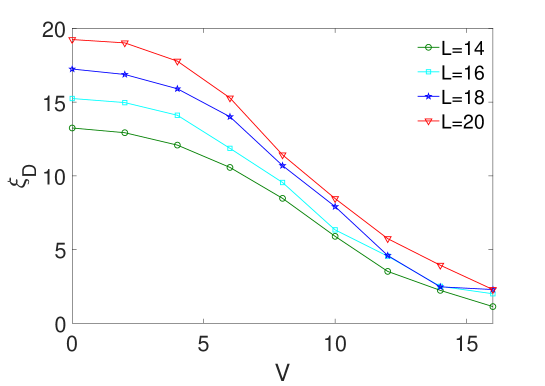
Our first task is to determine the range of parameters where our calculation is reliable. For this to happen, the typical length of the superconducting state must be smaller than the system size. For the former, we choose the typical size of the order of the parameter correlations ,
| (5) |
which is close to the standard superconducting coherence length. As we mentioned earlier, the quantum coherence effects we aim to investigate are stronger if the electron-phonon coupling is weaker. Therefore, we set to the smallest possible value so that is less than the maximum size we can reach numerically in the region of relatively strong disorder, close to the transition, we are mostly interested in. The results shown in Fig. 1 indicate that is the smallest coupling for which we can obtain reliable results. In the weak disorder region , is almost the system size but for stronger disorder , is reduced considerable so finite size effects are not important and our results are reliable in this region. We note that the dimensionless coupling constant increases with , and also with , and our choice of couplings is close to that of realistic weakly coupled metallic superconductors such as Sn.
III Spatial average of and enhancement of superconductivity by disorder
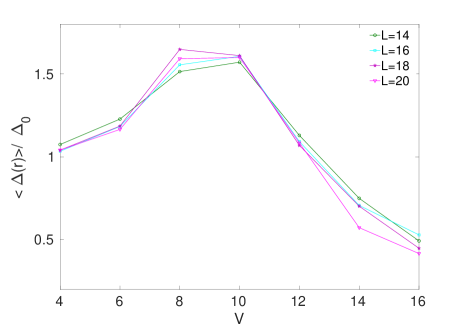
We compute the disorder dependence of the spatial average of the order parameter in order to clarify whether the amplitude of the order parameter is enhanced by disorder. We have found that, see Fig. 2, the averaged order parameter indeed increases with disorder though this increase eventually stops for . For stronger disorder, it decreases monotonically. We shall see that the maximum occurs around the critical region where the transition occurs. For very weak disorder (not shown), where our calculation is less reliable, we observe a decrease of the order parameter with respect to the clean limit which is likely a finite size effect of no much relevance in this context as it will be severely reduced if the system size could be increased.
These results are different from the analytical Mayoh2014a and numerical results Bofan2020 ; Gastiasoro2018 in the two dimensional weak-coupling, weak-disorder limit where the enhancement is substantially larger and no decrease for stronger disorder was observed. Although these features may depend on the coupling strength, the differences are ultimately related to the fact that, in two dimensions, the effective critical region is much broader. These results seem also in disagreement with previous BCS analytical results Feigelman2007 ; Feigelman2010 at the three dimensional transition where the predicted enhancement of the order parameter with disorder is much larger as the order parameter has a power-law dependence with the dimensionless electron-phonon coupling.
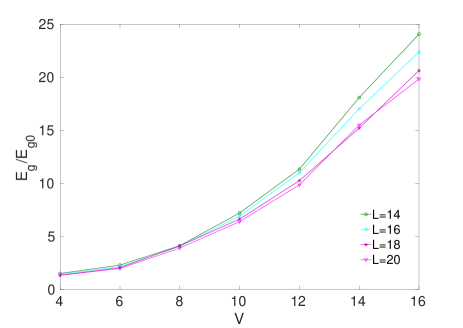
For the sake of completeness, we also compute the energy gap . We observe, see Fig. 2, a monotonic increase with disorder that agrees with the average of the order parameter in the weak disordered limit only. This discrepancy between the two quantities for sufficiently strong disorder is also observed in 2D disordered superconductors ghosal1998 ; Bofan2020 ; Ghosal2001 .
As in the two dimensional case, the increase for strong disorder in the insulating region is a consequence of Anderson localization effects that enlarge the mean level spacing as the typical distance is no longer the system size, but the localization length that decreases as disorder increases. Therefore, the observed monotonous increase with disorder, that does not flatten or reverse tendency around the transition, is not related to superconductivity for sufficiently strong disorder but rather with the physics of Anderson localization. In summary, disorder in three dimensions may enhance superconductivity but it is a relatively small effect that stops around the critical region. On the insulating side, disorder is always detrimental of superconductivity.
IV Density of states
In this section we investigate the impact of disorder in the local density of states (DOS),
| (6) |
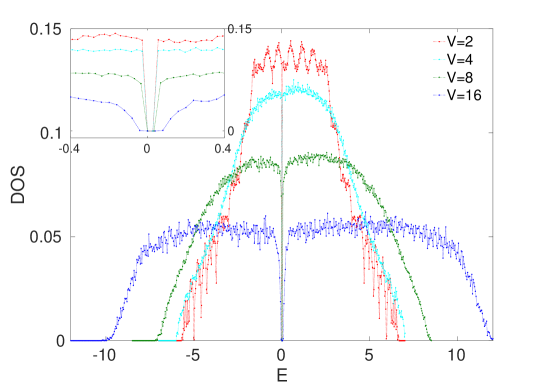
aimed to illustrate similarities and differences with the non-interacting case. There is always a finite gap around , see the inset in Fig. 3, representing the superconducting energy gap. The DOS have two peaks around the gap corresponding to the superconducting coherence peaks, a signature of BCS theory. These peaks are suppressed in the 2D strong disorder limit Ghosal2001 . Other features are qualitatively similar to that of the non-interacting limit Markos2006 . For instance, for weak disorder, we observe that, as in the non-interacting limit, oscillations eventually vanish as disorder increases. Likewise, the DOS is reduced for stronger disorder but the spectral support increases. These similarities suggest that, at least in the weak disorder regime, where coherence effects are not important, the eigenstates of the BdG equations may be qualitatively similar to those in the non-interacting limit which may justify a BCS approach at least for not too strong disorder.
Finally, we note the spectrum of the BdG equations has a parity symmetry in the non-interacting limit Markos2006 , namely, . However, once interactions are switched on, the spectrum of the BdG equations, and therefore the related DOS, does not have this symmetry. As a consequence, the spectrum is effectively shifted. We know that in the non-interacting case, the wave function corresponding to is always the most extended state in comparison with other energies. If the spectrum is shifted, the wave function and around are no longer the most extended states. However, only states around contribute to the order parameter significantly. Therefore, this shift in the DOS may explain why the critical disorder is smaller in the BdG equations with respect to the non-interacting limit.
V Spatial distribution of the order parameter
In this section, we investigate the spatial dependence of the amplitude of the order parameter . Our main motivation is to characterize its spatial distribution as a function of disorder. Of special interest is to clarify the role of the log-normal spatial distribution Mayoh2015 ; Bofan2020 that describes the distribution of of two dimensional, weakly-coupled, weakly-disordered superconductors. The analytical derivation of the log-normal distribution Mayoh2015 in the 2D case is heavily based on the assumption of weak disorder, large conductance, so it is unclear to be valid at the Anderson transition in three dimensions where disorder is strong and the dimensionless conductance is of order one. We also analyze the singularity spectrum Jensen1989 to obtain further information of the spatial distribution of the order parameter around the transition.
V.1 Spatial dependence and probability distribution of the order parameter amplitude
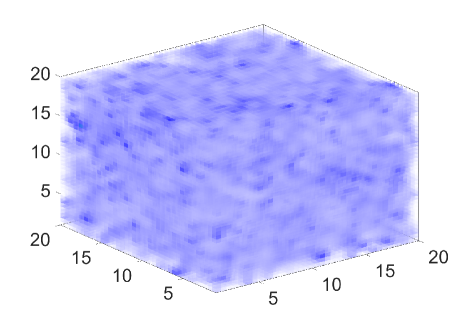
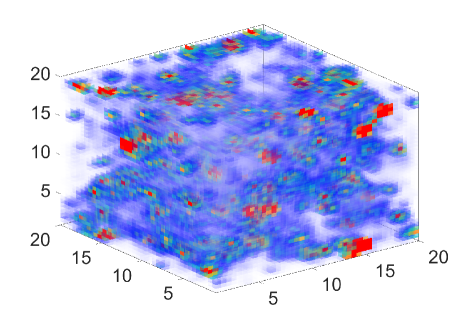
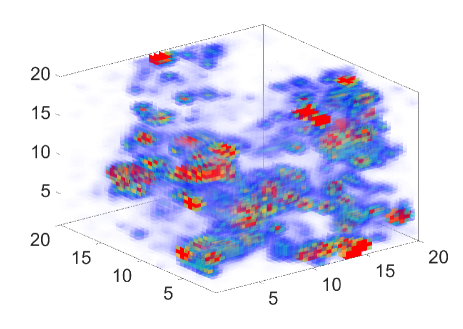
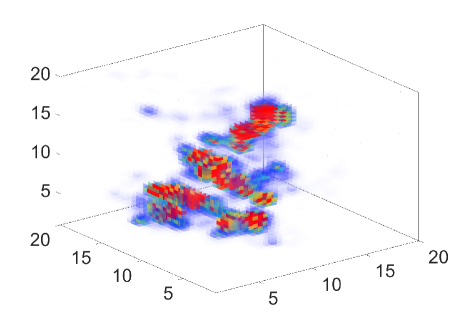
The spatial dependence of the order parameter , resulting from the numerical solution of the BdG equations for a single disorder realization, is depicted in Fig. 4. As was expected, becomes more spatially inhomogeneous as the strength of the random potential increases. For , is already rather localized in small regions of the sample which is an early indication that the transition could be located around that disorder strength. When , the order parameter is concentrated in a small spatial region, which suggests that the transition to the insulating region has already taken place.
The probability distribution of , depicted in Fig. 5, captures accurately the gradual increase of spatial inhomogeneities. In the weak disorder region, the distribution is narrow and symmetric with a peak around the average order parameter. Deviations from a Gaussian distribution are small. As disorder increases, but still far from the transition, the distribution becomes broader and asymmetric. For , the tail of the distribution is well described by an exponential decay and, though asymmetric, the distribution has a clear maximum.
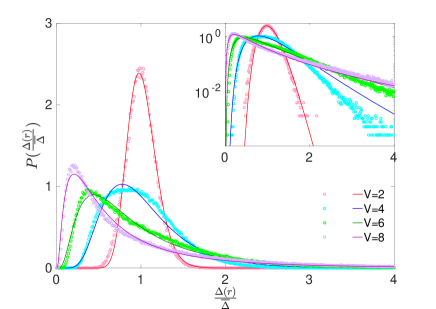
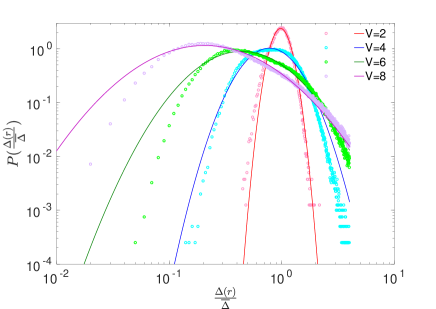
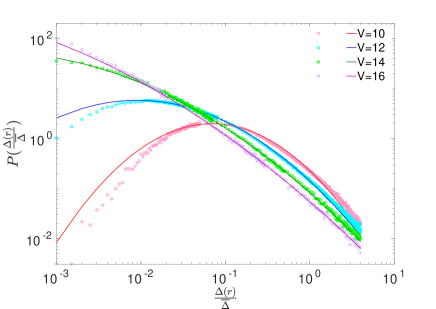
As disorder is further increased , the distribution becomes broader with tails that decay more slowly. We recall that, assuming that eigenfunction correlations in the non-interacting limit are multifractal, it was found Mayoh2015 that the probability distribution for the order parameter of a two dimensional superconductor in the weak-coupling, weak-disorder limit is log-normal,
| (7) |
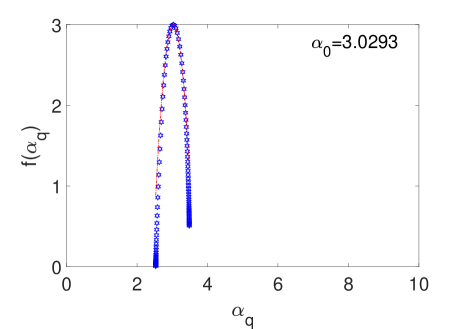
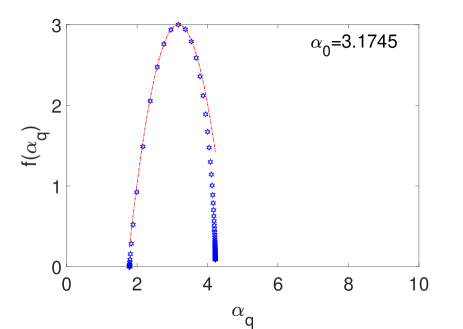
where and are disorder dependent constants. Surprisingly, we find an increasingly good agreement with the log-normal distribution. The singularity spectrum, depicted in Fig. 6, is still parabolic in this range of parameters. This parabolicity is directly related to the spectrum of multifractal dimensions that enters in the analytical derivation Mayoh2015 of the probability distribution in the 2D case. Indeed, in Ref. Feigelman2010 , the analytical calculation of the moments of the order parameter at the 3D Anderson transition were consistent with this result.
As disorder further increases, when , the maximum of the distribution shifts to small values of the order parameter. The tail becomes broader with an even slower decay. Overall, the distribution is still well described by a log-normal distribution.
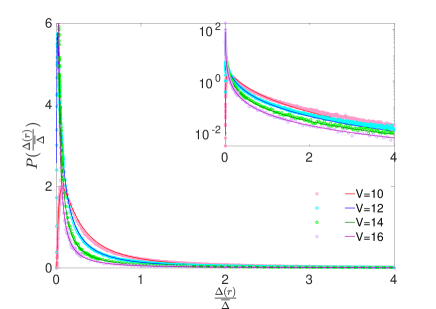
As can be observed in Fig. 5 for , the maximum is not noticeable and the distribution is flat for very small values of the order parameter. This indicates that in a substantial number of points, the order parameter either vanishes or is much smaller than the bulk value for no disorder. We find it plausible that the insulating transition occurs precisely at this disorder strength. For stronger disorder, corresponding to the insulating region, the decay seems to become power-law. This regime will be discussed in more detail in a forthcoming publication us2020 .
V.2 Singularity spectrum of the order parameter amplitude distribution
In order to obtain further information about the spatial distribution of the order parameter, we now compute the singularity spectrum Jensen1989 . More specifically, we aim to clarify to what extent the order parameter amplitude inherits the multifractality Wegner1980 ; Castellani1986 of eigenstates observed in the non-interacting limit, and approximately, for what disorder strength, the superconductor-insulator transition occurs.
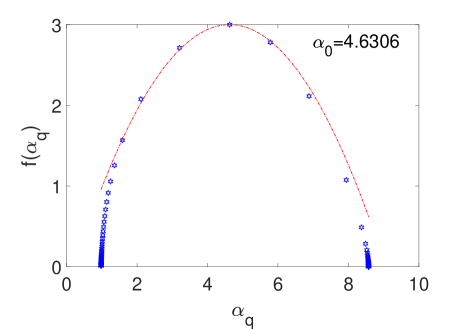
In the non-interacting limit, the singularity spectrum, also called spectrum, is related to the scalings of the density of probability associated to multifractal eigenstates at the Anderson transition. In 2D, eigenstates are approximately multifractal for weak disorder provided that system size is much smaller than the localization length. In this weak multifractal region, the spectrum is parabolic Wegner1980 . A qualitatively similar parabolic singularity spectrum mildenberger2002 ; Evers2000 ; Evers2008 is a feature of the 3D Anderson transition despite the fact that the transition occurs at strong disorder.
From Eq. (3), is given by a self-consistent condition, which is a weighted average over the eigenstates and of the BdG equations. At least for clean nano-grains Shanenko2007 , it was found that and are proportional to the eigenstates of the one-body problem for sufficiently weak coupling. Therefore, it seems plausible, especially if the weighted sum defining does not contain many eigenstates, that some of the anomalous scaling features, reflected in the singularity spectrum of the eigenstates of the one-body problem, may be inherited by the order parameter.
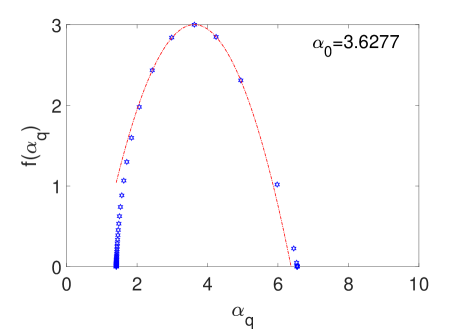
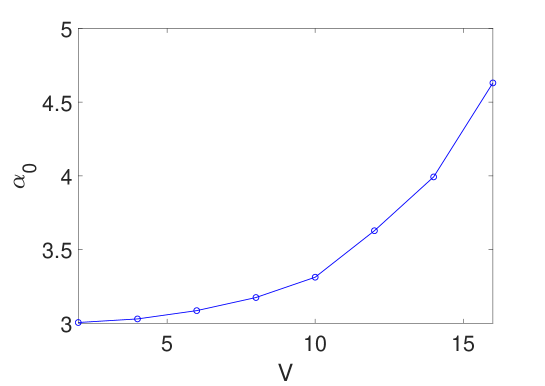
In order to carry out the computation, we define and compute the spectrum of following the method introduced in Ref. Jensen1989 . The results for disorder strengths and are depicted in Fig. 6. We find that the singularity spectrum for intermediate disorder is well approximated by , with . Approximately, this is the analytical prediction Evers2008 ; mildenberger2002 for the three dimensional system at the Anderson transition. Moreover, precisely in this region, the parameter , depicted in Fig. 7, that controls the broadness of the singularity spectrum, experiences a faster increase with disorder. These results point to a spatial distribution of the order parameter characterized by multifractal-like spatial structure. We will confirm this prediction in section VII by a detailed analysis of the level statistics of the system.
We note that for , clear deviations from a parabolic spectrum are observed and the fitted is larger than the prediction for the Anderson transition in three dimensional non-interacting systems. This suggests that the system is already an insulator and that therefore the critical disorder at which the transition occurs is around .
Having shown that at certain disorder strength, the order parameter may have multifractal features. We study in next section how many eigenstates contribute effectively to the formation of the order parameter, especially around this critical region. This is important as the level statistic analysis must be restricted to the spectral window relevant for the formation of the Cooper pairs.
VI What eigenstates and contribute to ?
In order to have a more quantitative understanding about how exactly is built up from the eigenfunctions of the BdG equation, we study,
| (8) |
A strong overlap of and corresponds to , while if and are completely decoupled, then since . We note that, because of the self-consistent condition Eq. (3), only eigenstates and that overlap strongly contribute significantly to . Therefore, the study of will reveal how many eigenstates effectively contribute to the formation of the order parameter. This will be important later for the determination of of the critical disorder at which the transition to localization occurs.
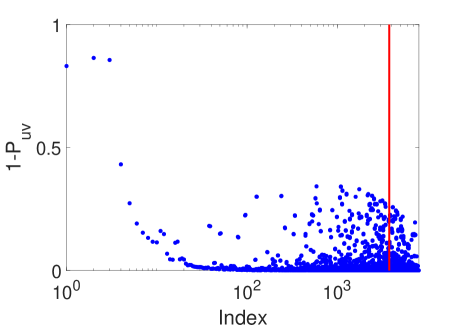
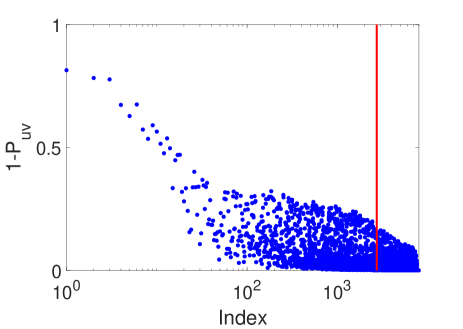
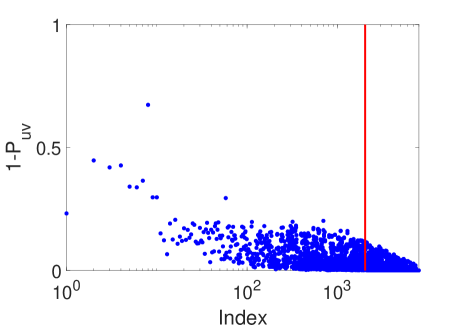
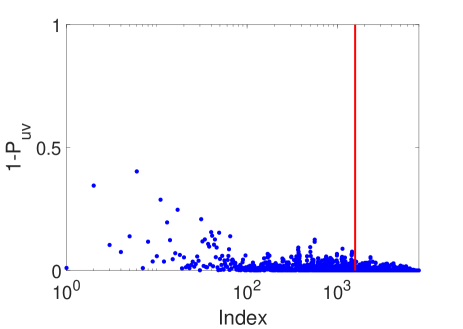
Results, depicted in Fig. 8, show that only for a small number of eigenstates near , which is much less than the total number of states contained in the Debye energy window, the overlap is strong so that is close to . For the rest, which strongly suggests that only a small set of eigenvectors participate in the construction of the order parameter . Interestingly, as disorder increases, the number of strongly coupled eigenstates increases as well. However, for , it seems that the trend is reversed. Fewer eigenstates contribute, and the overlap strength is weaker. Even for eigenstates very close to , is never close to zero.
Taking into account that, through the self-consistent condition Eq. (3), is also directly related to the overlap between and . It is not surprising that the spatial average of increases with up to where the increase stops and finally decreases for stronger disorder. Effectively, as disorder increases, more eigenstates contribute to the formation of the order parameter which, as we said, will likely help its enhancement. More quantitatively, as depicted in Fig. 8, more than states are strongly coupled for . However, such strong correlation is restricted to no more than eigenvectors for , see Fig. 8.
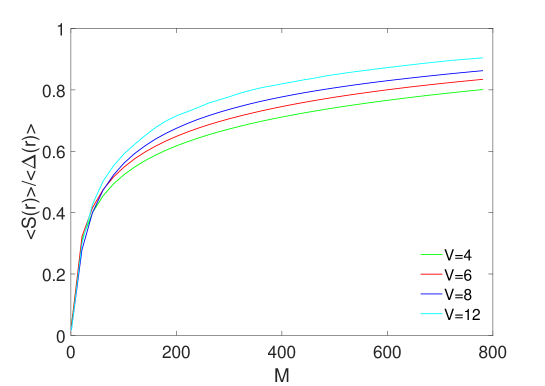
With the chosen Debye energy, about of eigenstates, around states for size , as is depicted in Fig. 8, contribute to the order parameter. However, see Fig. 8, only a very small part of states near contributes significantly to the build up of the order parameter. For a more quantitative estimation, we define which for sufficiently large becomes the order parameter. We only show the first states in Fig. 9, which already represent more than of the total value of .
More interesting is the fact that, only the first states, that represent about of the allowed eigenstates in the Debye window, are responsible for more than of the value of . Indeed, if we only take the first eigenstates into consideration, still reproduces a sizable part of , which is weakly dependent on the considered disorder strength.
These results are consistent with the overlap of eigenfunction shown in Fig. 8. About states closer to are strongly coupled when , while less than states are strongly coupled when . Moreover, the coupling of and for the first eigenstates, is qualitatively similar for the different disorder strength, which results in a similar in this region. Therefore, a relatively small number of strongly coupled eigenstates close are the leading contribution to the order parameter. These results are fully consistent with the observed enhancement of superconductivity for not too strong disorder and also provide support that the eigenstates that most contribute to the order parameter close to the transition are all critical.
VII Determination of the critical disorder for the metal-insulator transition by level statistics
We have already investigated the interplay of disorder and superconductivity for a broad range of disorder strengths. We have accrued substantial evidence that around , the superconducting state undergoes substantial changes. Moreover, the results of the previous section suggest that only a small set of eigenvectors and eigenvalues of the BdG equations contribute substantially to the order parameter. Based on these two findings, in this section, we aim to determine the location of the insulating transition with more precision. For this purpose, we carry out an analysis of level statistics of the eigenvalues of the BdG equations.
We restrict ourselves to the spectral region inside the Debye energy window since our main interest is to characterize the dynamics of the superconducting state. More specifically, we only consider a small set of eigenvalues, from to depending on disorder and size, around which, according to the findings of the previous section, see Fig. 8, correspond to eigenvectors that contribute substantially to the formation of the order parameter. For those eigenvalues, we compute different spectral correlators: the level spacing distribution and the adjacent gap ratio and its distribution that characterize quantum dynamics for long times and therefore are sensitive to the insulating transition. We note that in three dimensions, where critical features only occur close to the transition, the superconductor is at the Anderson transition provided that the eigenstates that effectively contribute to the order parameter are all critical. We shall see that this is the case.
VII.1 The nearest neighbor level spacing distribution
We note that, in the limit of no disorder, the eigenvalues are two-fold degenerate Bofan2020 . By turning on disorder, this degeneracy is lifted but for sufficiently weak disorder there is almost no mixing with neighboring eigenvalues. Therefore, the full spectrum is effectively the superposition of two spectra. Since for weak disorder, we expect metallic features, level statistics are expected to be described by the prediction of random matrix theory (Wigner-Dyson statistics). For sufficiently strong disorder, neighboring eigenvalues get mixed and the spectrum is no longer a superposition of two independent spectra. In this case, we still expect agreement with Wigner-Dyson statistics for a single spectrum provided that this system is not too close to the transition.
Results depicted in Fig. 10 confirm this picture. For weak disorder, , level statistics agree well with the theoretical prediction for the superposition of two spectra with Wigner-Dyson statistics. The level spacing distribution, namely, the probability of having two consecutive eigenvalues at a distance in units of the mean level spacing, is in this case guhr1998 , where is the error function.
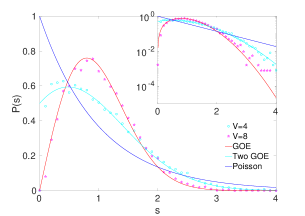
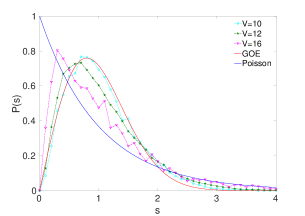
As disorder increases , we observe that level statistics agree well with the prediction of Wigner-Dyson statistics, also termed the prediction for the Gaussian Orthogonal Ensemble (GOE), but for a single spectrum , no a superposition guhr1998 . The reason for that is that a stronger disorder mixes the eigenvalues of the two spectra resulting in a single quantum chaotic spectrum that follows the prediction of random matrix theory expected in disordered metallic systems.
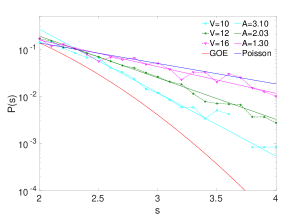
For stronger disorder, see Figs, 10 and 10, there are deviations from Wigner-Dyson statistics in all spectral correlators: level repulsion is still present in but the decay is slower than the prediction of Wigner-Dyson statistics. As disorder increases further, it approaches an exponential decay which is the expectation for a Poisson distribution which characterizes the spectral correlations of disordered insulators. Around , we observe striking similarities with the spectral features predicted at the Anderson metal-insulator transition shapiro1993 ; altshuler1988 . Level repulsion persists but the tail of decays exponentially with . For larger disorder when , the level statistics are close to Poisson statistics which is the expected results for an Anderson insulator. These results suggest a transition around . We will confirm it in next section.
VII.2 The probability distribution of consecutive level spacing and the adjacent gap ratio
The computation of the involves the unfolding of the spectrum so that the average mean level spacing is the unity. This process, which in our case was carried out by a low degree polynomials, adds some uncertainty since the results, at least quantitatively, may weakly depend on the unfolding procedure. In order to avoid this problem, we compute the adjacent gap ratio and the distribution of consecutive level spacing that do not require any unfolding.
The ratio of the consecutive level spacing is defined as atas2013
| (9) |
where is the nearest-neighbor spacing of the ordered eigenenergies . Therefore, the adjacent gap ratio is naturally defined as
| (10) |
The analytical predictions for the ensemble average of these correlators, and its distributions, for the case of random matrices, that should also apply to quantum disordered metals, is known explicitly atas2013 ; Huse2007 . A distinct feature of these spectral correlators is its ultra locality, namely, they provide information about time scales much larger than the Heisenberg time. For instance, they provide information about whether the spectrum has (has no) level repulsion as in a metal (insulator). In some sense, it is a zoom in version of the small limit of . For that reason, we expect that finite size effects, that are more important in this limit, may play some role in suppressing localization effects on the insulating size of the transition.
We start our analysis with the calculation of the ensemble average adjacent gap ratio for different disorder . We also carry out a finite size scaling analysis by studying the dependence of the results with .
In order to avoid effects related to the superposition of two spectra, of no interest now, we only consider relatively strong disorder strengths, .
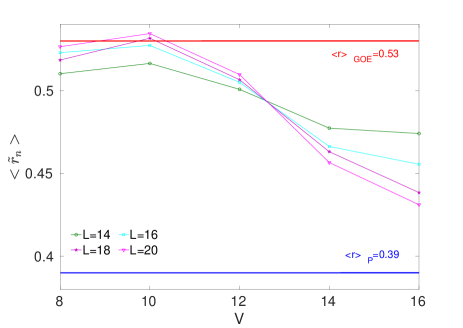
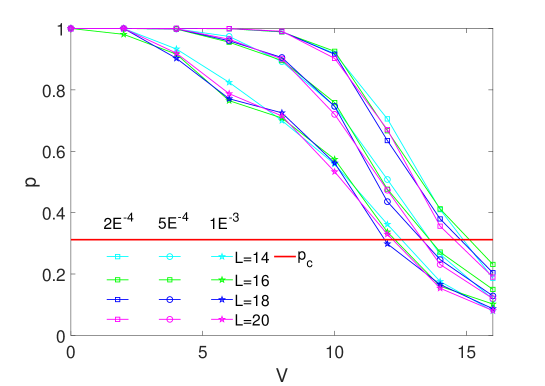
As is shown in Fig. 11, the gap ratio undergoes a crossover from the Wigner-Dyson to the Poisson statistics atas2013 around the critical disorder . More importantly, within the limited range of sizes that we can test numerically, we observe that all curves nicely cross each other at so that at this disorder, level correlations are approximately size independent which is a distinct feature of Anderson transitions altshuler1988 ; shapiro1993 .
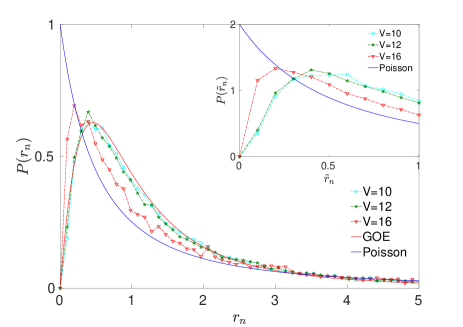
For the sake of completeness, we also compute the probability distribution of the ratio of the consecutive level spacing and the adjacent gap ratio . We have found, see Fig. 11, that even in the critical region , the distribution is very close to the Wigner-Dyson prediction expected in a good disordered metal. Only for much stronger disorder, we observe the transition to Poisson statistics that describes spectral correlations in a disordered insulator. This is not surprising as the adjacent gap ratio is an ultra short-range spectral correlator that is mostly sensitive to level repulsion. The latter is a feature that, because of finite size effects, is still observed in the insulating region not to far from the transition. Indeed, results of the adjacent gap ratio are fully consistent with those of the level spacing distribution.
In summary, the analysis of spectral correlations, especially the finite size scaling analysis of the adjacent gap ratio, indicates the existence of an Anderson transition around . Level statistics around the transition are intermediate between those of a metal and an insulator and qualitatively similar to those of a three dimensional non-interacting systems at the Anderson transition: level repulsion, a distinctive spectral feature of a disordered metal, is observed but the decay of the level spacing distribution is exponential, as for an insulator , though with a larger exponent , . As disorder increases further, the exponent tends to the Poisson statistics result.
VIII Estimation of the critical disorder for the breaking of phase coherence by a percolation analysis
We have shown in the previous section that the transition to an insulator occurs around . A natural question to ask is whether superconducting phase coherence persists until the insulating transition or the loss of global order occurs for weaker disorder. We tentatively address this question by a percolation study of the order parameter. A word of caution is in order, the critical disorder obtained from the percolation analysis is just a rough estimation for the existence, or not, of phase coherence.
We define that, for a given disorder, the superconductor is phase coherent if the order parameter amplitude forms a percolating cluster. Strictly speaking, a point belongs to the percolating cluster if the order parameter does not vanish. However, on physical grounds, we consider a cut-off value so that if the order parameter is smaller than at a given point, this point does not belong to the percolating cluster. With these assumptions, if the probability that a point in the sample does not contribute to the percolating cluster is smaller than the percolation threshold stauffer2003introduction for a 3D cubic lattice, then there is no a percolating cluster and phase coherence is lost. Results are shown in Fig. 12 for different values of the cut-off .
As was expected, the location of the transition depends on the chosen cutoff . However, the dependence is relatively weak and size independent which allows to estimate with reasonable accuracy, the critical disorder at which the percolation transition occurs. Interestingly, it is very close at the critical disorder at which the insulating transition takes place. Although further research would be necessary, such as an explicit calculation of the superfluid density, to settle this issue, our findings suggests that phase coherence may be lost around the same range of disorder at which the insulating transition occurs.
In summary, both the percolation and the insulating transition take place at a similar disorder strength. Although the percolation analysis does not provide a precise determination of the critical disorder for the loss of phase coherence, this fact suggests that phase coherence is likely lost at a similar value of disorder.
IX Discussion and conclusions
The results of the paper, together with previous findings in two dimensions, provide a rather detailed picture of the interplay of disorder and superconductivity, especially in the critical region around the Anderson transition:
First, it is beyond any reasonable doubt that disorder does affect profoundly the superconducting state. The amplitude of the order parameter, even in the metallic region and relatively far from the transition, has a broad spatial distribution. Close to the transition is log-normal, at least in the range of sizes we can test, in both 2D and 3D. The singularity-spectrum, related to the amplitude distribution of the order parameter, is parabolic as that of the density of multifractal eigenstates at the Anderson transition. This emerging picture, seem to disagree with the predictions of the Anderson theorem that disorder does not affect qualitatively the superconducting state. However, we consider it disagrees with the many interpretations of the Anderson theorem in the literature rather than with the original content of Anderson’s statement Anderson1959 .
Second, the answer to the question about whether disorder can enhance superconductivity is responded affirmatively. In both 2D and 3D, this enhancement occurs for a broad range of disorder strengths but only for weak electron-phonon coupling. The averaged order parameter could be enhanced up to two or three times, especially in 2D. However, it is likely that the enhancement of the critical temperature will be much less due to phase fluctuations induced by disorder. Therefore, it is uncertain that disorder can enhance the global critical temperature to the point that it is relevant for practical applications. Likewise, in 3D, the maximum enhancement occurs around the transition, a region where thermal and quantum fluctuations, that lower the critical temperature, will be larger. Therefore, it is unclear to what extent this enhancement of the order parameter is also observed in the critical temperature. This perception could change with the discovery of a weakly coupled superconducting material with a critical temperature above the one for MgB2.
Third, despite of the strong spatial fluctuations, phase coherence holds approximately until the critical disorder at which the insulating transition occurs.
Fourth, all quantum coherence effects, from the strength of spatial fluctuations to the enhancement of superconductivity of the order parameter, become more prominent as either the electron-phonon coupling strength or the Debye energy decreases.
Fifth, natural extensions of this research include the effect of Coulomb interaction and a perpendicular magnetic field. Regarding the former, charging effects could be included by assuming that the inhomogeneities could be seen as a Josephson junction array where the introduction of charging effects is simpler. Regarding the latter, it would be interesting to investigate different aspects of vortexes physics and, in special, the Kosterlitz-Thouless transition in a superconducting state with multifractal-like features. Likewise, the study of finite temperature effects and transport properties around the Anderson transition are others natural extensions of this work. We aim to address some of these problems in the near future.
In conclusion, we have investigated the superconducting state around the Anderson transition that in the non-interacting limit is described by multifractal eigenstates by using the BdG formalism. We have found that the spatial average of the order parameter is enhanced as disorder is increased but only for disorder strength below the transition. The distribution of the order parameter is log-normal around the transition. For lower disorder, it is still broad and asymmetric that illustrate the important role of disorder even relatively far from the transition. As for non-interacting electrons at the Anderson transition, the singular spectrum is parabolic and level statistics are intermediate between Poisson and random matrix theory predictions. All these are typical features of systems where multifractality plays an important role. A qualitative percolation analysis reveals that the loss of phase coherence is likely to occur at around the same disorder as the superconductor-insulator transition.
Acknowledgements.
We acknowledge financial support from a Shanghai talent program and from the National Natural Science Foundation of China (NSFC) (Grant number 11874259)References
- [1] P. W. Anderson. Theory of dirty superconductors. J. Phys. Chem. Solids, 11(14):26–30, 1959.
- [2] L. P. Gor’kov and T. K. Melik-Barkhudarov. Contribution to the theory of super-fluidity in an imperfect Fermi gas. J. Exp. Theor. Phys., 40, 1961.
- [3] B. Abeles, Roger W. Cohen, and G. W. Cullen. Enhancement of Superconductivity in Metal Films. Phys. Rev. Lett., 17(12):632–634, September 1966.
- [4] B. Abeles, Roger Cohen, and W. Stowell. Critical Magnetic Fields of Granular Superconductors. Phys. Rev. Lett., 18(21):902–905, May 1967.
- [5] Amit Ghosal, Mohit Randeria, and Nandini Trivedi. Role of spatial amplitude fluctuations in highly disordered -wave superconductors. Phys. Rev. Lett., 81:3940–3943, Nov 1998.
- [6] Amit Ghosal, Mohit Randeria, and Nandini Trivedi. Inhomogeneous pairing in highly disordered s-wave superconductors. Phys. Rev. B, 65(1):014501, November 2001.
- [7] Y. Liu, D. B. Haviland, B. Nease, and A. M. Goldman. Insulator-to-superconductor transition in ultrathin films. Phys. Rev. B, 47:5931–5946, Mar 1993.
- [8] B. G. Orr, H. M. Jaeger, and A. M. Goldman. Local superconductivity in ultrathin Sn films. Phys. Rev. B, 32(11):7586–7589, 1985.
- [9] H. M. Jaeger, D. B. Haviland, A. M. Goldman, and B. G. Orr. Threshold for superconductivity in ultrathin amorphous gallium films. Phys. Rev. B, 34(7):4920–4923, 1986.
- [10] H. M. Jaeger, D. B. Haviland, B. G. Orr, and A. M. Goldman. Onset of superconductivity in ultrathin granular metal films. Phys. Rev. B, 40(1):182–196, 1989.
- [11] Benjamin Sacépé, Thomas Dubouchet, Claude Chapelier, Marc Sanquer, Maoz Ovadia, Dan Shahar, Mikhail Feigel’man, and Lev Ioffe. Localization of preformed Cooper pairs in disordered superconductors. Nat. Phys., 7(3):239–244, January 2011.
- [12] Nandini Trivedi, Yen Lee Loh, Karim Bouadim, and Mohit Randeria. Emergent granularity and pseudogap near the superconductor-insulator transition. J. Phys. Conf. Ser., 376(1):12001, 2012.
- [13] Mintu Mondal, Anand Kamlapure, Madhavi Chand, Garima Saraswat, Sanjeev Kumar, John Jesudasan, L Benfatto, Vikram Tripathi, and Pratap Raychaudhuri. Phase fluctuations in a strongly disordered s-wave NbN superconductor close to the metal-insulator transition. Phys. Rev. Lett., 106(4):47001, 2011.
- [14] G. Lemarié, A. Kamlapure, D. Bucheli, L. Benfatto, J. Lorenzana, G. Seibold, S. C. Ganguli, P. Raychaudhuri, and C. Castellani. Universal scaling of the order-parameter distribution in strongly disordered superconductors. Phys. Rev. B, 87(18):184509, May 2013.
- [15] Madhavi Chand, Garima Saraswat, Anand Kamlapure, Mintu Mondal, Sanjeev Kumar, John Jesudasan, Vivas Bagwe, Lara Benfatto, Vikram Tripathi, and Pratap Raychaudhuri. Phase diagram of the strongly disordered -wave superconductor nbn close to the metal-insulator transition. Phys. Rev. B, 85:014508, Jan 2012.
- [16] Tong Zhang, Peng Cheng, Wen-Juan Li, Yu-Jie Sun, Guang Wang, Xie-Gang Zhu, Ke He, Lili Wang, Xucun Ma, Xi Chen, et al. Superconductivity in one-atomic-layer metal films grown on si (111). Nature Physics, 6(2):104–108, 2010.
- [17] Takashi Uchihashi. Two-dimensional superconductors with atomic-scale thickness. Superconductor Science and Technology, 30(1):013002, nov 2016.
- [18] John M Blatt and Colin J. Thompson. Shape Resonances in Superconducting Thin Films. Phys. Rev. Lett., 10(8):332–334, April 1963.
- [19] R.H. Parmenter. Size Effect in a Granular Superconductor. Phys. Rev., 166(2):392–396, February 1968.
- [20] A. A. Shanenko, M. D. Croitoru, M Zgirski, F. M. Peeters, and K. Arutyunov. Size-dependent enhancement of superconductivity in Al and Sn nanowires: Shape-resonance effect. Phys. Rev. B, 74(5):052502, August 2006.
- [21] A. A. Shanenko, M. D. Croitoru, and F. M. Peeters. Oscillations of the superconducting temperature induced by quantum well states in thin metallic films: Numerical solution of the Bogoliubov–de Gennes equations. Phys. Rev. B, 75(1):014519, January 2007.
- [22] Antonio García-García, Juan Urbina, Emil Yuzbashyan, Klaus Richter, and Boris Altshuler. Bardeen-Cooper-Schrieffer Theory of Finite-Size Superconducting Metallic Grains. Phys. Rev. Lett., 100(18):187001, May 2008.
- [23] Antonio M. García-García, Juan D Urbina, Emil A. Yuzbashyan, Klaus Richter, and Boris L. Altshuler. BCS superconductivity in metallic nanograins: Finite-size corrections, low-energy excitations, and robustness of shell effects. Phys. Rev. B, 83(1):014510, January 2011.
- [24] Sangita Bose, Antonio M. García-García, Miguel M. Ugeda, Juan D. Urbina, Christian H. Michaelis, Ivan Brihuega, and Klaus Kern. Observation of shell effects in superconducting nanoparticles of Sn. Nat. Mater., 9(7):550–554, July 2010.
- [25] Ivan Brihuega, Pedro Ribeiro, Antonio M. Garcia-Garcia, Miguel M. Ugeda, Christian H. Michaelis, Sangita Bose, Klaus Kern, and Antonio García-García. Experimental observation of thermal fluctuations in single superconducting Pb nanoparticles through tunneling measurements. Phys. Rev. B, 84(10):104525, April 2011.
- [26] C. Castellani and L. Peliti. Multifractal wavefunction at the localisation threshold. J. Phys. A. Math. Gen., 19(8):L429, 1986.
- [27] F. Wegner. Inverse participation ratio in dimensions. Zeitschrift für Phys. B Condens. Matter, 36(3):209–214, September 1980.
- [28] V. I. Fal’ko and K. B. Efetov. Multifractality: Generic property of eigenstates of 2d disordered metals. EPL (Europhysics Letters), 32(8):627, 1995.
- [29] E. Abrahams, P. W. Anderson, D. C. Licciardello, and T. V. Ramakrishnan. Scaling theory of localization: Absence of quantum diffusion in two dimensions. Phys. Rev. Lett., 42:673–676, Mar 1979.
- [30] T. Ando. Numerical study of symmetry effects on localization in two dimensions. Phys. Rev. B, 40:5325–5339, Sep 1989.
- [31] James Mayoh and Antonio M. García-García. Global critical temperature in disordered superconductors with weak multifractality. Phys. Rev. B, 92:174526, Nov 2015.
- [32] I. S. Burmistrov, I. V. Gornyi, and A. D. Mirlin. Multifractality at anderson transitions with coulomb interaction. Phys. Rev. Lett., 111:066601, Aug 2013.
- [33] Carmen Rubio-Verdú, Antonio M. García-García, Hyejin Ryu, Deung-Jang Choi, Javier Zaldívar, Shujie Tang, Bo Fan, Zhi-Xun Shen, Sung-Kwan Mo, José Ignacio Pascual, and Miguel M. Ugeda. Visualization of multifractal superconductivity in a two-dimensional transition metal dichalcogenide in the weak-disorder regime. arXiv:1810.08222, 2018.
- [34] Kun Zhao, Haicheng Lin, Xiao Xiao, Wantong Huang, Wei Yao, Mingzhe Yan, Ying Xing, Qinghua Zhang, Zi-Xiang Li, Shintaro Hoshino, et al. Disorder induced multifractal superconductivity in monolayer niobium dichalcogenides. arXiv preprint arXiv:1904.07076 Nat. Phys. 15, 904, 2019.
- [35] Bo Fan and Antonio M. García-García. Enhanced phase-coherent multifractal two-dimensional superconductivity. Phys. Rev. B, 101:104509, Mar 2020.
- [36] Maria N. Gastiasoro and Brian M. Andersen. Enhancing superconductivity by disorder. Phys. Rev. B, 98:184510, Nov 2018.
- [37] M. V. Feigel’man, L. B. Ioffe, V. E. Kravtsov, and E. A. Yuzbashyan. Eigenfunction fractality and pseudogap state near the superconductor-insulator transition. Phys. Rev. Lett., 98:027001, Jan 2007.
- [38] M.V. V Feigel’man, L.B. B Ioffe, V.E. E Kravtsov, and E. Cuevas. Fractal superconductivity near localization threshold. Ann. Phys. (N. Y)., 325(7):1390–1478, July 2010.
- [39] James Mayoh and Antonio M García-García. Global critical temperature in disordered superconductors with weak multifractality. Physical Review B, 92(17):174526, 2015.
- [40] B. I. Shklovskii, B. Shapiro, B. R. Sears, P. Lambrianides, and H. B. Shore. Statistics of spectra of disordered systems near the metal-insulator transition. Phys. Rev. B, 47:11487–11490, May 1993.
- [41] BL Altshuler, I Kh Zharekeshev, SA Kotochigova, and BI Shklovskii. Repulsion between energy levels and the metal-insulator transition. Zh. Eksp. Teor. Fiz, 94:343, 1988.
- [42] P.G. de Gennes. Boundary Effects in Superconductors. Rev. Mod. Phys., 36(1):225–237, January 1964.
- [43] P.G. de Gennes. Superconductivity of Metals and Alloys. W.A. Bebjamin, inc., New York, 1966.
- [44] J. Mayoh and A. M. García-García. Strong enhancement of bulk superconductivity by engineered nanogranularity. Phys. Rev. B, 90(13):134513, October 2014.
- [45] Peter Markos. Numerical analysis of the anderson localization. arXiv preprint cond-mat/0609580, 2006.
- [46] Ashvin Chhabra and Roderick V. Jensen. Direct determination of the f() singularity spectrum. Phys. Rev. Lett., 62:1327–1330, Mar 1989.
- [47] Garcia-Garcia Antonio M. Fan, Bo. In preparation.
- [48] A. Mildenberger, F. Evers, and A. D. Mirlin. Dimensionality dependence of the wave-function statistics at the anderson transition. Phys. Rev. B, 66:033109, Jul 2002.
- [49] F. Evers and A. Mirlin. Fluctuations of the Inverse Participation Ratio at the Anderson Transition. Phys. Rev. Lett., 84(16):3690–3693, April 2000.
- [50] Ferdinand Evers and Alexander Mirlin. Anderson transitions. Rev. Mod. Phys., 80(4):1355–1417, October 2008.
- [51] Thomas Guhr, Axel Müller–Groeling, and Hans A. Weidenmüller. Random-matrix theories in quantum physics: common concepts. Physics Reports, 299(4-6):189–425, Jun 1998.
- [52] Imre Varga and Daniel Braun. Critical statistics in a power-law random-banded matrix ensemble. Physical Review B, 61(18):R11859–R11862, May 2000.
- [53] Jiao Wang and Antonio M. García-García. Anderson transition in a three-dimensional kicked rotor. Phys. Rev. E, 79:036206, Mar 2009.
- [54] Y. Y. Atas, E. Bogomolny, O. Giraud, and G. Roux. Distribution of the ratio of consecutive level spacings in random matrix ensembles. Phys. Rev. Lett., 110:084101, Feb 2013.
- [55] Vadim Oganesyan and David A. Huse. Localization of interacting fermions at high temperature. Phys. Rev. B, 75:155111, Apr 2007.
- [56] D Stauffer and A Aharony. Introduction to percolation theory (2003). London: Taylor~ Francis, 2003.