Specific adsorption of phosphate species on Ag (111) and Ag (100) electrodes and their effect at low overpotentials of the hydrogen evolution reaction
Abstract
Investigation of phosphate species adsorption/desorption processes was performed on Ag(100) and Ag(111) electrodes in H3PO4, KH2PO4 and K3PO4 solutions by Current-Potential () profiles and Electrochemical Impedance Spectroscopy (). We used the equivalent circuit method to fit the impedance spectra. Different electrical equivalent circuit () were employed depending on the potential region that was analyzed. For potentials more negative than the onset of the hydrogen evolution reaction (), a charge transfer resistance (Rct) in parallel to the branches was included. Peaks from profiles were integrated to estimate surface coverage. A reversible process was observed for Ag(hkl)/KH2PO4 systems, where a value of 0.07 ML was obtained. For Ag(111)/H3PO4, a coverage of about 0.024 ML was calculated from anodic/cathodic profiles, whereas for Ag(hkl)/K3PO4 systems different values were obtained from integration of anodic/cathodic peaks due to highly irreversible processes were observed. In the case of Ag(hkl)/K3PO4, the capacitance (C) plots are well differentiated for the two faces, and co-adsorption of OH- was evaluated from resistance parameters. Characteristic face-specific relaxation times are obtained for each electrode. In addition, it was found that the onset potential of for Ag(111) at pH=1.60 was about 100 mV more negative compare to Ag(100).
keyword: phosphates, adsorption, onset potential of , relaxation time, single crystals, silver.
1 Introduction
The development of efficient devices for energy conversion strongly depends on the knowledge of the reactivity in the electrode/electrolyte interfaces for reactions such as the hydrogen evolution reaction (), and hydrogen oxidation reaction () [1, 2]. New studies focusing on the role of buffer species in the performance of different materials have shown how the nature of the anion impacts the kinetics [3]. This demonstrates the important effect of phosphate species and other oxoanions [4] on the reaction mechanisms when they are specificaly adsorbed at the interface.
We have recently studied the strength of interaction of phosphate species on Ag(hkl) surfaces by Cyclic Voltammetry, Current Transients and vdW-DFT calculations [5]. In those studies, it has been demonstrated that the adsorption of phosphate species on silver electrodes is highly sensitive to the surface structure, and it was found that the stability of the adlayer strongly increased with hydrogen loss in the phosphate molecules, being more significant for Ag(100) than for Ag(111) surface [5]. Kolovos-Vellianitis et al. have studied the abstraction of D on silver single crystal surfaces by gaseous H atoms in ultra-high-vacuum conditions by thermal desorption spectroscopy [6]. Temperatures of 150 K and 160 K were reported for HD abstraction of Ag(100) and Ag(111), respectively. However, Kuo et al. have used DFT calculations in vacuum and have reported Ag-H binding energies of -0.35 eV and -0.12 eV on Ag(100) and Ag(111), respectively [7]. Although our systems are at electrochemical conditions, if Ag-H is still the main interaction, we could expect during negative overpotential scan that protons adsorption and hydrogen evolution could appear first on Ag(100) and then on Ag(111).
It has been demonstrated that the conformational geometry of the adsorbed phosphate species on Ag(hkl) surfaces is potential-dependent, where at -1.2 V vs. SCE [5, 8] a monodentate coordination between an oxygen atom from the phosphate molecule and a silver atom on the electrode surface is stablished. This coordination changes from mono to bi, and even to tri-dentate, when changing the electrode potential. Therefore, they follow the mentioned trend (mono, bi and tri) as the applied potential turns towards more positive values. Also, the ordered submonolayers of phosphate species have the symmetry of the substrate, C3v for Ag(111) and C4v for Ag(100), respectively [5].
Sundararaman et al. [9] have calculated by first-principles methods the variation of C() as a fuction of potential, reproducing the experimental curves observed for Ag(100) electrodes in KPF6 electrolyte [10]. Other theoretical approaches are also being currently applied for the microscopic explanation of the differential capacitance of the double layer [11].
In the present work, we study the (100) and (111) crystallographic orientations of silver in phosphate electrolytes by electrochemical techniques. The adsorption of phosphate species together with co-adsorption of other species was studied by profiles, and results were compared to those from .
From the impedance spectra, the kinetic parameters of the adsorption have been evaluated and correlated with the adsorption specificity on the two low-index planes of silver. Characteristic curves of capacitance (C()) as a function of potential () were obtained. The calculated relaxation times were associated with changes at the electrode surfaces induced by the presence of phosphate species. We also report the first results of the onset potential of of silver electrodes in phosphate-containing electrolytes.
2 Experimental measurements
2.1 Materials
A three-electrode system was used for the electrochemical measurements. The working electrodes were Ag(hkl) single crystals provided by Mateck (orientation accuracy ). High purity polycrystalline annealed Pt wire (99.999%) was used as a counter electrode. The reference electrode was a saturated calomel electrode (SCE).
Pretreatment of the crystals was performed as described in Ref. [12]. Here we outline the new steps that were not reported previously.
After a chemical polishing, [12] the electrodes were treated in high-purity nitrogen gas at 600C during 5 min, followed by 400C during 15 min and cooling down to room temperature in a continuous gas flow, and then by the electrode transfer to the electrochemical cell with a drop of ultrapure water. The contact between the electrode surface and the solution was performed by the hanging meniscus method under potential control.
As a first step, the results obtained in 0.01 M KClO4 by and were used to test the cleanliness of the surfaces. The measurements to determine the potential of zero charge () of the electrode surfaces were carried out in 0.01 M KClO4. This concentration is within the range where a Parsons and Zobel plot is linear [13]. Thus, this is an indication that specific adsorption from electrolyte does not occur.
Chemicals were from Aldrich (analytical grade, purity 99.9%). The KClO4 and KH2PO4 salts were recrystallized twice. The solutions were comprised of 0.01 M of the following electrolytes: KClO4, H3PO4, KH2PO4 and K3PO4.
Oxygen-free solutions were obtained by continuously purging the electrochemical cell with nitrogen gas (99.999% purity). Millipore System was used for the preparation of all solutions and also for glassware cleaning.
The reproducibility of the results was determined by repeating the measurements from a fresh initial electrode surface. By this method, voltammetric scans were recorded for freshly annealed surfaces, applying no more than 2.5 cycles, thus avoiding repetitive cycling that increases surface roughness. It should be noted that in this procedure, the electrode undergoes a greater number of heating cycles.
2.2 Current-potential () profiles
The electrochemical analyzer was an AUTOLAB-PGSTAT302N. The profiles were recorded at a scan rate of 0.05 Vs-1.
Measurements to determine the effect of phosphate species in the onset potential of were started at -0.20 V towards negative potential limits. In addition, voltammograms starting at a negative potential up to different positive limits were also recorded. The baseline correction of the peaks was carried out using a polynomial function. The charge values were then obtained by integration as implemented in fityk free software (see Supporting Information ()).
2.3 Electrochemical Impedance Spectroscopy (EIS)
Measurements of electrochemical impedance spectra of silver electrodes in the frequency range 5 kHz - 0.1 Hz have been performed with a FRA32 M module from Autolab, and driven by Nova 2.1 software (Metrohm). Causality was determined using a Kramers-Kronig test included in the software, and linearity was checked by measuring spectra at amplitudes 5-15 mV (rms).
To check the procedure, a dummy cell containing a combination of resistive and capacitive elements (connected in series and in parallel) forming different circuits was used to run the impedance spectra in the whole frequency range. The impedance values obtained from this run were fitted using the analysis procedure from Nova, with errors less than 1% for each electrical element.
The experimental admittance and dielectric complex permittivity spectra were as follows: = (where i=) were used to plot the data, and the equivalent circuit method was employed to fit a physical model representing the electrode/electrolyte interface [14, 15, 16]. However, parameters of the electric equivalent circuits () were fitted to actually measured impedance, rather than to ().
Characteristic relaxation times were obtained from the s by multiplying the R and C elements connected in series between them, i.e., (R1C1) and (R2C2) branches. The best fittings were used as an approach to measure the dynamical structure of the inteface. Capacitance values are normalized in relation to the geometrical area of the electrode.
As the equivalent circuit method has the disadvantage that more than one equivalent circuit can be fitted to the same experimental data (resulting in different values for the parameters), providing an ambiguous physical model, we have focused our attention on the experimental setup. Therefore, Ag(hkl)/electrolyte interfaces were obtained under highly controled conditions (see section 2.1), where the silver oxide formation was avoided and highly purified salts and solvent were used to prepare the electrolyte. Thus, this experimental procedure allows for reducing the number of parameters that must be introduced, in series or parallel connections, in the equivalent circuit analog. As a consequence, the physical model asociated to the electrochemical interface is also simplified [17].
3 Results
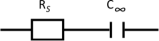
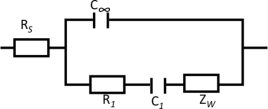
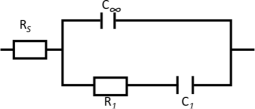
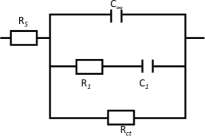
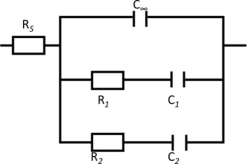
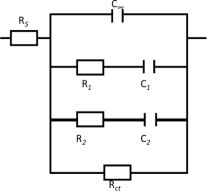
Fig. 1 shows the used to represent the different interfaces.
(a)
 (b)
(b)
 (c)
(c)
 (d)
(d)
 (e)
(e)
 (f)
(f)
The simple model represented by the of Fig. 1 (a) was run to obtain the parameters to be used as a first guide for further improvements on the fitting procedure. The of Fig. 1 (b), which considers diffusion of adsorbing ions from/to the interface, was also tested.
The of Fig. 1 (c) is formed by a series combination of one (R1C1) branch associated with surface processes. A charge transfer resistance (Rct) is added in the s of Fig. 1 (d) and (f) to fit the experimental data in the potential region where the takes place.
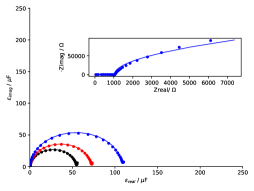
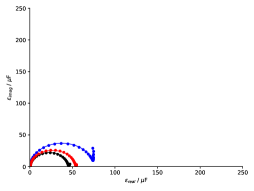
Fig. 2a shows complex permittivity plots of Ag(hkl) electrodes in 0.01 M H3PO4. The spectra of Ag(111) (left) are shown for -0.20 V (black), -0.40 V (red), and -0.55 V (blue); and the spectra of Ag(100) (right) corresponding to -0.20 V (black), -0.40 V (red), and -0.60 V (blue).
(a)
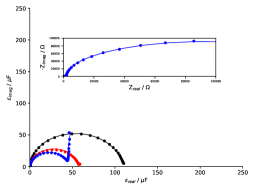
(b)
(c)
For both electrodes a semicircle is observed at high frequencies, and at potentials more negative than -0.55 V the response deviates from a purely capacitive behaviour, being more evidenced for (100) surface. The of Fig. 1 (b) gave inaccurate fitting of the data in the whole potential range, corroborating previous results (see ) that diffusional processes were not the rate determining step [5]. In the case of Ag(100) surface, the spectrum of -0.6 V deviates clearly from a pure capacitance at low frequencies, demonstrating the coexistence of two simultaneous processes. Therefore, from -0.60 V to -0.20 V as the charge transfer is not taking place, the s in Fig. 1 (c) or (e) were employed. A clear trend is observed for both surfaces, indicating that the potential of zero charge () is shifted and may be located in the potential region where the occurs [10, 18].
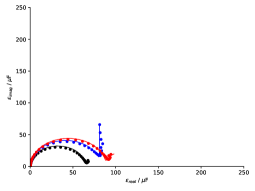
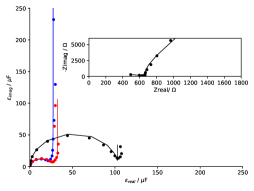
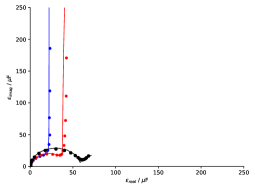
In the case of Ag(hkl) in 0.01 M KH2PO4 (Fig. 2b), from -0.60 V to -0.85 V a different behavior can be clearly seen for the two electrodes. However, all spectra were well fitted by the of Fig. 1 (c), as shown in the following section. Fig. 2c shows complex permittivity plots of Ag(hkl) electrodes in 0.01 M K3PO4. In the potential range between -1.0 V and -1.40 V the desorption of phosphate species takes place, and differentiated responses of the (111) and (100) electrode surfaces are obtained (see the and the next section). At -1.25 V, the fit corresponds to in Fig. 1 (e) for (100) surface. (d) is shown for Ag(100) at -1.30 V (blue). The fit using the model of in Fig. 1 (e) and (f) are shown for Ag(111) at -0.80 V (black), and -1.20 V (red), respectively. This fact demonstrates that the technique is sensitive to the surface structure of the interface.
The dielectric complex permittivity representation of the data clearly demonstrates that for potentials more negative than the onset the co-occurrence of processes associated to phosphate species takes place, as the semicircle can be seen at all potentials. However, for selected potentials, the difference in the values of the associated time constants of these two processes is more evident from the impedance spectra (insets of Fig. 2 left).
Comparisons and details of results using the s of Fig. 1 are provided in Sections 3.2 and 3.5.
3.1 Cyclic voltammetry and R() plots
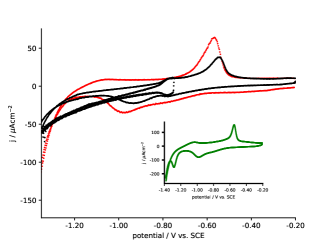
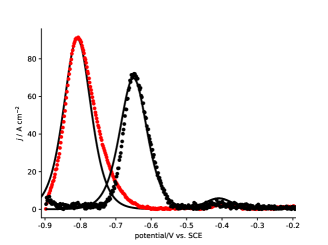
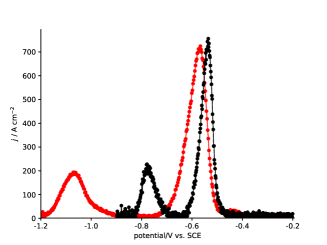
Fig. 3 Upper panel shows votammogram profiles of Ag(hkl) in 0.01 M H3PO4(aq), starting the scanning at -0.20 V. It shows that the hydrogen evolution overpotential is about 100 mV more negative on Ag(111) as compared to Ag(100), where a quasi-reversible process between -0.70 V and -0.55 V can be resolved.
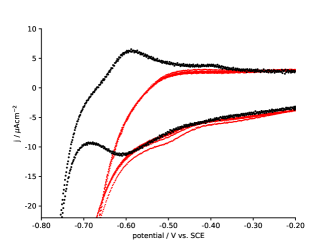
The study of the onset potential of as a function of pH on Ag(hkl) was first reported by Diesing et al. by means of surface resistance measurements [19]. They have found that the two faces have the same onset potential of in 0.1 M HClO4, but differ in neutral solution. They have concluded that in 0.1 M KClO4 is based on water dissociation. As the only difference with our experimental conditions is the electrolyte used, it is expected that the differences observed in the onset potential of with respect to our results are directly associated with the presence of the adlayer of phosphate species.
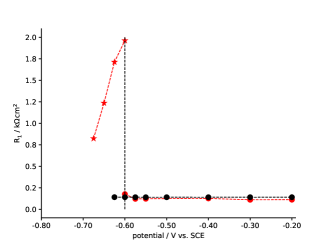
Fig. 3 Lower panel shows the R1 as a function of potential. From -0.55 V towards positive potentials the R1 values were calculated from the data fitting using the in Fig. 1 (c) for both surfaces. The R1 remains almost constant with low values. In the case of Ag(100) surface, the vertical dashed line in the figure separates two characteristic potential regions, indicating that the in Fig. 1 (d) was used in the low overpotential for , where it has physical significance. When comparisons were made with the other s, this was fitted to the data with the lowest values of and relative percentage errors (see Table S6). The Rct is larger than the values found for R1, which is a reasonable result due to both low electrolyte concentration and low overpotentials.
On silver electrodes, takes place through a two-step mechanism, involving Volmer and Heyrovsky as elementary steps. In acid solutions at high overpotentials, the reaction proceeds via Volmer-Heyrovsky mechanism, and the first step is the hydrogen atom adsorption [4]. Thus, as observed from the voltammograms, the hydrogen atom should be adsorbed on the surface at least from -0.6 V for the (100) and -0.7 V for the (111). This is an important finding that follows the same trend as the results reported by Kolovos-Velianitis, [6] and opposite to the results found by Kuo et al., where DFT calculations and experiments with nanoparticles using 0.5 M H2SO4 and 1 M ethanol as electrolyte have shown that the (111) facet has higher activity for than (100) facet [7].
Fig. 4 Upper panel shows the cyclic voltammograms of Ag(hkl) electrodes in 0.01 M KH2PO4, starting the scanning at -0.20 V. For both systems the behavior observed in the hydrogen evolution region shows a significant hysteresis when scanning the potential between negative and positive directions, and the onset of starts at around -0.90 V for both electrodes. For the Ag(111) surface there is a potential region where the current is constant before . It should be note that at this pH (4.79) the current density increasement is not as sharp as at 1.60.
Fig. 4 Lower panel shows the R1 values obtained using the in Fig. 1 (c) (black and red circles) from -0.80 V to -0.60 V for both electrodes, and the (e) between -0.55 V and -0.20 V for Ag(100) (R1 and R2, red stars). The R1 values obtained using (e) follow the same trend as for (c), and compared with R2 values, these are almost two orders of magnitude larger. The fact that (c) gave the best fitting results (see ) in the potential region where the current peaks in the profiles are observed, indicates that the response can be associated with only one predominant process, which is highly reversible (Fig. 4 upper panel). Further discussion is provided in sections 3.3 and 3.5.
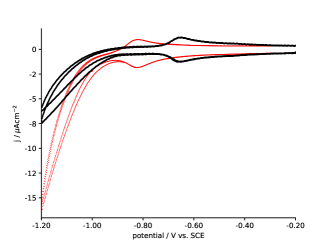
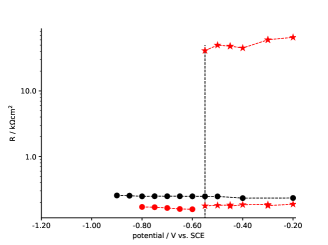
Fig. 5 Upper panel shows the cyclic voltammograms of Ag(hkl) electrodes in 0.01 M K3PO4, starting the scanning at -0.20 V. The peaks observed for phosphate species at potentials more positive than -1.25 V indicate that different adsorbates are present on Ag(hkl) with different bond energies. In the potential region where takes place, hysteresis is not observed in either of the two orientations. At pH=12, the onset potential of occurs about -1.25 V for (100) surface, where the current increase is sharp and well defined, contrasting with (111) face. The inset shows where the adsorption (-1.20 V) and desorption (-1.25 V) peaks are well defined for the Ag(111) in 0.1 M K3PO4. Under these conditions the phosphate species desorption process can be clearly detected.
The resistance parameters obtained using s (c), (d), (e) and (f) are shown in Fig. 5 Lower panel as a function of potential.
The plot on the left shows the values of R1 and Rct for both electrodes. The vertical dashed line shows that from -1.40 V to -1.20 V, the Rct was obtained by (f) (stars), and from -1.20 V to -0.20 V, R1 was obtained by (e) (circles). Therefore, from these results in the two potential regions, the physical model represented by the (e) can be associated with the coexistence of two processes for potentials positive to -1.20 V. On the other hand, at potentials less positive than -1.20 V, the s (d) and (f) were used that consider the co-occurrence of the charge transfer. The shown in Fig. 1 (d) is a simplification of that in Fig. 1 (f) when the participation of one of the two adsorption processes is negligible. However, in this case the best fitting of the results was obtained using the shown in Fig. 1 (f) (see Tables S8 and S9). Morin et al. [20] have studied the kinetics of of H on Pt(hkl) in 0.5 M H2SO4 by , and the same as in Fig. 1 (e) was associated with a kinetic model that considers the presence of anion co-adsoption.
In order to compare how resistances are modified in the presence and absence of phosphate species, the results obtained for the Ag(111) in 0.01 M KOH (blue circles) are also shown (right side plot). It is observed that lower values of R2 are obtained in presence of phosphate species in the whole potential range, i.e., the rate of OH- adsorption processes increases.
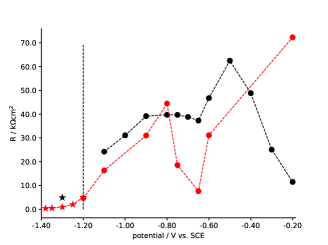
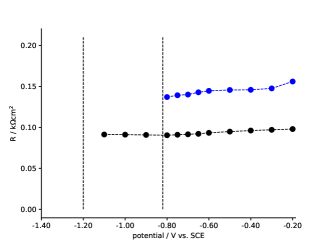
A voltammogram of Ag(111) electrode starting at -1.40 V up to -0.75 V is also included to identify the OH(ads) transition to the ordered layer (vertical dashed line at -0.82 V), which for this face is well differentiated from phosphate species processes [5, 21]. Therefore, the two species that can be resolved by and results were associated with PO4(ads) and OH(ads), corresponding to Eq. (3) as discussed in section 4.
3.2 C() plots for Ag(hkl)/H2PO4(ads)
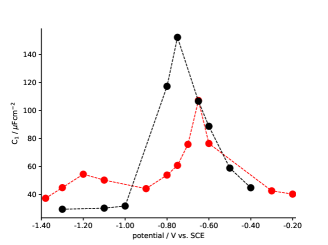
Fig. 6 shows C1() vs. potential curves of Ag(111) (black) and Ag(100) (red) electrodes in 0.01 M KH2PO4. For comparison the inset shows the differential capacitance curves obtained in 0.01 M KClO4 where the is -0.850 V and -0.735 V for (100) and (111) silver surfaces, respectively.
C1() were obtained from in Fig. 1 (c). In the case of (100) surface, from -0.50 V to -0.3 V the and %errors were high (see Table S5). However, very similar values were obtained using (e).
The highest values of C1() are found at -0.60 V and -0.77 V for Ag(111) and Ag(100), respectively. However, it is observed that the shape of C1() curves in 0.01 M KH2PO4 is not face-specific [22]. The only difference observed is the x-axis shift, as expected according to the adsorbate-surface bond energy. Table 1 shows the capacity values that correspond to the peak in the range of electrode potentials giving positive charge density. It can be seen that 135 Fcm-2 was obtained for Ag(111)/phosphate species, whereas less than 130 Fcm-2 was obtained for Ag(100). Other adsorbates are also shown for comparison [23]. For example, Beltramo et al. [24] have reported near 90 Fcm-2 and 150 Fcm-2 in 0.1 mM for Ag(111)/chloride species and for Ag(111)/bromide species, respectively, whereas at 10 mM, 120 Fcm-2 and 180 Fcm-2 values were found, respectively (see Table 1). Therefore this denotes a strong dependence on the nature and concentration of the adsorbate, which determines the redistribution of the charge density at the interface [25, 26], consequently affecting the co-adsorption of other species.
| Adsorbate | Ag(111) | Ag(100) | Ref. |
|---|---|---|---|
| H2PO | 135 | 127 | this work |
| HPO, PO | 160 | 110 | this work |
| OH- | 8 | – | this work |
| CH3COO- | 8 | – | (39) |
| SO | 15 | – | (39) |
| F- | 5, 80-90 (30 - 40 mM) | – | (48, 34) |
| Cl- (0.1 mM) | 36 | – | (24) |
| Br- (0.1 mM) | 60 | – | (24) |
The characteristic shape observed for the plots of C1() as a function of potential has been consistently studied by several authors [10, 27, 22, 28, 29, 30]. They have discussed the shape and potential shift of these curves and have found for gold electrodes in halide solutions that the shifts towards more negative potential values as the anion size becomes bigger, together with higher values of the capacitance of the adsorption peaks and decrease of their widths.
3.3 C() plots for Ag(hkl)/PO4(ads)
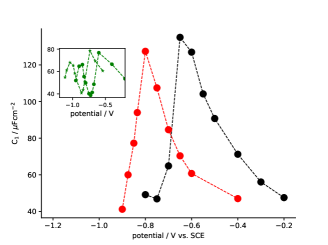
Fig. 7 Upper panel shows C1() vs. potential curves of Ag(111) (black) and Ag(100) (red) electrodes in 0.01 M K3PO4, which are markedly different for the two electrodes in the whole potential range. C1() values were obtained using the s in Fig. 1 (c) and (e). In this case the HPO/PO 10 and the pH = 12.
A wide minimum between -1.0 and -0.8 V is observed for Ag(100) surface.
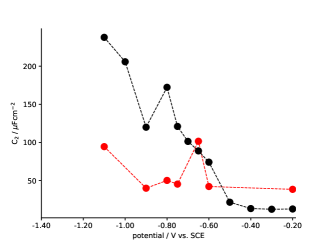
The peak shape of the C1() vs. potential curves for (100) face is narrower than for the (111) face, following a similar trend observed for sulfate ions on Ag(hkl) [31, 30]. At potentials more negative than -1.25 V, the fitting of the in Fig. 1 (c) for the analysis of spectra gave relative errors between 13% and 20% and the 1. However, C1() values were almost equal to those obtained with the in Fig. 1 (e), which gave better fitting results. The C2() values (Fig. 7 Lower panel) at potentials more negative than -1.20 V gave high relative errors (see Table S8), thus they are not shown on the graph. Note that C1() values change with potential in the same way as the current density in the profiles for both surfaces. Therefore, when the of Fig. 1 (e) is applied, separation of two processes is possible. The peaks of C1() for the (100) face (approximately at -1.20 V and -0.65 V) correspond to minimum values of the R1 observed in Fig. 5 Lower panel left, such as predicted in Ref. [32]. In contrast, for the Ag(111)/K3PO4 system, no direct associations could be established between a minimum in R1 and a maximum in C1().
4 Discussion
4.1 Dynamical processes
Fig. 8 (upper panel) shows the as a function of potential of Ag(111) and Ag(100) electrodes in 0.01 M H3PO4, where the negative limit of potential is -0.625 V and -0.600 V for (111) and (100), respectively.
Shorter s were calculated for (100) face, whose values range between 3-10 ms. As noted in section 3.1, in the region of potential referred to in this section, restructuration of the adsorbed layer is the most likely process.
Fig. 8 (lower panel) shows the anodic profiles of Ag(hkl) electrodes in 0.01 M H3PO4, and Table S1 shows the adsorption charge of phosphate species on the (111) face obtained from integration of anodic/cathodic peaks at -0.6 V (see ). Table 2 shows the coverage calculated considering the surface atom density of Ag(111) orientation (1.381015 atoms/cm2). The values seen correlate well with a low coverage. On the other hand, we have found a value of 7.25 Ccm-2 calculated theoretically by DFT for a p(4x4) ordered commensurate submonolayer of H2PO4(ads) adsorbed on Ag(111) (coverage of 0.0625 ML) [5]. We can conclude that a good agreement was obtained, taking into account that the theoretical result was performed under non-electrochemical conditions, and that the experimental result is subject to the error of numerical integration.
Fig. 9 (upper panel) shows the as a function of potential of Ag(111) (black) and Ag(100) (red) electrodes in 0.01 M KH2PO4 between -0.80 V and -0.20 V. At -0.90 V, onset is observed for both electrodes, consequently, for this potential, the best fitting was given by (d) (see ).
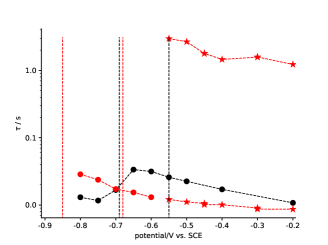
Three potential regions can be distinguished, which have been selected considering the features observed in the profiles and the relative errors and values of the fitting results of the data. For Ag(111)/KH2PO4, the lowest relative errors in the parameters and lowest values were found to be in the potential range from -0.70 V to -0.20 V using in Fig. 1 (c) (see Table S4). This indicates that at these potentials the physical model that better describes the interface corresponds to a simple surface process, where the surface coverage of one species can be estimated.
In the case of Ag(100)/KH2PO4, the results can be associated to one predominant process from -0.80 V to -0.60 V ( in Fig. 1 (c)), whereas from -0.55 V to -0.20 V two processes can be clearly differentiated (red stars obtained using in Fig. 1 (e): and ), as can be concluded from the analysis of errors and (see Table S5). From these findings it was demonstrated that the adsorbate surface dynamics is strongly dependent on the potential applied to the two electrodes. For the slowest process is observed from -0.70 to -0.20 V on the (111) face, which can be attributed to a higher coordination with Ag atoms of these species. These findings show an opposite behavior when comparing with other adsorbates on (100) and (111) faces [33, 34].
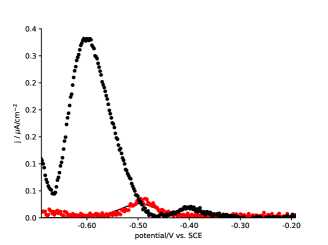
In profiles two peaks are observed at -0.65 V and -0.80 V for Ag(111) and Ag(100), respectively (lower panel) where the solid line is the simulation of a process that involves only one adsorbed species on the electrode surface [35]:
where represents a monolayer of the adsorbate, is the surface concentration, and is the scan rate. When scanning the potential from negative to positive values, the following processes can be represented by Eq. (1):
(a) restructuration of the adsorbed layer that conducts to a different surface geometry, but always involving the Ag-O bond [34].
(b) dissociation of H2PO4(ads) to HPO4(ads) [36, 37]. According to these results, we can conclude that this is a good model to analyze the Ag(hkl)/H2PO4(ads) in terms of data collected during the anodic scan for the peaks observed between -0.90 V and -0.50 V.
Bidoia supposed a Langmuir isotherm as an appropriate model for dihydrogen phosphate adsorption on the platinum surface [38].
Jović et al. [39] have shown that the adsorption of NaF, Na2SO4 and NaCH3CO2 on Ag(111) occurs with a partial charge transfer at a measurable rate. They were the first authors to propose the inclusion of an additional branch parallel to the double layer capacitance, i.e. the in Fig 1 (c). In our case, in the potential region where the peaks are, the results gave the best fit for the in Fig 1 (c). Integration of peaks at -0.80 V and -0.65 V with respect to the potential gives 6.7 Ccm-2 for the (111) surface, well correlated with the value obtained theoretically [5]. On the other hand, for the (100) surface the value obtained was 10.4 Ccm-2, a bit higher than the previously informed. Surface charge densities were previously calculated by DFT in the substrate/vacuum interface for p(4x4) ordered submonolayers of H2PO4(ads)/Ag(hkl) corresponding to a coverage of 0.065 ML [5]. Although they were not determined under electrochemical conditions, 7.43 Ccm-2 for Ag(100), and 7.25 Ccm-2 for Ag(111) were obtained, in good agreement with hese experimental results. Table 2 shows the coverage values obtained as in Fig. 8. Thus, employing this strategy, our results indicate that it is indeed possible to obtain a quantitative evaluation and comparison at the two silver surface facets of the kinetics of the processes related to H2PO4(ads) species (as it can be observed from Fig. 9).
Mostany et al. [40] also reported anodic/cathodic symmetric peaks for cyclic voltammograms of Pt(111) in 0.1 M HClO4 + xM NaH2PO4 for xM up to 0.01 M. They have reported for 0.01 M NaH2PO4 a coverage of 0.22 ML with a surface charge equal to 63 cm-2.
On Au(111) and Au(100) electrodes, Weber et al. [41] concluded that the coordination of H2PO4(ads), for both electrodes, was two-fold through the two oxygen atoms, yet they have not informed coverage.
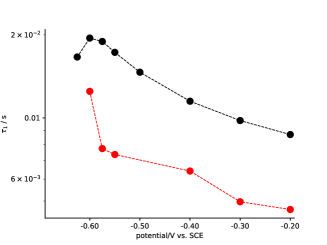
Fig. 10 (upper and middle panel) shows the and as a function of potential of Ag(111) and Ag(100) in 0.01 M K3PO4 between -1.20 V and -0.20 V. The processes from -0.85 V to -0.55 V are faster on (100) than on (111) surface (, middle panel). The values range between 3.8 and 9.6 ms. The interaction that is evidenced from the voltammograms (Fig. 10 lower panel), i.e., different co-existing adsorption sites, and the dependence of the adsorption kinetics on the electrode crystal face and electrode potential are demonstrated. In the case of , slow processes are involved (from 0.7 s to 7 s), thus no direct associations can be made with the profiles.
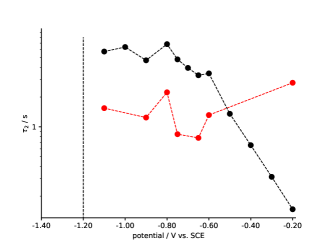
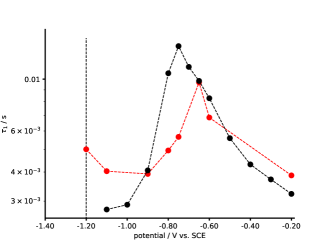
In the case of Ag(111) surface, the values range between 2.7 and 14 ms. The peak at -0.77 V (Fig. 10 lower panel) was identified in Fig. 5 as the contribution due to co-adsorbed OH(ads). Therefore, according to Ref. [42] the peak at -0.55 V is related to the restructuring of the phosphate adsorbed species. As no peaks were observed at potentials negative to -0.77 V when the scan starts at -1.35 V (see Fig. 5 Upper panel), the coverage could only be calculated from the chathodic peak at -0.90 V, and is informed in Table 2. For Ag(100) surface, integration of the anodic peak at -1.10 V in relation to the potential gives 17.6 Ccm-2 (see Table S3), corresponding to a coverage of 0.092 ML, and the cathodic peak at -1.0 V gave a coverage of 0.058 ML (Table 2). Phosphate species are widely used as buffer solutions in the study of important catalytic reactions. Therefore, it is relevant to determine the effect produced by the phosphate species adlayer on elementary steps, as in mechanisms [43, 44, 45, 46, 47]. The present study is the first that reports the study of and on Ag(hkl) in phosphate electrolytes. This information is relevant to the resolution of multiple-state adsorption of phosphate species on single crystal Ag surfaces and also to the influence of co-adsorbed anions.
| Electrolyte 0.01 M | / Ag(111) | / Ag(111) | / Ag(100) | / Ag(100) |
|---|---|---|---|---|
| anodic | cathodic | anodic | cathodic | |
| H3PO4 | 0.023 | 0.025 | - | - |
| KH2PO4 | 0.030 | 0.033 | 0.054 | 0.058 |
| K3PO4 | - | 0.071 | 0.092 | 0.058 |
4.2 Heterogeneous reactions
In the case of Ag(hkl) in 0.01 M H3PO4(aq), the following reactions were postulated:
H3PO4(aq)
H2PO4-(aq)
+ H+(aq) pKa = 2.04 (2)
and
H2PO4-(aq) +
(nH2O)(ads)/(hkl)
((n-x)H2O +
H2PO4)(ads)/(hkl) +
xH2O + e- (3)
where (hkl) is the silver single crystal substrate, and the subscripts ”” and ”” represent the adsorbate and the species in solution, respectively.
The adsorbed water is displaced by the ion. Hughes Z.E. et al. have calculated the adsorption energies of water molecules on both surfaces and -0.93 eV and -0.84 eV were informed for Ag(100) and Ag(111), respectively [48]. The adsorption energies of H2PO4(ads) calculated by us in Ref. [6] were -3.71 eV for Ag(100) and -3.61 eV for Ag(111). Although anions have greater adsorption energy than water, due to repulsive lateral interactions between them, an ordered submonolayer of low coverage is formed according to Eq. (2).
Dorain et al. [49] have studied the polycrystalline Ag in different phosphate solutions by SERS. They observed the Raman vibrational modes of H3PO4(aq), and distinction of peaks from undissociated H3PO4(ads) was not detected. This indicates that adsorption did not occur under their experimental conditions. However, a weak and characteristic adsorption for each face orientation takes place under our experimental setup, as was shown in Fig. 3 and Fig. 8. According to our calculations [5] adsorption energies of -0.98 eV (for 100) and -1.08 eV (for 111) were obtained. These values are in the order of the water adsorption energy [48], thus significant adsorption of this species is not expected as shown in Ref. [49].
Niaura et al. have characterized the structural changes at the interface when the coordination of the phosphate species to a surface of a polycrystalline silver electrode moves from tri(bi)- to mono-dentate as the potential changes towards more negative values [42]. We have corroborated these findings using silver single crystals [5]. Therefore, we support the hypothesis sustained through Eq. (2) that for this system the main adsorbed species is H2PO4(ads)/Ag. So far, the adsorption of undissociated H3PO4(ads) has only been detected on Pt(111) at pH = 0.23 by in-situ FTIRS [50, 51], therefore we have assumed that Eq. (1) takes place only in solution.
In the case of the KH2PO4 electrolyte, where the species of highest concentration are H2PO anions, it has been shown that the main adsorbed species is H2PO4(ads) [5]. The H2PO4(ads)/Ag as the main adsorbate has also been proved for other systems [37, 5, 52], thus we postulate that Eq. (2) also applies to our experimental conditions.
For the adsorption of H2PO4(ads) on Ag(100), the most stable configuration is the tri-dentate one, but this species can also be adsorbed on other configuration. Thus, the Minimum Energy Path (MEP) at substrate/vacuum interface corresponding to the change between bi-dentate to tri-dentate configurations was studied by means of nudged elastic band (NEB) algorithm and DFT calculations, finding an energy barrier of 0.37 eV [5]. This is a high barrier for a spontaneous process at room temperature, but at electrochemical conditions it is expected that all H2PO4(ads) species should be in the tri-dentate configuration.
In addition to the vacuum slab method, the double reference model was used by Savizi et al. [37]. They have determined that the main adsorbed species on Pt(111) was H2PO4(ads).
In the case of Ag(hkl) in 0.01 M K3PO4, the species of higher concentration in the electrolyte are PO and OH-. Thus, the following reaction takes place [5]:
PO43-(aq) + OH-(aq) + (nH2O)(ads)/ ((n-x)H2O + OH + PO4)(ads)/ + xH2O + 4 e- (4)
For solutions with high OH- concentration, it has been demonstrated that the presence of surface oxides and adsorbed hydroxide ions has effective influence on displacing phosphate adsorbed species on Au and Cu electrodes, effect that was not observed on Ag surfaces [42]. For this system we have found competitive adsorption between OH-, HPO and PO.
5 Conclusions
The following conclusions can be drawn according to the results discussed above:
- From the dielectric complex permittivity representation of the data, a semicircle was observed even with the most negative potential values, showing that takes place at the same time as the processes associated with the phosphate species.
- We have shown that there is a strong potential dependence of spectra, and the data can be modeled using the appropriate for each potential range. At low overpotentials for , the better fit corresponded to the in Fig. 1 (d), except for the Ag(111)/K3PO4 system where the lowest errors were given for the in Fig. 1 (f). At pH 1.60 the Rct was resolved at low overpotentials of on Ag(100), where the values were larger than those of the resistance representing the adsorption process.
- In the case of Ag(111)/KH2PO4, three potential regions were distinguished in the profiles. From -1.20 V to -0.90 V, is taking place. From -0.85 V to -0.65 V, a stable submonolayer is formed. From -0.65 V to -0.20 V, two reversible peaks are observed, that correlate well with the changes observed in the R1 and values. For Ag(100)/KH2PO4 system, from -0.80 V to -0.60 V one predominant process was found. From -0.60 V to -0.20 V, the best fitting was given by the in Fig. 1 (e), which can be explained by the co-existence of two processes.
- For the Ag(111)/K3PO4 system, two processes with different kinetics were identified in terms of fitting results in the same potential window where the peaks are observed in the voltammograms. The kinetics of adsorption of OH- is faster (the adsorption resistance decreased) in presence of phosphate species.
- For Ag(111)/H3PO4 system, a similar coverage of 0.024 ML was calculated from anodic/cathodic profiles. Average values of 0.032 ML and 0.056 ML were obtained for H2PO4(ads)/Ag(111) and H2PO4(ads)/Ag(100), respectively. For PO4(ads)/Ag(111) a value of 0.071 ML was obtained, well correlated with previously reported theoretical results. In the case of PO4(ads)/Ag(100), values of 0.092 ML and 0.058 ML were obtained for anodic and cathodic profiles, respectively.
- An adsorbate-induced modification of the overpotential was found for all pH. At pH=1.60 the Ag(100) surface displayed a relatively higher activity and selectivity for as compared with Ag(111).
6 ACKNOWLEDGMENTS
The authors thank support from CONICET (Project 15920150100013CO, Res. 2049/16 Argentina) and SeCyT 33620180100222CB (UNC, Córdoba, Argentina). The authors also wish to thank language assistance by C. Mosconi.
References
- [1] Philomena Schlexer Lamoureux, Aayush R. Singh, and Karen Chan. pH effects on hydrogen evolution and oxidation over Pt(111): Insights from first-principles. ACS Catalysis, 9(7):6194–6201, 2019.
- [2] Nicolas Dubouis and Alexis Grimaud. The hydrogen evolution reaction: from material to interfacial descriptors. Chem. Sci., pages –, 2019.
- [3] Francisco J. Sarabia, Víctor Climent, and Juan M. Feliu. Interfacial study of nickel-modified surfaces in phosphate-containing solutions: Effect on the hydrogen evolution reaction. ChemPhysChem, 0(0).
- [4] A. Ruderman, M.F. Juarez, G. Soldano, L.B. Avalle, G. Beltramo, M. Giesen, and E. Santos. Current transients for the hydrogen evolution reaction at high overpotentials on silver electrodes in acid solutions: Experiments and modelling. Electrochimica Acta, 109:403–410, 2013.
- [5] C.B. Salim, M.I. Rojas, and L.B. Avalle. Differentiated interactions in phosphate solutions: Comparing and surfaces. Journal of Electroanalytical Chemistry, 799:487–496, 2017.
- [6] Kolovos-Vellianitis D. and Kúppers J. Abstraction of D on Ag(100) and Ag(111) surfaces by gaseous H atoms: The role of electronhole excitations in hot atom reactions and the transition to eley-rideal kinetics. Surface Science, 548(1):67–74, 2004.
- [7] Kuo Tsung-Rong, Lee Yi-Cheng, Chou Hung-Lung, M G Swathi, Wei Chuan-Yu, Wen Cheng-Yen, Chang Yi-Hsuan, Pan Xi-Yu, and Wang Di-Yan. Plasmon-enhanced hydrogen evolution on specific facet of silver nanocrystals. Chemistry of Materials, 31(10):3722–3728, 2019.
- [8] Gediminas Niaura and Rimas Jakubenas. The alkali metal cation effect on the surface-enhanced raman spectra of phosphate anions adsorbed at silver electrodes. J. Electroanal. Chem., 510:50–58, 2001.
- [9] Ravishankar Sundararaman, Kendra Letchworth-Weaver, and Kathleen A. Schwarz. Improving accuracy of electrochemical capacitance and solvation energetics in first-principles calculations. The Journal of Chemical Physics, 148(14):144105, 2018.
- [10] Georges Valette. Double layer on silver single crystal electrodes in contact with electrolytes having anions which are slightly specifically adsorbed: Part . the (100) face. Journal of Electroanalytical Chemistry and Interfacial Electrochemistry, 138(1):37–54, 1982.
- [11] Sylvio May. Differential capacitance of the electric double layer: mean-field modeling approaches. Current Opinion in Electrochemistry, 13:125–131, 2019. Fundamental and Theoretical Electrochemistry: Physical and Nanoelectrochemistry.
- [12] L.B. Avalle and L. Valle. Riboflavin and flavin mononucleotide adsorption on electrodes and their interaction with l-cysteine investigated by electrochemical and non-linear optical methods. J. Electroanal. Chem., 662(2):288–297, 2011.
- [13] W. Schmickler and E. Santos. Interfacial electrochemistry, volume 2nd. ed. Springer Berlin Heidelberg, 2010.
- [14] Tamás Pajkossy and Rafal Jurczakowski. Electrochemical impedance spectroscopy in interfacial studies. Current Opinion in Electrochemistry, 1(1):53–58, 2017.
- [15] P. Lagonotte, V.A.R. Ilie, S. Martemianov, and A. Thomas. Extrapolation to zero frequency with first time constant of ferri-ferrocyanide/ interface using foster equivalent circuit and factorized modelling. Journal of Electroanalytical Chemistry, 839:256–263, 2019.
- [16] Modeling electrochemical impedance spectroscopy. Current Opinion in Electrochemistry, 13:132–139, 2019. Fundamental and Theoretical Electrochemistry Physical and Nanoelectrochemistry.
- [17] David A. Harrington. Simplifying mechanistic impedances. Electrochimica Acta, 338:1–6, 2020.
- [18] Georges Valette. Surface potential variations at the water/single-crystal of silver interface. Journal of Electroanalytical Chemistry, 178(1):179–183, 1984.
- [19] D. Diesing, H. Winkes, and A. Otto. Time resolved investigation of the hydrogen evolution reaction on Ag(111), Ag(100), smooth polycrystalline, and activated polycrystalline silver surfaces. physica status solidi (a), 159(1):243–254, 1997.
- [20] S. Morin, H. Dumont, and B.E. Conway. Evaluation of the effect of two-dimensional geometry of Pt single-crystal faces on the kinetics of upd of h using impedance spectroscopy. Journal of Electroanalytical Chemistry, 412(1):39–52, 1996.
- [21] Sarah L. Horswell, Alexei L. N. Pinheiro, Elena R. Savinova, Matthias Danckwerts, Bruno Pettinger, Mau-Scheng Zei, and Gerhard Ertl. A comparative study of hydroxide adsorption on the (111), (110), and (100) faces of silver with cyclic voltammetry, ex situ electron diffraction, and in situ second harmonic generation. Langmuir, 20(25):10970–10981, 2004.
- [22] Hamelin A. Double-Layer properties at and metal single-crystal electrodes, volume 16 of Modern Aspects of Electrochemistry. Plenum Press, New York. A Division of Plenum Publishing Corporation, 1985.
- [23] L. Doubova and S. Trasatti. Crystal face specificity of fluoride adsorption on ag electrodes: the (111) face. Electrochimica Acta, 42(5):785–791, 1997. Fundamental aspects of electrochemistry.
- [24] G. Beltramo and E. Santos. Characterisation of chloride and bromide specific adsorption process on silver single crystal surfaces by impedance spectroscopy: Part . An extended model to obtain the charge density from impedance spectra applied to at low concentrations of halides. Journal of Electroanalytical Chemistry, 556:127–136, 2003.
- [25] Jun Huang and Yanxia Chen. Combining theory and experiment in advancing fundamental electrocatalysis. Current Opinion in Electrochemistry, 2019.
- [26] Martin Z. Bazant. Editorial overview: Fundamental and theoretical electrochemistry: Advances in the theory of electrochemical interfaces. Current Opinion in Electrochemistry, 13:A1–A4, 2019. Fundamental and Theoretical Electrochemistry: Physical and Nanoelectrochemistry.
- [27] Georges Valette. Double layer on silver single crystal electrodes in contact with electrolytes having anions which are slightly specifically adsorbed: Part . the (111) face. Journal of Electroanalytical Chemistry and Interfacial Electrochemistry, 269(1):191–203, 1989.
- [28] G. Valette. Double layer on silver single-crystal electrodes in contact with electrolytes having anions which present a slight specific adsorption: Part . the (110) face. Journal of Electroanalytical Chemistry and Interfacial Electrochemistry, 122:285–297, 1981.
- [29] Georges Valette. Silver-water interactions: Part . model of the inner layer at the metal/water interface. Journal of Electroanalytical Chemistry and Interfacial Electrochemistry, 230(1):189–204, 1987.
- [30] A. Hamelin and L. Stoicoviciu. Comments on the inner-layer capacity versus charge density curves. Journal of Electroanalytical Chemistry and Interfacial Electrochemistry, 271(1):15–26, 1989.
- [31] Xiaoping Gao, Gregory J. Edens, Fan-Chen Liu, Antoinette Hamelin, and Michael J. Weaver. Sensitivity of electrochemical adlayer structure to the metal crystallographic orientation: Potential-dependent iodide adsorption on Au(100) in comparison with other low-index surfaces. J. Phys. Chem., 98(33):8086–8095, 1994.
- [32] B.M. Jovi, V.D. Jovi, and D.M. Drai. Kinetics of chloride ion adsorption and the mechanism of AgCl layer formation on the (111), (100) and (110) faces of silver. Journal of Electroanalytical Chemistry, 399(1):197–206, 1995.
- [33] Björn Rahn and Olaf M. Magnussen. Sulfide surface dynamics on (100) and (100) electrodes in the presence of c(2 2) halide adlayers. ChemElectroChem, 5(20):3073–3082.
- [34] Björn Rahn and Olaf M. Magnussen. Formation and diffusion of subsurface adsorbates at electrodes. Journal of the American Chemical Society, 140(29):9066–9069, 2018.
- [35] Jean-Michel Savéant. Elements of Molecular and Biomolecular Electrochemistry: An Electrochemical Approach to Electron Transfer Chemistry. John Wiley & Sons, Inc., 2006.
- [36] Hee-Young Park, Dong-Hee Lim, Sung Jong Yoo, Hyoung-Juhn Kim, Dirk Henkensmeier, Jin Young Kim, Hyung Chul Ham, and Jong Hyun Jang. Transition metal alloying effect on the phosphoric acid adsorption strength of nanoparticles: an experimental and density functional theory study. Scientific Reports, 7(7186):1–9, 2017.
- [37] Iman Shahidi Pour Savizi and Michael J. Janik. Acetate and phosphate anion adsorption linear sweep voltammograms simulated using density functional theory. Electrochimica Acta, 56(11):3996–4006, 2011.
- [38] Ederio Dino Bidoia. Adsorption of dihydrogen phosphate ion on platinum electrodes in aqueous media monitored by probe-beam deflection. Chemical Physics Letters, 408(1):1–4, 2005.
- [39] V.D. Jovi, R. Parsons, and B.M. Jovi. Anion absorption on the (111) face of silver. Journal of Electroanalytical Chemistry, 339(1):327–337, 1992. An International Journal Devoted to all Aspects of Electrode Kinetics, Interfacial Structure, Properties of Electrolytes, Colloid and Biological Electrochemistry.
- [40] Jorge Mostany, Pedro Martínez, V. Climent, Enrique Herrero, and J.M. Feliu. Thermodynamic studies of phosphate adsorption on Pt(111) electrode surfaces in perchloric acid solutions. Electrochimica Acta, 54(24):5836–5843, 2009.
- [41] A.J. Motheo M. Weber, I.R. de Moraes and F.C. Nart. In situ vibrational spectroscopy analysis of adsorbed phosphate species on gold single crystal electrodes. Colloids and Surfaces A: Physicochemical and Engeneering Aspects, 134(1-2):103–111, 1998.
- [42] Gediminas Niaura, Adolfas K Gaigalas, and Vincent L Vilker. Surface-enhanced raman spectroscopy of phosphate anions: adsorption on silver, gold, and copper electrodes. The Journal of Physical Chemistry B, 101(45):9250–9262, 1997.
- [43] Megan N. Jackson, Onyu Jung, Hamish C. Lamotte, and Yogesh Surendranath. Donor-dependent promotion of interfacial proton-coupled electron transfer in aqueous electrocatalysis. ACS Catalysis, 9(4):3737–3743, 2019.
- [44] Keisuke Obata, Liga Stegenburga, and Kazuhiro Takanabe. Maximizing hydrogen evolution performance on Pt in buffered solutions: Mass transfer constrains of H2 and buffer ions. The Journal of Physical Chemistry C, 123(35):21554–21563, 2019.
- [45] Nicolas Dubouis, Chunzhen Yang, Robin Beer, Lucie Ries, Damien Voiry, and Alexis Grimaud. Interfacial interactions as an electrochemical tool to understand -based catalysts for the hydrogen evolution reaction. ACS Catalysis, 8(2):828–836, 2018.
- [46] Xiaoyu Tian, Pengcheng Zhao, and Wenchao Sheng. Hydrogen evolution and oxidation: Mechanistic studies and material advances. Advanced Materials, 31(31):1808066, 2019.
- [47] Lin fan Shen, Bang an Lu, Xi ming Qu, Jin yu Ye, Jun ming Zhang, Shu hu Yin, Qi hui Wu, Rui xiang Wang, Shou yu Shen, Tian Sheng, Yan xia Jiang, and Shi gang Sun. Does the oxophilic effect serve the same role for hydrogen evolution/oxidation reaction in alkaline media? Nano Energy, 62:601–609, 2019.
- [48] Zak E. Hughes, Louise B. Wright, and Tiffany R. Walsh. Biomolecular adsorption at aqueous silver interfaces: First-principles calculations, polarizable force-field simulations, and comparisons with gold. Langmuir, 29(43):13217–13229, 2013.
- [49] Richard K. Chang Paul B. Dorain, K Ulrich Von Raben. Voltage dependence of the at the interface of a electrode: A measurement of a phosphate-phosphoric acid system. Surface Science, 148:439–452, 1984.
- [50] Katherine A. Willets. Probing nanoscale interfaces with electrochemical surface-enhanced raman scattering. Current Opinion in Electrochemistry, 13:18–24, 2019.
- [51] F.C. Nart and T. Iwasita. On the adsorption of and on platinum: an in situ study. Electrochimica Acta, 37(3):385–391, 1992.
- [52] Yvonne Gründer, Jack Beane, Adam Kolodziej, Christopher A. Lucas, and Paramaconi Rodriguez. Potential dependent structure and stability of in neutral phosphate electrolyte. Surfaces, 2(1):145–158, 2019.