SUPPLEMENTAL MATERIAL
Evidence for an extended critical fluctuation region above the polar ordering transition in LiOsO3
Jun-Yi Shan
Department of Physics, California Institute of Technology, Pasadena, California 91125, USA
Institute for Quantum Information and Matter, California Institute of Technology, Pasadena, California 91125, USA
A. de la Torre
Department of Physics, California Institute of Technology, Pasadena, California 91125, USA
Institute for Quantum Information and Matter, California Institute of Technology, Pasadena, California 91125, USA
N. J. Laurita
Department of Physics, California Institute of Technology, Pasadena, California 91125, USA
Institute for Quantum Information and Matter, California Institute of Technology, Pasadena, California 91125, USA
L. Zhao
Department of Physics, University of Michigan, Ann Arbor, Michigan 48109, USA
C. D. Dashwood
London Centre for Nanotechnology and Department of Physics and Astronomy, University College London, London WC1E 6BT, UK
D. Puggioni
Department of Materials Science and Engineering, Northwestern University, Illinois 60208-3108, USA
C. X. Wang
Institute of Physics, Chinese Academy of Sciences, Beijing 100190, China
K. Yamaura
Research Center for Functional Materials, National Institute for Materials Science, 1-1 Namiki, Tsukuba, Ibaraki 305-0044, Japan
Y. Shi
Institute of Physics, Chinese Academy of Sciences, Beijing 100190, China
J. M. Rondinelli
Department of Materials Science and Engineering, Northwestern University, Illinois 60208-3108, USA
D. Hsieh
Department of Physics, California Institute of Technology, Pasadena, California 91125, USA
Institute for Quantum Information and Matter, California Institute of Technology, Pasadena, California 91125, USA
pacs:
Valid PACS appear here
S1 Determination of
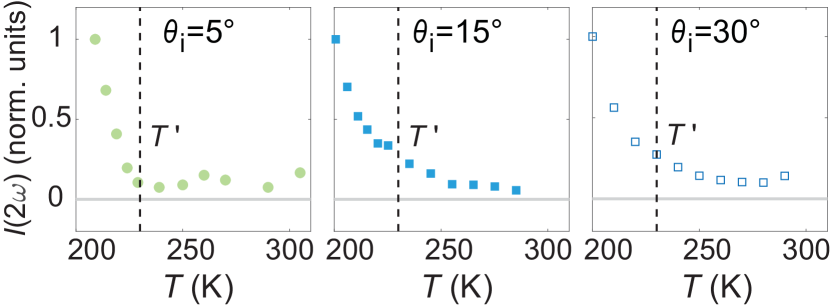
We defined the value of as the characteristic temperature below which the EQ contribution to the SHG intensity starts to grow. It is not sharply defined since no phase transition occurs at . As shown in Fig. S1, we consistently observe that 230 K independent of the angle of incidence . Note that is not detectable at normal incidence because the EQ contribution vanishes.
Figure S1: Zoom-in on the SHG intensity near (vertical dashed line) for = 5∘, 15∘, and 30∘. All data are normalized to their values at = 200 K.
S2 SHG-RA data for different polarization geometries
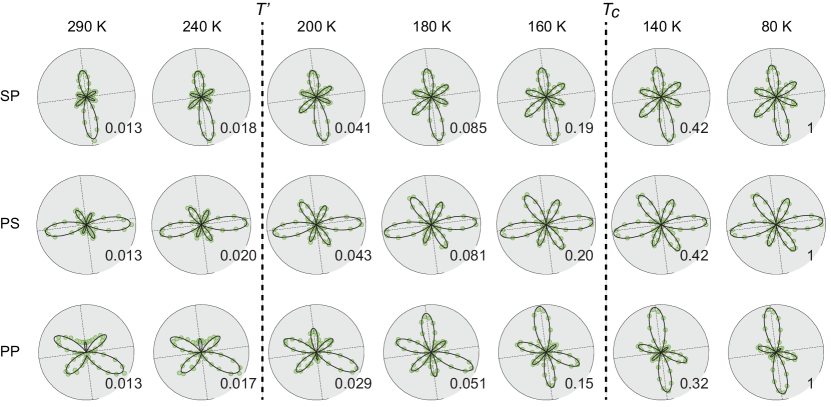
The SHG-RA data shown in the main text are taken under Sin-Sout polarization geometry. Figure S2 shows the SHG-RA data sets taken under the alternate Sin-Pout, Pin-Sout, and Pin-Pout geometries. Consistent with the Sin-Sout data reported in the main text, they all exhibit clear shape changes over the temperature interval .
Figure S2: Polar plots of the SHG-RA data (green circles) from LiOsO3 [121] at selected temperatures taken under Sin-Pout, Pin-Sout, and Pin-Pout polarization geometries. Fits to an EQ SHG response for an space group ( point group) as described in Section S4 are superposed as black lines. For the 80 K fit we included an additional ED SHG contribution for an space group ( point group). The intensity scale is normalized to the 80 K value.
S3 Fits to MD SHG processes
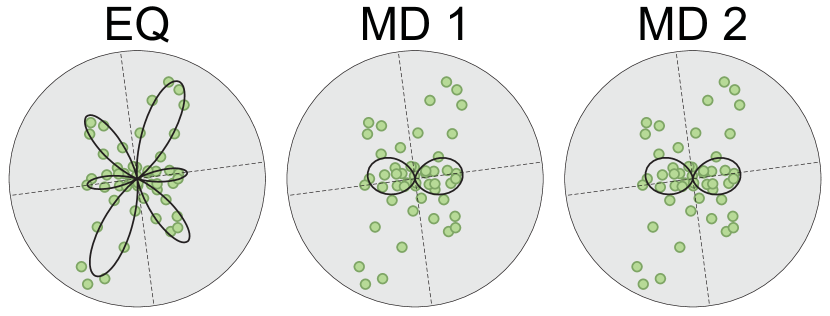
The pronounced angle-of-incidence dependence of the SHG response in the high temperature centrosymmetric state (main text Fig. 2) is incompatible with an ED process, but may arise from bulk magnetic-dipole (MD) or bulk EQ processes. In addition to the EQ response discussed in the main text, we considered the two possible MD SHG contributions of the type and . In the c space group, there are two nonzero independent tensor elements for , which are Aroyo et al. (2011) , and . The direction is along the crystallographic axis, and the direction is perpendicular to the glide mirror plane. For LiOsO3 [121], the dependence of this MD SHG intensity in Sin-Sout geometry on the angle of incidence and scattering plane angle is given by , where
Figure S3: SHG-RA data taken in Sin-Sout geometry (green circles) from LiOsO3 [121] at 200 K and the best fits to the EQ, MD 1, and MD 2 SHG processes (black lines).
There are four nonzero independent tensor elements for , which are , , , and . The expression for this MD SHG intensity in Sin-Sout geometry is given by , where
As shown in Fig. S3, neither of these two MD processes fits our high-temperature SHG-RA data, due to insufficient number of independent fitting parameters. Thus, we conclude that the EQ SHG contribution dominates the high-temperature SHG signal.
S4 EQ and ED SHG susceptibility tensors
We considered an EQ SHG process of the form . In the c space group, the susceptibility tensor has 11 nonzero independent tensor elements: Boyd (2003) , , , , , , , , , , and . Also . For LiOsO3 [121], the dependence of the SHG intensity in Sin-Sout geometry on the angle of incidence and scattering plane angle is given by , where
,
,
,
,
,
,
,
,
.
We can fit all SHG-RA data sets in the region shown in Fig. 3 of the main text simply by adjusting the magnitudes of the allowed tensor elements.
We note that even though the EQ SHG response has both a and dependence, experimentally we find that the SHG intensity in the centrosymmetric phase becomes vanishingly small at normal incidence. Therefore the term dominates. This is expected for the following reason. The [121] oriented LiOsO3 crystal in the centrosymmetric phase does not have twofold rotational () symmetry about the surface normal due to the positioning of the Li atoms [see main text Fig. 1(b)]. However the Os-O sublattice does have symmetry. Our SHG measurement uses an incident photon energy of 1.5 eV and an SHG photon energy of 3 eV, so the intermediate and final states of the SHG process are dominated by Os-5 and O-2 states Liu et al. (2015). Therefore we should be primarily sensitive to the Os-O sublattice. This is consistent with the near symmetry we observe in our SHG-RA data. Since the coefficients of the term all break , they must be significantly smaller than the coefficients of the term, which preserves , at the photon energies we use.
Below an additional bulk ED SHG contribution is allowed, which interferes with the EQ contribution. In the space group, the susceptibility tensor has four nonzero independent tensor elements Boyd (2003), , , , and . For LiOsO3 [121], the expression for the ED SHG intensity in Sin-Sout geometry is given by , where
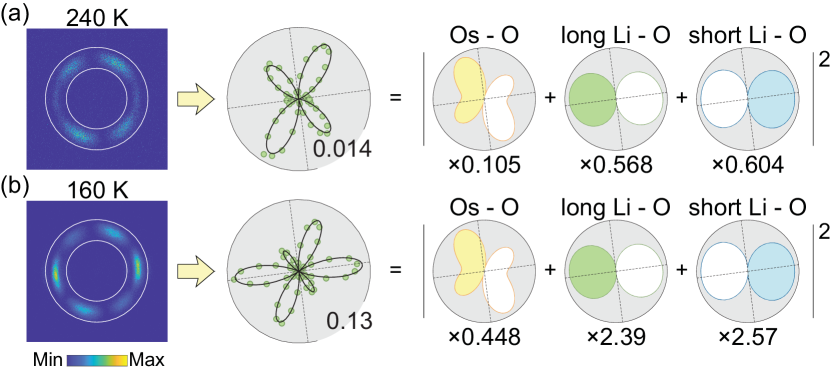
Figure S4: Example fits of the SHG-RA data at (a) 240 K and (b) 160 K to the SHBM. The first column shows the raw data. The second column shows the angular dependence of the SHG intensity obtained by radially integrating the raw data between the region bounded by the concentric white circles. Black curves are the SHBM fits. The third column shows the contributions from the Os-O bonds, the long Li-O bonds, and the short Li-O bonds obtained from fitting, with their fitted magnitudes written below. Shaded (unshaded) areas indicate positive (negative) amplitudes.
S5 Details of the simplified hyper-polarizable bond model
In the SHBM, the EQ susceptibility tensor can be expressed as , where and are the linear and second-order (hyper-) polarizabilities of the bond and is a unit vector along the direction of the bond Powell et al. (2002); Bauer and Hingerl (2017). To fit our SHG-RA data we include all three types of bonds in the unit cell of LiOsO3: the Os-O bonds, the long Li-O bonds between adjacent planes, and the short Li-O bonds in the same planes Benedek and Birol (2016). Based on the lack of marked temperature dependence in the reported linear optical response Lo Vecchio et al. (2016); Laurita et al. (2019), we assume that the values of are temperature independent. We also keep values constant, leaving only the as fit parameters (Fig. S4). The ’s of the bonds are obtained from reported neutron diffraction data at 300 K Shi et al. (2013) to be as follows. Note the primitive vectors are (units in Å): , , and .
Os-O bonds:
Long Li-O bonds:
Short Li-O bonds:
To validate our approximation that the values are constant, we also calculated SHG-RA patterns by fixing at all temperatures and only changing the ’s according to lattice parameters reported by neutron diffraction Shi et al. (2013). As shown in Fig. S5, the calculated SHG-RA patterns hardly change over the interval and cannot account for our observations.
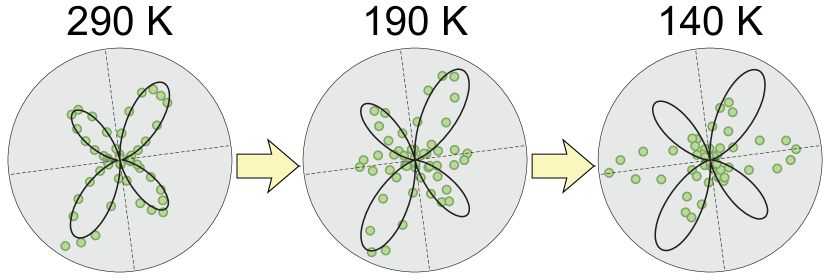
Figure S5: Measured SHG-RA patterns (green circles) at 290 K, 190 K, and 140 K. Black curves show patterns calculated using the SHBM, where the values are fixed to the best fit values for the 290 K data, and the ’s are varied at each temperature based on neutron diffraction data.
References
Aroyo et al. (2011)M. I. Aroyo, J. M. Perez-Mato, D. Orobengoa, E. Tasci,
G. de la Flor, and A. Kirov, Bulg. Chem. Commun. 43, 183 (2011).
Lo Vecchio et al. (2016)I. Lo Vecchio, G. Giovannetti, M. Autore,
P. Di Pietro, A. Perucchi, J. He, K. Yamaura, M. Capone, and S. Lupi, Phys. Rev. B 93, 161113 (2016).
Laurita et al. (2019)N. J. Laurita, A. Ron,
J.-Y. Shan, D. Puggioni, N. Z. Koocher, K. Yamaura, Y. Shi, J. M. Rondinelli, and D. Hsieh, Nat. Commun. 10, 3217 (2019).
Shi et al. (2013)Y. Shi, Y. Guo, X. Wang, A. J. Princep, D. Khalyavin, P. Manuel, Y. Michiue, A. Sato, K. Tsuda, S. Yu, M. Arai, Y. Shirako, M. Akaogi, N. Wang, K. Yamaura, and A. T. Boothroyd, Nat. Mater. 12, 1024 (2013).