Multi-Temporal Analysis and Scaling Relations of 100,000,000,000 Network Packets ††thanks: This material is based upon work supported by the Assistant Secretary of Defense for Research and Engineering under Air Force Contract No. FA8702-15-D-0001, National Science Foundation CCF-1533644, and United States Air Force Research Laboratory Cooperative Agreement Number FA8750-19-2-1000. Any opinions, findings, conclusions or recommendations expressed in this material are those of the author(s) and do not necessarily reflect the views of the Assistant Secretary of Defense for Research and Engineering, the National Science Foundation, or the United States Air Force. The U.S. Government is authorized to reproduce and distribute reprints for Government purposes notwithstanding any copyright notation herein.
Abstract
Our society has never been more dependent on computer networks. Effective utilization of networks requires a detailed understanding of the normal background behaviors of network traffic. Large-scale measurements of networks are computationally challenging. Building on prior work in interactive supercomputing and GraphBLAS hypersparse hierarchical traffic matrices, we have developed an efficient method for computing a wide variety of streaming network quantities on diverse time scales. Applying these methods to 100,000,000,000 anonymized source-destination pairs collected at a network gateway reveals many previously unobserved scaling relationships. These observations provide new insights into normal network background traffic that could be used for anomaly detection, AI feature engineering, and testing theoretical models of streaming networks.
Index Terms:
Internet modeling, packet capture, streaming graphs, power-law networks, hypersparse matricesI Introduction
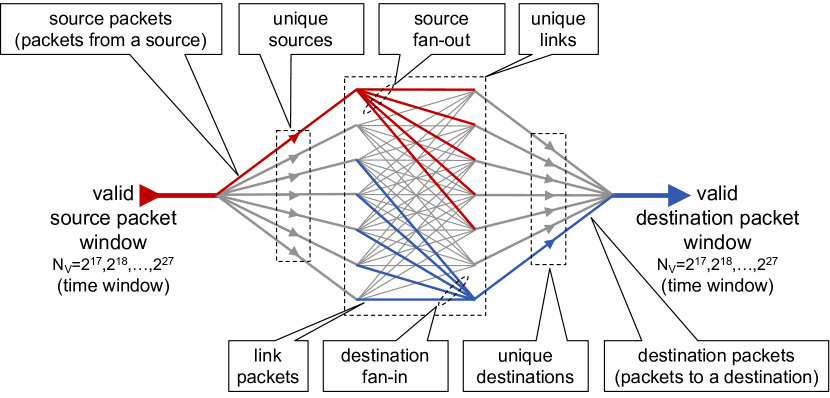
Global usage of the Internet is expected to exceed 5 billion people in 2023[1]. Accordingly, cyberspace is a frontier as worthy of scientific study as land, sea, air, and space were during past eras of exploration [2, 3, 4, 5, 6]. Deepening our scientific understanding of cyberspace is expected to yield correspondingly equivalent societal benefits [7, 8, 9]. More pragmatically, effective utilization of cyberspace requires a detailed understanding of its principal characteristic: network traffic [10]. Figure 1 illustrates essential quantities found in all streaming dynamic networks. These quantities are derivable from the source and destinations in packet headers that are the foundational transactional unit of the Internet [11].
Precise measurements of these quantities on networks as vast as the Internet are computationally challenging [12, 13, 14]. Prior work has developed massively parallel data processing capabilities that can effectively use thousands of processors to rapidly process billions of packets in a few hours [15, 16, 17, 18, 19, 20]. Using these capabilities, 50,000,000,000 anonymized packets from the largest publicly available collections of Internet packet data were analyzed, demonstrating the ubiquity of the Zipf-Mandelbrot distribution and the importance of the size of the packet sampling window . These data consisted of four 1-hour and two 2-day collections from Internet “trunk” lines, providing a high-level view of their portions of the Internet spanning years and continents [21, 22, 23, 24, 25, 26]. These results underscore the need for processing longer time periods from additional vantage points.
Network gateways are a common view into the Internet, are widely monitored, and represent a natural observation point of network traffic. Using such a gateway we were able to collect trillions of packet headers over several years. Processing such a large volume of data requires additional computational innovations. The incorporation of GraphBLAS hypersparse hierarchical traffic matrices has enabled the processing of hundreds of billions of packets in minutes [27, 28, 29, 30]. This paper presents an initial analysis of one month of anonymized source-destination pairs derived from approximately 100,000,000,000 packets. The contiguous nature of these data allows the exploration of a wide range of packet windows from (seconds) to (hours), providing a unique view into how network quantities depend upon time. These observations provide new insights into normal network background traffic that could be used for anomaly detection, AI feature engineering, polystore index learning, and testing theoretical models of streaming networks [31, 32, 33].
The outline of the rest of the paper is as follows. First, the network quantities and their distributions are defined in terms of traffic matrices. Second, multi-temporal analysis of hypersparse hierarchical traffic matrices is described in the context of network gateways. Third, the method for determining scaling relations as a function of the packet window is presented along with the resulting scaling relations observed in the gateway traffic data. Fourth, an analysis of simple network topologies is performed to illustrate that the observed relations fall between well-defined models. Finally, our conclusions and directions for further work are presented.
II Network Quantities and Distributions from Traffic Matrices
The network quantities depicted in Figure 1 are computable from origin-destination matrices that are widely used to represent network traffic [34, 35, 36, 37]. It is common to filter the packets down to a valid set for any particular analysis. Such filters may limit particular sources, destinations, protocols, and time windows. To reduce statistical fluctuations, the streaming data should be partitioned so that for any chosen time window all data sets have the same number of valid packets [20]. At a given time , consecutive valid packets are aggregated from the traffic into a sparse matrix , where is the number of valid packets between the source and destination . The sum of all the entries in is equal to
| (1) |
All the network quantities depicted in Figure 1 can be readily computed from using the formulas listed in Table I.
Formulas for computing network quantities from traffic matrix at time in both summation and matrix notation. is a column vector of all 1’s, T is the transpose operation, and is the zero-norm that sets each nonzero value of its argument to 1[38].
| Aggregate | Summation | Matrix |
| Property | Notation | Notation |
| Valid packets | ||
| Unique links | ||
| Link packets from to | ||
| Max link packets () | ||
| Unique sources | ||
| Packets from source | ||
| Max source packets () | ||
| Source fan-out from | ||
| Max source fan-out () | ||
| Unique destinations | ||
| Destination packets to | ||
| Max destination packets () | ||
| Destination fan-in to | ||
| Max destination fan-in () |
Each network quantity will produce a distribution of values whose magnitude is often called the degree . The corresponding histogram of the network quantity is denoted by . The largest observed value in the distribution is denoted . The normalization factor of the distribution is given by
| (2) |
with corresponding probability
| (3) |
and cumulative probability
| (4) |
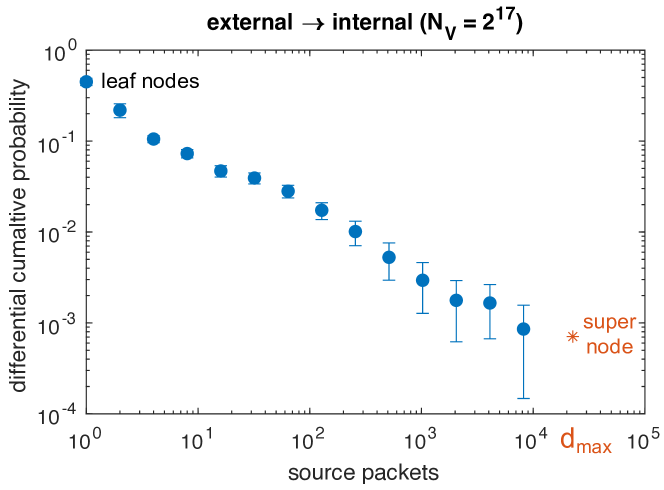
Because of the relatively large values of observed, the measured probability at large often exhibits large fluctuations. However, the cumulative probability lacks sufficient detail to see variations around specific values of , so it is typical to pool the differential cumulative probability with logarithmic bins in
| (5) |
where [39]. All computed probability distributions use the same binary logarithmic binning to allow for consistent statistical comparison across data sets [39, 40]. The corresponding mean and standard deviation of over many different consecutive values of for a given data set are denoted and . Figure 2 provides an example distribution of external internal source packets using a packet window of . The means and standard deviations are computed using 1024 consecutive packet windows. The resulting distribution exhibits the power-law frequently observed in network data [41, 42, 43, 44, 45, 46, 47].
III Multi-Temporal Analysis
Network traffic is dynamic and exhibits varying behavior on a wide range of time scales. A given packet window size will be sensitive to phenomena on its corresponding timescale. Determining how network quantities scale with provides insight into the temporal behavior of network traffic. Efficient computation of network quantities on multiple time scales can be achieved by hierarchically aggregating data in different time windows [20]. Figure 3 illustrates a binary aggregation of different streaming traffic matrices. Computing each quantity at each hierarchy level eliminates redundant computations that would be performed if each packet window was computed separately. Hierarchy also ensures that most computations are performed on smaller matrices residing in faster memory. Correlations among the matrices mean that adding two matrices each with entries results in a matrix with fewer than entries, reducing the relative number of operations as the matrices grow.
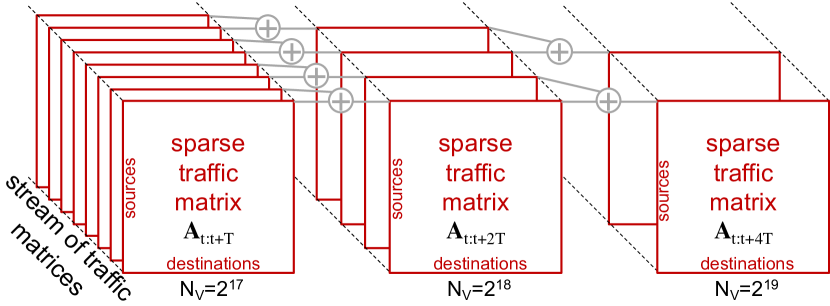
One of the important capabilities of the SuiteSparse GraphBLAS library is support for hypersparse matrices where the number of nonzero entries is significantly less than either dimensions of the matrix. If the packet source and destination identifiers are drawn from a large numeric range, such as those used in the Internet protocol, then a hypersparse representation of eliminates the need to keep track of additional indices and can significantly accelerate the computations [30].
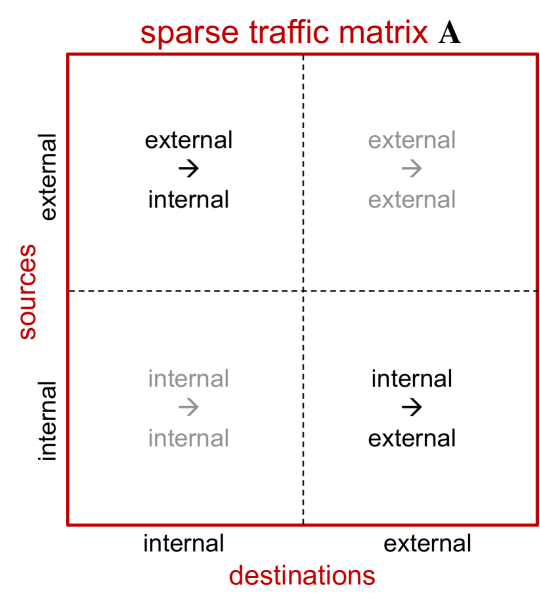
Network gateways are a common view into the Internet, are widely monitored, and represent a natural observation point on network traffic. Using such a gateway we were able to collect trillions of packets over several years. The traffic matrix of a gateway can be partitioned into four quadrants (see Figure 4). These quadrants represent different flows between nodes internal and external to the gateway. A gateway will typically see the external internal and internal external traffic.
Analysis of network quantities over packet windows reveals a strong dependence of many of these quantities on . Blank entries indicate that no simple scaling relation was observed.![[Uncaptioned image]](/html/2008.00307/assets/x7.png)
IV Results
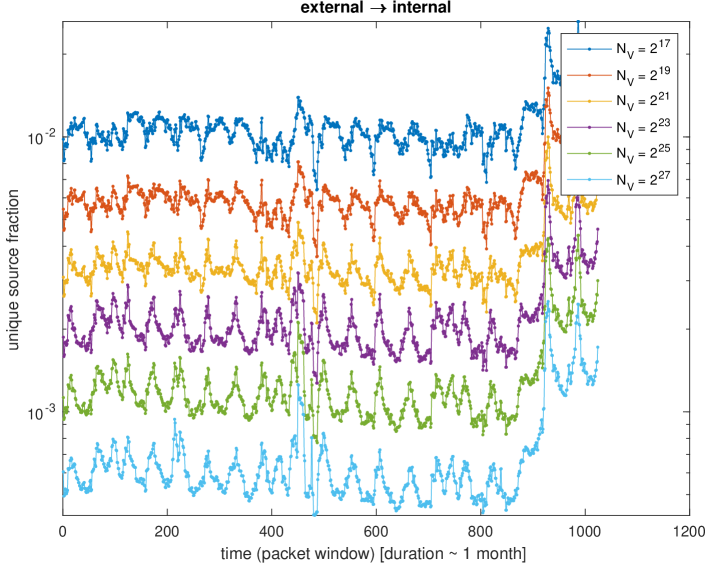
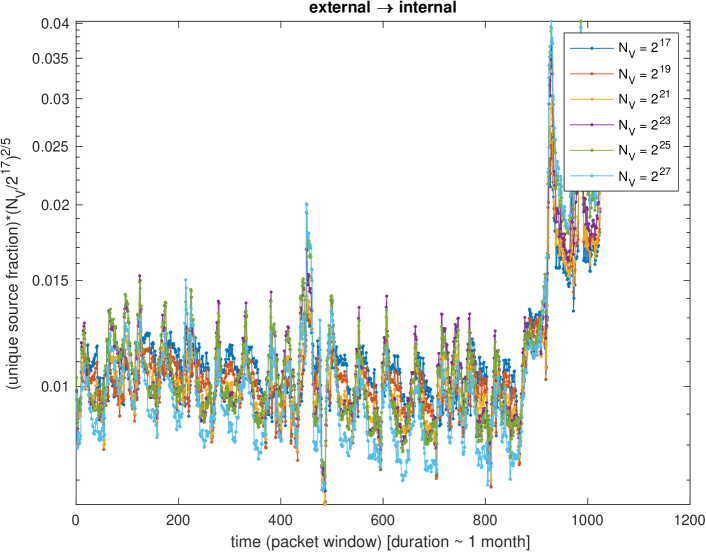
Several trillion packet headers have been collected at a gateway over several years. This work focuses on analyzing one month of anonymized source-destination pairs derived from approximately 100,000,000,000 packet headers. The contiguous nature of these data allows the exploration of a wide range of packet windows from (seconds) to (hours), providing a unique view into how network quantities depend upon time. Figure 5 (top) shows the average total number of unique sources in a packet window of width measured at each time over a month normalized by . Figure 5 (bottom) is the result of scaling the data by to align the different packet windows, indicating that the number of uniques sources is proportional to . Performing a similar analysis across many network quantities produced the scaling relations shown in Table II. These results reveal a strong dependence on these quantities as function of the packet window size . To our knowledge, these scaling relations have not been previously reported and represent a new view on the background behavior of network traffic.
V Simple Topology Analysis
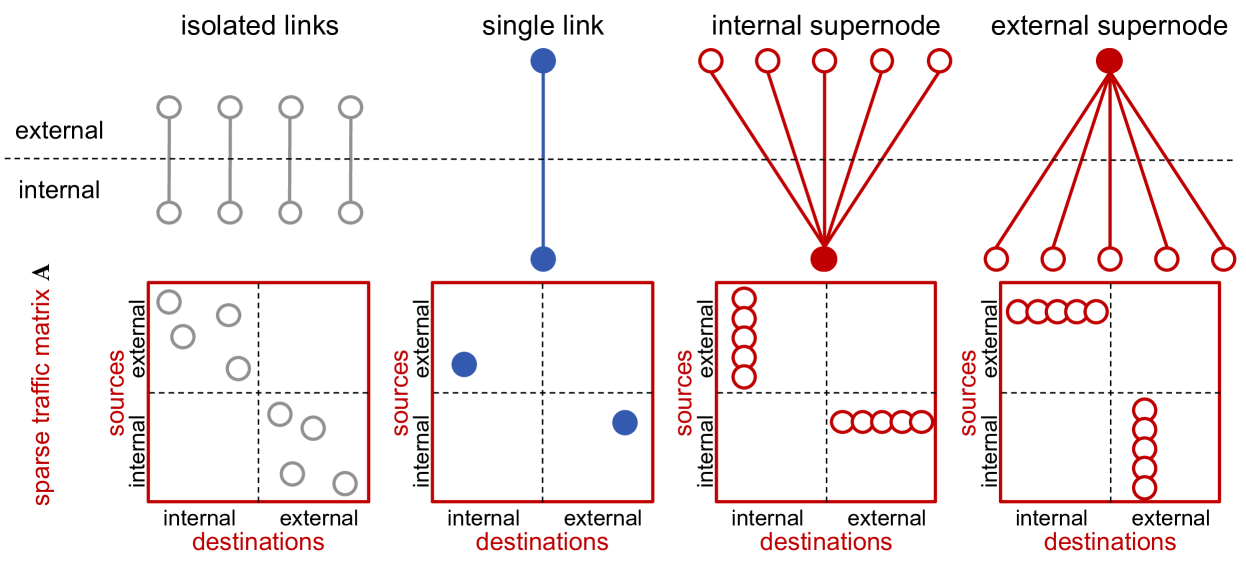
Power-law network data are a result of complex network topologies that are an ongoing area of investigation [48, 49]. Bounds on the underlying network topologies can be derived by analyzing several simple topologies. Figure 6 shows a schematic of networks and gateway traffic matrices for four simple topologies whose scaling behavior can be readily computed. Isolated links are source-destination pairs that have only one packet. Single link implies all traffic flows between one internal and one external node. An internal supernode has all traffic occurring between a single internal node and many external nodes. An external supernode has all traffic occurring between a single external node and many internal nodes. The resulting scaling relationships are shown in Table III. In all cases the simple traffic topologies produce relationships that scale as (constant) or (linear). The observed relationships in Table II are between these two extremes consistent with observed power-law topologies. In particular, the observed maximum link, source, and destination packets are consistent with the single link model, suggesting that a fraction of the traffic is on a single link perhaps combining an internal supernode and an external supernode.
VI Conclusions and Future Work
We have developed an efficient method for computing a wide variety of streaming network quantities on diverse time scales. Applying these methods to 100,000,000,000 anonymized source-destination pairs collected at a network gateway reveals many previously unobserved scaling relationships as a function of the packet window . These observations provide new insights into normal network background traffic. While the details of these scaling relationships are likely to be specific to the gateway, the number and variety of relationships suggests that scaling relationships could be observed at other network vantage points. The observed relationships provide simple, low-dimensional models of the network traffic that could be used for anomaly detection. These relationships can also assist with feature engineering for the development of AI based traffic categorization. Deeper theoretical models can also be constrained and tested, and the observed relationships can provide a useful target for theoreticians. Future work will expand this analysis to the full several trillion packet data set and other data sets collected at different vantage points, apply these results to anomaly detection problems, and test theoretical models of dynamic streaming networks.
Acknowledgments
The authors wish to acknowledge the following individuals for their contributions and support: Bob Bond, K Claffy, Cary Conrad, David Clark, Alan Edelman, Jeff Gottschalk, Tim Kraska, Charles Leiserson, Dave Martinez, Mimi McClure, Steve Rejto, Marc Zissman.
For balanced traffic with equal numbers of packets flowing in each direction, the simple traffic topologies produce relationships that scale as (constant) or (linear).
![[Uncaptioned image]](/html/2008.00307/assets/x9.png)
References
- [1] “Cisco Visual Networking Index: Forecast and Trends, 2018–2023.” https://www.cisco.com/c/en/us/solutions/collateral/executive-perspectives/annual-internet-report/white-paper-c11-741490.html.
- [2] V. Bush, “Science The Endless Frontier.” Report to the President of the United States, 1945.
- [3] K. Claffy, “Internet tomography,” Nature, Web Matter, 1999.
- [4] R. Prasad, C. Dovrolis, M. Murray, and K. Claffy, “Bandwidth estimation: metrics, measurement techniques, and tools,” IEEE network, vol. 17, no. 6, pp. 27–35, 2003.
- [5] H. Kim, K. C. Claffy, M. Fomenkov, D. Barman, M. Faloutsos, and K. Lee, “Internet traffic classification demystified: myths, caveats, and the best practices,” in Proceedings of the 2008 ACM CoNEXT conference, p. 11, ACM, 2008.
- [6] M. Boguna, D. Krioukov, and K. C. Claffy, “Navigability of complex networks,” Nature Physics, vol. 5, no. 1, p. 74, 2009.
- [7] K. Claffy, “Measuring the internet,” IEEE Internet Computing, vol. 4, no. 1, pp. 73–75, 2000.
- [8] B. Li, J. Springer, G. Bebis, and M. H. Gunes, “A survey of network flow applications,” Journal of Network and Computer Applications, vol. 36, no. 2, pp. 567–581, 2013.
- [9] M. Rabinovich and M. Allman, “Measuring the internet,” IEEE Internet Computing, vol. 20, no. 4, pp. 6–8, 2016.
- [10] k. claffy and D. Clark, “Workshop on internet economics (wie 2019) report,” SIGCOMM Comput. Commun. Rev., vol. 50, p. 53–59, May 2020.
- [11] D. Huang, A. Chowdhary, and S. Pisharody, Software-Defined networking and security: from theory to practice. CRC Press, 2018.
- [12] A. Lumsdaine, D. Gregor, B. Hendrickson, and J. Berry, “Challenges in parallel graph processing,” Parallel Processing Letters, vol. 17, no. 01, pp. 5–20, 2007.
- [13] T. G. Kolda and B. W. Bader, “Tensor decompositions and applications,” SIAM review, vol. 51, no. 3, pp. 455–500, 2009.
- [14] M. Hilbert and P. López, “The world’s technological capacity to store, communicate, and compute information,” Science, p. 1200970, 2011.
- [15] J. Kepner, Parallel MATLAB for Multicore and Multinode Computers. SIAM, 2009.
- [16] J. Kepner and J. Gilbert, Graph algorithms in the language of linear algebra. SIAM, 2011.
- [17] J. Kepner and H. Jananthan, Mathematics of big data: Spreadsheets, databases, matrices, and graphs. MIT Press, 2018.
- [18] A. Reuther, J. Kepner, C. Byun, S. Samsi, W. Arcand, D. Bestor, B. Bergeron, V. Gadepally, M. Houle, M. Hubbell, M. Jones, A. Klein, L. Milechin, J. Mullen, A. Prout, A. Rosa, C. Yee, and P. Michaleas, “Interactive supercomputing on 40,000 cores for machine learning and data analysis,” in 2018 IEEE High Performance extreme Computing Conference (HPEC), pp. 1–6, 2018.
- [19] V. Gadepally, J. Kepner, L. Milechin, W. Arcand, D. Bestor, B. Bergeron, C. Byun, M. Hubbell, M. Houle, M. Jones, P. Michaleas, J. Mullen, A. Prout, A. Rosa, C. Yee, S. Samsi, and A. Reuther, “Hyperscaling internet graph analysis with d4m on the mit supercloud,” in 2018 IEEE High Performance extreme Computing Conference (HPEC), pp. 1–6, Sep. 2018.
- [20] J. Kepner, V. Gadepally, L. Milechin, S. Samsi, W. Arcand, D. Bestor, W. Bergeron, C. Byun, M. Hubbell, M. Houle, M. Jones, A. Klein, P. Michaleas, J. Mullen, A. Prout, A. Rosa, C. Yee, and A. Reuther, “Streaming 1.9 billion hypersparse network updates per second with d4m,” in 2019 IEEE High Performance Extreme Computing Conference (HPEC), pp. 1–6, 2019.
- [21] K. Cho, K. Mitsuya, and A. Kato, “Traffic data repository at the wide project,” in Proceedings of USENIX 2000 Annual Technical Conference: FREENIX Track, pp. 263–270, 2000.
- [22] P. Borgnat, G. Dewaele, K. Fukuda, P. Abry, and K. Cho, “Seven years and one day: Sketching the evolution of internet traffic,” in INFOCOM 2009, IEEE, pp. 711–719, IEEE, 2009.
- [23] A. Dainotti, A. Pescape, and K. C. Claffy, “Issues and future directions in traffic classification,” IEEE network, vol. 26, no. 1, 2012.
- [24] Y. Himura, K. Fukuda, K. Cho, P. Borgnat, P. Abry, and H. Esaki, “Synoptic graphlet: Bridging the gap between supervised and unsupervised profiling of host-level network traffic,” IEEE/ACM Transactions on Networking, vol. 21, no. 4, pp. 1284–1297, 2013.
- [25] R. Fontugne, P. Abry, K. Fukuda, D. Veitch, K. Cho, P. Borgnat, and H. Wendt, “Scaling in internet traffic: a 14 year and 3 day longitudinal study, with multiscale analyses and random projections,” IEEE/ACM Transactions on Networking (TON), vol. 25, no. 4, pp. 2152–2165, 2017.
- [26] A. Dhamdhere, D. D. Clark, A. Gamero-Garrido, M. Luckie, R. K. Mok, G. Akiwate, K. Gogia, V. Bajpai, A. C. Snoeren, and K. Claffy, “Inferring persistent interdomain congestion,” in Proceedings of the 2018 Conference of the ACM Special Interest Group on Data Communication, pp. 1–15, ACM, 2018.
- [27] J. Kepner, P. Aaltonen, D. Bader, A. Buluç, F. Franchetti, J. Gilbert, D. Hutchison, M. Kumar, A. Lumsdaine, H. Meyerhenke, S. McMillan, C. Yang, J. D. Owens, M. Zalewski, T. Mattson, and J. Moreira, “Mathematical foundations of the graphblas,” in 2016 IEEE High Performance Extreme Computing Conference (HPEC), pp. 1–9, 2016.
- [28] A. Buluc, T. Mattson, S. McMillan, J. Moreira, and C. Yang, “Design of the graphblas api for c,” in 2017 IEEE International Parallel and Distributed Processing Symposium Workshops (IPDPSW), pp. 643–652, 2017.
- [29] T. A. Davis, “Algorithm 1000: Suitesparse:graphblas: Graph algorithms in the language of sparse linear algebra,” ACM Trans. Math. Softw., vol. 45, Dec. 2019.
- [30] J. Kepner, T. Davis, C. Byun, W. Arcand, D. Bestor, W. Bergeron, V. Gadepally, M. Hubbell, M. Houle, M. Jones, A. Klein, P. Michaleas, L. Milechin, J. Mullen, A. Prout, A. Rosa, S. Samsi, C. Yee, and A. Reuther, “75,000,000,000 streaming inserts/second using hierarchical hypersparse graphblas matrices,” IPDPSW GrAPL, 2020.
- [31] A. J. Elmore, J. Duggan, M. Stonebraker, M. Balazinska, U. Cetintemel, V. Gadepally, J. Heer, B. Howe, J. Kepner, T. Kraska, et al., “A demonstration of the bigdawg polystore system,” Proceedings of the VLDB Endowment, vol. 8, no. 12, p. 1908, 2015.
- [32] T. Kraska, A. Beutel, E. H. Chi, J. Dean, and N. Polyzotis, “The case for learned index structures,” in Proceedings of the 2018 International Conference on Management of Data, SIGMOD 18, (New York, NY, USA), p. 489â504, Association for Computing Machinery, 2018.
- [33] E. H. Do and V. N. Gadepally, “Classifying anomalies for network security,” in ICASSP 2020 - 2020 IEEE International Conference on Acoustics, Speech and Signal Processing (ICASSP), pp. 2907–2911, 2020.
- [34] A. Soule, A. Nucci, R. Cruz, E. Leonardi, and N. Taft, “How to identify and estimate the largest traffic matrix elements in a dynamic environment,” in ACM SIGMETRICS Performance Evaluation Review, vol. 32, pp. 73–84, ACM, 2004.
- [35] Y. Zhang, M. Roughan, C. Lund, and D. L. Donoho, “Estimating point-to-point and point-to-multipoint traffic matrices: an information-theoretic approach,” IEEE/ACM Transactions on Networking (TON), vol. 13, no. 5, pp. 947–960, 2005.
- [36] P. J. Mucha, T. Richardson, K. Macon, M. A. Porter, and J.-P. Onnela, “Community structure in time-dependent, multiscale, and multiplex networks,” science, vol. 328, no. 5980, pp. 876–878, 2010.
- [37] P. Tune, M. Roughan, H. Haddadi, and O. Bonaventure, “Internet traffic matrices: A primer,” Recent Advances in Networking, vol. 1, pp. 1–56, 2013.
- [38] J. Karvanen and A. Cichocki, “Measuring sparseness of noisy signals,” in 4th International Symposium on Independent Component Analysis and Blind Signal Separation, pp. 125–130, 2003.
- [39] A. Clauset, C. R. Shalizi, and M. E. Newman, “Power-law distributions in empirical data,” SIAM review, vol. 51, no. 4, pp. 661–703, 2009.
- [40] A.-L. Barabási et al., Network science. Cambridge university press, 2016.
- [41] W. E. Leland, M. S. Taqqu, W. Willinger, and D. V. Wilson, “On the self-similar nature of ethernet traffic (extended version),” IEEE/ACM Transactions on Networking (ToN), vol. 2, no. 1, pp. 1–15, 1994.
- [42] M. Faloutsos, P. Faloutsos, and C. Faloutsos, “On power-law relationships of the internet topology,” in ACM SIGCOMM computer communication review, vol. 29-4, pp. 251–262, ACM, 1999.
- [43] R. Albert, H. Jeong, and A.-L. Barabási, “Internet: Diameter of the world-wide web,” Nature, vol. 401, no. 6749, p. 130, 1999.
- [44] A.-L. Barabási and R. Albert, “Emergence of scaling in random networks,” Science, vol. 286, no. 5439, pp. 509–512, 1999.
- [45] L. A. Adamic and B. A. Huberman, “Power-law distribution of the world wide web,” science, vol. 287, no. 5461, pp. 2115–2115, 2000.
- [46] A.-L. Barabási, “Scale-free networks: a decade and beyond,” science, vol. 325, no. 5939, pp. 412–413, 2009.
- [47] A. Mahanti, N. Carlsson, A. Mahanti, M. Arlitt, and C. Williamson, “A tale of the tails: Power-laws in internet measurements,” IEEE Network, vol. 27, no. 1, pp. 59–64, 2013.
- [48] Z. Cao, Z. He, and N. F. Johnson, “Impact on the topology of power-law networks from anisotropic and localized access to information,” Phys. Rev. E, vol. 98, p. 042307, Oct 2018.
- [49] A. D. Broido and A. Clauset, “Scale-free networks are rare,” Nature communications, vol. 10, no. 1, pp. 1–10, 2019.