1 \contribtype1 \thematicarea4 \contactegiorgi@fcaglp.unlp.edu.ar 11institutetext: Facultad de Ciencias Astronómicas y Geofísicas de La Plata, UNLP, Argentina 22institutetext: Instituto de Astrofísica de La Plata, IALP (UNLP-CONICET), Argentina 33institutetext: Instituto de Física de La Plata, IFLP (UNLP-CONICET)
Embedded clusters: upgrading visual and infrared photometric analysis with Gaia DR2 and ASteCA
Los cúmulos embebidos son grupos de estrellas que no se han separado aún de la nube original donde se han formado, por lo que es fundamental obtener las distancias precisas y las propiedades de estos grupos. Se presentan los resultados de cinco cúmulos embebidos: [DBS2003]5, [DBS2003]60, [DBS2003]98, [DBS2003]116 y [DBS2003]117. Los resultados provienen de una combinación de fotometría CCD UBVI profunda, adecuada para identificar estrellas azules débiles, e información de relevamientos infrarrojos disponibles. A su vez la fotometría fue relacionada con los datos de movimientos propios y paralajes provenientes de Gaia DR2. Cada objeto fue tratado en un espacio múltiple usando el código ASteCA, especialmente diseñado para realizar un análisis automático y proveer los parámetros fundamentales de los grupos de estrellas en caso de que se trate de un cúmulo.
Abstract
Embedded clusters are groups of stars which have not dispersed yet the residual of the parental cloud where they were born so getting precise distances and properties of these groups turns out to be an essential task. We present results for five embedded clusters: [DBS2003]5, [DBS2003]60, [DBS2003]98, [DBS2003]116 and [DBS2003]117. Results come from a combination of deep CCD UBVI photometry suitable to identify blue faint stars and infrared information from available surveys. In turn photometry was linked with proper motions and parallaxes from Gaia DR2. Each object was treated in a multi-space using ASteCA, a code especially designed to perform an automatic data analysis and aimed at providing the fundamental parameters of star groups, in case they compose a real entity.
keywords:
(Galaxy:) open cluster and associations: individual (Havlen-Moffat #1)— stars massive — stars Wolf-Rayet — stars early type1 Introduction
Embedded clusters are groups of stars which have not dispersed yet the residual of the parental cloud where they were born. Therefore, they are fully or partially obscured due to their insertion in the parental cloud where the process of star formation has recently taken place. Accordingly, an embedded cluster may host very young stars still gravitationally dominated by the presence of the molecular cloud. By themselves they are an essential category of astronomical objects whose main properties started being unveiled during the last two decades thanks to the advance in infrared detectors and new telescope design. However, molecular clouds may geometrically interpose between observers and far star groups that appear highly obscured for this reason and not because they are physically related to the molecular cloud. Therefore, getting precise distances and properties of these groups, mostly faint, highly obscured and in occasions associated to small size HII regions, are an essential but challenging task. Fortunately, the Gaia Second data release (Gaia DR2) provides us with a huge amount of information, parallax, proper motions and G-photometry, with unprecedented accuracy. By means of ASteCA, a code designed to perform an automatic data analysis, we combine this valuable information with photometric, visual and infrared data from other sources. We present results for five candidates to embedded clusters taken from Dutra et al. (2003) and Bica et al. (2003): [DBS2003]5, [DBS2003]60, [DBS2003]98, [DBS2003]116 and [DBS2003]117.
2 Data and Analysis
Data to be analysed in a multi-space come from Gaia DR2 including parallaxes, photometry (G mag and BP -RP color index) and proper motions, from the 2MASS survey (JHK mag), and also from the UBVI photometry obtained with 2.15m telescope at Complejo Astronómico El Leoncito (CASLEO), San Juan. For saving space we only show the analysis performed using Gaia data down to G21 mag, greatly deeper than the 2MASS limiting magnitude. We applied restrictions to photometric data (G error 0.01 mag, (BP - RP) error 0.2 mag) to remove from the analysis stars with the largest uncertainties. No cuts have been applied neither on parallax data nor on proper motions data.
An analysis of the structural data was performed on the five candidate clusters. The kernel density estimate (KDE) maps is obtained using the cluster’s coordinates and a bandwidth value. This process is done to check if the clusters can actually be observed as an enhancement over the surrounding field density. Depending on their values, different bandwidths help expose relevant features of the observed frame. A clear overdensity is seen in the middle of the frame in [DBS2003]5. In other cases (e.g. [DBS2003]116 and [DBS2003]117), this evidence is not so obvious. We warn the reader that an overdensity is not necessarily a star cluster.
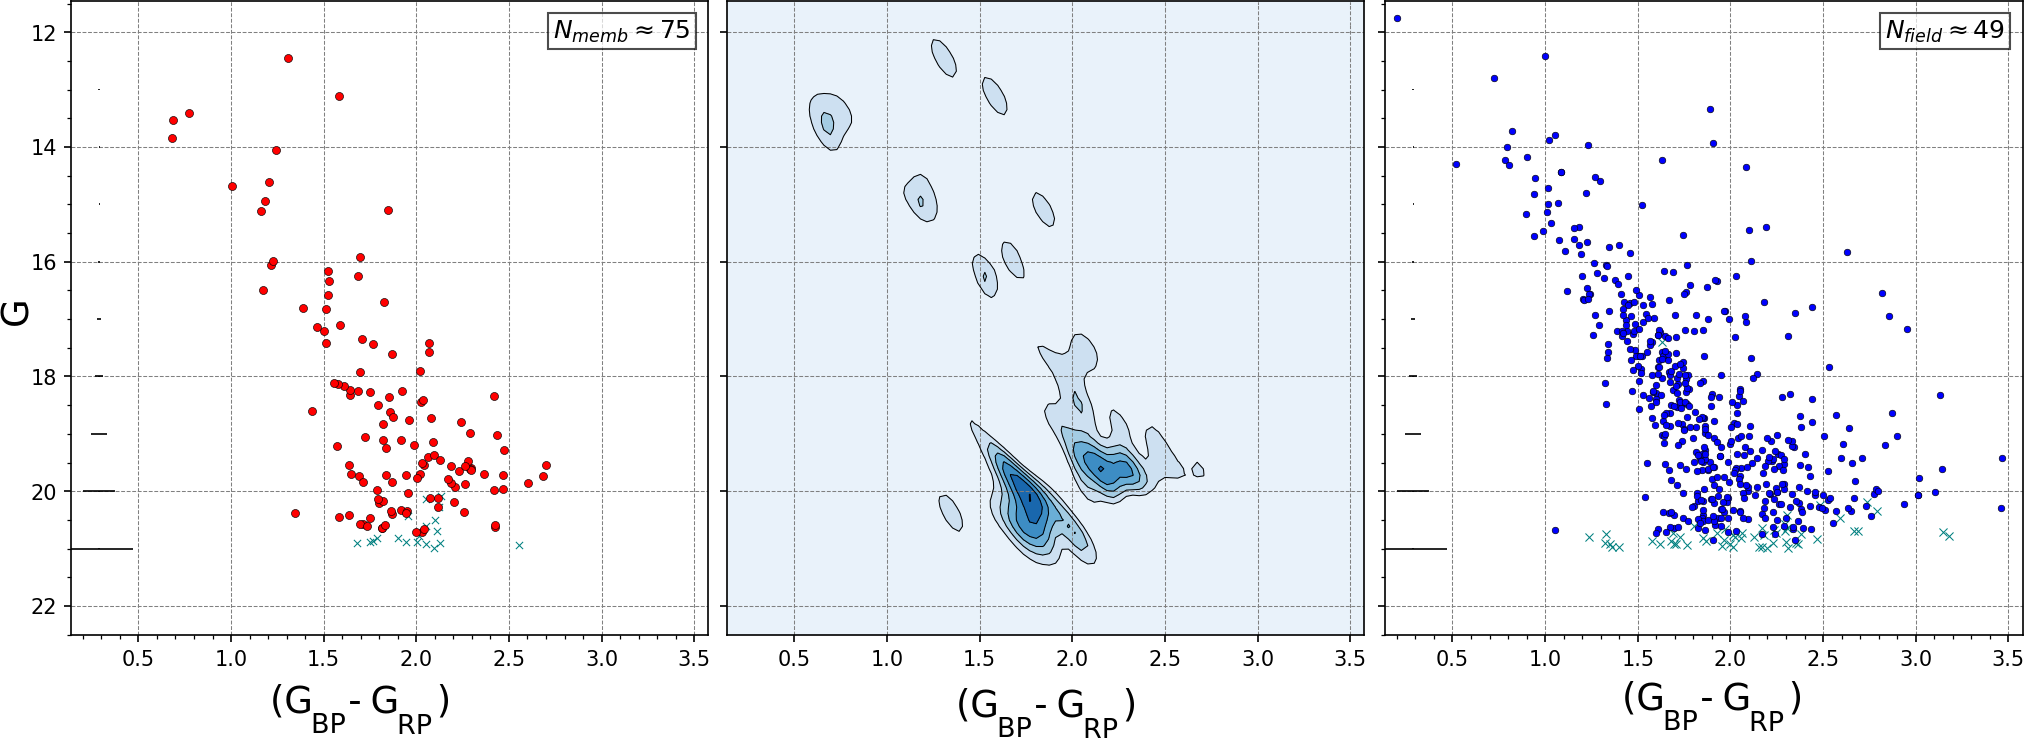
Below we show in detail the analysis performed for [DBS2003]5. However, Tables 1 and 2 summarize the results for all groups. Fig. 1 display a comparison of the color-magnitude diagram (CMD) for the cluster region (left) and the surrounding field (right). The middle plot is a KDE map showing the result of subtracting the KDE of the field region from the KDE of the cluster region. The idea is that this procedure should expose the structure of the actual cluster’s sequence (if there is any) in the CMD, by removing the contamination from field stars. No clear cluster sequence can be distinguished in the cleaned KDE map, shown in the middle plot of Fig. 1, even though the number of estimated members in this case (obtained by subtracting the field density from the cluster region density) is approximately 75 stars.
Following this we applied a membership probability (MP) assigning algorithm to the assumed cluster region (details are explained in Perren et al. (2015)). The method compares selected features of the stars within the cluster region with those in the surrounding field region. In this case, since the Gaia DR2 (BP-RP) color contains large uncertainties, parallax and proper motions were employed to estimate the MPs (membership probabilities) for all stars within the assumed cluster region. The results of this process are shown in Fig. 2.
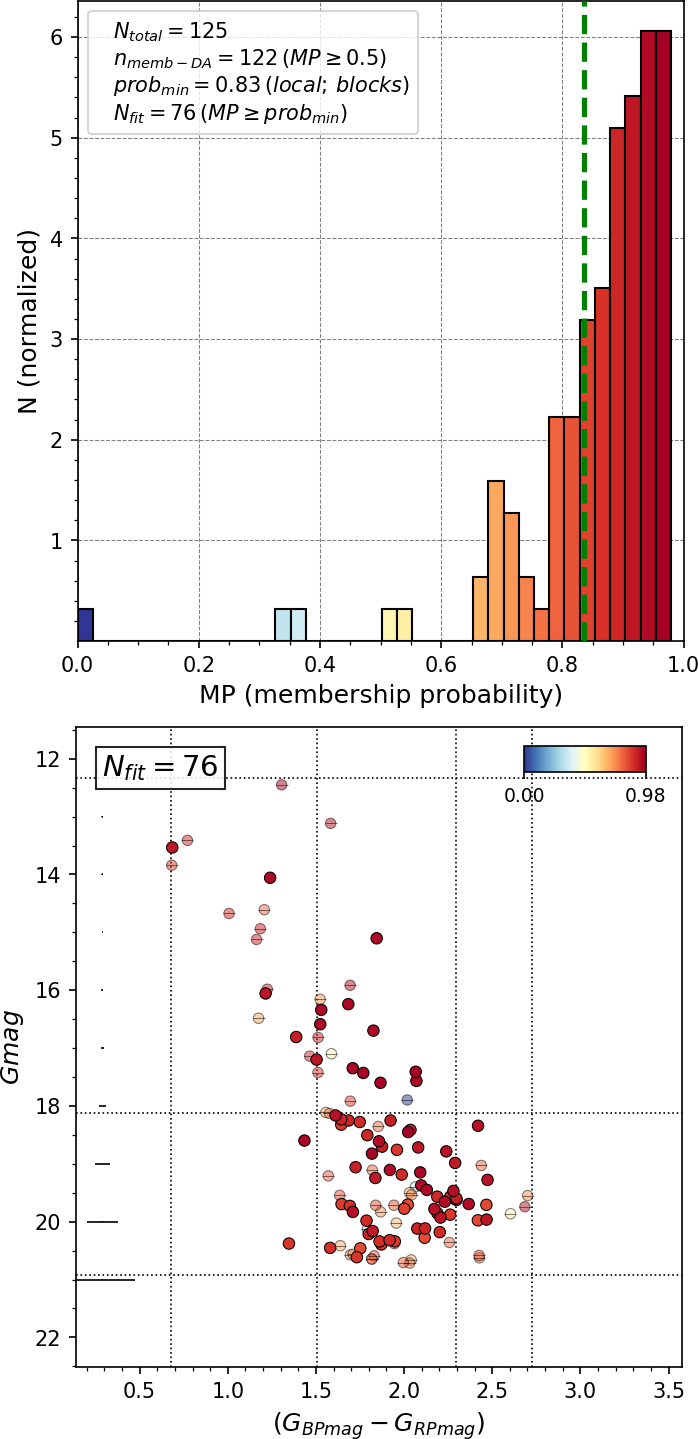
The top panel in Fig. 2 shows the distribution of probabilities assigned to all stars within the cluster region. As seen, most values are large and concentrated above MP=0.8. This usually indicates that no clear separation could be performed for true cluster members and field interlopers in the respective parallax and proper motion spaces. The middle plot in Fig. 2 is a positional chart of those stars within the cluster region colored according to these MPs (stars outside the estimated radius are not assigned any probability and hence are drawn as empty circles). Finally the plot to the right shows the cluster region’s CMD colored according to the MPs, and with enough stars removed to leave roughly the number of members estimated previously. Out of the total 125 stars in the region, 76 are thus kept as the most probable members in [DBS2003]5. Again, we see no clear cluster sequence in this cleaned CMD.
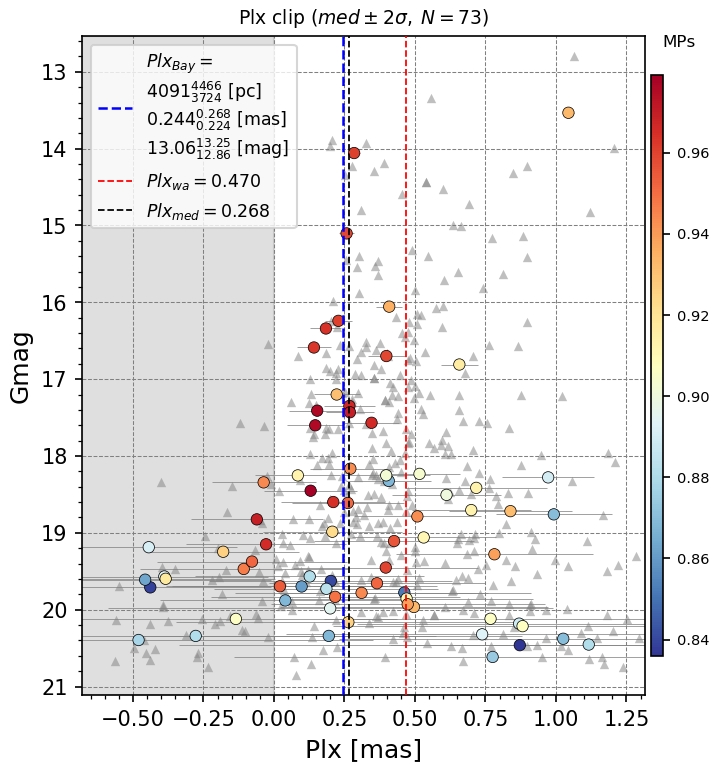
Finally, parallax and proper motions are processed and analyzed to estimate the cluster’s distance and mean proper motion. Parallax values were shifted by a +0.029 mas offset, as suggested in Lindegren et al. (2018) and processed with the Bayesian method described by Bailer-Jones111 https://github.com/agabrown/astrometry-inference-tutorials. This results in an independent estimate of the distance to each cluster based on the individual parallaxes and their uncertainties. The per-cluster final distances are estimated along with their standard deviations, and shown in Table 1.
The plot in Fig. 3 is the result of the Bayesian analysis performed on the [DBS2003]5 cluster. This analysis appears to point to a mean concentration around 4 0.4 kpc, which is where the supposed cluster would be located.
| Name | D | ||
|---|---|---|---|
| [kpc] | [mas/yr] | [mas/yr] | |
| 4.10.4 | -1.696 | 2.098 | |
| 5.70.4 | -2.363 | 1.697 | |
| 3.10.3 | -0.983 | -2.921 | |
| 9.31.0 | -1.562 | -4.352 | |
| 1.60.2 | -0.324 | -1.096 |
| Name | D | ||
|---|---|---|---|
| [kpc] | [mas/yr] | [mas/yr] | |
| 4.00.5 | -1.751 | 2.404 | |
| 5.60.5 | -2.357 | 1.681 | |
| 2.70.2 | -1.719 | -3.666 | |
| 10.61.0 | -1.493 | -4.322 | |
| 1.80.3 | -0.121 | -0.829 |
3 Results
The analysis methodology described here was applied to the five embedded clusters indicated above. For the sake of saving space the results for all of them are summarized in Table 1 for Gaia DR2 data and in Table 2 for the 2MASS JHK filters. The results are slightly different for the distances and proper motions of the clusters, but within the associated uncertainties as indicated in the tables. To validate our analysis and by way of example, [DBS2003]5 is also recognized as the S305 HII region for which Sreenilayam et al. (2014) reported a distance d = 5.2 1.4 kpc not far from the values shown in the tables. Anyway, the results do not demonstrate the existence of real clusters but rather the presence of small number of hot stars in very early stages of evolution at a similar distance exciting the surrounding material. Given this fact, ASteCA has not found any synthetic cluster able to mimic the star distribution seen in every case.
Based on data acquired at Complejo Astronómico El Leoncito, operated under agreement between the Consejo Nacional de Investigaciones Científicas y Técnicas de la República Argentina and the National Universities of La Plata, Córdoba and San Juan.
References
- Bica et al. (2003) Bica E., et al., 2003, A&A, 404, 223
- Dutra et al. (2003) Dutra C.M., et al., 2003, A&A, 400, 533
- Lindegren et al. (2018) Lindegren L., et al., 2018, A&A, 616, A2
- Perren et al. (2015) Perren G.I., Vázquez R.A., Piatti A.E., 2015, A&A, 576, A6
- Sreenilayam et al. (2014) Sreenilayam G., et al., 2014, AJ, 147, 53