Collective 2p-2h intruder states in 118Sn studied via -decay of 118In using GRIFFIN
Abstract
The low-lying structure of semi-magic 118Sn has been investigated through the -decay of 118In ( min) to study shape coexistence via the reduced transition probabilities of states in the 2p-2h proton intruder band. This high-statistics study was carried out at TRIUMF-ISAC with the GRIFFIN spectrometer. In total, 99 transitions have been placed in the level scheme with 43 being newly observed. Three low-lying -ray transitions with energies near 285 keV have been resolved from which the 2 284.52-keV transition was determined to have half of the previous branching fraction leading to a of 21(4) W.u. compared to 39(7) W.u. from the previous measurement. Calculations using IBM-2 with mixing have also been made to compare the experimental values to the theoretical values and to make comparisons to the 114,116Sn isotopes previously studied using the same theoretical model.
I Introduction
The semi-magic isotopes of Sn continue to be of great interest. They are benchmark nuclei for state-of-the-art shell-model calculations and offer a strong foundation to our understanding of shape evolution in the region (see, e.g., Ref. Togashi et al. (2018)). While the Sn isotopes are close to spherical in their ground state, deformed bands built on excited 0+ states are observed throughout this isotopic chain and have been interpreted as having two-particle-two-hole, 2p-2h, character Bron et al. (1979); Heyde and Wood (2011). The presence of these deformed intruder states is considered to be an important feature in the region Garrett (2016); Spieker et al. (2018); Heyde and Wood (2011) and the degree of mixing between deformed and normal states needs to be further explored Heyde and Wood (2011).
Enhanced cross sections of the excited 0+ states in even-even 108-118Sn were identified in the (3He,) experiments by Fielding et al. Fielding et al. (1978), and it was later suggested that the observed 0 state in even-even 112-118Sn is the bandhead of an intruding rotational band due to 2p-2h proton excitations across the shell gap by Brön et al. Bron et al. (1979). In a recent decay study of 116In to 116Sn, a newly obtained (2; ) value suggested the 0 state as the 2p-2h bandhead instead of the 0 Pore et al. (2017). Furthermore, IBM-2 with mixing calculations were made to test the mixing between the intruder and normal configurations in 116Sn Petrache et al. (2019) and 114Sn Spieker et al. (2018). In both cases the conclusion was that the 0 is the intruding bandhead but is strongly mixed with the 0 state.
Although the intruder band lies at lower excitation energy in 118Sn—the 2 state is 14 keV below the 0 level—obtaining accurate (2) values can indicate the degree of collectivity of the intruder band and the amount of mixing between deformed and normal states Bohr and Mottelson (1998).
Many studies have been performed on 118Sn providing a comprehensive level scheme which includes the 2p-2h intruder band built on the excited 0 state at 1758 keV Kitao (1995). Two studies, -decay of 118In Raman et al. (1988) and Mikhailov and Demidov (1989), contributed most of the low-lying observables to the 118Sn level scheme. One notable discrepancy between these studies, which needs clarification, is related to the for 285.3 keV and the for 284.6 keV Mikhailov and Demidov (1989); Raman et al. (1988). In each of these experiments, both the 2 intruder state and the 2 state were populated. However, in the () study, only the 284.6-keV transition was observed Mikhailov and Demidov (1989), while the 118In -decay study only observed the 285.3-keV transition Raman et al. (1988). It is likely that the intensities of these transitions have been grouped together in the ENSDF Kitao (1995) and as a result, the adopted (2; 2) of 39(7) W.u. is too large. Since the characterization of the collectivity in the normal and intruder configurations is important, the present work sought to resolve this issue in 118Sn.
A high-statistics experiment to investigate the decay properties of the proton 2p-2h band in 118Sn using the -decay of 118In and the high-resolution GRIFFIN spectrometer located at TRIUMF-ISAC Garnsworthy (2019) has been performed. New results, which include updated values, and a discussion of the new observations are presented. Furthermore, IBM-2 calculations with mixing have been performed to further elucidate the character of the states of interest.
II Experiment
Measurements of the -decay of 118In were performed at the TRIUMF Isotope Separator and ACcelerator (ISAC) facility which houses the Gamma Ray Infrastructure For Fundamental Investigations of Nuclei (GRIFFIN) Garnsworthy (2019). GRIFFIN is a high-efficiency -ray spectrometer consisting of 16 high-purity germanium (HPGe) clover detectors Rizwan et al. (2016) which was coupled to the ancillary SCintillating Electron Positron Tagging ARray (SCEPTAR), comprised of 20 plastic scintillators for tagging -particles Garnsworthy (2019) and was fixed within a 20mm Delrin shield. The detector signals were read out and processed by the GRIFFIN data acquisition system Garnsworthy et al. (2017).
A radioactive beam of 118In was mass separated from the reaction products of a 9.8 µA, 480 MeV proton beam impinged onto a UCx target. A high-purity beam was obtained using the Ion-Guide Laser Ion Source (IG-LIS) to suppress isobaric contaminants. The beam was transported and implanted into Mylar tape at the center of the GRIFFIN chamber. The isotope 118In decays via the ground state with = 5 s Kantele and Karras (1964), a isomeric state with = 4.45 min do Amaral et al. (1969) and an isomeric state with = 8.5 s Hattula et al. (1969). The tape was cycled after five minutes of implant and five minutes of decay to obtain statistics which favored observation of the 5+ isomeric state, which populates the states of interest in 118Sn. Analysis was performed on data after 25 s of decay, reducing the contributions from the 1+ and 8- by five and three halflives, respectively. Furthermore, nearly 99 % of the 8- state decays internally to the 5+ state through a 138.5 keV ray, and 95 % of the 1+ state -decays to the 0+ ground state in 118Sn. The tape was moved out of the chamber and into a lead box after each decay cycle to start a new implant cycle. The total run time was approximately 80 minutes during which -singles events and - coincidence events were recorded. Since the isotope of interest was sufficiently free of isobaric contaminants and the implant rate was quite high, SCEPTAR was not used to generate - coincident spectra.
The relative efficiency of the 16 HPGe clovers in addback mode Garnsworthy (2019) was determined using standard sources of 56Co, 60Co, 133Ba and 152Eu. Addback is a technique in which coincident -ray energies between adjacent crystals in a single clover detector are summed. Compton scattered -ray events are recovered increasing the peak-to-total ratio, and ultimately increasing the total photopeak efficiency. For this analysis, the addback mode was applied to determine the peak intensities. The peak centroids and areas were obtained using maximum-likelihood fitting of a modified Gaussian with parameters for skewedness, linear or quadratic background and step sizes. Corrections to the -ray intensities due to summing were determined using a matrix of - coincidences between detector pairs separated by 180∘ as described in Ref. Garnsworthy (2019).
Energy calibrations were made using a linear fit between two strong photopeaks and then non-linearity corrections were made using many of the well known photopeaks in 118Sn. A systematic uncertainty of 0.2 keV was determined on the -ray energies based on the non-linearity residuals applied to the calibration sources. Cross-talk corrections were made using Compton events in the - coincidence matrix from the 60Co source as outlined in section 4.1.1 in Ref. Garnsworthy (2019). The uncertainty on -ray intensities is based on the uncertainty in peak areas, background estimations, relative efficiencies, and summing corrections.
For weak transitions, - coincidence matrices were used to obtain their energies and intensities. This used a method of gating on a stronger -ray transition directly below the weak -ray in the same cascade Kulp et al. (2007); Wapstra (1965). To correct for summing in gated coincidence spectra, coincidence matrices of detector pairs separated by 180∘ were constructed from energy gates corresponding to the same gates used in the - coincidence matrices. The - coincidences between any two of the 64 GRIFFIN crystals were also used to obtain - angular correlations to determine the multipole mixing ratios (see Section III.3).
To calculate the log() values, the -feeding to individual levels needs to be determined. This was done through an intensity balance of -intensity depopulating a level minus -intensity populating the same level. To obtain absolute -feeding of each level, the total ground-state feeding was used to normalize the relative -feeding.
The values for transitions with known lifetime measurements, mixing ratios (from Kitao (1995) or our measured values as described in Section III.3), or for transitions which are assumed pure , were calculated using our measured -ray branching ratios . All used in these calculations, and in the log calculations took into account internal conversion. The internal conversion coefficients were applied to -ray intensities for energies below 600 keV and the coefficients were taken from Kitao (1995) when possible, or calculated using BrIcc ANU .
III Results
III.1 Level Scheme
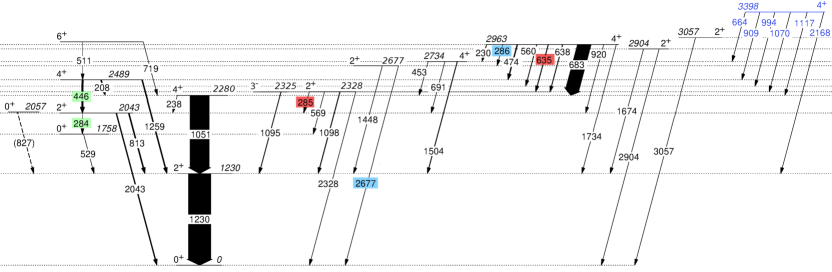
In this -decay study of the 5+ isomer of 118In, 99 rays have been assigned to 23 low-lying excited states in 118Sn. Of these transitions, 43 were newly observed, including 6 which depopulate a newly placed level at 3398 keV. Table LABEL:levels shows all rays observed in this experiment from an initial level of spin and parity J to a final level of spin and parity J, and their corresponding intensities, branching ratios, and transition strengths, and compares them to the ENSDF Kitao (1995).
Of the 51 rays placed by Raman et al. Raman et al. (1988), 49 were observed with relative intensities for most of the strong transitions in reasonably good agreement. However, there are several transitions where the -ray intensities and/or branching ratios differ by more than 2 sigma. Some of these can be easily explained from the fact we used - coincidence matrices, while Raman states they did not.
A 1265.14-keV transition from the 3753-keV level was observed by Raman in a singles spectra with an intensity of 0.138(9). We observe the 1265.14-keV transition and a newly observed 1264.34-keV transition from the 3592-keV level with intensities of 0.064(6) and 0.051(6), respectively. It is suspected that these were not resolved as two distinct transitions and the intensity placed by Raman is the sum of their intensities.
Raman identified the transition of 971.0 keV from the 3374-keV level and assigned an intensity of 0.35(6) based on an intensity balance of the 2403-keV level which the 971.0-keV transition populates. The remaining intensity of 0.32(7) was assigned to the 971.6-keV transition from the 3460-keV level. We observed more intensity feeding into the 2403-keV level, indicating that the 971.0-keV transition should have less intensity from what Raman observed. Furthermore, a third transition of 970.8 keV was resolved with an intensity of 0.110(5) from the 3704-keV level. Our summed intensity of 971.0-keV, 971.6-keV and 970.8-keV transitions is in agreement with the summed intensities Raman observed, although we determined an intensity of only 0.139(6) for the 971.0-keV transition compared to 0.35(6).
Another discrepancy is the intensity given to the 1094.10-keV transition from the 3374-keV level. We observe, from - coincidence, an intensity of 0.548(23) compared to 0.805(20). It is unclear how Raman was able to separate this from the 1094.98-keV transition depopulating the 2327-keV level without - coincidence.
One interesting difference is between our value of 42 W.u. for the 1098.2-keV transition depopulating the 2327-keV level compared to value of 20 W.u. listed in the ENSDF Kitao (1995). It is unclear how the value of 20 W.u. was established given our measured absolute for the 1098.2-keV transition is nearly the same as listed in the ENSDF Kitao (1995).
We did not observe the 756-keV and the 1116-keV transitions assigned by Raman to the decay of a new level in 118Sn at 3159 keV. However, a 1117.3-keV transition was observed and originates from a newly observed 3398-keV level as shown in Figure 1. All of the rays which depopulate this level were observed through - coincidences and a spin of was assigned to this level based on the log value of 6.72 (shown in Table 2) and on the observation of 994.18-keV, 1070.06-keV and 2168.3-keV transitions which feed into the , and levels, respectively.
New transitions of 2524.3 keV and 1711.2 keV were observed and assigned to the decay of the 3754-keV level to the 1230-keV 2 and 2043-keV 2 levels, respectively. This suggests a spin assignment of 4+ for the 3754-keV level which was previously given a J = 4, 5, or 6 with no parity Raman et al. (1988). The 4+ assignment is also reasonable given the log value of 5.874(14), as shown in Table 2, which is consistent with an allowed transition of and no change in parity.
Spin assignments of were also made for the 3816.19-keV and 3838.33-keV levels based on observed transitions to 2+ states and on the log values in Table 2. The previous assignment of , 2+, or 3+ to the 3816.19-keV level would indicate at least a second forbidden transition which is not in line with the log value obtained. Similarly, the 3838.33-keV level was previously assigned a with no definite parity. This should be a based on the log value.
A 1734-keV transition from the 2963-keV level had been observed previously by Hattula et al. Hattula et al. (1970) and do Amaral et al. do Amaral et al. (1969), but no evidence for this transition was reported by Raman et al. Raman et al. (1988). A significant amount of summing of the 683-keV transition with the 1051-keV transition gives rise to uncertainty for a 1734-keV transition which can be understood from Figure LABEL:levels. However, summing corrections were performed for the 1734-keV photopeak and its relative intensity was determined to be 0.446(13), in agreement with the earlier reports Hattula et al. (1970); do Amaral et al. (1969).
Non-zero -feeding intensity is observed to the 2+ 2904-keV and 3057-keV levels corresponding to unique second forbidden transitions (see Table 2). The log values are 10.08(6) and 10.84(22), respectively, which are lower than expected. Higher than expected intensity is likely due to unobserved transitions. For instance, it is possible that there is a 59.5-keV transition connecting the 4+ 2963-keV level to the 2904-keV level. However, this transition, if present, was not observed due to the low efficiency for ray detection at this energy and the high probability for internal conversion.
| (ps) | |||||||||
|---|---|---|---|---|---|---|---|---|---|
| Ref. Kitao (1995) | Ref. Raman et al. (1988) | Ref. Kitao (1995) | Kitao (1995) | ||||||
| 1229.50(10) | 0.49(2) | 1229.57(20) | 100 | 100 | 12.1(5) | 100 | 100 | 12.1(5) | |
| 1758.24(14) | 21(3) | 528.70(20) | 0.129(4) | 100 | 19(3) | 100 | 19(3) | ||
| 2042.62(10) | 2.9(4) | 284.52(20) | 0.051(7) | 1.31(17) | 21(4) | 2.5(2) | 39(7) | ||
| 813.11(21) | 3.91(9) | 100.0(23) | 7.2(10) | 3.88(12) | 100.0(24) | 6.9(1) | |||
| 2042.70(22) | 3.27(10) | 83.6(26) | 0.072(10) | 3.63(8) | 92.2(25) | 0.075(11) | |||
| 2280.21(11) | 0.76(13) | 237.80(22) | 0.050(4) | 0.058(5) | 16(3) | 0.04(2) | 0.05(2) | 14(7) | |
| 1050.54(20) | 85(2) | 100.0(26) | 17(3) | 84.4(26) | 100(3) | 17(3) | |||
| 2324.29(21) | 0.19 | 1094.98(63) | 1.46(7) | 100(5) | 1.5(5) | 100(4) | |||
| 2323.9(3) | 0.0148(13) | 1.02(9) | 1.1(1) | ||||||
| 2327.73(12) | 0.2 | 285.26(22) | 0.038(14) | 2.3(8) | 0.081(10) | 5.1(6) | |||
| 569.39(20) | 0.041(2) | 2.40(14) | 26 | ||||||
| 1098.2(6) | 1.70(7) | 100(4) | 42 | 1.6(3) | 100(19) | 20 | |||
| 2327.7(6) | 0.326(13) | 19.1(8) | 0.19 | 0.374(12) | 23.4(8) | ||||
| 2403.05(11) | 0.18 | 360.67(22) | 0.0121(18) | 0.91(13) | 1.8(2) | ||||
| 644.73(20) | 0.0190(8) | 1.44(6) | 12(5) | ||||||
| 1173.44(22) | 1.32(3) | 100.0(26) | 17(7) | 1.43(5) | 100(3) | 22(10) | |||
| 2403.05(22) | 0.0029(3) | 0.222(20) | 0.0025(11) | ||||||
| 2488.59(11) | 0.55 | 208.46(21) | 3.96(8) | 60.3(12) | 2.71(8) | 52(7) | |||
| 445.90(21) | 6.56(14) | 100.0(22) | 5.76(17) | 100(3) | |||||
| 1259.11(22) | 3.87(10) | 59.2(16) | 2.5 | 3.99(12) | 67(3) | 2.8 | |||
| 2677.10(11) | 0.28 | 1447.51(21) | 0.035(3) | 87(6) | 3.9 | 0.047(5) | 86(4) | 3.7 | |
| 2677.18(20) | 0.0405(25) | 100(6) | 0.25 | 0.039(5) | 100(4) | 0.23 | |||
| 2733.53(11) | 0.5 | 452.7(3) | 0.098(11) | 6.2(7) | 100 | ||||
| 690.89(21) | 0.0199(18) | 1.26(12) | 2.5 | ||||||
| 1504.0(3) | 1.58(4) | 100(3) | 4.0 | 1.65(5) | 100 | 4(6) | |||
| 2878.4(3) | 598.2(3) | 0.067(6) | 100 | 0.069(11) | 100(3) | ||||
| 2903.53(12) | 0.077 | 1673.76(28) | 0.0216(17) | 67(7) | 0.9(3) | 37(2) | 2.2(6) | ||
| 2903.46(21) | 0.0324(24) | 100(7) | 0.7(2) | 0.028(9)b | 100(4) | 0.8(2) | |||
| 2963.04(12) | 229.6(4) | 1.06(5) | 1.80(8) | 0.783(24) | 1.38(4) | ||||
| 286.02(20) | 0.0371(17) | 0.063(3) | |||||||
| 474.5(3) | 3.10(7) | 5.26(16) | 3.00(10) | 5.30(18) | |||||
| 560.04(20) | 1.161(26) | 1.97(4) | 0.99(4) | 1.75(7) | |||||
| 635.2(3) | 1.73(4) | 2.94(7) | 1.77(6) | 3.13(11) | |||||
| 638.4(3) | 1.60(4) | 2.72(6) | 1.37(4) | 2.42(7) | |||||
| 682.94(20) | 59.0(13) | 100.0(23) | 56.6(17) | 100(3) | |||||
| 920.4(3) | 0.476(12) | 0.807(20) | 0.506(21) | 0.89(4) | |||||
| 1733.56(22) | 0.446(13) | 0.76(5) | |||||||
| 2999.12(18) | 510.88(21) | 0.094(8) | 100(8) | 0.13(2) | 100(17) | ||||
| 718.57(21) | 0.090(7) | 96(7) | 0.076(13) | 60(3) | |||||
| 3056.88(14) | 3056.90(22) | 0.0108(11) | 100 | 0.5(2) | 100(4) | 0.5(2) | |||
| 3374.10(11) | 411.16(22) | 0.045(5) | 8.2(9) | 0.037(7) | 4.6(9) | ||||
| 470.66(22) | 0.00084(6) | 0.154(10) | |||||||
| 640.50(21) | 0.0222(11) | 4.05(20) | |||||||
| 696.87(22) | 0.0067(12) | 1.23(23) | |||||||
| 885.43(20) | 0.259(7) | 47.3(12) | 0.264(20) | 33(3) | |||||
| 971.0(3) | 0.139(6) | 25.4(10) | 0.35(6) | 44(8) | |||||
| 1046.31(21) | 0.070(7) | 12.8(13) | |||||||
| 1094.10(20) | 0.548(23) | 100(4) | 0.805(20) | 100(3) | |||||
| 1331.3(3) | 0.0127(18) | 2.3(3) | |||||||
| 2144.64(21) | 0.108(11) | 19.7(20) | 0.121(5) | 15.0(6) | |||||
| 3397.46(13) | 663.92(20) | 0.0338(16) | 43.0(20) | ||||||
| 908.72(20) | 0.079(4) | 100(5) | |||||||
| 994.18(22) | 0.0166(11) | 21.1(14) | |||||||
| 1070.06(23) | 0.035(3) | 45(4) | |||||||
| 1117.3(3) | 0.043(4) | 54(5) | |||||||
| 2168.3(4) | 0.008(3) | 10(4) | |||||||
| 3460.21(11) | 403.41(22) | 0.0047(4) | 1.20(10) | ||||||
| 556.54(21) | 0.0064(4) | 1.64(11) | |||||||
| 726.62(21) | 0.019(1) | 4.93(27) | |||||||
| 783.10(22) | 0.024(4) | 6.0(11) | |||||||
| 971.6(6) | 0.39(3) | 100(8) | 0.32(7) | 96(21) | |||||
| 1057.15(22) | 0.0148(10) | 3.79(26) | |||||||
| 1132.42(20) | 0.090(3) | 23.1(8) | 0.099(9) | 30(3) | |||||
| 1180.21(20) | 0.159(9) | 40.7(23) | 0.163(10) | 49(3) | |||||
| 1417.57(21) | 0.0240(15) | 6.1(4) | 0.027(5) | 8(2) | |||||
| 2230.7(9) | 0.280(11) | 71.4(28) | 0.333(11) | 100(3) | |||||
| 3592.15(11) | 535.21(22) | 0.0036(3) | 1.37(11) | ||||||
| 858.52(21) | 0.108(4) | 41.2(16) | 0.117(20) | 42(7) | |||||
| 915.20(22) | 0.0034(6) | 1.30(26) | |||||||
| 1103.37(21) | 0.083(7) | 31.5(27) | |||||||
| 1189.25(22) | 0.0140(8) | 5.31(29) | |||||||
| 1264.34(20) | 0.051(6) | 19.4(24) | |||||||
| 1312.1(6) | 0.181(6) | 68.7(23) | 0.187(9) | 67(3) | |||||
| 1549.52(20) | 0.264(8) | 100.0(29) | 0.281(12) | 100(4) | |||||
| 2362.79(21) | 0.064(3) | 24.1(12) | 0.068(4) | 24(1) | |||||
| 3704.34(11) | 800.76(20) | 0.0168(9) | 12.3(7) | ||||||
| 970.80(21) | 0.110(5) | 81(3) | |||||||
| 1027.16(22) | 0.0043(8) | 3.2(6) | |||||||
| 1215.71(21) | 0.030(3) | 22.4(23) | |||||||
| 1301.37(20) | 0.0411(18) | 30.3(14) | 0.056(6) | 37(4) | |||||
| 1376.65(20) | 0.0265(24) | 19.5(18) | 0.038(5) | 25(3) | |||||
| 1424.1(3) | 0.019(4) | 27(6) | 0.021(5) | 14(3) | |||||
| 1661.57(21) | 0.0292(24) | 21.5(18) | 0.041(6) | 27(4) | |||||
| 2475.06(20) | 0.136(7) | 100(5) | 0.150(7) | 100(5) | |||||
| 3753.74(14) | 1020.14(20) | 0.070(3) | 39.0(17) | ||||||
| 1265.14(20) | 0.064(6) | 36(3) | 0.138(9) | 78(5) | |||||
| 1473.55(21) | 0.179(6) | 100(3) | 0.177(8) | 100(5) | |||||
| 1711.16(22) | 0.0178(16) | 9.9(9) | |||||||
| 2524.3(3) | 0.0061(11) | 3.4(6) | |||||||
| 3816.19(15) | 912.6(3) | 0.00150(18) | 1.72(21) | ||||||
| 1082.8(3) | 0.0063(6) | 7.2(7) | |||||||
| 1327.66(22) | 0.0190(22) | 21.8(26) | |||||||
| 1536.1(4) | 0.0069(12) | 7.9(14) | |||||||
| 2586.57(21) | 0.087(5) | 100(6) | 0.096(6) | 100 | |||||
| 3838.33(16) | 934.7(3) | 0.00085(15) | 1.06(20) | ||||||
| 1104.5(3) | 0.0030(12) | 3.8(15) | |||||||
| 1350.2(4) | 0.0081(16) | 10.2(21) | |||||||
| 1558.0(3) | 0.0144(24) | 18(3) | |||||||
| 2608.96(21) | 0.080(4) | 100(5) | 0.086(6) | 100 | |||||
| aListed as (4,5,6+) in Kitao (1995) but suggested to be in Ref. Mikhailov and Demidov (1989); Guazzoni et al. (2008). A 5- assignment also fits with the log value in Table 2. | |||||||||
| bObserved by Raman et al. but not placed in level scheme. | |||||||||
| 5 | Energy | % | log | % | log |
|---|---|---|---|---|---|
| This work | Ref. Kitao (1995) | ||||
| 4+ | 2280.21 | 19.7(24) | 5.92(6) | 22(3) | 5.83(6) |
| 4+ | 2488.59 | 10.24(20) | 6.033(18) | 8.5(4) | 6.058(23) |
| 4+ | 2733.53 | 0.17(6) | 7.58(16) | 0.67(7) | 6.90(4) |
| () | 2878.4 | 0.065(6) | 7.9(5) | 0.066(11) | 7.78(8) |
| 2903.53 | 0.027(3) | 10.08(6) | - | - | |
| 4+ | 2963.04 | 66.2(8) | 4.752(8) | 62(3) | 4.712(24) |
| 6+ | 2999.12 | 0.178(10) | 7.28(4) | 0.198(24) | 7.17(6) |
| 2+ | 3056.88 | 0.0021(11) | 10.84(22) | - | - |
| 4+ | 3159.28 | - | - | 0.104(18) | 7.25(8) |
| 4+ | 3374.10 | 1.17(3) | 5.98(3) | 1.51(8) | 5.78(3) |
| 4+ | 3397.46 | 0.207(8) | 6.70(3) | - | - |
| 4+ | 3460.21 | 0.98(3) | 5.93(3) | 0.90(8) | 5.87(5) |
| 4+ | 3592.15 | 0.733(14) | 5.83(4) | 0.63(4) | 5.79(4) |
| 4+ | 3704.34 | 0.398(10) | 5.89(4) | 0.294(16) | 5.89(3) |
| 4+ | 3753.74 | 0.325(9) | 5.88(4) | 0.302(15) | 5.77(3) |
| 4+ | 3816.19 | 0.117(6) | 6.19(6) | 0.092(7) | 6.14(4) |
| 3838.33 | 0.102(5) | 6.19(5) | 0.083(7) | 6.13(5) | |
III.2 285 keV triplet
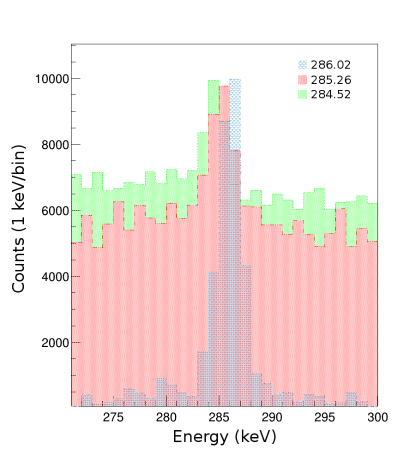
A triplet of 284.5-keV, 285.3-keV and 286.0-keV transitions was resolved using - coincidences and gating on transitions in their respective cascades as shown in Figure 1. In the study by Raman et al. Raman et al. (1988), - coincidences were not made and the 285.2 keV ray which they observed was placed to the , 2328-keV level. In another study by Mikhailov et al. Mikhailov and Demidov (1989), - coincidences were measured and a 284.66-keV transition was placed to the , 2043-keV level. They did not observe the 285.2-keV transition, despite populating the , 2328-keV level. We observed 284.5-keV and 285.3-keV rays directly in coincidence with each other making them difficult to separate. The 284.5-keV transition was determined by gating from above on 446 keV and the relative branching ratio of 284.5 keV was determined, from the same gate, to be 1.33(6) compared to the previously adopted 2.5(2) Kitao (1995). This reduces the ) from 39(7) W.u. to 21(4) W.u., indicating a less collective transition than the previous value suggests.
The Compton edge of the 446-keV full-energy peak, occuring at 284 keV, made it difficult to isolate the 285.3-keV transition when gating from below on 2043 keV and on 813 keV. A gate was instead placed from above on 635 keV to isolate the 285.3-keV transition. The small contribution from the 284.4 keV transition in coincidence with 285.3 keV was taken into account. It was assumed there was no -feeding to the and , based on the -decay selection rules, such that the relative intensities could be determined from gating from above. The relative intensity of 285.3 keV was determined to be 0.038(14), half of the previous value of 0.081(10) Raman et al. (1988).
The newly observed 286.0 keV -ray transition from the 2963.141 keV level is in a separate cascade and was far easier to decouple from the other two. A gate was placed below on the 2677.18 keV transition to isolate the 286.0 keV transition. Figure 2 shows an overlap of all three transitions and the subtle shifts of the peak centroids.
III.3 Gamma-gamma angular correlations
The geometry of GRIFFIN allows - angular correlations to be performed, using 51 correlation angles between detector pairs. The statistics for - angular correlations were not sufficient to assign spins to the levels with no definite spin assignment.
Angular correlations for cascades with sufficient statistics were made to obtain values. Table 3 summarizes the of the angular correlation fit and the which was determined through minimization. The form of the angular correlation fit is
| (1) |
where and are coefficients which depend on the -ray multipolarities and their mixing ratios, is the angle between the successive rays in a cascade, and are Legendre polynomials.
Due to the finite size of the GRIFFIN detectors, the and coefficients are attenuated and energy-dependent attenuation factors need to be applied when fitting the angular correlations with Eq. 1. Attenuation factors which have previously been determined in Method 4 of Ref. Smith et al. (2019) were applied to these coefficients. However, these attenuation factors were obtained with a setup which did not include the Delrin shield. Therefore, simulations have been performed for several energy pairs with the inclusion of the Delrin shield. It was determined that the attenuation factors differentiated by at most which is within the uncertainty of our angular correlation fits. An example of the angular correlation for the cascade is shown with the corresponding minimization in Figure 3. .
The largest discrepancy which could impact future calculations, such as values, is the mixing ratio obtained for the 683-keV transition. The newly measured value of 0.224(3) would increase the by nearly a factor of six from the previous value of 0.09(5). In addition, the sign of the of the 1098-1230-keV transition differs from the one previously reported Kitao (1995).
| Kitao (1995) | |||||
|---|---|---|---|---|---|
| 1230 | 813 | 1.39 | -2.28(7) | -2.34(16) | |
| 1098 | 0.86 | -14(4) | 56(31)111Listed as Kitao (1995) | ||
| 1173 | 1.21 | 0.85(3) | 1.07(9) | ||
| 1050 | 208 | 1.36 | -0.19(4) | -0.17(4) | |
| 683 | 1.15 | 0.224(3) | 0.09(5) |

IV IBM-2 calculations with mixing
As in previous studies on the mixing between the normal and intruder configuration in 114Sn (Spieker et al., 2018) and 116Sn Petrache et al. (2019), an IBM-2 calculation with mixing was performed using the computer code NPBOS (Otsuka and Yoshida, ). Following the adopted approach for 114,116Sn Spieker et al. (2018); Petrache et al. (2019), the intruder states in 118Sn are described using the corresponding Pd isotone, 114Pd, and the parameters determined in Ref. Kim et al. (1996). The parameter of the residual nucleon-nucleon interaction in the Hamiltonian was slightly adjusted from 0.10 Kim et al. (1996) to 0.05 to bring the intruder state closer in energy to the normal state. The IBM-2 Hamiltonian has been described in detail in Ref. Kim et al. (1996); Puddu et al. (1980) and the mixing Hamiltonian in, , Ref Délèze et al. (1993). For completeness, they are presented here.
| (2) |
where
| (3) |
is the IBM-2 quadrupole operator for protons and neutrons ,
| (4) | ||||
is the Majorana operator, and the residual nucleon-nucleon interaction is given by
| (5) | ||||
To reduce the number of parameters, Kim et al. chose and for the Pd isotopes Kim et al. (1996). For the normal states in 118Sn, we found the following parameters: MeV, MeV, MeV, MeV, MeV, and MeV. All other parameters were set to 0. This parameter choice is, in fact, similar to the one used for 114,116Sn Spieker et al. (2018); Petrache et al. (2019). The normal and intruder states were calculated separately and were then admixed using the mixing Hamiltonian with and :
| (6) |
The energy gap between the two configurations was set to 2.45 MeV, which is the same value as the one previously reported for 116Sn Petrache et al. (2019).
After mixing, transitions between the excited states were calculated using the operator following the consistent- formalism:
| (7) |
These parameters were used to obtain the results discussed in the following section: , , , , , and .
V Discussion of the results
Recent, detailed experimental studies by Garrett et al. Garrett et al. (2019) showed that, in addition to the often discussed proton 2p-2h structure, multiple structures with proton multiparticle-multihole character coexist at comparably low excitation energies in 110,112Cd (). The experimental results were supported by Beyond-Mean-Field (BMF) calculations, which predicted 2p-2h character for both deformed band structures built on the and states in 112Cd (). In the previous IBM studies Spieker et al. (2018); Petrache et al. (2019), it was assumed that the intruder band structure in 114,116Sn () was caused by proton 2p-2h excitations across the shell closure and that it should resemble the yrast structure of the 0p-4h Pd isotopes. As pointed out by Garrett et al., their results also suggest that the ground-state structure of Pd nuclei is more complex than the simple, spherical (4h) configuration Garrett et al. (2019). This cannot be accounted for in coventional IBM-2 calculations with mixing. However, as pointed out by Kim et al. Kim et al. (1996), the more neutron-rich Pd isotopes () are clearly non-vibrational nuclei and closer to the -soft, O(6), limit of the IBM. It is worth noting that the recent measurement of the lifetimes of the yrast 4+ and 6+ states in 114Pd Gamba et al. (2019) are consistent with a rigid triaxial structure.
The experimental reduced transition strengths for the yrast to the ground state in Pd (“(4h)”) and Xe (“(4p)”) as well as from the intruder to the state in Sn are compared in Fig. 4. In terms of absolute magnitude, the experimental strength is indeed more comparable to the strength in the Pd isotopes than the one in the Xe isotopes. It is likely the halflife for the yrast 2+ state in 112Pd is too long (Gamba et al., 2019); a shorter value would yield a smoother trend as observed in the Xe isotopes. The decay of the to the state has only been observed in 116Sn. From this observation, the was assigned as the bandhead of the intruder structure in 116Sn Pore et al. (2017). Previous IBM studies supported this interpretation Petrache et al. (2019) and pointed at a possibly similar scenario in 114Sn Spieker et al. (2018). The and are, however, strongly mixed. This is also why they share the transition strength in the IBM. Otherwise, the intruder state would show no collective transition strength to the state. Unlike for the and the second excited state of the normal configuration, the and selection rules do not forbid mixing between the states Jolie and Lehmann (1995); Lehmann and Jolie (1995). In 116Sn, the W.u. matches the one observed in the yrast structure of 120Xe (see Fig. 4). The experimentally observed strengths in 116Sn are, however, significantly lower than the strength predicted by the IBM and are only comparable to the yrast value in 120Xe when summed. At the same time, the summed value () would significantly exceed the expectations. As pointed out in the previous studies Petrache et al. (2019); Spieker et al. (2018), strong mixing between the two configurations is observed and much more data are needed to draw more definite conclusions. Since the transition strength is shared between mixed states (compare Fig. 5), if only part of the transition strength is observed experimentally, clear structure assignments can be challenging.

| 1230 | 1231† | 12.1(5) | 10 | |
| 1758 | 1714# | 19(3) | 16 | |
| 2043 | 2098# | 0.072(10) | 0.008 | |
| 7.2(10) | 0.13 | |||
| 21(4) | 35 | |||
| 2057 | 2099† | 10 | ||
| 11 | ||||
| 2280 | 2270† | 17(3) | 19 | |
| 16(3) | 18 | |||
| 2328 | 2256# | 0.19 | 0.00010 | |
| 42 | 16 | |||
| 26 | 0.5 | |||
| 762 | 29 | |||
| 2403 | 2728† | 0.0025(11) | 0.0002 | |
| 17(7) | 4 | |||
| 12(5) | 0.05 | |||
| 81 | 26 | |||
| 0.6 | ||||
| 2489 | 2702# | 2.5 | 1.2 | |
| 764 | 39 | |||
| 673 | 0.3 | |||
| 2733 | 2903# | 4 | 0.014 | |
| 3(3) | 0.09 | |||
| 100 | 19 | |||
| 28 | ||||
| 12 | ||||
| 3000 | 3034# | 42 | ||
| 20 |
This work adds 118Sn to the study and discusses possible mixing between the normal and intruder configurations based on a comparison of the new experimental data and IBM calculations, which were introduced above. In Sn, the intruder structure is energetically lowest in 116,118Sn (compare Petrache et al. (2019)). No microscopic calculations as for 110,112Cd are presently available. Large-scale Monte-Carlo-Shell-Model (MCSM) calculations did, however, highlight the importance of proton excitations in Sn to understand the evolution of the transition probabilities and showed that a second-order phase transition appears to take place from a moderately deformed to a spherical ground state for the more neutron-rich Sn isotopes when passing 116Sn Togashi et al. (2018). The results of the IBM-2 calculations with mixing and the comparison to the corresponding experimental data are presented in Table 4. The parameters are given in Sec. IV.
Despite a few discrepancies, whose origin was already discussed for 116Sn Petrache et al. (2019) and attributed to the selection rules of the O(5) symmetry present in the U(5) and O(6) group chains of the IBM Jolie and Lehmann (1995); Lehmann and Jolie (1995), the agreement between the IBM results and the data is good both for the energies and transition probabilities (see Table 4). In contrast to 116Sn, only one excited state is found below the state of the lowest-lying intruder structure. A significant decrease of the strength by about a factor of 2 as compared to 116Sn is also observed. To account for this experimental observation, the effective proton charge has been set to eb2 ( eb2 in 116Sn and 0.105 eb2 in 114Sn). All other parameters in the operator (compare Eq. (7)) are the same as in the studies of 114,116Sn Spieker et al. (2018); Petrache et al. (2019). It should be noted that was drastically changed in 116Sn to obtain two very collective values Petrache et al. (2019). It remains to be seen if a similar effect will be observed in 114Sn. Based on all presently available experimental data in 118Sn, a scenario, where due to mixing the would drop below the , is not favoured. With support from the IBM calculation the state is identified as the bandhead of the intruder structure in 118Sn and, in doing so, can also account for the collective (see Table 4) generated due to mixing between the normal and intruder states. Furthermore, the evolution of the excitation energy of the intruder bands in stable Sn isotopes reveals a global minimum for the lowest 2+ intruder state in 118Sn. Compared to 116Sn, lower excitation energies for the and intruder states are also observed Kitao (1995). To further characterize the intruder structure and mixing with the normal configuration in 118Sn, lifetime measurements for the , , , and states are crucial. Additionally, precise measurements of branching ratios and of multipole mixing ratios in coincidence experiments are needed. The revised and smaller branching ratio for the state of 5.8(8) is now closer to the IBM result of 2.1 but still significantly larger.
VI Conclusion
The study of the -decay of 118In to low-lying excited states in 118Sn was performed using the GRIFFIN spectrometer at the TRIUMF-ISAC facility. We were able to identify 99 -ray transitions from 23 levels, of which 43 transitions and one level are newly observed. Using GRIFFIN’s full array of 16 HPGe clover detectors allowed us to resolve three transitions near 285 keV which led to the reduction of the intensities previously assigned to 284.5 keV and 285.3 keV by half. This ultimately reduced the value from 39(7) W.u. to 21(4) W.u.. Less collectivity in the state is not entirely supported by the present calculations, although it is possible that the strength is fragmented between the and states.
The experimental results were in reasonably good agreement with the predictions of IBM-2 calculations with mixing, similar to previous comparisons for 114,116Sn. The state in 114,116Sn had previously been suggested to be the bandhead of the 2p-2h intruder band. However, this isn’t the case in 118Sn. Despite strong mixing with the state, the is still considered the bandhead and is supported by the IBM. Given the strong configuration mixing of many of the other states, it is difficult to conclusively assign structure. In future campaigns, lifetime measurements of excited states in even-even stable Sn isotopes would provide a better understanding of configuration mixing and the evolution of the structure of these nuclei.
Acknowledgments
The infrastructure of GRIFFIN has been funded through contributions from the Canada Foundation for Innovation, TRIUMF, University of Guelph, British Columbia Knowledge Development Fund and the Ontario Ministry of Research and Innovation. TRIUMF receives funding through a contribution agreement through the National Research Council Canada. This work was supported by the Natural Sciences and Engineering Research Council of Canada. Mark Spieker acknowledges support by the National Science Foundation under contract No. PHY-1565546 (NSCL).
References
- Togashi et al. (2018) T. Togashi, Y. Tsunoda, T. Otsuka, N. Shimizu, and M. Honma, Phys. Rev. Lett. 121, 062501 (2018).
- Bron et al. (1979) J. Bron, W. H. A.Hesselink, A. V. Poelgeest, J. J. A. Zalmstra, M. J. Uitzinger, H. Verheul, K. Heyde, M. Waroquier, H. Vincx, and P. V. Isacker, Nucl. Phys. A 318, 335 (1979).
- Heyde and Wood (2011) K. Heyde and J. L. Wood, Rev. Mod. Phys. 83, 1467 (2011).
- Garrett (2016) P. E. Garrett, Journal of Physics G: Nuclear and Particle Physics 43, 084002 (2016).
- Spieker et al. (2018) M. Spieker, P. Petkov, E. Litvinova, C. Müller-Gatermann, S. G. Pickstone, S. Prill, P. Scholz, and A. Zilges, Phys. Rev. C 97, 054319 (2018).
- Fielding et al. (1978) H. Fielding, R. Anderson, P. Kunz, D. Lind, C. Zafiratos, and W. Alford, Nuclear Physics A 304, 520 (1978).
- Pore et al. (2017) J. L. Pore, D. S. Cross, C. Andreoiu, R. Ashley, G. C. Ball, P. C. Bender, A. S. Chester, A. Diaz Varela, G. A. Demand, R. Dunlop, A. B. Garnsworthy, P. E. Garrett, G. Hackman, B. Hadinia, B. Jigmeddorj, A. T. Laffoley, A. Liblong, R. Kanungo, B. Noakes, C. M. Petrache, M. M. Rajabali, K. Starosta, C. E. Svensson, P. J. Voss, Z. M. Wang, J. L. Wood, and S. W. Yates, The European Physical Journal A 53, 27 (2017).
- Petrache et al. (2019) C. M. Petrache, J.-M. Régis, C. Andreoiu, M. Spieker, C. Michelagnoli, P. E. Garrett, A. Astier, E. Dupont, F. Garcia, S. Guo, G. Häfner, J. Jolie, F. Kandzia, V. Karayonchev, Y.-H. Kim, L. Knafla, U. Köster, B. F. Lv, N. Marginean, C. Mihai, P. Mutti, K. Ortner, C. Porzio, S. Prill, N. Saed-Samii, W. Urban, J. R. Vanhoy, K. Whitmore, J. Wisniewski, and S. W. Yates, Phys. Rev. C 99, 024303 (2019).
- Bohr and Mottelson (1998) A. Bohr and B. R. Mottelson, Nuclear Structure (World Scientific, Singapore, 1998).
- Kitao (1995) K. Kitao, Nuclear Data Sheets 75, 99 (1995).
- Raman et al. (1988) S. Raman, T. A. Walkiewicz, L. G. Multhauf, K. G. Tirsell, G. Bonsignori, and K. Allaart, Phys. Rev. C 37, 1203 (1988).
- Mikhailov and Demidov (1989) I. V. Mikhailov and A. M. Demidov, Bull. Acad. Sci. USSR Phys. Ser. 53 (1989).
- Garnsworthy (2019) A. Garnsworthy , Nuclear Instruments and Methods in Physics Research Section A: Accelerators, Spectrometers, Detectors and Associated Equipment 918, 9 (2019).
- Rizwan et al. (2016) U. Rizwan, A. Garnsworthy, C. Andreoiu, G. Ball, A. Chester, T. Domingo, R. Dunlop, G. Hackman, E. Rand, J. Smith, K. Starosta, C. Svensson, P. Voss, and J. Williams, Nuclear Instruments and Methods in Physics Research Section A: Accelerators, Spectrometers, Detectors and Associated Equipment 820, 126 (2016).
- Garnsworthy et al. (2017) A. Garnsworthy, C. Pearson, D. Bishop, B. Shaw, J. Smith, M. Bowry, V. Bildstein, G. Hackman, P. Garrett, Y. Linn, J.-P. Martin, W. Mills, and C. Svensson, Nuclear Instruments and Methods in Physics Research Section A: Accelerators, Spectrometers, Detectors and Associated Equipment 853, 85 (2017).
- Kantele and Karras (1964) J. Kantele and M. Karras, Phys. Rev. 135, B9 (1964).
- do Amaral et al. (1969) L. C. M. do Amaral, C. V. de Barros Leite, J. M. F. Jeronymo, and A. G. de Pinho, Z. Naturforsch. 24 a, 1196 (1969).
- Hattula et al. (1969) J. Hattula, E. Liukkonen, and J. Kantele, Nuclear Physics A 125, 477 (1969).
- Kulp et al. (2007) W. D. Kulp, J. L. Wood, J. M. Allmond, J. Eimer, D. Furse, K. S. Krane, J. Loats, P. Schmelzenbach, C. J. Stapels, R.-M. Larimer, E. B. Norman, and A. Piechaczek, Phys. Rev. C 76, 034319 (2007).
- Wapstra (1965) A. H. Wapstra, in Alpha-, Beta- and Gamma-Ray Spectroscopy, Vol. 1, edited by K. Siegbahn (North-Holland, Amsterdam, 1965) p. 539.
- (21) ANU, “BrIcc Conversion Coefficient Calculator,” http://bricc.anu.edu.au/index.php.
- Hattula et al. (1970) J. Hattula, E. Liukkonen, and J. Kantele, Z. Physik 231, 203 (1970).
- Guazzoni et al. (2008) P. Guazzoni, L. Zetta, A. Covello, A. Gargano, B. F. Bayman, T. Faestermann, G. Graw, R. Hertenberger, H.-F. Wirth, and M. Jaskola, Phys. Rev. C 78, 064608 (2008).
- (24) NNDC Brookhaven National Laboratory, “Logft calculator,” https://www.nndc.bnl.gov/logft/.
- Smith et al. (2019) J. Smith, A. MacLean, W. Ashfield, A. Chester, A. Garnsworthy, and C. Svensson, Nuclear Instruments and Methods in Physics Research Section A: Accelerators, Spectrometers, Detectors and Associated Equipment 922, 47 (2019).
- (26) T. Otsuka and N. Yoshida, Program NPBOS, JAERI-M 85 report (Japan Atomic Energy Research Institute, (1985)) .
- Kim et al. (1996) K.-H. Kim, A. Gelberg, T. Mizusaki, T. Otsuka, and P. von Brentano, Nuclear Physics A 604, 163 (1996).
- Puddu et al. (1980) G. Puddu, S. Scholten, and T. Otsuka, Nucl. Phys. A 348, 109 (1980).
- Délèze et al. (1993) M. Délèze, S. Drissi, J. Kern, P. Tercier, J. Vorlet, J. Rikovska, T. Otsuka, S. Judge, and A. Williams, Nucl. Phys. A 551, 269 (1993).
- Garrett et al. (2019) P. E. Garrett, T. R. Rodríguez, A. D. Varela, K. L. Green, J. Bangay, A. Finlay, R. A. E. Austin, G. C. Ball, D. S. Bandyopadhyay, V. Bildstein, S. Colosimo, D. S. Cross, G. A. Demand, P. Finlay, A. B. Garnsworthy, G. F. Grinyer, G. Hackman, B. Jigmeddorj, J. Jolie, W. D. Kulp, K. G. Leach, A. C. Morton, J. N. Orce, C. J. Pearson, A. A. Phillips, A. J. Radich, E. T. Rand, M. A. Schumaker, C. E. Svensson, C. Sumithrarachchi, S. Triambak, N. Warr, J. Wong, J. L. Wood, and S. W. Yates, Phys. Rev. Lett. 123, 142502 (2019).
- Gamba et al. (2019) E. R. Gamba, A. M. Bruce, S. Lalkovski, M. Rudigier, S. Bottoni, M. P. Carpenter, S. Zhu, J. T. Anderson, A. D. Ayangeakaa, T. A. Berry, I. Burrows, M. C. Gallardo, R. J. Carroll, P. Copp, D. M. Cullen, T. Daniel, G. F. Martínez, J. P. Greene, L. A. Gurgi, D. J. Hartley, R. Ilieva, S. Ilieva, F. G. Kondev, T. Kröll, G. J. Lane, T. Lauritsen, I. Lazarus, G. Lotay, C. R. Niţă, Z. Podolyák, V. Pucknell, M. Reed, P. H. Regan, J. Rohrer, J. Sethi, D. Seweryniak, C. M. Shand, J. Simpson, M. Smoleń, E. A. Stefanova, V. Vedia, and O. Yordanov, Phys. Rev. C 100, 044309 (2019).
- Jolie and Lehmann (1995) J. Jolie and H. Lehmann, Phys. Lett. B 342, 1 (1995).
- Lehmann and Jolie (1995) H. Lehmann and J. Jolie, Nucl. Phys. A 588, 623 (1995).
- Raman et al. (2001) S. Raman, C. Nestor, and P. Tikkanen, Atomic Data and Nuclear Data Tables 78, 1 (2001).
- KITAO et al. (2002) K. KITAO, Y. TENDOW, and A. HASHIZUME, Nuclear Data Sheets 96, 241 (2002).
- Tamura (2007) T. Tamura, Nuclear Data Sheets 108, 455 (2007).