Constraining the Gravitational Lensing of Quasars from their Proximity Zones
Abstract
Since their discovery twenty years ago, the observed luminosity function of quasars has been suspected to be biased by gravitational lensing. Apart from the recent discovery of UHS J0439+1634 at , no other strongly lensed quasar has been conclusively identified. The hyperluminous quasar SDSS J0100+2802, believed to host a supermassive black hole of , has recently been claimed to be lensed by a factor of , which would negate both its extreme luminosity and black hole mass. However, its Ly-transparent proximity zone is the largest known at , suggesting an intrinsically extreme ionizing luminosity. Here we show that the lensing hypothesis of quasars can be quantitatively constrained by their proximity zones. We first show that our proximity zone analysis can recover the strongly lensed nature of UHS J0439+1634, with an estimated magnification at 68% (95%) credibility that is consistent with previously published lensing models. We then show that the large proximity zone of SDSS J0100+2802 rules out lensing magnifications of at 95% probability, and conclusively rule out the proposed scenario. Future proximity zone analyses of existing quasar samples have the potential to identify promising strongly lensed candidates, constrain the distribution of quasar lensing, and improve our knowledge of the shape of the intrinsic quasar luminosity function.
1 Introduction
Since the discovery of the first quasars (Fan et al., 2001), the interpretation of their extremely high luminosity has been clouded by the potential for magnification by gravitational lensing (Wyithe & Loeb, 2002; Comerford et al., 2002). Understanding what fraction of the most luminous objects are lensed is crucial for constraining theories for how supermassive black holes formed, as the luminosities of the brightest objects may be vastly overestimated and bias our understanding of the quasar luminosity function (Turner, 1980). While observational efforts to detect multiple images of quasars at 01 resolution have been unsuccessful (Richards et al., 2006; McGreer et al., 2014), the recent discovery of the strongly lensed quasar UHS J0439+1634 (Fan et al. 2019; henceforth J0439+1634), and its closely separated lens galaxy, has lead to suggestions that a larger population of lensed quasars may have been missed due to color selection biases (Fan et al., 2019; Pacucci & Loeb, 2019). Small separation lenses may also be missed due to cuts on source morphology which are commonly applied to select high-redshift quasar candidates (e.g. Richards et al. 2002; Wang et al. 2017).
Recently, Fujimoto et al. (2020) suggested that the brightest quasar known, SDSS J0100+2802 (Wu et al. 2015; henceforth J0100+2802) is strongly gravitationally lensed, based on re-analysis of high spatial resolution ALMA and HST imaging. They inferred a magnification of , with a factor of a few uncertainty in the lensing model. This claim supported previous models (e.g. Wyithe & Loeb 2002) suggesting a substantial fraction of quasars are strongly lensed (Pacucci & Loeb, 2020). However, noted by both Fujimoto et al. (2020) and Pacucci & Loeb (2020), one property of J0100+2802 potentially defies the strongly lensed hypothesis: the extent of its proximity zone.
The “proximity zone” of a quasar is defined as the region where the quasar has substantially over-ionized the surrounding intergalactic medium (IGM) relative to the cosmic mean. The relative lack of neutral hydrogen in the vicinity of the quasar leads to an excess of transmission (or, equivalently, a deficit of absorption) in the Ly forest blueward of rest-frame Ly (Bajtlik et al., 1988). The proximity zone size of quasars is often quantified by “”, defined by Fan et al. (2006) as the point at which the (observed-frame) 20 Å-smoothed Ly transmission first drops below 10%. While this definition is somewhat ad hoc, has been shown to be a valuable tool for constraining quasar lifetime (Eilers et al., 2018), and is sensitive to the size of ionized regions around reionization-epoch quasars (Davies et al., 2019). Radiative transfer simulations of proximity zones show remarkable consistency with the observations across a wide range of quasar luminosity and redshift without parameter tuning (Eilers et al., 2017; Davies et al., 2020).
A small fraction of quasars, however, show much smaller proximity zones than expected, which has been interpreted as a consequence of short quasar lifetimes compared to the photoionization timescale (see e.g. Khrykin et al., 2016) of the IGM (Eilers et al., 2017, 2020). Indeed, Eilers et al. (2017) noted that J0100+2802 has a smaller proximity zone than expected given its observed brightness, and suggested that its lifetime may be short, yr. However, given the dependence of on the intrinsic quasar luminosity ( at low IGM neutral fraction, e.g. Bolton & Haehnelt 2007; Eilers et al. 2017; Davies et al. 2020), another possibility is that the quasar luminosity inferred from its apparent magnitude has been overestimated due to magnification by gravitational lensing. The one quasar which has been unambiguously confirmed to be strongly magnified by a foreground lens, UHS J0439+1634 at (Fan et al. 2019; henceforth J0439+1634), was found to have a small proximity zone compared to the expectation for its observed magnitude, providing additional evidence for its lensed nature. This observation suggests that proximity zones can be used to test the strongly lensed hypothesis for quasars in general.
Haiman & Cen (2002) were the first to show that the size of quasar proximity zones could be used to constrain their intrinsic luminosity, using the connection between the proximity zone size and the size of the ionized bubble carved out by a quasar in a neutral IGM. However, their method required the assumption that the IGM was mostly neutral at , unlikely given recent constraints on the reionization history at (e.g. Planck Collaboration et al. 2018; Greig et al. 2017; Davies et al. 2018b; Mason et al. 2018; Wang et al. 2020), and suffered from complete degeneracy with quasar lifetime. The general idea has existed for quite some time: the seminal work of Bajtlik et al. (1988) suggested that one could constrain the lensing hypothesis via the proximity effect (see also Bechtold 1994).
The quasar Q1208+1011 at , once the highest redshift quasar known (Hazard et al., 1986), showed indications of being strongly lensed via the detection of multiple images at small angular separation (Magain et al., 1992; Bahcall et al., 1992b). While subsequent spectroscopic investigation showed that both sources were quasars at the same redshift, their broad emission lines were not perfectly identical (Bahcall et al., 1992a), and no lensing galaxy has been conclusively identified (Lehár et al., 2000), leaving the true nature of the source as a lingering question mark. There has been a long standing debate (Mortlock et al., 1999) about whether sources like Q1208+1011 are lenses vs. binary quasars (Hennawi et al., 2006, 2010), but Giallongo et al. (1999) argued that the lensing hypothesis for Q1208+1011 is strongly preferred from the relative lack of proximity effect in its spectrum, demonstrating the utility of the proximity effect for identifying gravitational lenses.
In this Letter we show how proximity zone measurements can constrain the lensing magnification of quasars using a suite of 1D ionizing radiative transfer simulations. First, we carefully re-measure the proximity zone sizes of J0100+2802 and J0439+1634 by reconstructing the unabsorbed quasar continua. We then demonstrate that the proximity zone of J0439+1634 prefers a strongly lensed solution, and infer magnification consistent with the lens models from Fan et al. (2019). Finally, we apply the same analysis to J0100+2802 and demonstrate that it cannot be strongly lensed.
In this work, we assume a CDM cosmology with , , and .
2 Data Analysis & Proximity Zone Measurements
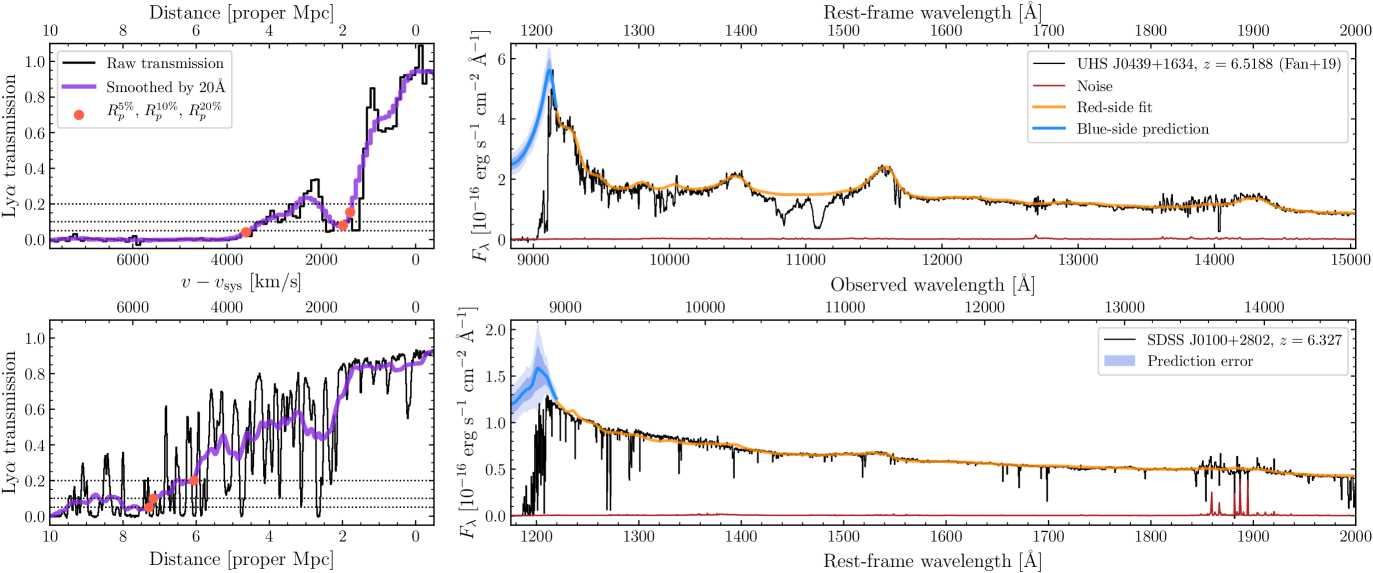
We use the Gemini/GNIRS + Keck/LRIS spectrum of J0439+1634 from Fan et al. (2019). While J0439+1634 exhibits broad absorption line (BAL) features, the velocity range of the absorption does not influence the proximity zone. We correct for the foreground contamination by the lensing galaxy inside the proximity zone by subtracting the mean observed flux ( erg s-1 cm-2 Å-1) just beyond the end of the transmission spikes in the proximity zone (8850 Å to 9000 Å) from the spectrum.
For J0100+2802, we reduced 2h of VLT/X-SHOOTER data acquired from the ESO archive111http://archive.eso.org/eso/eso_archive_main.html. The observations were taken in August 2016 with exceptional seeing conditions under the program ID 096.A-0095 using the 09 slit in the VIS arm and the 06 slit in the NIR arm. Data reduction was performed applying standard techniques, including optimal extraction following Horne (1986), using the open-source spectroscopic data reduction package PypeIt (Prochaska et al., 2019, 2020), which also includes the routines used for flux calibration, telluric correction, and optimal stacking of spectra. The extracted 1D spectra were flux calibrated using the standard star EG 274. Telluric correction was performed on each exposure by jointly fitting a PCA model of the quasar spectrum with a telluric model from a grid of Line-By-Line Radiative Transfer Model calculations (LBLRTM222http://rtweb.aer.com/lblrtm.html; Clough et al. 2005) produced using the python-based TelFit interface (Gullikson et al., 2014). Finally, the fluxed and telluric corrected 1D spectra from each exposure were then stacked.
To model the intrinsic quasar spectra inside of their proximity zones, we use the principal component analysis (PCA) method of Davies et al. (2018a), as customized for post-reionization quasar proximity zones in Eilers et al. (2020). We briefly summarize the construction of the PCA here, but we point the interested reader to Davies et al. (2018a) for details. A sample of 12,764 quasars were selected from the SDSS/BOSS DR12Q quasar catalog (Pâris et al., 2017) at with signal-to-noise ratio greater than 7 at rest-frame 1290 Å. The spectra were queried and accessed via the IGMSpec database (Prochaska, 2017). Each spectrum was normalized at 12902.5 Å and smoothed with an automated spline fitting routine from (Dall’Aglio et al., 2008). Ten red-side (1220–2900 Å) and six blue-side (1175–1220 Å) PCA components were decomposed from nearest-neighbor stacks of the smoothed continua. The red coefficients for each quasar spectrum were then fit jointly with a degree of freedom in the redshift direction, and then the blue coefficients were fit in that “PCA redshift” frame. Finally, we derived a linear relationship between the red and blue coefficients (i.e., a projection matrix, as in Suzuki et al. 2005; Pâris et al. 2011) via a linear least-squares solver, allowing us to predict the blue side spectrum from a fit to the red side.
In Figure 1, we show the red-side PCA fits, blue-side predictions, and the Ly transmission spectra in the proximity zones of J0439+1634 (top) and J0100+2802 (bottom). We measured from the transmission spectra by first convolving the spectrum with a 20Å (observed-frame) boxcar filter, and then determining the distance to the first pixel333Here we differ very slightly from Eilers et al. (2017), who used the third consecutive pixel in their definition of . where the smoothed spectrum falls below 10% (e.g. Fan et al. 2006). We adopt quasar systemic redshifts from host galaxy [C II] emission: for J0439+1634 (Yang et al., 2019), and for J0100+2802 (Wang et al., 2019).
Anticipating the degeneracy between lensing magnification and quasar lifetime, we measure additional “” values at thresholds of 5% and 20%. For clarity, we will refer to these definitions with a superscript denoting the threshold: , , and , where is the “traditional” . For J0439+1634 we measure {,,} = {4.64, 1.99, 1.79} proper Mpc, and for J0100+2802 we measure {,,} = {7.29, 7.17, 6.06} proper Mpc. While our for J0100+2802 is nearly identical to the proper Mpc from Eilers et al. (2017), we note that our for J0439+1634 is substantially smaller than the proper Mpc from Fan et al. (2019) due to our different continuum model and our subtraction of the flux from the foreground lens galaxy.
3 Proximity Zone Simulations
The size of the quasar proximity zone, as quantified by , depends on the degree to which the quasar can ionize the IGM along the line of sight, and thus depends on the intrinsic ionizing luminosity of the quasar (e.g. Bolton & Haehnelt 2007; Davies et al. 2020). The quantitative connection between the two, however, depends on the considerable intrinsic scatter from IGM density fluctuations and time-evolution which can only be fully characterized via detailed simulations (Eilers et al., 2017; Davies et al., 2020).
We simulate quasar proximity zones using the 1D ionizing radiative transfer code from Davies et al. (2016) with minor updates described in Davies et al. (2018b). The code computes the time-dependent photoionization of hydrogen and helium in the presence of a quasar’s ionizing radiation, and solves for the resulting thermal evolution including relevant primordial (i.e. metal-free) heating and cooling processes. For the density, initial temperature, and line-of-sight velocity along each simulated sightline, we draw 1200 skewers from the snapshot of a Nyx hydrodynamical simulation (Almgren et al., 2013; Lukić et al., 2015) 100 comoving Mpc on a side with baryon cells and dark matter particles. Skewers were chosen to start from the locations of the 200 most massive dark matter halos ( M⊙) and extend along the x,y,z coordinate directions.
We run simulations for each quasar on a grid of ionizing luminosities derived from a grid of effective quasar absolute magnitudes from to in steps of . We compute the ionizing luminosity of each model assuming the Lusso et al. (2015) quasar spectral energy distribution (SED) to convert from to , and extrapolate to higher frequencies assuming . We then compute Ly transmission spectra in steps of from to yr. Our suite of proximity zone models for each quasar thus consists of transmission spectra.
We measure the proximity zone sizes of model spectra in the same way as the observed spectra, i.e. the distance at which 20 Å-smoothed transmission first drops below 5%, 10%, and 20% ({,,}). We modify each model spectrum with a draw from a multivariate Gaussian approximation to model the covariant error in the error in the PCA-predicted continuum following Davies et al. (2018b), although this has a very small effect on our analysis (see also Eilers et al. 2020).
4 Constraints on Lensing Magnification From Proximity Zones
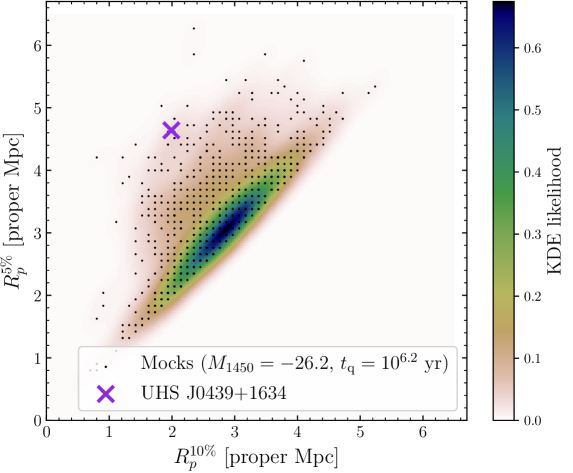
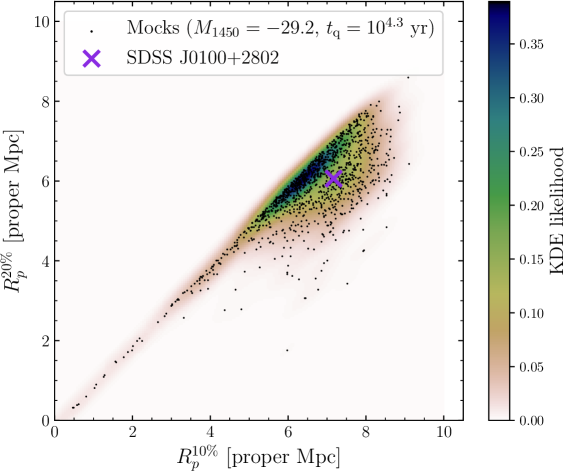
We specify the quasar parameters in terms of , a proxy for ionizing luminosity through the Lusso et al. (2015) SED, and the quasar lifetime . We explore two different options for proximity zone summary statistics: 1. the standard proximity zone size , and 2. a joint statistic consisting of the three proximity zone sizes with different flux thresholds . At each parameter pair in the grid, we approximate the likelihood function with kernel density estimation (KDE) similar to Khrykin et al. (2019). We can then write the likelihood of a set of values as
| (1) |
where is the KDE of derived from the set of forward-modeled mock spectra.
In the left panel of Figure 2 we show an example of the KDE procedure in the 2D space of and for a model with and yr from the J0439+1634 model grid, where the points represent individual model skewers, the shading shows the KDE likelihood, and the purple X shows the J0439+1634 measurements. In the right panel of Figure 2 we show a KDE evaluated in the space of and for a model with and yr from the J0100+2802 grid compared to the J0100+2802 measurements. The (,) models shown in Figure 2 were chosen to have relatively high likelihood for the of each quasar. Note that the observed combination of values for J0439+1634 is relatively rare in our model grid, leading to somewhat noisy likelihood values, but similar spectra do exist. Contrary to J0439+1634, the measurements of J0100+2802 lie in a high probability region of the likelihood.
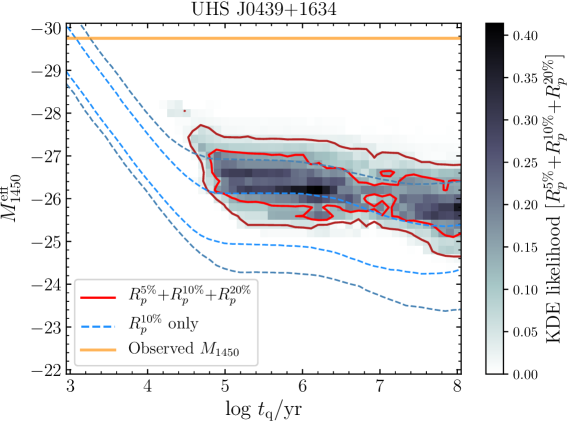
We first discuss the analysis of the lensed quasar J0439+1634. In the left panel of Figure 3, we show the 2D likelihood for the measurements from § 2. The dashed curves show likelihood contours for alone, highlighting a near-perfect degeneracy between quasar lifetime and luminosity when only one measure of proximity zone size is employed. The solid curves and shading represent the joint likelihood of , shifting the likelihood to fainter magnitudes and suppressing the likelihood at short quasar lifetimes. These differences are due to the relatively large , which rules out short lifetimes due to the longer equilibration timescale at larger separations (Davies et al., 2020). Comparing to the orange line showing the apparent , we see that non-lensed models are strongly disfavored.
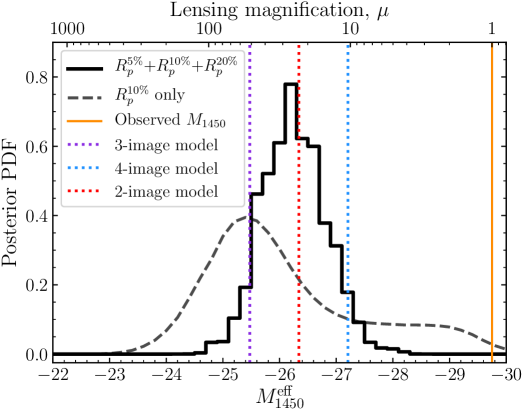
In the right panel of Figure 3 we show the posterior PDFs for marginalized over lifetime and (i.e. the ratio between the apparent luminosity and the intrinsic, unlensed luminosity) using -only (dashed) and (solid) as summary statistics, assuming a log-uniform prior on quasar lifetime (as in Davies et al. 2018b). The posterior constraints on in both cases are consistent with the three lensing models proposed in Fan et al. (2019), shown as the vertical dotted lines – unfortunately, we cannot strongly distinguish between them. Due to the degeneracy between and in the likelihood function, alone cannot fully rule out the unlensed hypothesis, but the peak still lies very close to the fiducial 3-image lens model of Fan et al. (2019). Including the additional values tightens the posterior PDF to a relatively narrow range: at 68% (95%) credibility, and conclusively identifies the quasar as strongly lensed with at 99% credibility.
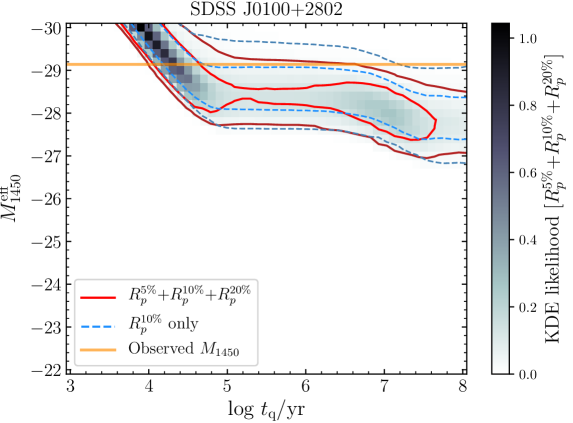
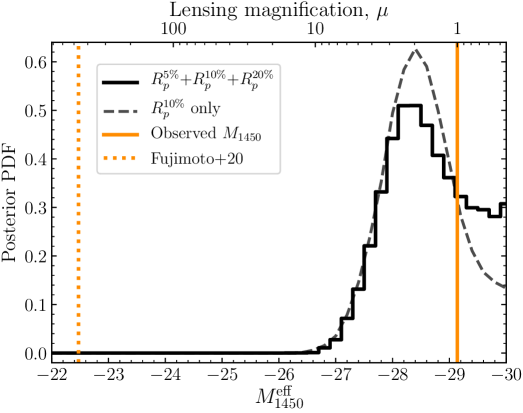
We now turn to the nature of J0100+2802. In the left panel of Figure 4, we show the 2D likelihoods for and similar to Figure 3. Contrary to J0439+1634, the two likelihoods are quite similar, although using all three values modestly shifts the likelihood towards shorter quasar lifetime and brighter . In both cases the likelihoods intersect with the observed . In the right panel of Figure 4, we show the marginalized posterior PDFs for and the lensing magnification of J0100+2802. The posterior PDF implies () at 95% (99%) credibility. The model from Fujimoto et al. (2020) is thus strongly disfavored by our analysis, even allowing for a factor of a few uncertainty in the lens model.
5 Discussion & Conclusion
Here we have shown that quantitative analysis of high-redshift quasar proximity zones can constrain their magnification by gravitational lensing. We first recovered the strong lensing of the known lensed quasar J0439+1634, suggesting that the proximity zone structure is a good probe of the intrinsic (ionizing) quasar luminosity. We then performed a similar analysis on the proximity zone spectrum of the hyperluminous quasar J0100+2802, and despite the smaller-than-expected proximity zone, we conclusively rule out the lensing magnification of proposed by Fujimoto et al. (2020).
We note that a discrepancy between and the observed may not necessarily be due to lensing magnification. Namely, the ionizing SED of quasars is not perfectly known, and significant scatter is observed between the far-ultraviolet SEDs of individual quasars (Telfer et al., 2002). Approximating the scatter in individual quasar power-law spectral indices from 1450Å to 912Å as a Gaussian with a dispersion of 0.5 (as a rough description of the distribution in Telfer et al. 2002) suggests variations in the ionizing luminosity of dex ( mag) from quasar to quasar at fixed . This scatter is small compared to the -based constraints in this work due to the intrinsic “noise” from IGM density fluctuations, which are alone sufficient to match the typical scatter in observed (Davies et al., 2020).
Our posterior constraints on magnification assume a log-uniform prior over a wide range of quasar lifetime, – yr. For J0100+2802, the most conservative constraint (i.e. with the highest magnification) comes from long quasar lifetimes of yr. If we assume yr, our 95% credibility constraint on the magnification of J0100+2802 relaxes somewhat to . However, recent analyses of reionization-epoch proximity zones (Davies et al., 2019) and He II Ly proximity zones (Khrykin et al., 2019) suggest that much shorter lifetimes on the order of yr are more common, and similar conclusions can be drawn from the fraction of quasars with short lifetimes (Eilers et al., 2017, 2020). We also assumed a log-uniform prior over the lensing magnification; more informative priors could be chosen from lensing distribution models, which are roughly lognormal around with a long tail to higher values (e.g. Hilbert et al. 2008; Mason et al. 2015; Pacucci & Loeb 2019). However, such a prior would have to be balanced by the color and morphological selection biases against lensed objects.
With the exception of the serendipitous discovery of J0439+1634, direct searches for lensed quasars at with high-resolution imaging have failed to identify candidates (Richards et al., 2006; McGreer et al., 2014). We posit that high-redshift quasar proximity zones could be used to pre-select promising lensed candidates for followup imaging. The majority of quasars have proximity zones which closely follow the expected sizes from our radiative transfer modeling (Eilers et al., 2017; Davies et al., 2020), and for these quasars we do not expect there to be strong indications of lensing. A small subset of these quasars, however, have much smaller proximity zones than expected for their inferred luminosity (Eilers et al., 2017, 2020), and for these quasars models with strong lensing could be preferred. Interestingly, a strongly lensed () fraction of is consistent with the detection of J0439+1634 at in the observed sample of quasars in the lensing population models of Pacucci & Loeb (2019), which is comparable to the fraction of quasars with small proximity zones (Eilers et al., 2020).
Small proximity zone quasars which lack additional evidence supporting a youthful hypothesis (e.g. compact or non-existent halos of extended narrow-line emission, Eilers et al. 2018; Farina et al. 2019) may represent the most likely candidates for lensed systems hiding in plain sight. That said, we have shown here that the young and lensed scenarios can potentially be distinguished using additional information contained within the full Ly transmission profile. In future work, we will scour the known population of quasars to identify those whose proximity zones imply strong lensing and warrant high spatial resolution investigation with e.g. HST or ALMA.
References
- Almgren et al. (2013) Almgren, A. S., Bell, J. B., Lijewski, M. J., Lukić, Z., & Van Andel, E. 2013, ApJ, 765, 39
- Bahcall et al. (1992a) Bahcall, J. N., Hartig, G. F., Jannuzi, B. T., Maoz, D., & Schneider, D. P. 1992a, ApJ, 400, L51
- Bahcall et al. (1992b) Bahcall, J. N., Maoz, D., Schneider, D. P., Yanny, B., & Doxsey, R. 1992b, ApJ, 392, L1
- Bajtlik et al. (1988) Bajtlik, S., Duncan, R. C., & Ostriker, J. P. 1988, ApJ, 327, 570
- Bechtold (1994) Bechtold, J. 1994, ApJS, 91, 1
- Bolton & Haehnelt (2007) Bolton, J. S., & Haehnelt, M. G. 2007, MNRAS, 374, 493
- Clough et al. (2005) Clough, S. A., Shephard, M. W., Mlawer, E. J., et al. 2005, J. Quant. Spec. Radiat. Transf., 91, 233
- Comerford et al. (2002) Comerford, J. M., Haiman, Z., & Schaye, J. 2002, ApJ, 580, 63
- Dall’Aglio et al. (2008) Dall’Aglio, A., Wisotzki, L., & Worseck, G. 2008, A&A, 491, 465
- Davies et al. (2016) Davies, F. B., Furlanetto, S. R., & McQuinn, M. 2016, MNRAS, 457, 3006
- Davies et al. (2019) Davies, F. B., Hennawi, J. F., & Eilers, A.-C. 2019, ApJ, 884, L19
- Davies et al. (2020) —. 2020, MNRAS, 493, 1330
- Davies et al. (2018a) Davies, F. B., Hennawi, J. F., Bañados, E., et al. 2018a, ApJ, 864, 143
- Davies et al. (2018b) —. 2018b, ApJ, 864, 142
- Eilers et al. (2017) Eilers, A.-C., Davies, F. B., Hennawi, J. F., et al. 2017, ApJ, 840, 24
- Eilers et al. (2018) Eilers, A.-C., Hennawi, J. F., & Davies, F. B. 2018, ApJ, 867, 30
- Eilers et al. (2020) Eilers, A.-C., Hennawi, J. F., Decarli, R., et al. 2020, arXiv e-prints, arXiv:2002.01811
- Fan et al. (2001) Fan, X., Narayanan, V. K., Lupton, R. H., et al. 2001, AJ, 122, 2833
- Fan et al. (2006) Fan, X., Strauss, M. A., Becker, R. H., et al. 2006, AJ, 132, 117
- Fan et al. (2019) Fan, X., Wang, F., Yang, J., et al. 2019, ApJ, 870, L11
- Farina et al. (2019) Farina, E. P., Arrigoni-Battaia, F., Costa, T., et al. 2019, ApJ, 887, 196
- Fujimoto et al. (2020) Fujimoto, S., Oguri, M., Nagao, T., Izumi, T., & Ouchi, M. 2020, ApJ, 891, 64
- Giallongo et al. (1999) Giallongo, E., Fontana, A., Cristiani, S., & D’Odorico, S. 1999, ApJ, 510, 605
- Greig et al. (2017) Greig, B., Mesinger, A., Haiman, Z., & Simcoe, R. A. 2017, MNRAS, 466, 4239
- Gullikson et al. (2014) Gullikson, K., Dodson-Robinson, S., & Kraus, A. 2014, AJ, 148, 53
- Haiman & Cen (2002) Haiman, Z., & Cen, R. 2002, ApJ, 578, 702
- Hazard et al. (1986) Hazard, C., McMahon, R. G., & Sargent, W. L. W. 1986, Nature, 322, 38
- Hennawi et al. (2006) Hennawi, J. F., Strauss, M. A., Oguri, M., et al. 2006, AJ, 131, 1
- Hennawi et al. (2010) Hennawi, J. F., Myers, A. D., Shen, Y., et al. 2010, ApJ, 719, 1672
- Hilbert et al. (2008) Hilbert, S., White, S. D. M., Hartlap, J., & Schneider, P. 2008, MNRAS, 386, 1845
- Horne (1986) Horne, K. 1986, PASP, 98, 609
- Khrykin et al. (2016) Khrykin, I. S., Hennawi, J. F., McQuinn, M., & Worseck, G. 2016, ApJ, 824, 133
- Khrykin et al. (2019) Khrykin, I. S., Hennawi, J. F., & Worseck, G. 2019, MNRAS, arXiv:1810.03391
- Lehár et al. (2000) Lehár, J., Falco, E. E., Kochanek, C. S., et al. 2000, ApJ, 536, 584
- Lukić et al. (2015) Lukić, Z., Stark, C. W., Nugent, P., et al. 2015, MNRAS, 446, 3697
- Lusso et al. (2015) Lusso, E., Worseck, G., Hennawi, J. F., et al. 2015, MNRAS, 449, 4204
- Magain et al. (1992) Magain, P., Surdej, J., Vanderriest, C., Pirenne, B., & Hutsemekers, D. 1992, A&A, 253, L13
- Mason et al. (2018) Mason, C. A., Treu, T., Dijkstra, M., et al. 2018, ApJ, 856, 2
- Mason et al. (2015) Mason, C. A., Treu, T., Schmidt, K. B., et al. 2015, ApJ, 805, 79
- McGreer et al. (2014) McGreer, I. D., Fan, X., Strauss, M. A., et al. 2014, AJ, 148, 73
- Mortlock et al. (1999) Mortlock, D. J., Webster, R. L., & Francis, P. J. 1999, MNRAS, 309, 836
- Pacucci & Loeb (2019) Pacucci, F., & Loeb, A. 2019, ApJ, 870, L12
- Pacucci & Loeb (2020) —. 2020, ApJ, 889, 52
- Pâris et al. (2011) Pâris, I., Petitjean, P., Rollinde, E., et al. 2011, A&A, 530, A50
- Pâris et al. (2017) Pâris, I., Petitjean, P., Ross, N. P., et al. 2017, A&A, 597, A79
- Planck Collaboration et al. (2018) Planck Collaboration, Aghanim, N., Akrami, Y., et al. 2018, ArXiv e-prints, arXiv:1807.06209
- Prochaska (2017) Prochaska, J. X. 2017, Astronomy and Computing, 19, 27
- Prochaska et al. (2020) Prochaska, J. X., Hennawi, J. F., Westfall, K. B., et al. 2020, arXiv e-prints, arXiv:2005.06505
- Prochaska et al. (2019) Prochaska, J. X., Hennawi, J., Cooke, R., et al. 2019, pypeit/PypeIt: Releasing for DOI, v.0.11.0.1, Zenodo, doi:10.5281/zenodo.3506873
- Richards et al. (2002) Richards, G. T., Fan, X., Newberg, H. J., et al. 2002, AJ, 123, 2945
- Richards et al. (2006) Richards, G. T., Haiman, Z., Pindor, B., et al. 2006, AJ, 131, 49
- Suzuki et al. (2005) Suzuki, N., Tytler, D., Kirkman, D., O’Meara, J. M., & Lubin, D. 2005, ApJ, 618, 592
- Telfer et al. (2002) Telfer, R. C., Zheng, W., Kriss, G. A., & Davidsen, A. F. 2002, ApJ, 565, 773
- Turner (1980) Turner, E. L. 1980, ApJ, 242, L135
- Wang et al. (2019) Wang, F., Wang, R., Fan, X., et al. 2019, ApJ, 880, 2
- Wang et al. (2017) Wang, F., Fan, X., Yang, J., et al. 2017, ApJ, 839, 27
- Wang et al. (2020) Wang, F., Davies, F. B., Yang, J., et al. 2020, ApJ accepted
- Wu et al. (2015) Wu, X.-B., Wang, F., Fan, X., et al. 2015, Nature, 518, 512
- Wyithe & Loeb (2002) Wyithe, J. S. B., & Loeb, A. 2002, Nature, 417, 923
- Yang et al. (2019) Yang, J., Venemans, B., Wang, F., et al. 2019, ApJ, 880, 153