Temporal Solitons in a Coherently Driven Active Resonator
Abstract
Optical frequency combs are lightwaves composed of a large number of equidistant spectral lines. They are important for metrology, spectroscopy, communications and fundamental science. Frequency combs can be generated by exciting dissipative solitons in lasers or in coherently driven passive resonators, both of which suffer from significant limitations. Here, we show that the advantages of each platform can be combined by operating an active cavity pumped below the lasing threshold. We generate a novel kind of soliton and show that 10% of its power can be extracted from a cavity with effective loss as low as 3%, highlighting the potential of low finesse resonators for soliton formation. Moreover, we find that amplified spontaneous emission has negligible impact on the soliton’s stability. Our results open up new avenues for frequency comb generation by showing that two pumping schemes can be efficiently combined to generate a high power ultra stable pulse train.
Temporal dissipative solitons are optical pulses propagating indefinitely in a nonlinear optical resonator akhmediev_dissipative_2005 . They are sustained by a double balance of gain and loss on the one hand and nonlinearity and dispersion on the other hand. Solitons of Kerr resonators, in particular, are attracting a lot of attention grelu_dissipative_2012 . The balance between the second order dispersion and an instantaneous Kerr non-linearity leads to sech-shaped solutions that can be sub-100 fs kieu_sub-100_2009 ; lilienfein_temporal_2019 . As they periodically leave the cavity, they form a stable pulse train - an optical frequency comb (OFC) - that finds applications in many fields, most notably metrology udem_optical_2002 . There are two main types of such Kerr solitons: (i) dissipative solitons in (actively or passively) mode-locked lasers haus_mode-locking_2000 and (ii) temporal cavity solitons (CSs) in passive resonators wabnitz_suppression_1993 ; leo_temporal_2010 ; herr_temporal_2014 . In the former, the soliton’s energy is maintained by intracavity amplification while, in the latter, it is sustained by coherent pumping. This leads to fundamental differences between the pulse trains and corresponding OFCs, in terms of energy and coherence. The strong amplification provided by the gain medium in lasers allows to extract a significant fraction of the soliton energy at each pass through the laser cavity output coupler. Dissipative solitons are however susceptible to timing jitter as amplified spontaneous emission adds random fluctuations which, in turn, causes the central frequency to drift gordon_random_1986 ; kim_ultralow-noise_2016 . CSs, on the other hand, are phase locked to a coherent driving laser leo_temporal_2010 . But, as they propagate in high finesse resonators, only a small fraction of the energy can be extracted. Moreover, they lie on a continuous wave (CW) background such that a large part of the comb energy is located in the central spectral line xue_microresonator_2017 .
Currently, either lasers or passive resonators are used depending on whether the application relies more on power or stability. But in some cases, such as OFC generation, both are crucial.
Here we propose a novel, hybrid cavity design as an alternative to lasers and passive resonators. We show that short pulses akin to CSs, exist in coherently driven active cavities. We find that they exhibit similar stability properties as CSs while a larger fraction of the intracavity field can be extracted every roundtrip.
Intracavity amplification has been proposed to tune the coupling regime of driven resonators choi_control_2001 ; dumeige_determination_2008 and to improve optical gyroscopes hsiao_planar_2007 . It was also used in the first demonstration of spatial cavity solitons in a semiconductor microcavity barland_cavity_2002 . Our work extends the applications of intracavity amplification by showing that it is an efficient means to enhance frequency conversion in coherently driven resonators.
Results
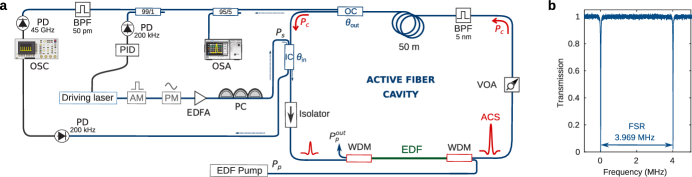
Our experimental demonstration is performed with a fibre resonator. The set-up is depicted in Fig. 1a. The cavity is about 50 m long, mostly made of standard single mode fiber, and incorporates two couplers (90/10 and 99/1), an optical isolator and a gain section. The latter is designed so as to minimize gain saturation (see Supplementary Information) and is mainly composed of a short erbium doped fiber pumped at 1480 nm. The driving laser is a narrow linewidth distributed feedback laser emitting around 1550 nm. It can be amplitude modulated, phase modulated and/or amplified in a commercial erbium doped fibre amplifier (EDFA), before being sent to the input coupler. We note that both couplers can be used as an input port without any impact on the finesse. In what follows we perform experiments with both configurations depending on whether we want to extract more power from the cavity or reduce the input power threshold. Part of the output beam is sent to a proportional-integral-derivative (PID) controller to lock the laser frequency close to a resonance of the cavity jang_ultraweak_2013 .
We start by characterizing the linear cavity properties. We bypass both modulators and the EDFA and send the driving laser (1 W) to the 99/1 coupler. The 1480 nm pump power is set to 1 W. Two cavity resonances, as measured in the through port, are shown in Fig. 1b. The FSR is 3.969 MHz and the linewidth is 15 kHz, corresponding to a Q factor of 12.2 billion. Knowing the input coupler ratio, we can extract the maximum intracavity power (215 µW ) and corresponding effective loss ( %) per roundtrip (see Supplementary Information). When we increase the driving power, the resonances broaden because of gain saturation (see Fig. S2a). The effective loss more than double when the intracavity power is 50 mW, and reaches 10% around 150 mW. While these values remain low by passive fibre resonator standards leo_temporal_2010 ; jang_ultraweak_2013 , they highlight that gain saturation is likely to play an important role in the nonlinear regime of our cavity.
In passive resonators, CSs arise in the anomalous dispersion regime, when a low power CW solution coexists with a modulated pattern coen_universal_2013 . The latter emerges beyond a Turing bifurcation, often called modulation instability (MI). MI allows CSs to form spontaneously as the system is driven out of equilibrium herr_temporal_2014 ; luo_spontaneous_2015 . In our system, the Turing bifurcation requires prohibitively high pump powers because of gain saturation (see Supplementary Information). However, Er3+ excited levels have a very long lifetime as compared to the cavity roundtrip time becker_erbium-doped_1999 . Because CSs are short pulses sitting on top of a low power continuous wave background, a single soliton, or a few, would experience much lower effective loss than that close to the Turing bifurcation. The absence of an extended Turing pattern hence does not preclude the existence of solitons in our system as it does in passive resonators coen_universal_2013 . It does, however, indicate that the intracavity power should be kept low during the excitation process.
Alternatively, gain saturation can be reduced by using a synchronous pulsed pump anderson_observations_2016 ; obrzud_temporal_2017 . In that case, we expect the nonlinear dynamics to be similar to that of passive resonators, including the spontaneous formation of Turing patterns. In this work, we investigate soliton formation under both continuous wave and synchronous pulsed pumping. To differentiate solitons in our cavity from CSs of passive resonators, we call them active cavity solitons (ACSs).
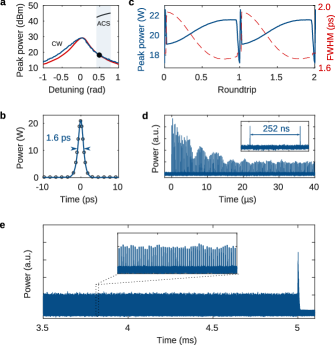
Soliton formation with a CW driving laser is demonstrated for mW where is the input coupling ratio. We use the 90/10 coupler as the input port to minimize the required driving power. The cavity output power as we scan the laser frequency is shown in Fig. 2a. We find good agreement with the theoretical resonance. No evidence of modulation instability is found despite a maximum intracavity power of about 850 mW, in agreement with our analysis above. Our simulations predict ACS formation for , where is the linear phase accumulated over one roundtrip and is an integer. We note that this theoretical range (found by simulations of the generalized Ikeda map) is dependent on the bandwidth of the intracavity filter and does not constitute an intrinsic range of existence of ACSs. An example of ACS, for , is shown in Fig. 2b. The soliton is 1.6 ps wide, with a peak power of 21 W. It sits atop a 60 mW homogeneous background. Because we simulate the formation of a single soliton, the gain saturation is set by the background level. The effective loss amounts to 6.5 % in this case. The evolution of the full width at half maximum and peak power of the ACS along a couple of roundtrips is shown in Fig. 2c. To minimize the impact on the dynamics of the 30% energy gain and loss, experienced by the soliton over one roundtrip, we designed the cavity so as to have the lossy elements lumped together close to the short gain section. Most of the reshaping occurs during the propagation in the 50 m fibre, as is the case for CSs propagating in passive resonators jang_ultraweak_2013 . To further highlight the similarity between ACSs and CSs, we compare, in Fig. 2b, an ACS with the CS of the equivalent passive cavity (%) coen_universal_2013 . The excellent agreement indicates that despite significant intra-roundtrip variations and the lack of modulation instability, our system supports localized patterns very similar to those of a high finesse passive resonator.
We experimentally address ACSs in our cavity with a single pulse of intensity modulation wang_addressing_2018 . We start by stabilizing the cavity on the slope and level corresponding to (see black dot in Fig. 2a). We then send a 250 ps pulse with a peak power of 45 W and record the cavity output on a 10 GHz oscilloscope. We use a narrowband filter offset by 2 nm from the central frequency to remove the CW background. Our results are shown in Fig. 2. Shortly after the arrival of the addressing pulse, a pattern of solitons of constant amplitude can be seen leaving the cavity every roundtrip (Fig. 2d). A similar pattern is present up to the arrival time of a second addressing pulse, about 5 ms later (Fig. 2e), after which the solitons quickly disappear. The delay between two addressing pulses corresponds to more than a thousand times the photon lifetime. This experiment demonstrates the existence of robust and addressable short optical pulses in our cavity. These features are shared with CSs of passive resonators. Yet, the low energy level contained in a single soliton hinders a more precise temporal and spectral characterization of these ACSs in the CW-pumped regime. Despite their large peak-to-background power ratio, the energy contained in the background is two orders of magnitude larger.
In a second series of experiments, we drive our resonator with flat-top pulses synchronized to the roundtrip time of the cavity. The advantage is threefold. Pulsed pumping inhibits gain saturation, allows to reach higher driving powers, and reduces the energy contained in the background, facilitating the characterization of the soliton.
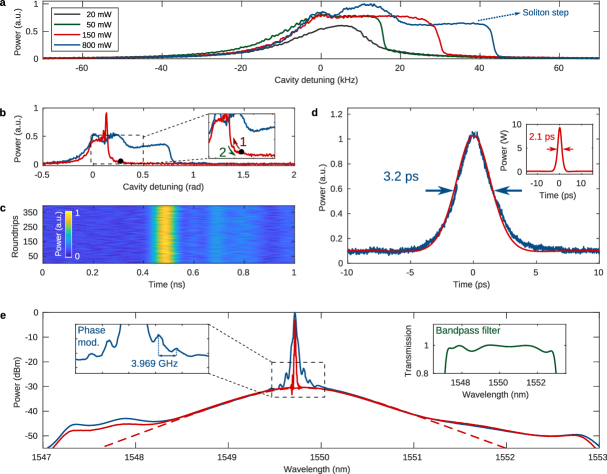
We carve out background-free 1 ns flat top pulses in the continuous wave pump with the amplitude modulator, corresponding to a duty cycle . Moreover, we imprint a 3.97 GHz phase modulation (PM) on the driving field. CSs are attracted by PM maxima jang_temporal_2015 , and either merge or disappear if several CSs are present close to the same maximum jang_controlled_2016 , ensuring individual ACSs will be trapped and separated by at least 250 ps in our experiment. Our simulations predict soliton formation with as little as µW of average pump power which permits using the 99/1 coupler as the input port and the 90/10 coupler as a drop port. This configuration allows to collect 10% of the soliton energy despite operating a cavity with effective loss as low as 3%. The experiments are performed with an input peak power mW. The nonlinear resonances, as we increase the 1480 nm pump power from 20 mW to 800 mW, are shown in Fig. 3a. As the effective loss diminishes, the intracavity power increases and the resonances gradually tilt. When the nonlinear phase shift becomes larger than the resonance width, we observe the emergence of a plateau indicating the collapse of the homogeneous state into Turing patterns. It is a common feature of nonlinear passive resonators and is often referred to as the soliton step herr_temporal_2014 ; obrzud_temporal_2017 . In Fig. 3b we show both a forward and a backward scan for . The bistable regime is defined by the region where the forward and backward scans significantly differ. We stress that because of the dynamical nature of a scan, corresponding to around 0.4 ms/rad in Figs. 3A-B, the soliton step is not always representative of the average power of steady state solutions at the corresponding detuning. Yet, the scans are an indication as to where localized patterns can be found in the system.
The use of short pump pulses, coupled with the phase modulation, enables the formation of a single soliton without sending an addressing pulse. We start by stabilizing the cavity on the lower branch of the bistable region, which corresponds to the slope of the backward scan. We choose a PID setpoint of 61 µW after the output coupler (), corresponding to a detuning of 0.27 and a quasi-CW background of 160 mW inside the cavity (see black dot in Fig. 3b). Once in a steady state, we perturb the system by increasing the setpoint, so as to reach the modulationnaly unstable region, and then bring the setpoint back to its original value (see Methods). This technique is a slower, manual version of the frequency ”kick” technique implemented in microresonators volet_micro-resonator_2018 and reproducibly leads to the generation of a single ACS in our cavity. A stable pulse train is measured at the output coupler, see Fig. 3c. The pulses are resolution limited and the absence of drift indicates locking to a maximum of the GHz phase modulation. The soliton train is also sent to an optical spectrum analyzer (OSA) and an autocorrelator (see Figs. 3d and 3e), both of which confirm the excitation of a 2.1 ps wide pulse in the cavity. The results are in excellent agreement with simulations. The spectrum is also compared to the well known triangular spectrum of a sech-squared pulse (see Fig. 3e). The main distinction is the background of amplified spontaneous emission (ASE). The question hence arises as to the potential impact of the ASE on the coherence of the soliton train. ASE is known to limit the coherence of dissipative solitons in lasers through the Gordon-Haus effect gordon_random_1986 ; kim_ultralow-noise_2016 . Slow spectral drifts lead to timing jitter which is detrimental to high-precision applications such as optical clocks hinkley_atomic_2013 . In our system, as opposed to mode-locked lasers, the solitons are locked to both the driving laser and a phase modulation maximum such that we expect a minimal impact of the ASE on the timing jitter. Note that we measure much less ASE when the duty cycle is lower because of the gain saturation associated with the larger average intracavity power. A spectrum from an experiment conducted with is shown in the Supplementary Information. However, in order to study the impact of noise, or lack thereof, on the stability of ACSs, we perform coherence measurements in the configuration with maximum ASE ().
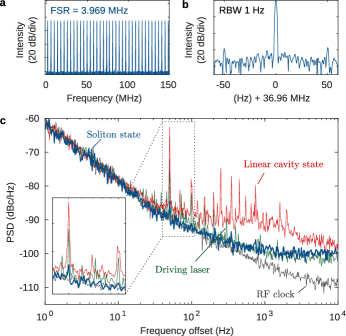
To experimentally characterize the stability of the pulse train, we filter out the driving laser and send the signal to a photodiode connected to an electrical spectrum analyzer (see Methods). The results are shown in Fig. 4. The spectrum reveals a series of beat notes separated by the FSR of the cavity. The beat notes have a full width at half maximum of 1 Hz, limited by the resolution of the analyzer. We further characterize the pulse train by measuring the single sideband phase noise of a beat note around 37 MHz (see Fig. 4c). It is compared to the same beat note of the RF pattern, the modulated driving laser and the output of the stabilized cavity in the linear regime. The latter is obtained when the cavity is stabilized in the existence region of ACSs but none are excited (, see Fig. 3b). These measurements suggest that the phase noise of the soliton train is limited by the RF clock in the low frequency range and by the photodiode shot-noise for larger frequencies. Beyond 10 kHz, and up to half the FSR, we measure a constant phase noise of around -100 dBc/Hz (not shown). Particularly interesting is the absence of spurious peaks on the soliton phase noise, as compared to both the driving laser and the linear state, highlighting the noise filtering capabilities of ACSs. The 50 Hz peak, for example, is much less pronounced on the soliton phase noise than on the other optical measurements (see inset). The linear cavity state is particularly noisy, possibly because of ASE, which further stresses that ACSs are robust attractors, as they shed the noise present on the background. These results prove the formation of a highly coherent soliton comb. We recall that, in these pulsed pump experiments, we used the 99/1 coupler as an input port to maximize the energy after the output coupler (). The exact same ultra-stable pulse train could be excited with an average input pump power as low as W by using the 90/10 coupler as the input port.
Discussion
In summary we have shown that coherently driven active fibre resonator may host robust, addressable optical solitons which we call active cavity solitons (ACSs). We have excited ACSs with either a pulsed or CW pump. With the former, the dynamics is very similar to that of passive resonators and ACSs may form spontaneously. With the latter, the absence of Turing patterns prevents their spontaneous formation but we showed that they can be individually addressed.
These solitons combine the advantages of cavity solitons as they are highly coherent, and of dissipative solitons because they reshape over a single roundtrip despite the extraction of a significant fraction of their power. While the principal source of loss in our cavity comes from the large coupling ratios, losses of any origin can be compensated by incorporating a gain section. Intrinsically low finesse resonators, such as very long cavities or resonators incorporating lossy functionalities, would become suitable for soliton formation, opening up new avenues for optical frequency combs.
Our demonstration is performed with a fibre resonator but we believe that our scheme can be readily applied to other platforms, for example microresonators. The generation of CSs in passive integrated resonators (often called dissipative Kerr solitons) has attracted significant attention in the past decade. They have shown promise for important applications, including data transmission marin-palomo_microresonator-based_2017 , optical atomic clocks newman_architecture_2019 and microwave generation liu_photonic_2020 . Yet, real life applications are still lagging behind, mostly because very little power can be extracted from a high Q microresonator. Several schemes have been recently proposed to circumvent this problem bao_laser_2019 ; xue_super-efficient_2019 . We envision that an integrated version of our hybrid cavity would combine the advantages of integrated passive resonators brasch_photonic_2016 and lasers wang_iii-v–si_2017 ; piccardo_frequency_2020 . Note that the principle underlying the formation of ACS is fundamentally different from the generation of frequency combs in injection-locked mode-locked lasers wieczorek_dynamical_2005 .
Finally, we believe that the potential applications of our hybrid cavity go beyond four-wave mixing. Active cavities can indeed be used to host other frequency conversion configurations. For example, the threshold of a singly resonant optical parametric oscillator bosenberg_93_1996 would be significantly reduced by incorporating an amplifier at the signal frequency.
Methods
Experimental set-up
The fibre ring cavity (see Fig. 1a) is made of a section m of standard telecommunication single-mode silica fibre (SMF-28) and a cm section of erbium doped fibre (EDF). The latter provides the optical gain. It is surrounded by two wavelength division multiplexers (WDMs) to combine the 1480 nm pump with the intracavity signal, and to reject the remaining pump power at the amplifier output. The backward pumping configuration is chosen to maximize the measurement signal-to-noise ratio (SNR). The EDF is a Liekki ER16-8/125 fibre, chosen for its good spliceability with standard single mode fibres and its relatively small gain (8 dB.m-1 at 1550 nm). Its length is empirically set so that the gain is slightly larger than the cavity loss. We then use a variable optical attenuator to increase the loss so that the cavity is below the lasing threshold. An optical bandpass filter hinders laser emission at shorter wavelengths. It has a bandwidth of 5 nm at 0.5 dB and is centred on 1550 nm (its transmittance is shown in the right inset of Fig. 3e). The cavity contains two couplers (99/1 and 90/10). They are used either to inject the driving beam into the cavity or to extract part of the intracavity power. Finally, the dual-stage optical isolator (60 dB of isolation factor) in the cavity prevents the build up of Brillouin scattering. Without the doped fibre, the total cavity loss (including the insertion loss of the two WDMs) is 32%. The whole cavity is enclosed in a box to passively reduce the environmental perturbations.
The driving continuous wave (CW) laser is a Koheras Adjustik E15 with a sub-100 Hz linewidth. Its wavelength is set to 1549.72 nm, on the edge of the laser tuning range (1 nm) to be as close as possible to a local transmission peak of the bandpass filter (1549.45 nm, see Fig. 3e). To synchronously pump the cavity, the laser output is modulated with a Mach-Zehnder amplitude modulator (bandwidth: 12 GHz, extinction ratio: 30 dB), driven by a pattern generator connected to an RF clock. The driving field can also be phase modulated at the clock frequency (3.969 GHz). A commercial erbium-doped fibre amplifier (EDFA) boosts the driving signal power prior to the cavity. The amplified spontaneous emission (ASE) generated in the EDFA is suppressed by a narrow bandpass filter (1 nm bandwidth at 0.5 dB), centered on the driving laser wavelength. The driving beam is launched into the cavity through the input coupler (, either 1 or 10%). A polarization controller is used to align the input polarization with one of the two eigenmodes of the cavity. The cavity transmission is measured by scanning the frequency of the driving laser and recording the average power in the through port with a 200 kHz photodiode (see e.g. in Figs. 1B and S2A).
Part of the intracavity power is extracted at the output coupler (, either 10 or 1%) to provide a feedback signal for the cavity stabilization and to characterize the solitons. The cavity detuning is stabilized by slightly changing the driving laser wavelength to maintain a constant intracavity power. The feedback signal is generated by a proportional-integral-derivative controller (Toptica DigiLock 110) driven by the photodiode. The spectrum of the active cavity soliton (ACS) is recorded on an optical spectrum analyser (0.1 nm resolution bandwidth). Time measurements are carried out with a fast photodiode (45 GHz bandwidth) and an oscilloscope (10 GHz bandwidth, 10 GSample.s-1). Before the photodiode, the signal is filtered by a 100 GHz bandpass filter, shifted 2 nm from the driving laser wavelength, to remove the CW background and increase the SNR of the generated electrical signal leo_temporal_2010 . Alternatively, radio-frequency (RF) measurements and intensity autocorrelation traces are acquired directly at the cavity output. For the autocorrelation measurement, a commercial EDFA is used to increase the average output power to 100 mW.
ACS excitation under CW pumping
For these experiments, the CW driving beam is injected in the cavity through the 90/10 coupler (). The bias voltage of the amplitude modulator (AM) is set so that, after amplification, the CW driving power reaches mW and a 45 W flat-top (250 ps duration) single modulation pulse can be added on demand. The intracavity power is stabilized to approximately 60 mW, corresponding to a detuning of rad. Once the cavity is stabilized, an RF switch connected to the pattern generator is used to add the 45 W addressing pulse every 5 ms wang_addressing_2018 . A single pulse is sufficient to excite or erase ACSs.
ACS excitation under synchronous pumping
In this set of experiments, the 99/1 coupler is used as an input port (). The amplitude and the phase modulators are used to synchronously pump the cavity and to lock the temporal position of the solitons respectively. Starting in the bistable region, ACSs are spontaneously generated by manually decreasing the detuning with the PID up to the emergence of a noisy sech squared-like spectrum. The detuning is then increased until a stable noise-free spectrum is obtained. This technique leads to the generation of single ACS at and multiple ACSs at (see Fig. S3b).
Phase noise measurements
For all RF measurements depicted in Fig. 4, the output coupler is the 90/10 (). The output power is sent to a low noise photodiode (1 GHz bandwidth) connected to an RF spectrum analyzer with phase noise measurement capabilities (Agilent MXA-9020A). For the soliton state measurement, a 100 GHz bandpass filter, shifted 2 nm from the driving laser wavelength, is added before the photodiode. The results shown in Fig. 4c have been averaged over five recordings. Each recording takes about 5 minutes.
References
- (1) Akhmediev, N. & Ankiewicz, A. (eds.) Dissipative Solitons. Lecture Notes in Physics (Springer-Verlag, Berlin Heidelberg, 2005). URL https://www.springer.com/gp/book/9783540233732.
- (2) Grelu, P. & Akhmediev, N. Dissipative solitons for mode-locked lasers. Nature Photonics 6, 84–92 (2012). URL https://www.nature.com/articles/nphoton.2011.345.
- (3) Kieu, K., Renninger, W. H., Chong, A. & Wise, F. W. Sub-100 fs pulses at watt-level powers from a dissipative-soliton fiber laser. Optics Letters 34, 593–595 (2009). URL https://www.osapublishing.org/ol/abstract.cfm?uri=ol-34-5-593.
- (4) Lilienfein, N. et al. Temporal solitons in free-space femtosecond enhancement cavities. Nature Photonics 13, 214–218 (2019). URL https://www.nature.com/articles/s41566-018-0341-y.
- (5) Udem, T., Holzwarth, R. & Hänsch, T. W. Optical frequency metrology. Nature 416, 233–237 (2002). URL https://www.nature.com/articles/416233a.
- (6) Haus, H. Mode-locking of lasers. IEEE Journal of Selected Topics in Quantum Electronics 6, 1173–1185 (2000). URL http://ieeexplore.ieee.org/document/902165/.
- (7) Wabnitz, S. Suppression of interactions in a phase-locked soliton optical memory. Optics Letters 18, 601–603 (1993). URL https://www.osapublishing.org/ol/abstract.cfm?uri=ol-18-8-601.
- (8) Leo, F. et al. Temporal cavity solitons in one-dimensional Kerr media as bits in an all-optical buffer. Nature Photonics 4, 471–476 (2010). URL https://www.nature.com/articles/nphoton.2010.120.
- (9) Herr, T. et al. Temporal solitons in optical microresonators. Nature Photonics 8, 145–152 (2014). URL https://www.nature.com/articles/nphoton.2013.343.
- (10) Gordon, J. P. & Haus, H. A. Random walk of coherently amplified solitons in optical fiber transmission. Optics Letters 11, 665–667 (1986). URL https://www.osapublishing.org/ol/abstract.cfm?uri=ol-11-10-665.
- (11) Kim, J. & Song, Y. Ultralow-noise mode-locked fiber lasers and frequency combs: principles, status, and applications. Advances in Optics and Photonics 8, 465–540 (2016). URL https://www.osapublishing.org/aop/abstract.cfm?uri=aop-8-3-465.
- (12) Xue, X., Wang, P.-H., Xuan, Y., Qi, M. & Weiner, A. M. Microresonator Kerr frequency combs with high conversion efficiency. Laser & Photonics Reviews 11, 1600276 (2017). URL https://onlinelibrary.wiley.com/doi/abs/10.1002/lpor.201600276.
- (13) Choi, J. M., Lee, R. K. & Yariv, A. Control of critical coupling in a ring resonator–fiber configuration: application to wavelength-selective switching, modulation, amplification, and oscillation. Optics Letters 26, 1236–1238 (2001). URL https://www.osapublishing.org/ol/abstract.cfm?uri=ol-26-16-1236.
- (14) Dumeige, Y. et al. Determination of coupling regime of high-Q resonators and optical gain of highly selective amplifiers. JOSA B 25, 2073–2080 (2008). URL https://www.osapublishing.org/josab/abstract.cfm?uri=josab-25-12-2073.
- (15) Hsiao, H.-k. & Winick, K. A. Planar glass waveguide ring resonators with gain. Optics Express 15, 17783–17797 (2007). URL https://www.osapublishing.org/oe/abstract.cfm?uri=oe-15-26-17783.
- (16) Barland, S. et al. Cavity solitons as pixels in semiconductor microcavities. Nature 419, 699–702 (2002). URL https://www.nature.com/articles/nature01049.
- (17) Jang, J. K., Erkintalo, M., Murdoch, S. G. & Coen, S. Ultraweak long-range interactions of solitons observed over astronomical distances. Nature Photonics 7, 657–663 (2013). URL https://www.nature.com/articles/nphoton.2013.157/.
- (18) Coen, S. & Erkintalo, M. Universal scaling laws of Kerr frequency combs. Optics Letters 38, 1790–1792 (2013). URL https://www.osapublishing.org/ol/abstract.cfm?uri=ol-38-11-1790.
- (19) Luo, K., Jang, J. K., Coen, S., Murdoch, S. G. & Erkintalo, M. Spontaneous creation and annihilation of temporal cavity solitons in a coherently driven passive fiber resonator. Optics Letters 40, 3735–3738 (2015). URL https://www.osapublishing.org/ol/abstract.cfm?uri=ol-40-16-3735.
- (20) Becker, P. M., Olsson, A. A. & Simpson, J. R. Erbium-Doped Fiber Amplifiers: Fundamentals and Technology (Elsevier, 1999).
- (21) Anderson, M., Leo, F., Coen, S., Erkintalo, M. & Murdoch, S. G. Observations of spatiotemporal instabilities of temporal cavity solitons. Optica 3, 1071–1074 (2016). URL https://www.osapublishing.org/optica/abstract.cfm?uri=optica-3-10-1071.
- (22) Obrzud, E., Lecomte, S. & Herr, T. Temporal solitons in microresonators driven by optical pulses. Nature Photonics 11, 600–607 (2017). URL https://www.nature.com/articles/nphoton.2017.140.
- (23) Wang, Y. et al. Addressing temporal Kerr cavity solitons with a single pulse of intensity modulation. Optics Letters 43, 3192–3195 (2018). URL https://www.osapublishing.org/ol/abstract.cfm?uri=ol-43-13-3192.
- (24) Jang, J. K., Erkintalo, M., Coen, S. & Murdoch, S. G. Temporal tweezing of light through the trapping and manipulation of temporal cavity solitons. Nature Communications 6, 1–7 (2015). URL https://www.nature.com/articles/ncomms8370.
- (25) Jang, J. K. et al. Controlled merging and annihilation of localised dissipative structures in an AC-driven damped nonlinear Schrödinger system. New Journal of Physics 18, 033034 (2016). URL https://doi.org/10.1088%2F1367-2630%2F18%2F3%2F033034.
- (26) Volet, N. et al. Micro-Resonator Soliton Generated Directly with a Diode Laser. Laser & Photonics Reviews 12, 1700307 (2018). URL https://onlinelibrary.wiley.com/doi/abs/10.1002/lpor.201700307.
- (27) Hinkley, N. et al. An Atomic Clock with 10–18 Instability. Science 341, 1215–1218 (2013). URL https://science.sciencemag.org/content/341/6151/1215.
- (28) Marin-Palomo, P. et al. Microresonator-based solitons for massively parallel coherent optical communications. Nature 546, 274–279 (2017). URL https://www.nature.com/articles/nature22387.
- (29) Newman, Z. L. et al. Architecture for the photonic integration of an optical atomic clock. Optica 6, 680–685 (2019). URL https://www.osapublishing.org/optica/abstract.cfm?uri=optica-6-5-680.
- (30) Liu, J. et al. Photonic microwave generation in the X- and K-band using integrated soliton microcombs. Nature Photonics 1–6 (2020). URL https://www.nature.com/articles/s41566-020-0617-x.
- (31) Bao, H. et al. Laser cavity-soliton microcombs. Nature Photonics 13, 384–389 (2019). URL https://www.nature.com/articles/s41566-019-0379-5.
- (32) Xue, X., Zheng, X. & Zhou, B. Super-efficient temporal solitons in mutually coupled optical cavities. Nature Photonics 13, 616–622 (2019). URL https://www.nature.com/articles/s41566-019-0436-0.
- (33) Brasch, V. et al. Photonic chip–based optical frequency comb using soliton Cherenkov radiation. Science 351, 357–360 (2016). URL https://science.sciencemag.org/content/351/6271/357.
- (34) Wang, Z. et al. A III-V-on-Si ultra-dense comb laser. Light: Science & Applications 6, e16260–e16260 (2017). URL https://www.nature.com/articles/lsa2016260.
- (35) Piccardo, M. et al. Frequency combs induced by phase turbulence. Nature 582, 360–364 (2020). URL https://www.nature.com/articles/s41586-020-2386-6.
- (36) Wieczorek, S., Krauskopf, B., Simpson, T. B. & Lenstra, D. The dynamical complexity of optically injected semiconductor lasers. Physics Reports 416, 1–128 (2005). URL http://www.sciencedirect.com/science/article/pii/S0370157305002656.
- (37) Bosenberg, W. R., Drobshoff, A., Alexander, J. I., Myers, L. E. & Byer, R. L. 93% pump depletion, 3.5-W continuous-wave, singly resonant optical parametric oscillator. Optics Letters 21, 1336–1338 (1996). URL https://www.osapublishing.org/ol/abstract.cfm?uri=ol-21-17-1336.
See pages 1 of SI.pdf
See pages 2 of SI.pdf
See pages 3 of SI.pdf
See pages 4 of SI.pdf
See pages 5 of SI.pdf