Exceptional points and enhanced sensitivity in PT-symmetric continuous elastic media
Abstract
We investigate non-Hermitian degeneracies, also known as exceptional points, in continous elastic media, and their potential application to the detection of mass and stiffness perturbations. Degenerate states are induced by enforcing parity-time symmetry through tailored balanced gain and loss, introduced in the form of complex stiffnesses and may be implemented through piezoelectric transducers. Breaking of this symmetry caused by external perturbations leads to a splitting of the eigenvalues, which is explored as a sentitive approach to detection of such perturbations. Numerical simulations on one-dimensional waveguides illustrate the presence of several exceptional points in their vibrational spectrum, and conceptually demonstrate their sensitivity to point mass inclusions. Second order exceptional points are shown to exhibit a frequency shift in the spectrum with a square root dependence on the perturbed mass, which is confirmed by a perturbation approach and by frequency response predictions. Elastic domains supporting guided waves are then investigated, where exceptional points are formed by the hybridization of Lamb wave modes. After illustrating a similar sensitivity to point mass inclusions, we also show how these concepts can be applied to surface wave modes for sensing crack-type defects. The presented results describe fundamental vibrational properties of PT-symmetric elastic media supporting exceptional points, whose sensitivity to perturbations goes beyond the linear dependency commonly encountered in Hermitian systems. The findings are thus promising for applications involving sensing of perturbations such as added masses, stiffness discontinuities and surface cracks.
I Introduction
In the broad context of wave physics and related areas, a recent focus of the scientific community at large has been the exploration of non-Hermitian (NH) systems ashida2020non . Broadly speaking, NH systems are non-conservative due to interactions with the environment producing gain and/or loss. As such, the eigenfrequencies of NH systems are generally complex, precluding many of the well-known properties of Hermitian (conservative) systems to be directly applied. For example, the topological properties of NH systems are remarkably different from that of their Hermitian counterparts lee2016anomalous ; xiong2018does , motivating re-classifications of topological phases for NH systems to be recently proposed gong2018topological ; shen2018topological ; kawabata2019symmetry . Recently, these concepts have been exploited to produce one-way wave amplification and edge localization of bulk modes (called the NH skin effect) in mechanical metamaterials with feedback interactions ghatak2019observation ; brandenbourger2019non ; rosa2020dynamics . In this context, recent studies focus on a particular class of NH systems which preserve Parity-Time (PT) symmetry and exhibit exceptional points longhi2018parity ; el2018non ; miri2019exceptional . The interest in these systems has early roots in the seminal work by Bender and Boettcher bender1998real , where it was shown that PT-symmetric NH Hamiltonians may exhibit purely real spectra. Exceptional points are special degeneracies where two or more eigenfrequencies and eigenvectors system coalesce, defining a transition from a phase where eigenfrequencies are purely real, to one where they are complex conjugates bender2013observation . Among the intriguing properties of exceptional points one finds unconventional phenomena such as unidirectional invisibility lin2011unidirectional ; fleury2015invisible , single-mode lasers feng2014single , and enhanced sensitivity to perturbations hodaei2017enhanced ; chen2017exceptional ; xiao2019enhanced . Such sensitivity is investigated here for continuous elastic media. This work contributes to recent efforts in exploring the role of PT symmetry in acoustics and mechanics zhu2014p ; christensen2016parity ; liu2018unidirectional . Notable applications include the observation of the asymmetric scattering properties around exceptional points in 1D waveguides fleury2015invisible ; wu2019asymmetric ; hou2018tunable , and second-order topological insulators demonstrated in acoustics zhang2019non ; lopez2019multiple . More recently, exceptional points were experimentally demonstrated as vibrating modes of an elastic plate hosting two mechanical oscillators with tailored losses dominguez2020environmentally , while an optomechanical accelerometer based on the enhanced sensitivity around exceptional points was also proposed kononchuk2020orientation . Also, based on parallels between elastodynamics and NH quantum mechanics, exceptional points and their sensitivity to point masses have been recently illustrated for bi-material elastic slabs shmuel2020linking . These works illustrate the potential of elastic domains for hosting exceptional points with enhanced sensing capabilities. However, a treatment from a fundamental structures perspective is still missing, along with potential implementations related to sensing and detection. Towards bridging this gap, we investigate 1D and 2D PT symmetric elastic domains and illustrate the formation of exceptional points arising from the introduction of balanced gain and loss elements. In particular, we first investigate 1D elastic waveguides featuring a PT symmetric pair of ground springs with complex stiffnesses, and illustrate how a large number of exceptional points naturally appear in their vibrational spectra. We investigate their sensitivity to perturbations in the form of point mass inclusions, and demonstrate both numerically and through a perturbation approach that the sensitivity has a leading term of square root order, as expected of second-order exceptional points chen2017exceptional ; shmuel2020linking . These finding are useful when extended to 2D elastic domains, where gain and loss may be implemented through piezoelectric transducers to detect mass inclusions and surface cracks. In this context, our results open new avenues in the area of dynamic-based non-destructive testing. Changes in modal properties have long been investigated as tools to detect structural changes resulting for example from the onset of cracks. Methods based on shifts in natural frequencies provide in principle a convenient detection scheme that requires limited sensing, but they have broadly shown strong sensitivity limitations. Other techniques have explored monitoring of mode shapes and curvature shapes sharma2006perturbation , which while promising, suffer from high spatial measurement resolution requirements. Examples that exploit the perturbation of modal parameters, such as those caused by cracks in elastic beams and plates are illustrated in luo1997integral ; sharma2006perturbation . A review of other well-establish methods for sensing and damage detection can be found in staszewski2004health ; giurgiutiu2007structural . Also, guided waves have been employed for damage detection in plates ruzzene2007frequency and composite materials kessler2002damage , while surface acoustic waves have been employed for sensing liquid viscosity jakoby1998viscosity and surface mass loading du1996study . Several of these contributions exploit a linear sensitivity with respect to a perturbation parameter, which may potentially be improved in the context of exceptional points with enhanced sensitivity of square root leading order. Therefore, the findings presented in this paper may open new avenues for the general exploration of PT symmetry, exceptional points and their sensitivity in continuous elastic media, with potential applications ranging from sensors to novel structural health monitoring strategies.
This paper is organized as follows: following this introduction, section II presents the analysis of PT-symmetric 1D waveguides, describing the formation of exceptional points and their sensitivity using a perturbation approach. Section III then presents the analysis of 2D elastic domains with PT-symmetric pairs of piezoelectric patches, where exceptional points and their sensitivity to perturbations is numerically investigated. Finally, section IV summarizes the main findings of the work and briefly outlines future research directions.
II PT symmetric elastic rods
We begin our study by considering a 1D elastic waveguide equipped with a pair of ground springs (Fig. 1). We employ conceptual complex spring constants, whose imaginary components with opposite signs induce gain and loss in equal proportions, thus making the structure PT symmetric dominguez2020environmentally . We illustrate how exceptional points emerge in such a system, and investigate their sensitivity to a perturbation in the form of a point mass inclusion ().

II.1 Governing equations and approximate solution approach
The equation governing the motion of the waveguide can be generally expressed as meirovitch1975elements :
| (1) |
where is the longitudinal displacement, is the external loading and is the linear mass. Here, and respectively denote the mass density and cross-sectional area, while is the mass at location defined by the function. Assuming longitudinal motion, the linear differential operator is given by:
| (2) |
where is the Young’s modulus, and are respectively the spring constant and the location of the -th () ground spring. While we here focus our attention to axial motion, this formulation lends itself to the analysis of other wave motion, such as flexural (transverse) vibrations for which the operator includes a fourth-order derivative Pal_2019 . Numerical results for flexural vibrations of elastic beams are presented at the end of this section.
We seek for approximate solutions to Eqn. (1) by expressing the axial displacement through a set of comparison functions
| (3) |
for a rod of length , that is fixed at bound ends, i.e. .
Assuming an external harmonic load , the application of Galerkin’s method meirovitch1975elements leads to a set of algebraic equations, which can be expressed in the following matrix form:
| (4) |
where , while and are the mass and stiffness matrices, whose -th entries are given by:
| (5) |
with denoting the Kronecker delta. Also in Eqn. (4), is the external load projected in the basis of the comparison functions, i.e. . For the purposes of the present work, we consider a point force applied at a location , i.e. , which gives .
II.2 Perturbation approach
We carry out a perturbation approach to predict the frequency splitting at an exceptional point due to the perturbation associated with the point mass inclusion . While we consider perturbations in the mass matrix only, similar derivations can be carried out for stiffness perturbations that affect matrix . We consider a first order expansion of the mass matrix around , where is the non-dimensional parameter associated with the added mass. As such, the eigenvalue problem associated with the homogeneous form of Eqn. (4) is rewritten as
| (6) |
where , while is the contribution due to the added mass, i.e. .
An exceptional point is a degenerate eigenvalue of algebraic multiplicity and geometric multiplicity , producing a single linearly independent eigenvector. The perturbation around such type of degeneracy follows a Newton-Puiseux series of leading order seyranian2003multiparameter , in contrast with common degeneracies producing two linearly dependent eigenvectors where the perturbation follows with leading order , i.e. . We here focus on second order exceptional points with , resulting in the following expansions of eigenvectors and eigenfrequencies
| (7) | ||||
| (8) |
Substitution of the series expansions into Eqn. (6) yields the following set of ordered equations
| (9) | |||
| (10) | |||
| (11) | |||
| (12) | |||
Note that to obtain up to the second correction , equations up to are needed. The equation corresponds to the eigenvalue problem of the unperturbed system, i.e. the rod with no added mass. This eigenvalue problem is solved numerically as a function of the spring constant to find the existence of exceptional points. A second order exceptional point produces a double eigenvalue and a single eigenvector . The corresponding left-eigenvector satisfying is also obtained numerically, where denotes the conjugate transpose. It is useful to consider the Jordan chain of length associated with the degeneracy seyranian2003multiparameter , i.e. and , where and are associated (or generalized rank 2) right and left eigenvectors satisfying the equations
| (13) |
with the following normalization conditions
| (14) |
A choice of associated eigenvectors is determined numerically by using the pseudo-inverse of the matrix . While the Jordan chain is not unique seyranian2003multiparameter , for a given choice of right eigenvectors the left eigenvectors are uniquely determined by the normalization conditions stated in Eqn. (14). To determine the perturbed eigenvector uniquely, it is convenient to consider the normalization . Since from Eqn. (14), this gives the following conditions for the eigenvector perturbations:
| (15) |
Starting with the equation, we remark that the matrix operator is singular with rank due to the degeneracy at . To circumvent this issue, the normalization condition for given by Eqn. (15) is pre-multiplied by and added to the equation, yielding
| (16) |
where becomes a non-singular matrix due to the addition of the term seyranian2003multiparameter . The same procedure applied to the equation (Eqn. (13)) gives , which when compared to Eqn. (16) (and noting that is non-singular) gives
| (17) |
Substitution of Eqn. (17) into the equation, left multiplication by and considering the normalization conditions described previously yields the frequency correction:
| (18) |
Next, we establish the order correction . To that end, the equation is first multiplied by from the left, which upon normalization gives:
| (19) |
Now, multiplying the equation by from the left, and using Eqn. (17), Eqn. (18) and Eqn. (19), along with normalization conditions, gives
| (20) |
According to the equations above, we conclude that the degeneracy at initially splits symmetrically with respect to with a dependence due to the corrections, which are equal and opposite in sign (Eqn. (18)). For higher values a linear correction (depending on ) becomes relevant, which is equal for both branches (Eqn. (18)). The difference between the frequency of the two branches considering only the first two perturbation orders is therefore expressed as
| (21) |
since the correction is the same for both branches. As further described in the next section, the frequency splitting is a parameter commonly used for sensing, which is said to be enhanced due to the dependence with hodaei2017enhanced ; chen2017exceptional ; kononchuk2020orientation ; shmuel2020linking .
II.3 Numerical results and analysis
The elastic waveguide has two ground springs attached to locations and , with spring constants and (Fig. 1). To guarantee PT symmetry, we consider , such that the locations of the ground springs are symmetric with respect to the center, where the mass is attached (). The role of parity is to produce spatial inversions, say with respect to the center , which when combined with time reversal () produces the same structure and operator, confirming the PT-symmetry. As expected bender1998real , we find that the eigenvalues of the PT-symmetric rod are either real or come in complex conjugate pairs, and exceptional points are found defining a transition from the first case to the latter as the spring constant is varied. In our numerical simulations, we consider and a set of basis functions in Eqn. (3). Results are displayed in terms of non-dimensional frequency , with , and non-dimensional ground spring stiffness , where is a measure of the rod stiffness.
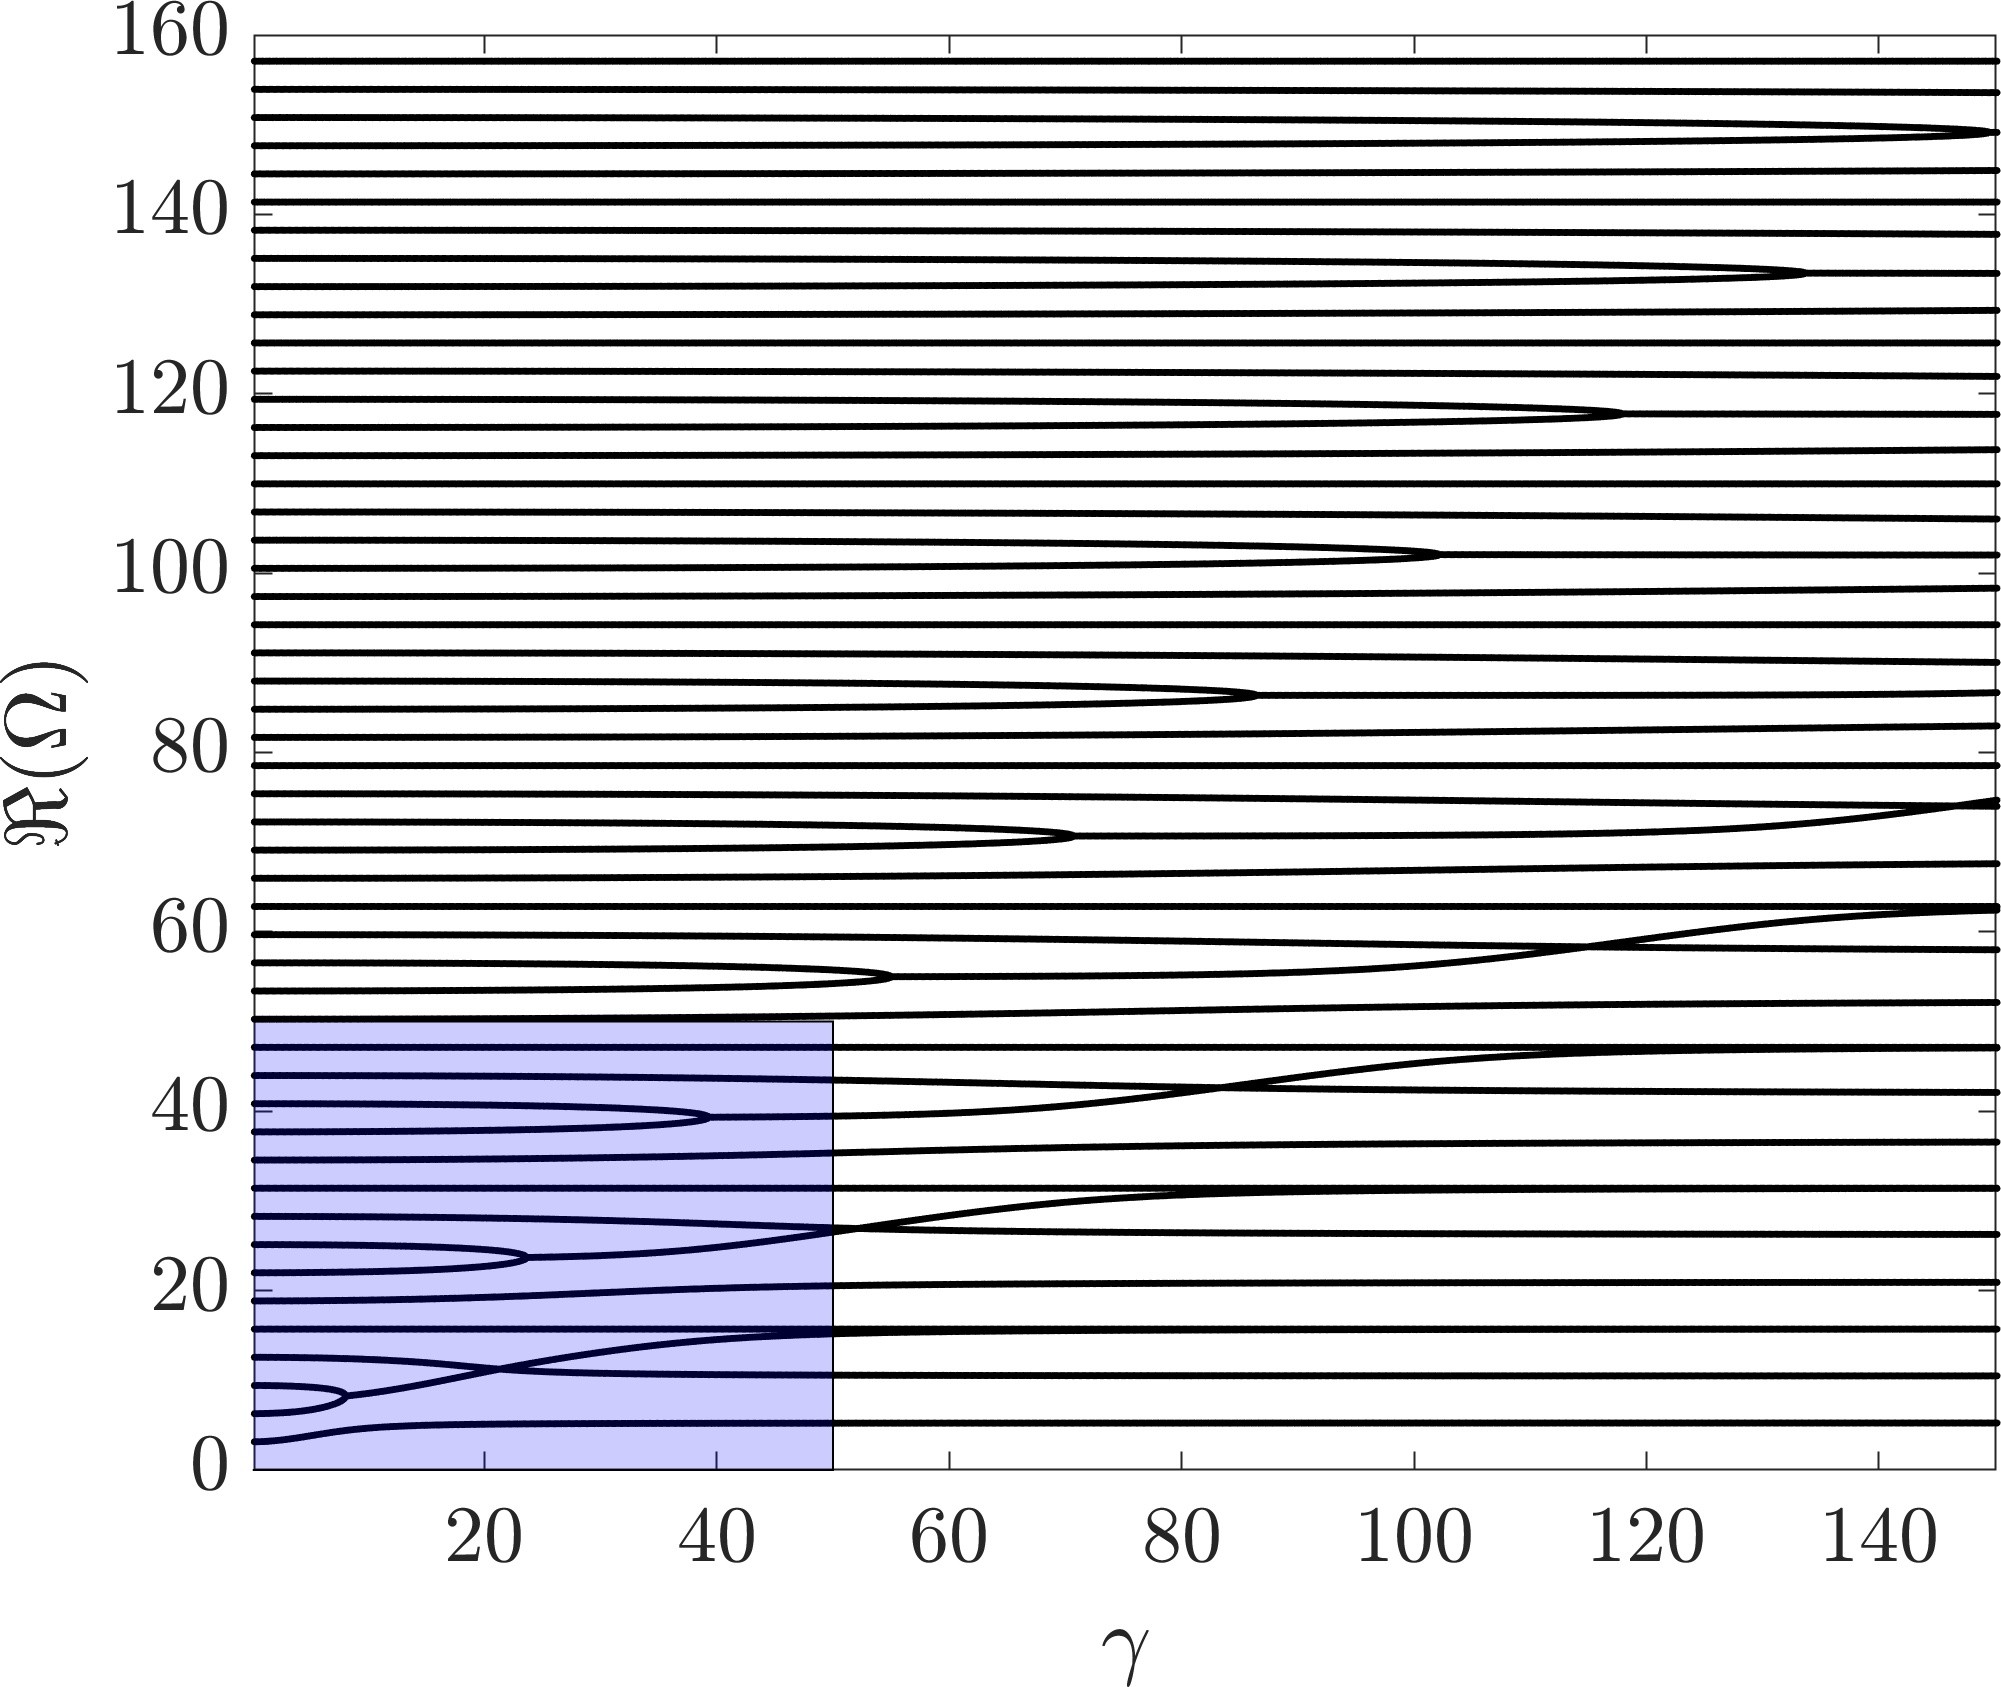
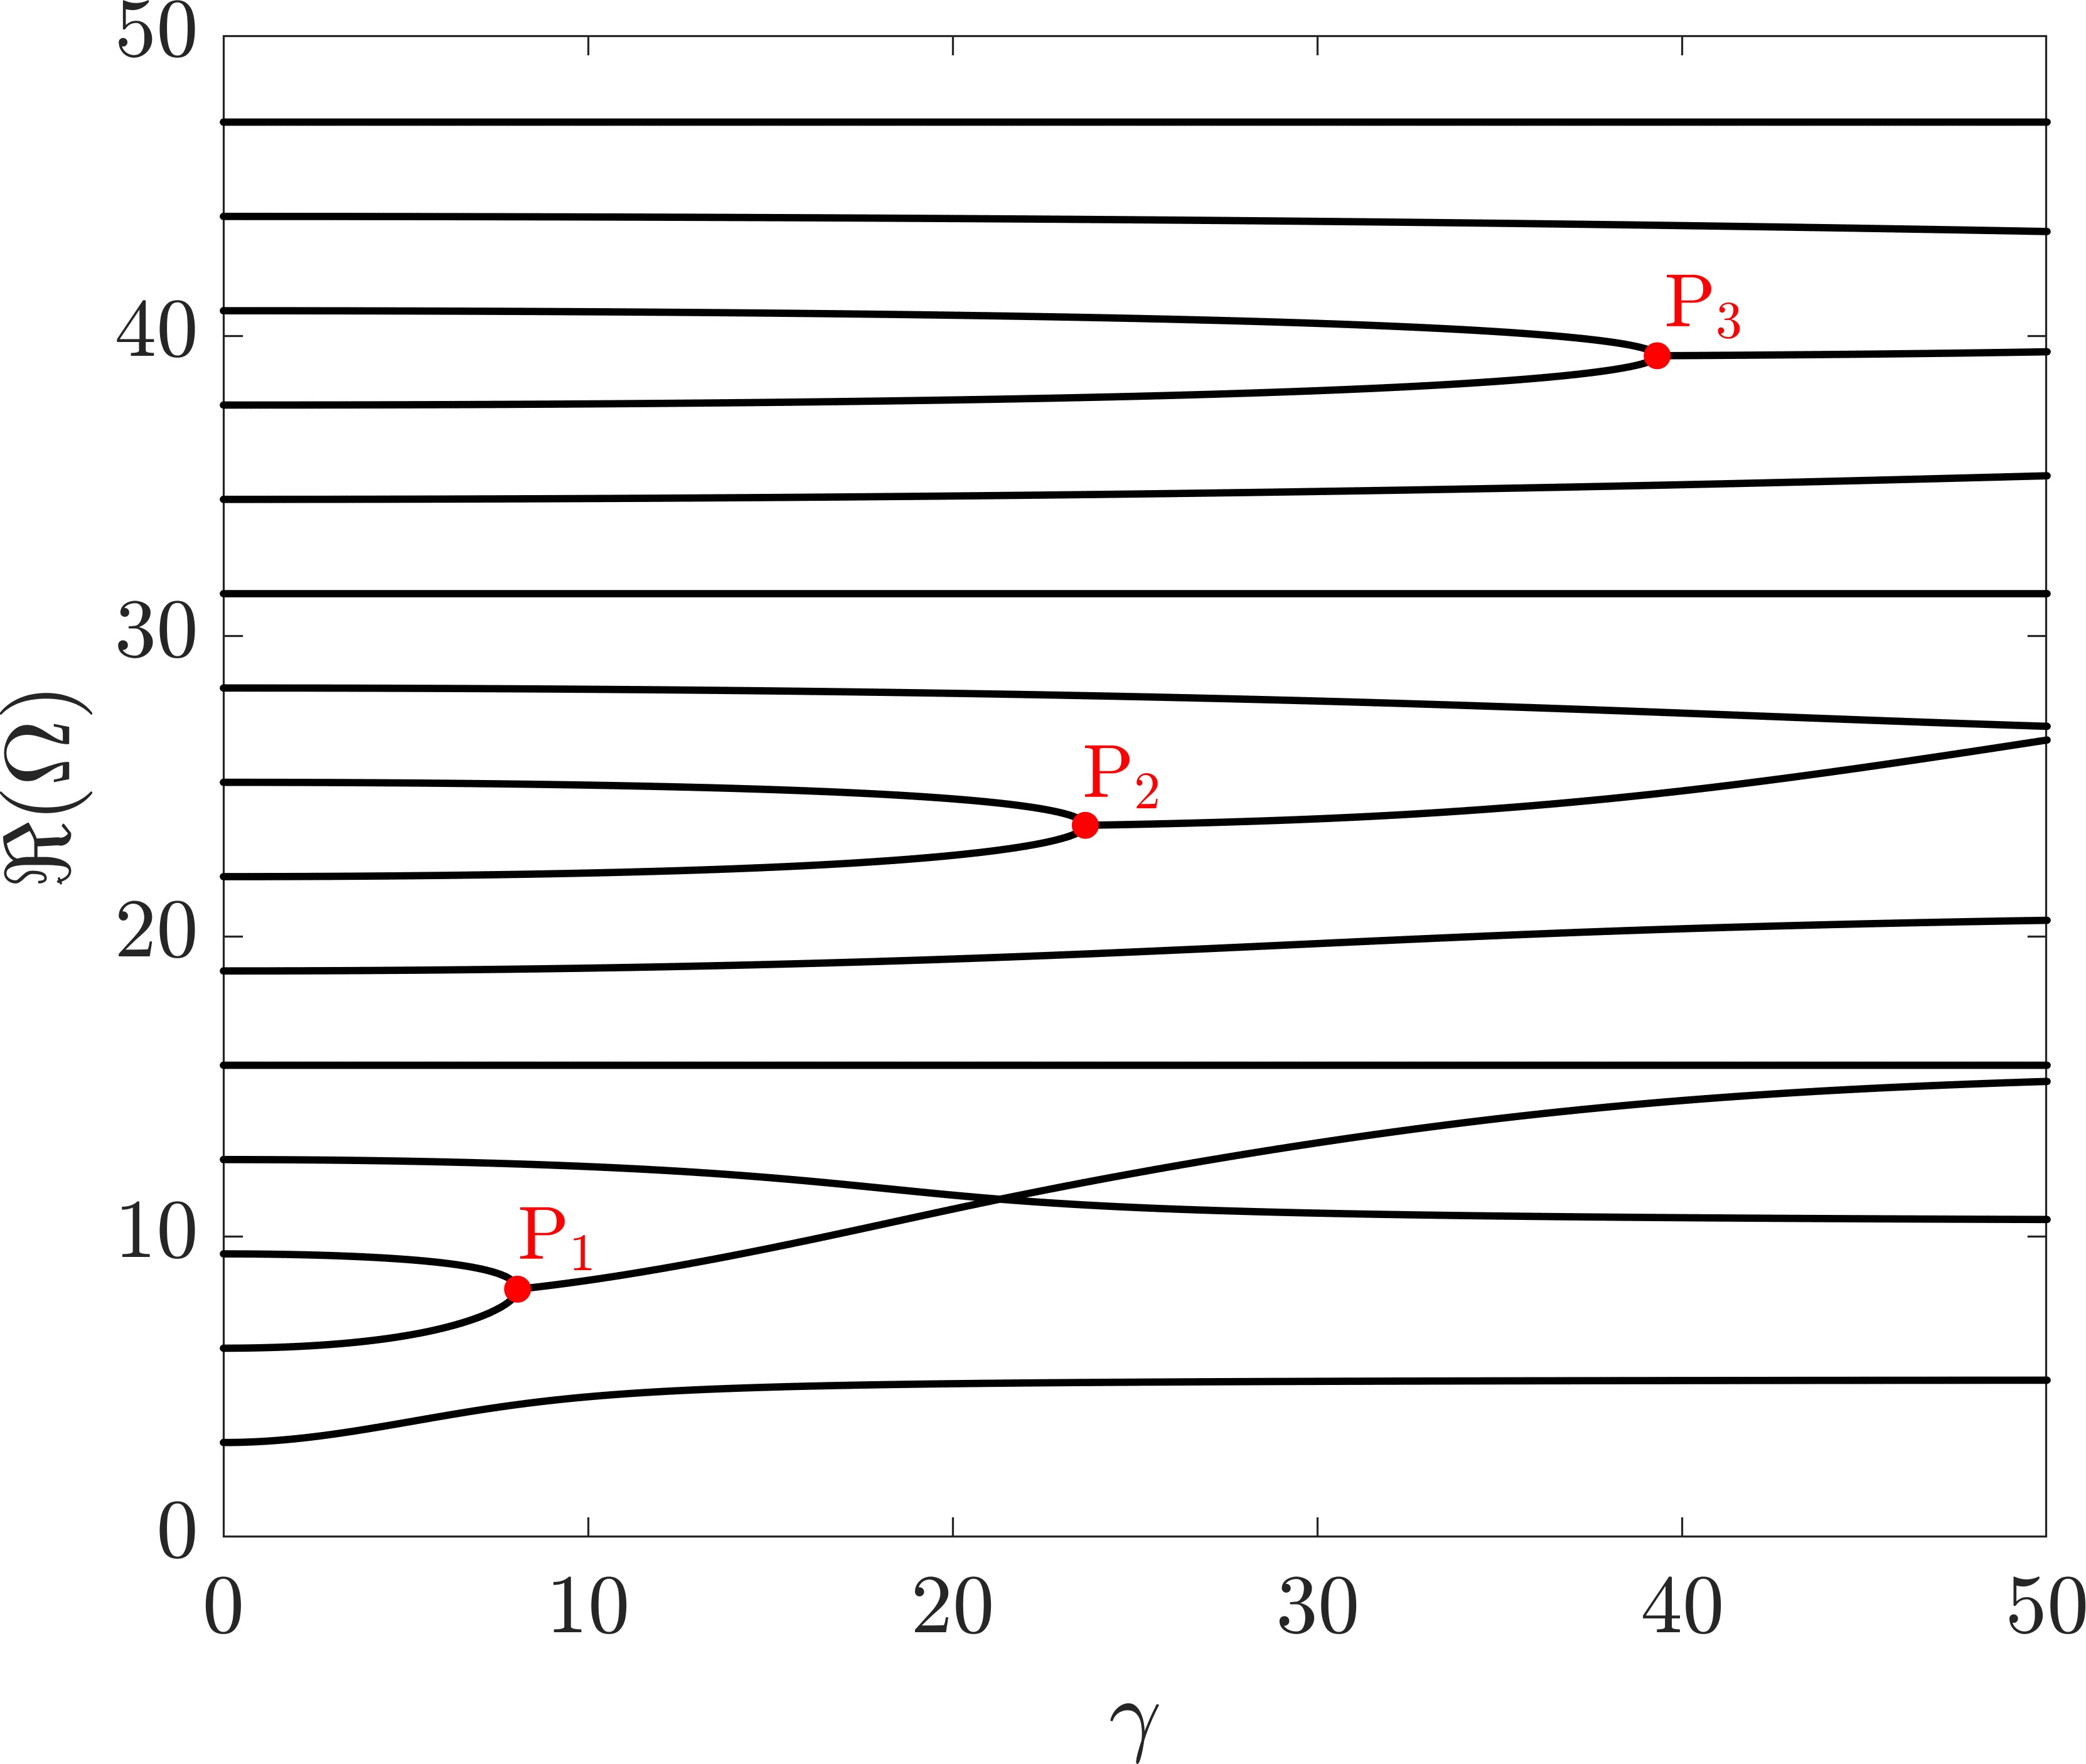

Figure 2 displays the real part of the numerically computed eigenfrequencies for the first 50 modes of the PT symmetric rod as a function of . A notable feature is the presence of several exceptional points (EPs) occurring at increasing values of for modes of increasing order. In Figs. 2(b,c), the real and imaginary eigenfrequency components are respectively displayed zoomed in the region of the first three exceptional points (blue shaded region in Fig. 2), and are labeled as and . Note that these points mark the transition from the region where the two branches forming the EP are purely real, to the region where they become complex conjugate. This is usually referred to as a PT phase transition, from the unbroken (purely real) to the broken (complex conjugate) PT phases bender2013observation . For a continuous medium, the spectrum exhibits several PT phase transitions occurring for different values of .


In Fig. 3, we illustrate the variation of the mode shapes in the vicinity of the first two exceptional points. In particular, Figs. 3(a,c) display zoomed views of the first and second EPs, where solid black and dashed blue lines differentiate the two branches obtained from the numerical solution. Mode shapes corresponding to the points marked in Figs. 3(a,c) are displayed in Figs. 3(b,d), where each panel displays the two mode shapes for a particular , respectively denoted by the solid black and dashed blue lines representing the corresponding line type in (a,c). As increases, the modes hybridize and coalesce at the EP, where, as expected, they become identical. After the exceptional point, the two modes seem to be inverted copies of each other with respect to the center of the rod, although we dot not explore this property in further detail.
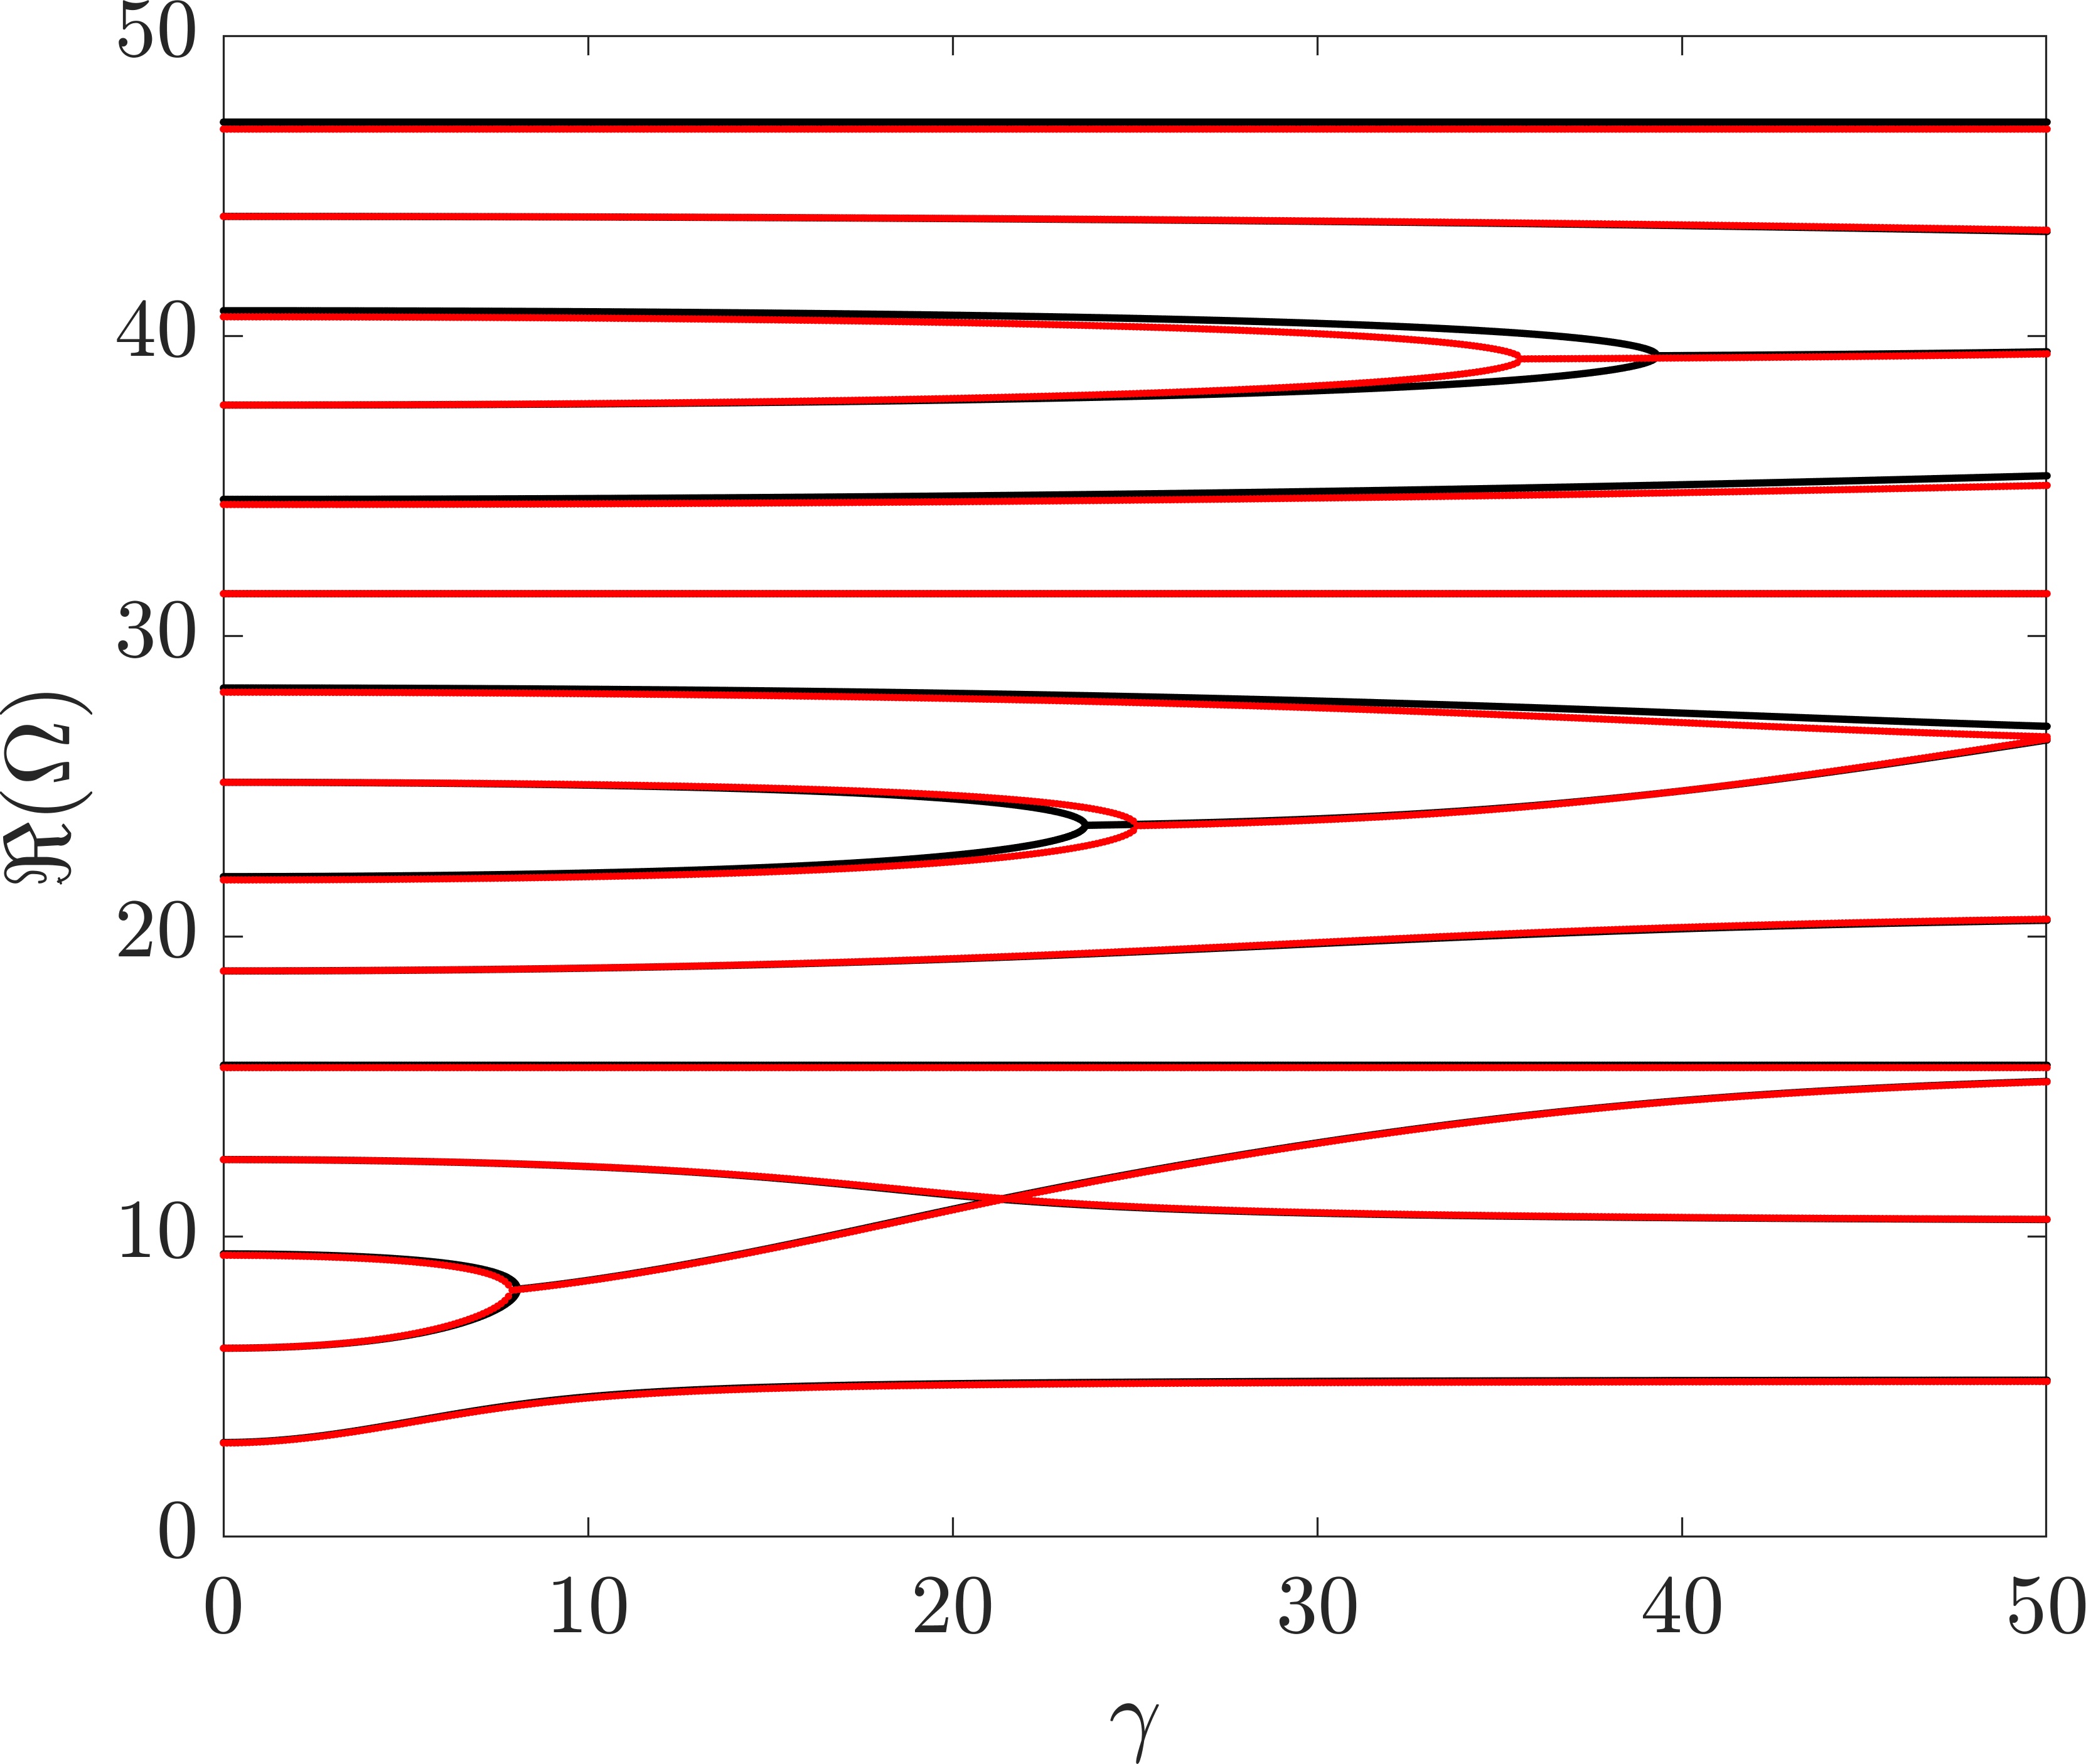
Next, we explore the sensitivity of the EPs to the point mass inclusion . In Fig. 4, we repeat the eigenfrequencies of the PT rod plotted as a function of (black), superimposed to the frequencies for a mass inclusion (red). This very small inclusion in general introduces small changes to the resonant frequencies; however, larger changes are observed around the EPs. Figures. 4(b,c) display zoomed views of the first and second EPs. In the first case (Fig. 4), the exceptional point is moved to a lower value of , while in the second case (Fig. 4) it is moved to a higher . Experimentally, these changes can be detected by measuring the resonant peaks in the frequency response hodaei2017enhanced . This is illustrated in the right panels of Figs. 4(b,c), which display the frequency response at a point resulting from a point force applied at , obtained from the solution of Eqn. (4). Dashed blue lines are added to identify the fixed value used in the computation. In Fig. 4, this line intersects the exceptional point in the added mass case (red dot) and two distinct frequencies on the baseline case with no mass (black dots). The frequency response highlights the split of the resonant peak (red) into two distinct resonant peaks (black) matching the frequencies obtained from the eigenvalue analysis. A similar behavior is demonstrated in Fig. 4, except that now the dashed blue line intersects the EP for the baseline (no mass) case, and the corresponding resonant peak (black) splits into two peaks (red) upon addition of the attached mass.


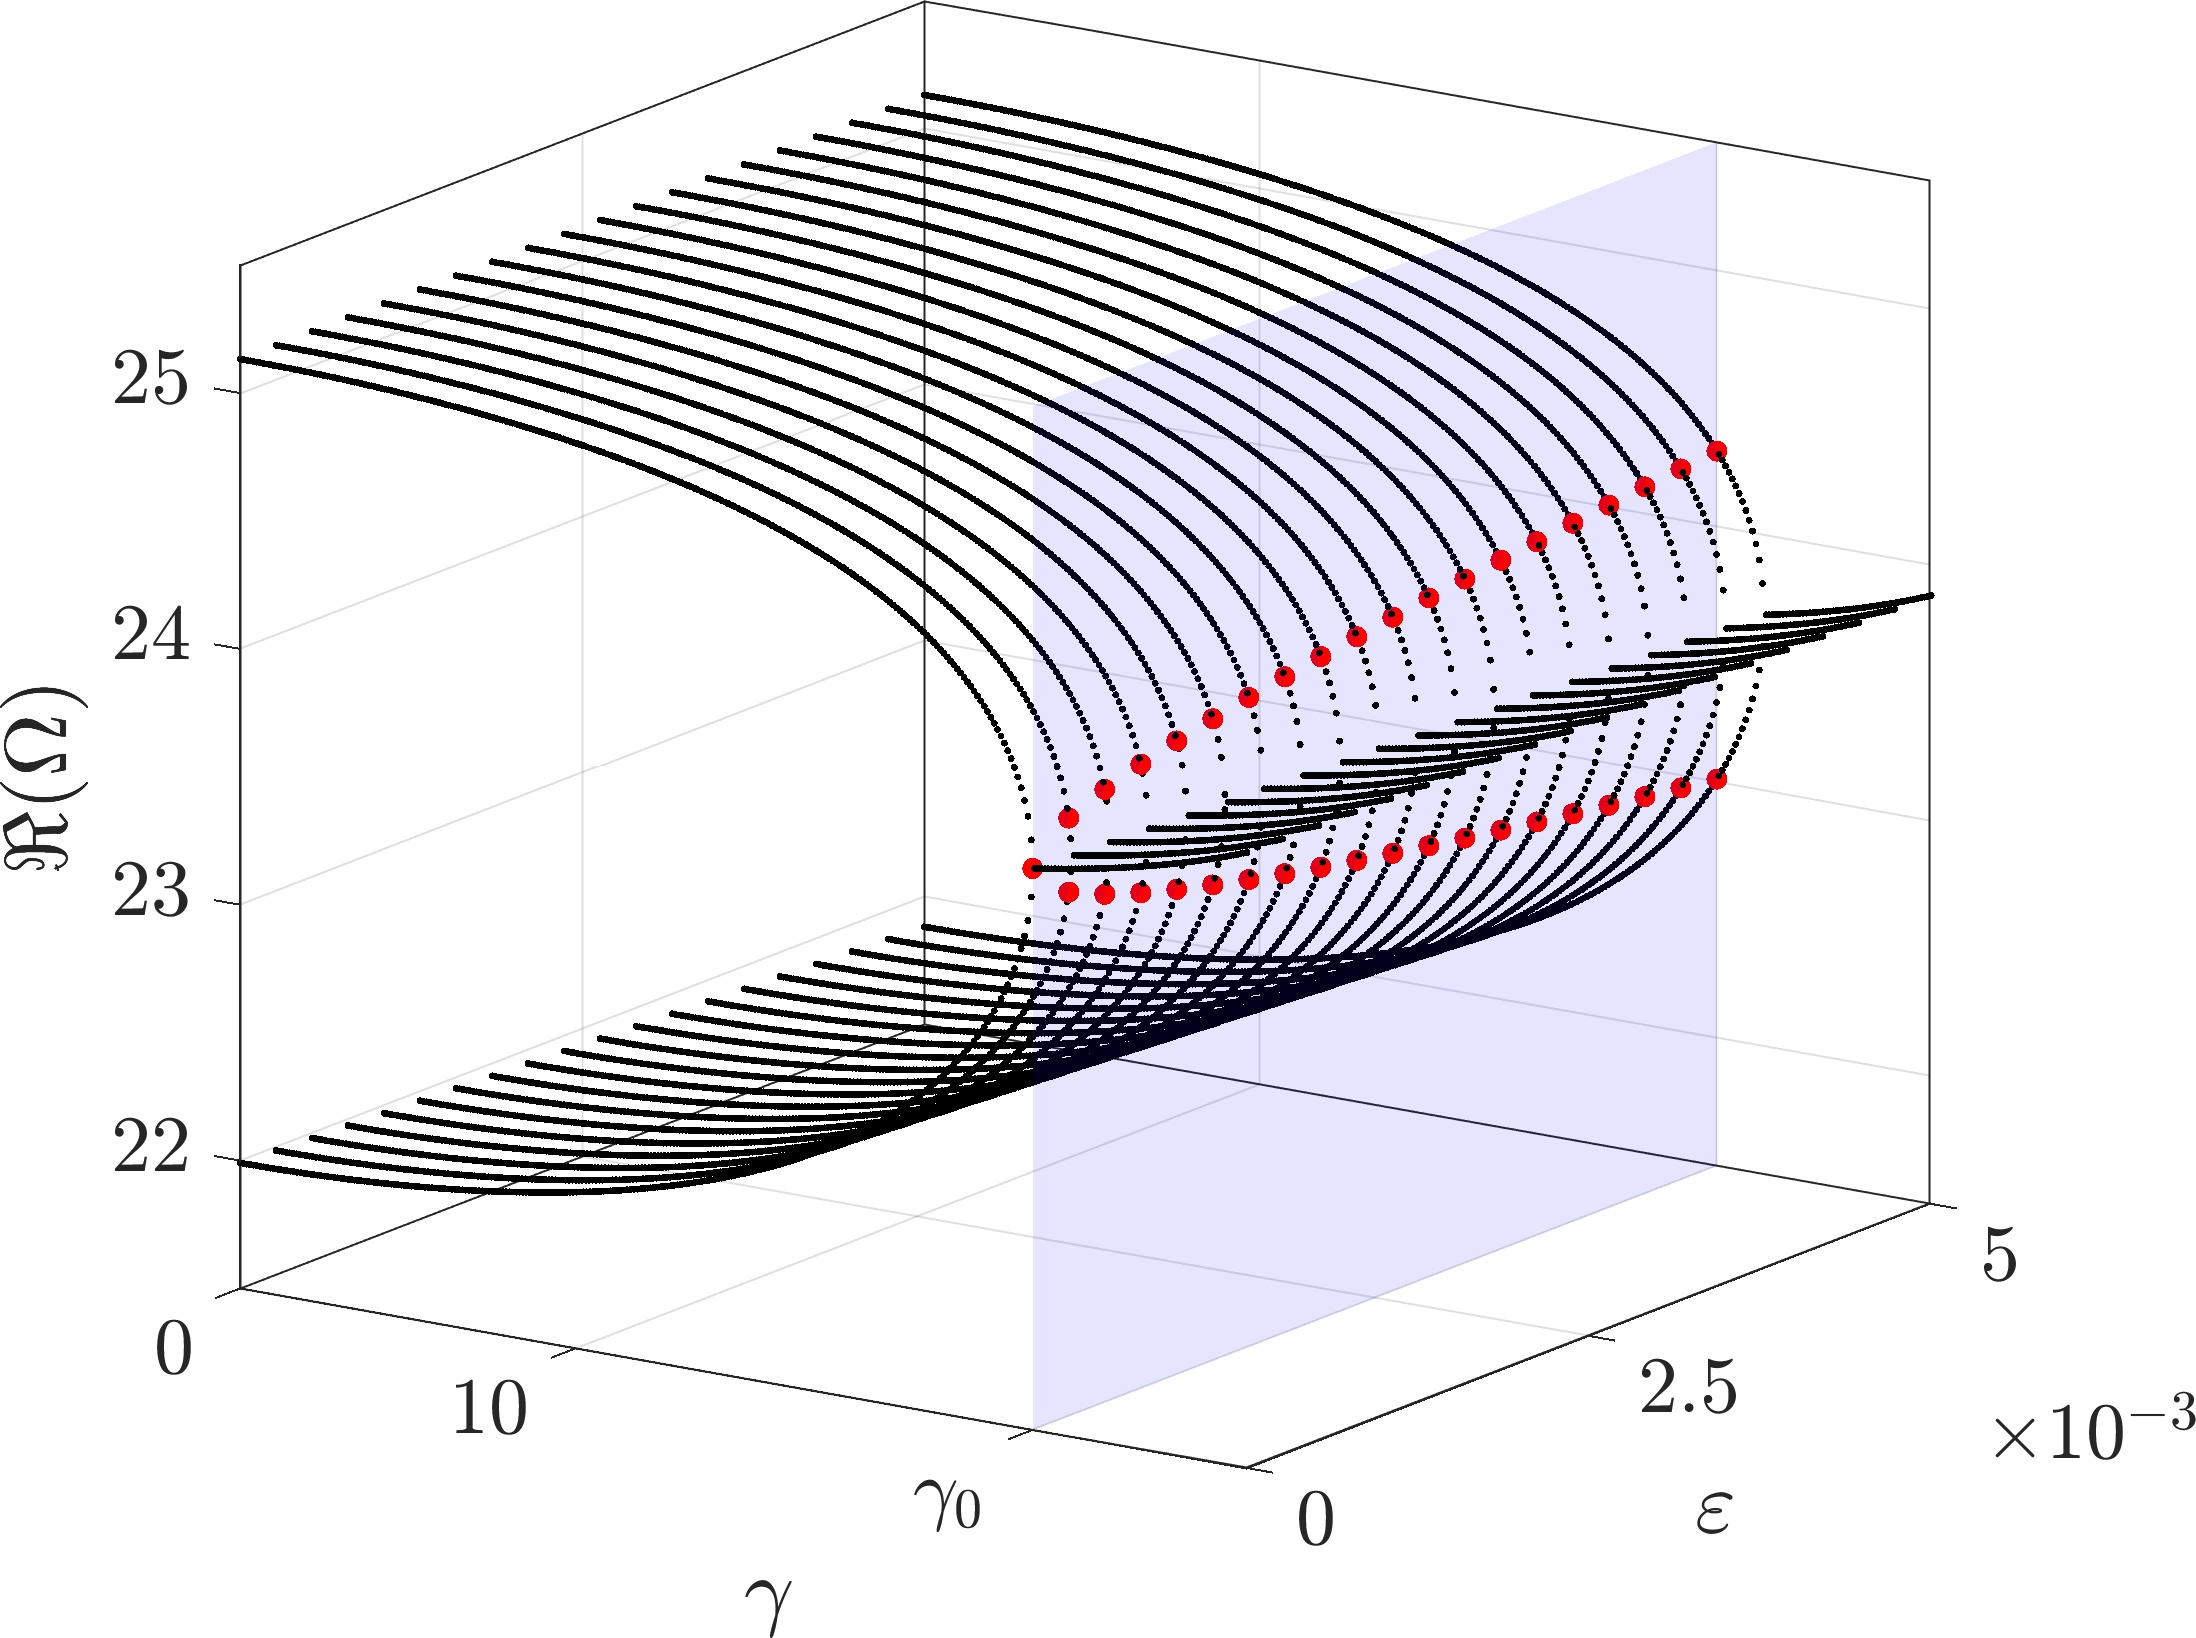


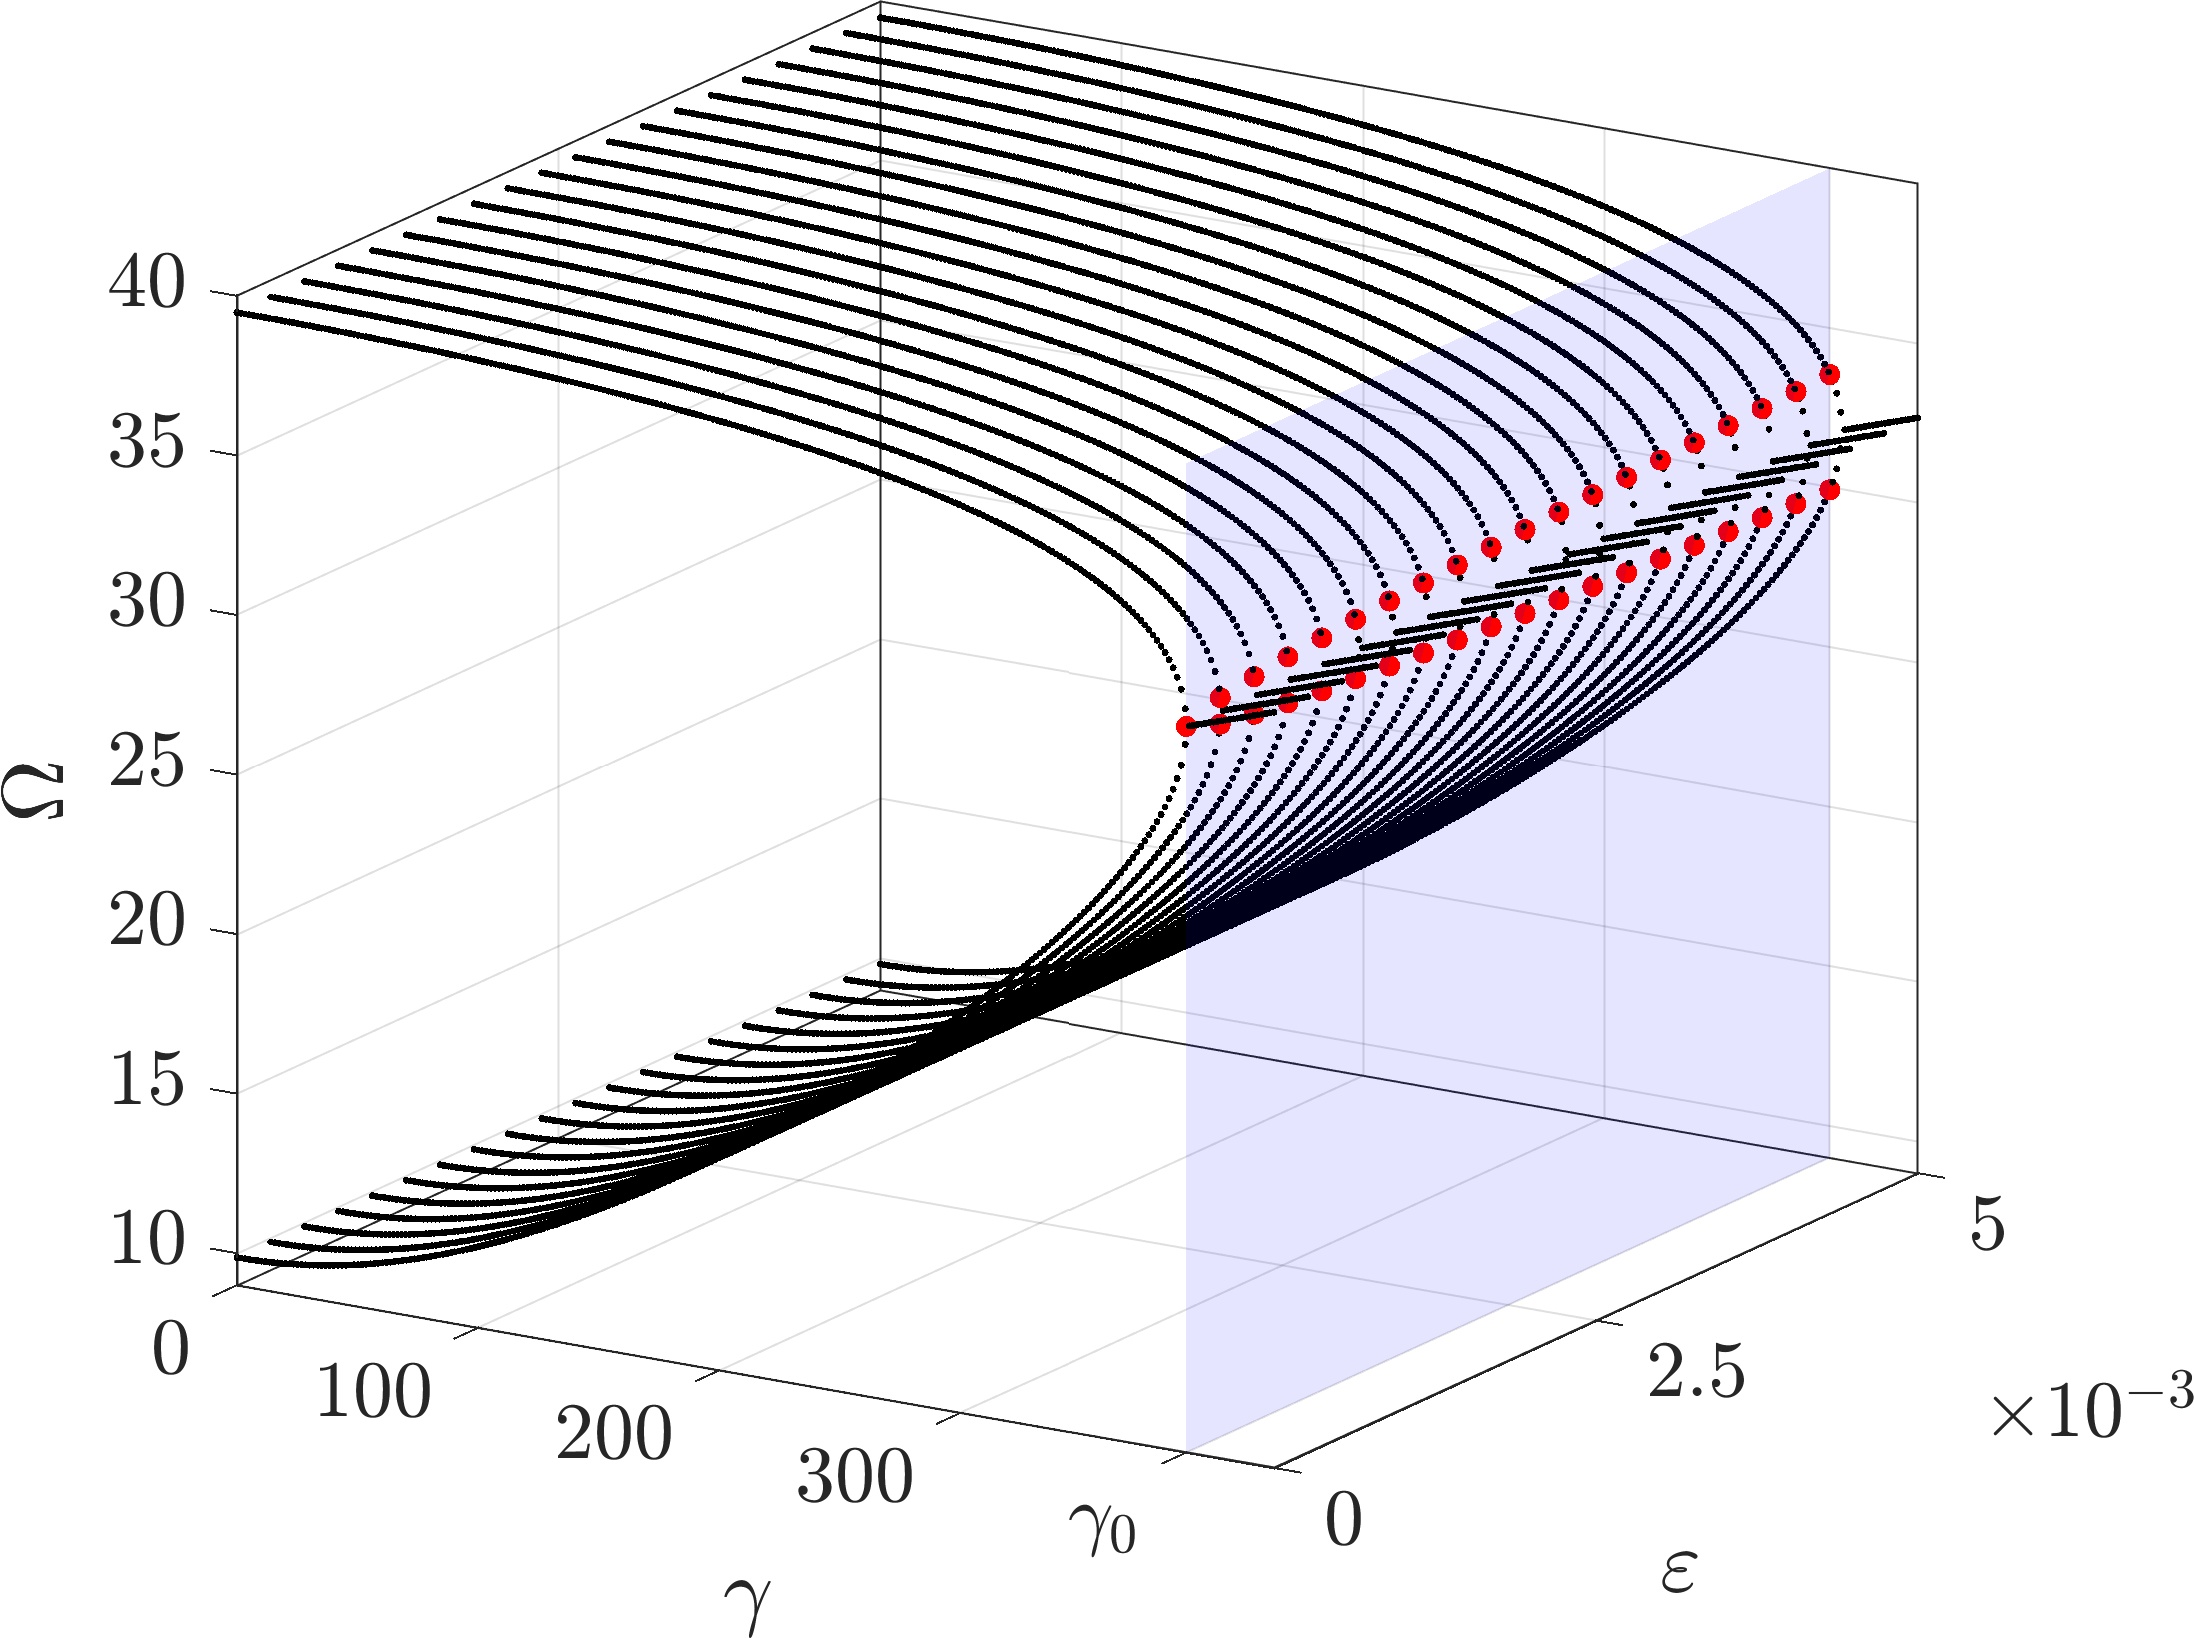
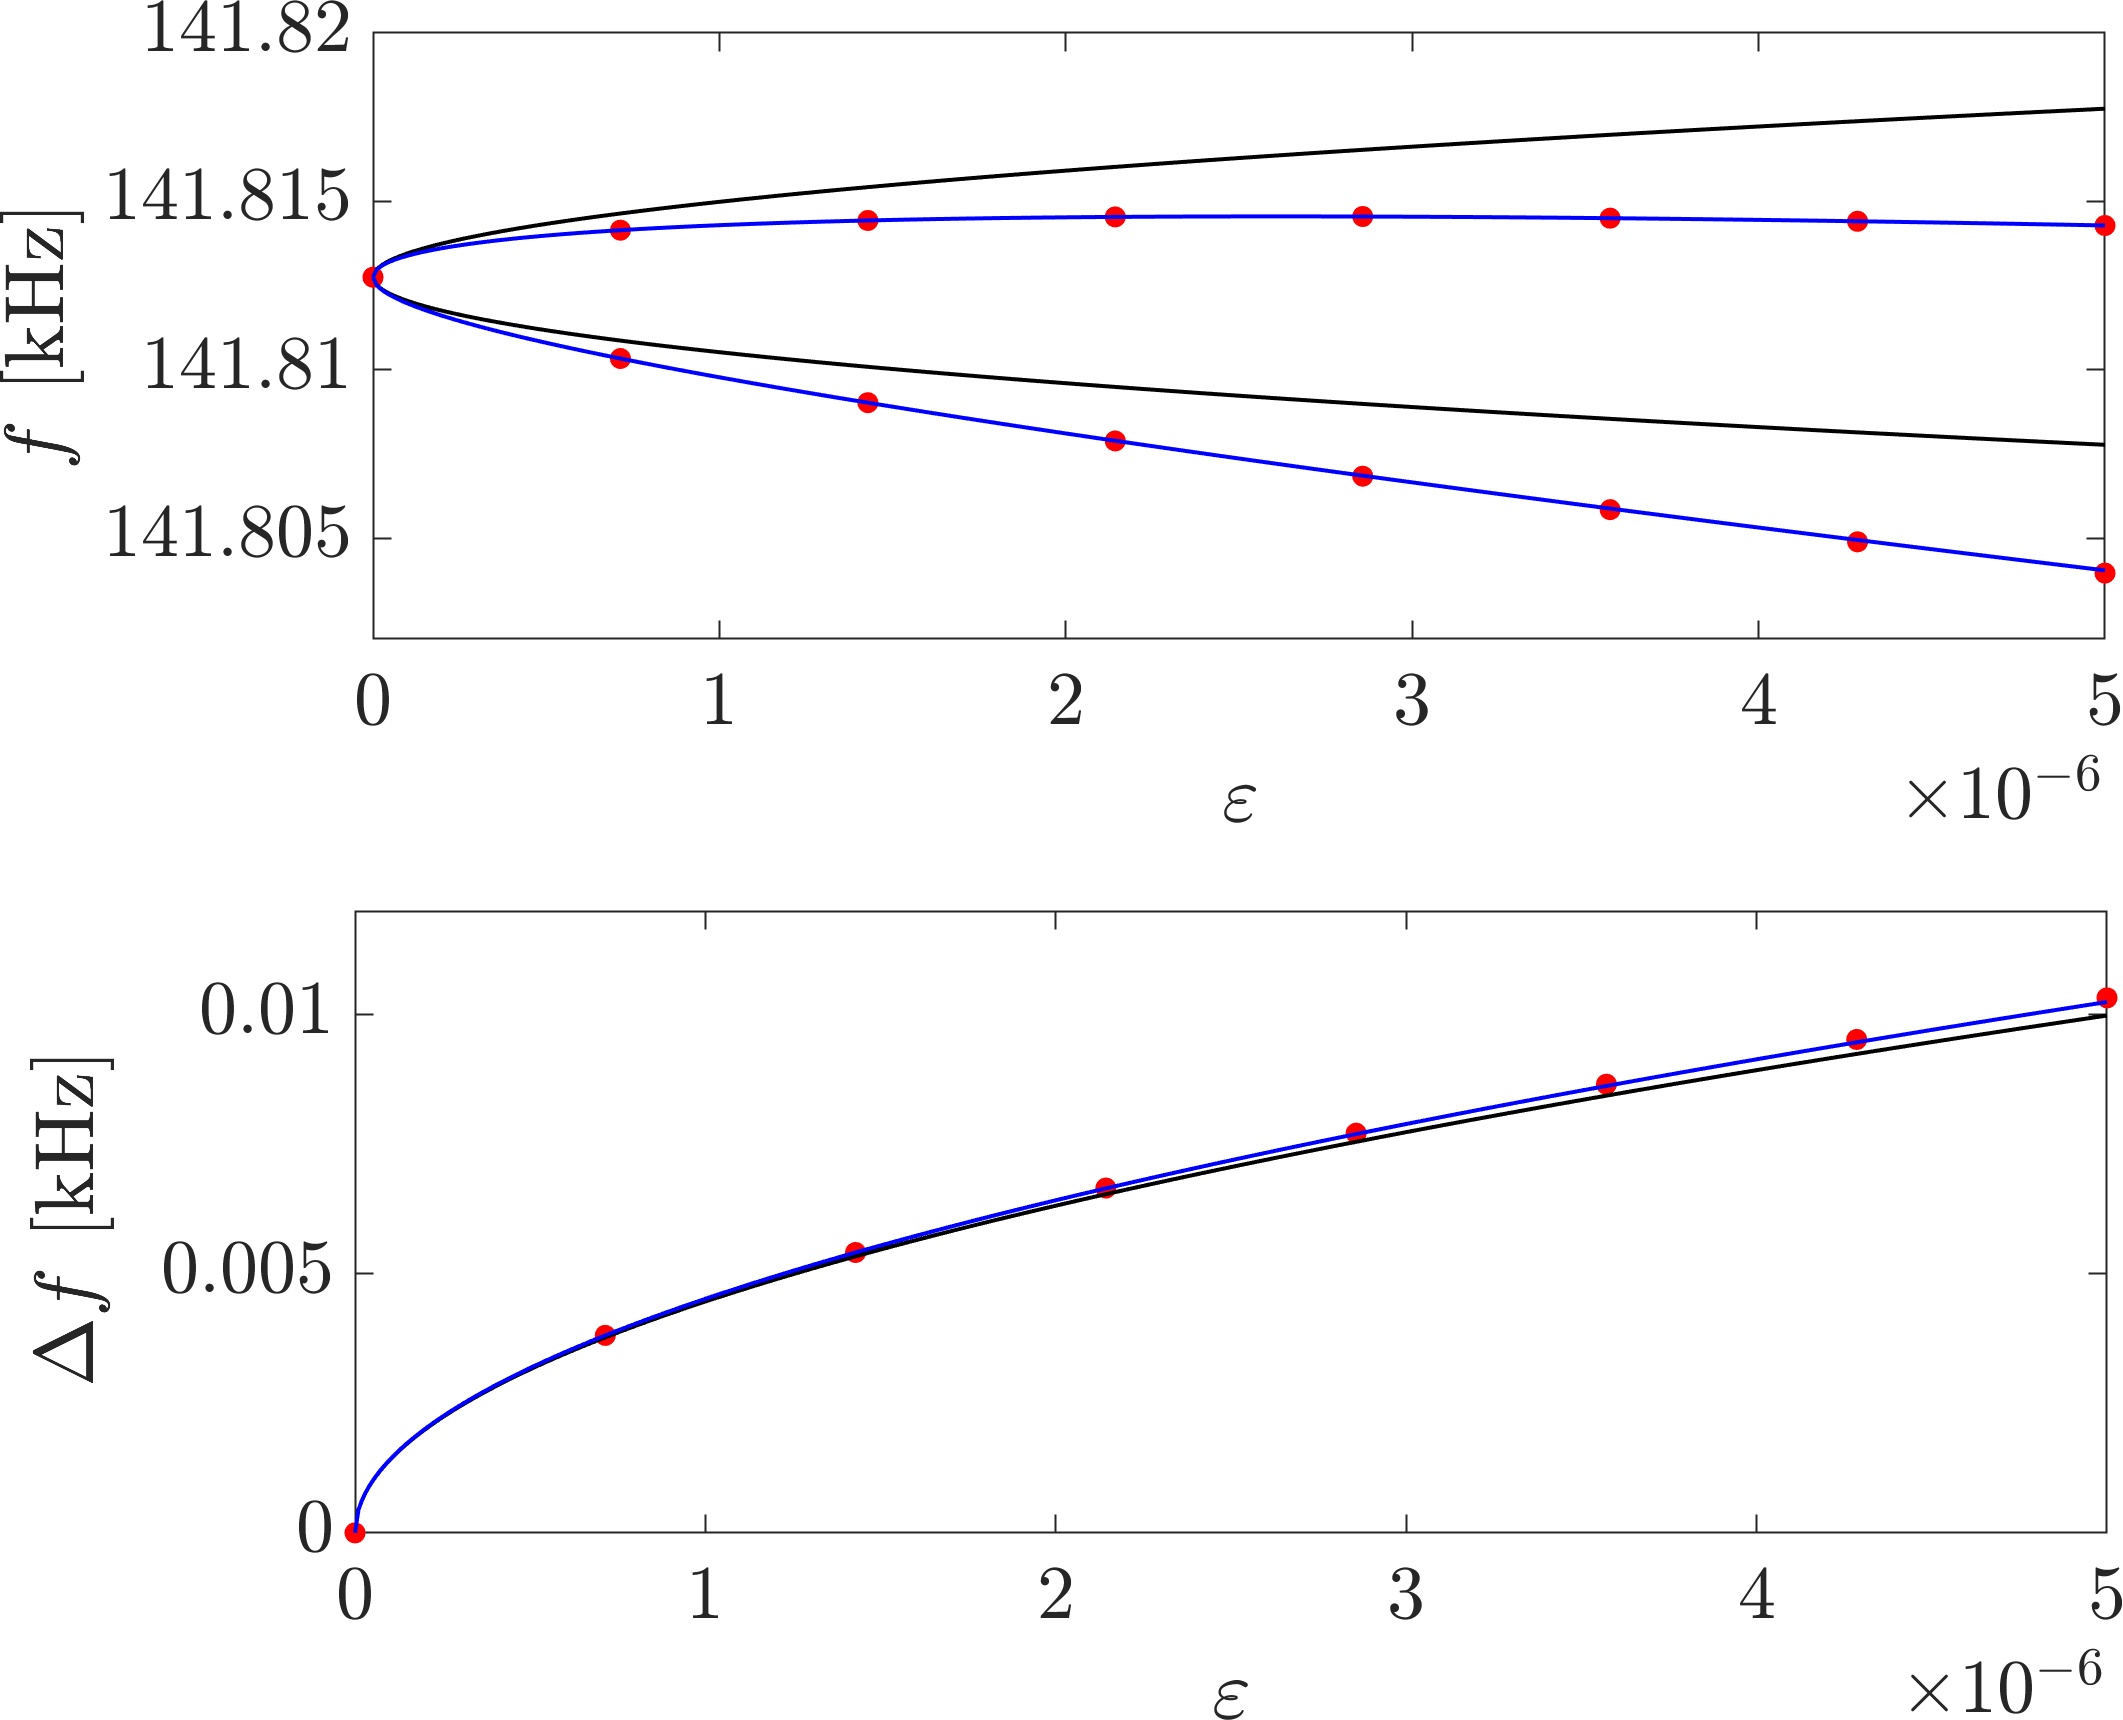
The resonance split around the EPs suggest possible schemes for detection and quantification of the added mass hodaei2017enhanced ; chen2017exceptional ; kononchuk2020orientation ; shmuel2020linking . Figure 5 displays the eigenfrequencies of the PT rod as a function of for the second exceptional point, for . The shaded blue plane corresponds to defining the EP for , and its intersection with the frequency plots highlight the frequency split as a function of (red dots). Indeed, the frequency difference corresponding to the split can provide a way to quantify , as illustrated in Fig. 5, showing potentials for higher sensitivity due to the dependence. For comparison, the eigenfrequencies bifurcating from the EP are repeated in the top panel of Fig. 5, along with the predictions given by the perturbation approach (solid curves). Specifically, the black curve corresponds to the approximation, while the blue curve contains also the dependence. While higher order terms would be required for complete agreement, the perturbation approach produces a good match considering terms up to , and confirms the expected dominant dependence upon for . The frequency splitting as a function of the perturbations is often considered as the main sensing parameter hodaei2017enhanced , and is displayed in the bottom panel of Fig. 5, with the black line corresponding to the prediction given by the perturbation approach (Eqn. (21)). The change in such parameter is theoretically infinite at the onset of the splitting, i.e. , which is of course limited by the resolution of the frequency measurements shmuel2020linking .
The presented approach can also be applied to other 1D waveguides such as elastic beams undergoing flexural motion. This is conveniently done by employing Euler-Bernoulli beam theory, where the operator defined in Eqn. (2) is replaced by a fourth-order operator. The described numerical procedures are then analogously applied in terms of the vertical displacement of the beam (see Pal_2019 for more details). Figure 6 displays the results for an elastic beam equipped with the PT symmetric pair of ground springs, where non-dimensional quantities are now defined as , with , and , with , while denotes second moment of area of the beam cross section. Figure 6 displays the variation of an exceptional point formed by the first two modes of the beam as a function of . Similarly to the case of the rods, the EP bifurcates into two branches as a function of (red dots), which can be detected by the splitting of resonant peaks in the forced response (Fig. 6). The sensitivity of the EP is illustrated in Fig. 6, where both numerical results (red dots) and the perturbation analysis results (black curve) confirm the dependence.


III Guided waves in PT symmetric elastic domains
The investigations are extended to 2D elastic domains supporting guided waves. Gain and loss are now conceptually introduced through a PT symmetric pair of piezoelectric patches (Fig. 7). Piezoelectric transducers are commonly used for the generation of lamb wavesgiurgiutiu2007structural ; raghavan2005finite ; collet2011generation , for active structural control marconi2020experimental ; xia2020experimental , and, more recently, for the investigating the scattering properties of exceptional points wu2019asymmetric ; hou2018tunable , to name a few. Therefore, they are excellent candidates for inducing gain and loss through distributions of surfaces stresses that mimick the gain and loss interactions.
III.1 Governing equations and transducer modeling

We consider a rectangular elastic domain in the plane (Fig. 7) in plain strain conditions. Unit thickness along the out-of-plane direction is considered for simplicity. The top surface of the domain includes a PT symmetric pair of piezoelectric elements that induce gain and loss, in addition to two piezoelectric transducers used for actuation and sensing. The considered domain includes the point mass also on the top surface at . The equation of motion for the 2D domain is expressed in the frequency domain as graff2012wave
| (22) |
where is the displacement vector field, and are lamé constants, and . The density is expressed as , where is the density of the domain material. Also in Eqn. (22), and respectively define the area forces associated with actuation and with the gain-loss transducers. The latter consist of a pair of transducers of length deposited on the top surface of the domain, centered at locations and , respectively. As previously noted, the symmetry with respect to the center is necessary to preserve PT symmetry. Their modeling follows references raghavan2005finite ; collet2011generation , which assumes their dynamics to be decoupled from that of the 2D domain, and considers their action in terms of stress components applied tangentially to the surface. Under the plane strain assumption, the , where
| (23) |
Here, the applied voltage is defined by the difference between the component of the velocities at the edges of the piezo, i.e. , which results from the implementation of a feedback derivative scheme with gain as suggested by the schematics of Fig. 7. The two additional transducers of length and centered at locations and are respectively used for actuation and sensing. According to what previously described, the stress due to the piezoelectric actuation leads to the following expression for , where:
| (24) |
with denoting the forcing time history. For simplicity, we consider excitation of unitary amplitude in the frequency domain, and we measure the response at the sensing transducer as the integration of the strain at the top surface over the extent of the sensor raghavan2005finite , i.e.
| (25) |
The resulting equation, expressed in Eqn. (22), is conveniently solved using a finite element discretization of the 2D domain within the COMSOL Multiphysics environment. Specifically, under the assumption of zero external loading (), the discretization leads to a polynomial eigenvalue problem that can be solved for eigenfrequencies and mode shapes. Consideration of the external load leads to a system that is solved in the frequency domain assuming harmoning forcing at specified frequencies.
III.2 Exceptional points through hybridized Lamb modes
The 2D elastic domain (Fig. 7) is made of aluminum, with material coefficients Gpa, Gpa and kg/m2. The dimensions are set to cm and cm, with the transducers of length cm placed at positions cm and cm. Also, the actuation and sensing piezoelectric elements have length cm, and are respectively placed at positions cm and cm.


A 2D elastic domain of the dimensions considered supports a family of guided waves (or Lamb waves) graff2012wave , that propagate along the direction in the form of symmetric (S) or anti-symmetric (A) modes. We consider traction-free boundary conditions in both and directions, resulting in a set of vibrating modes that are formed from standing guided waves, as illustrated in Fig. 8. In particular, Fig. 8 displays the first natural frequencies of the domain without any influence from the piezoelectric elements or added mass (). Selected modes from the S0 and A0 groups are displayed in Figs. 8(b,c). These modes are tracked by considering a polarization factor , defined as
| (26) |
The polarization factor is employed to color code the scatter plot in Fig. 8, where blue dots for correspond to predominantly longitudinal modes (), while red dots for identify predominantly transverse modes (). This is illustrated in the deformed shapes for selected flexural and longitudinal modes displayed in Figs. 8 (b) and (c), respectively.
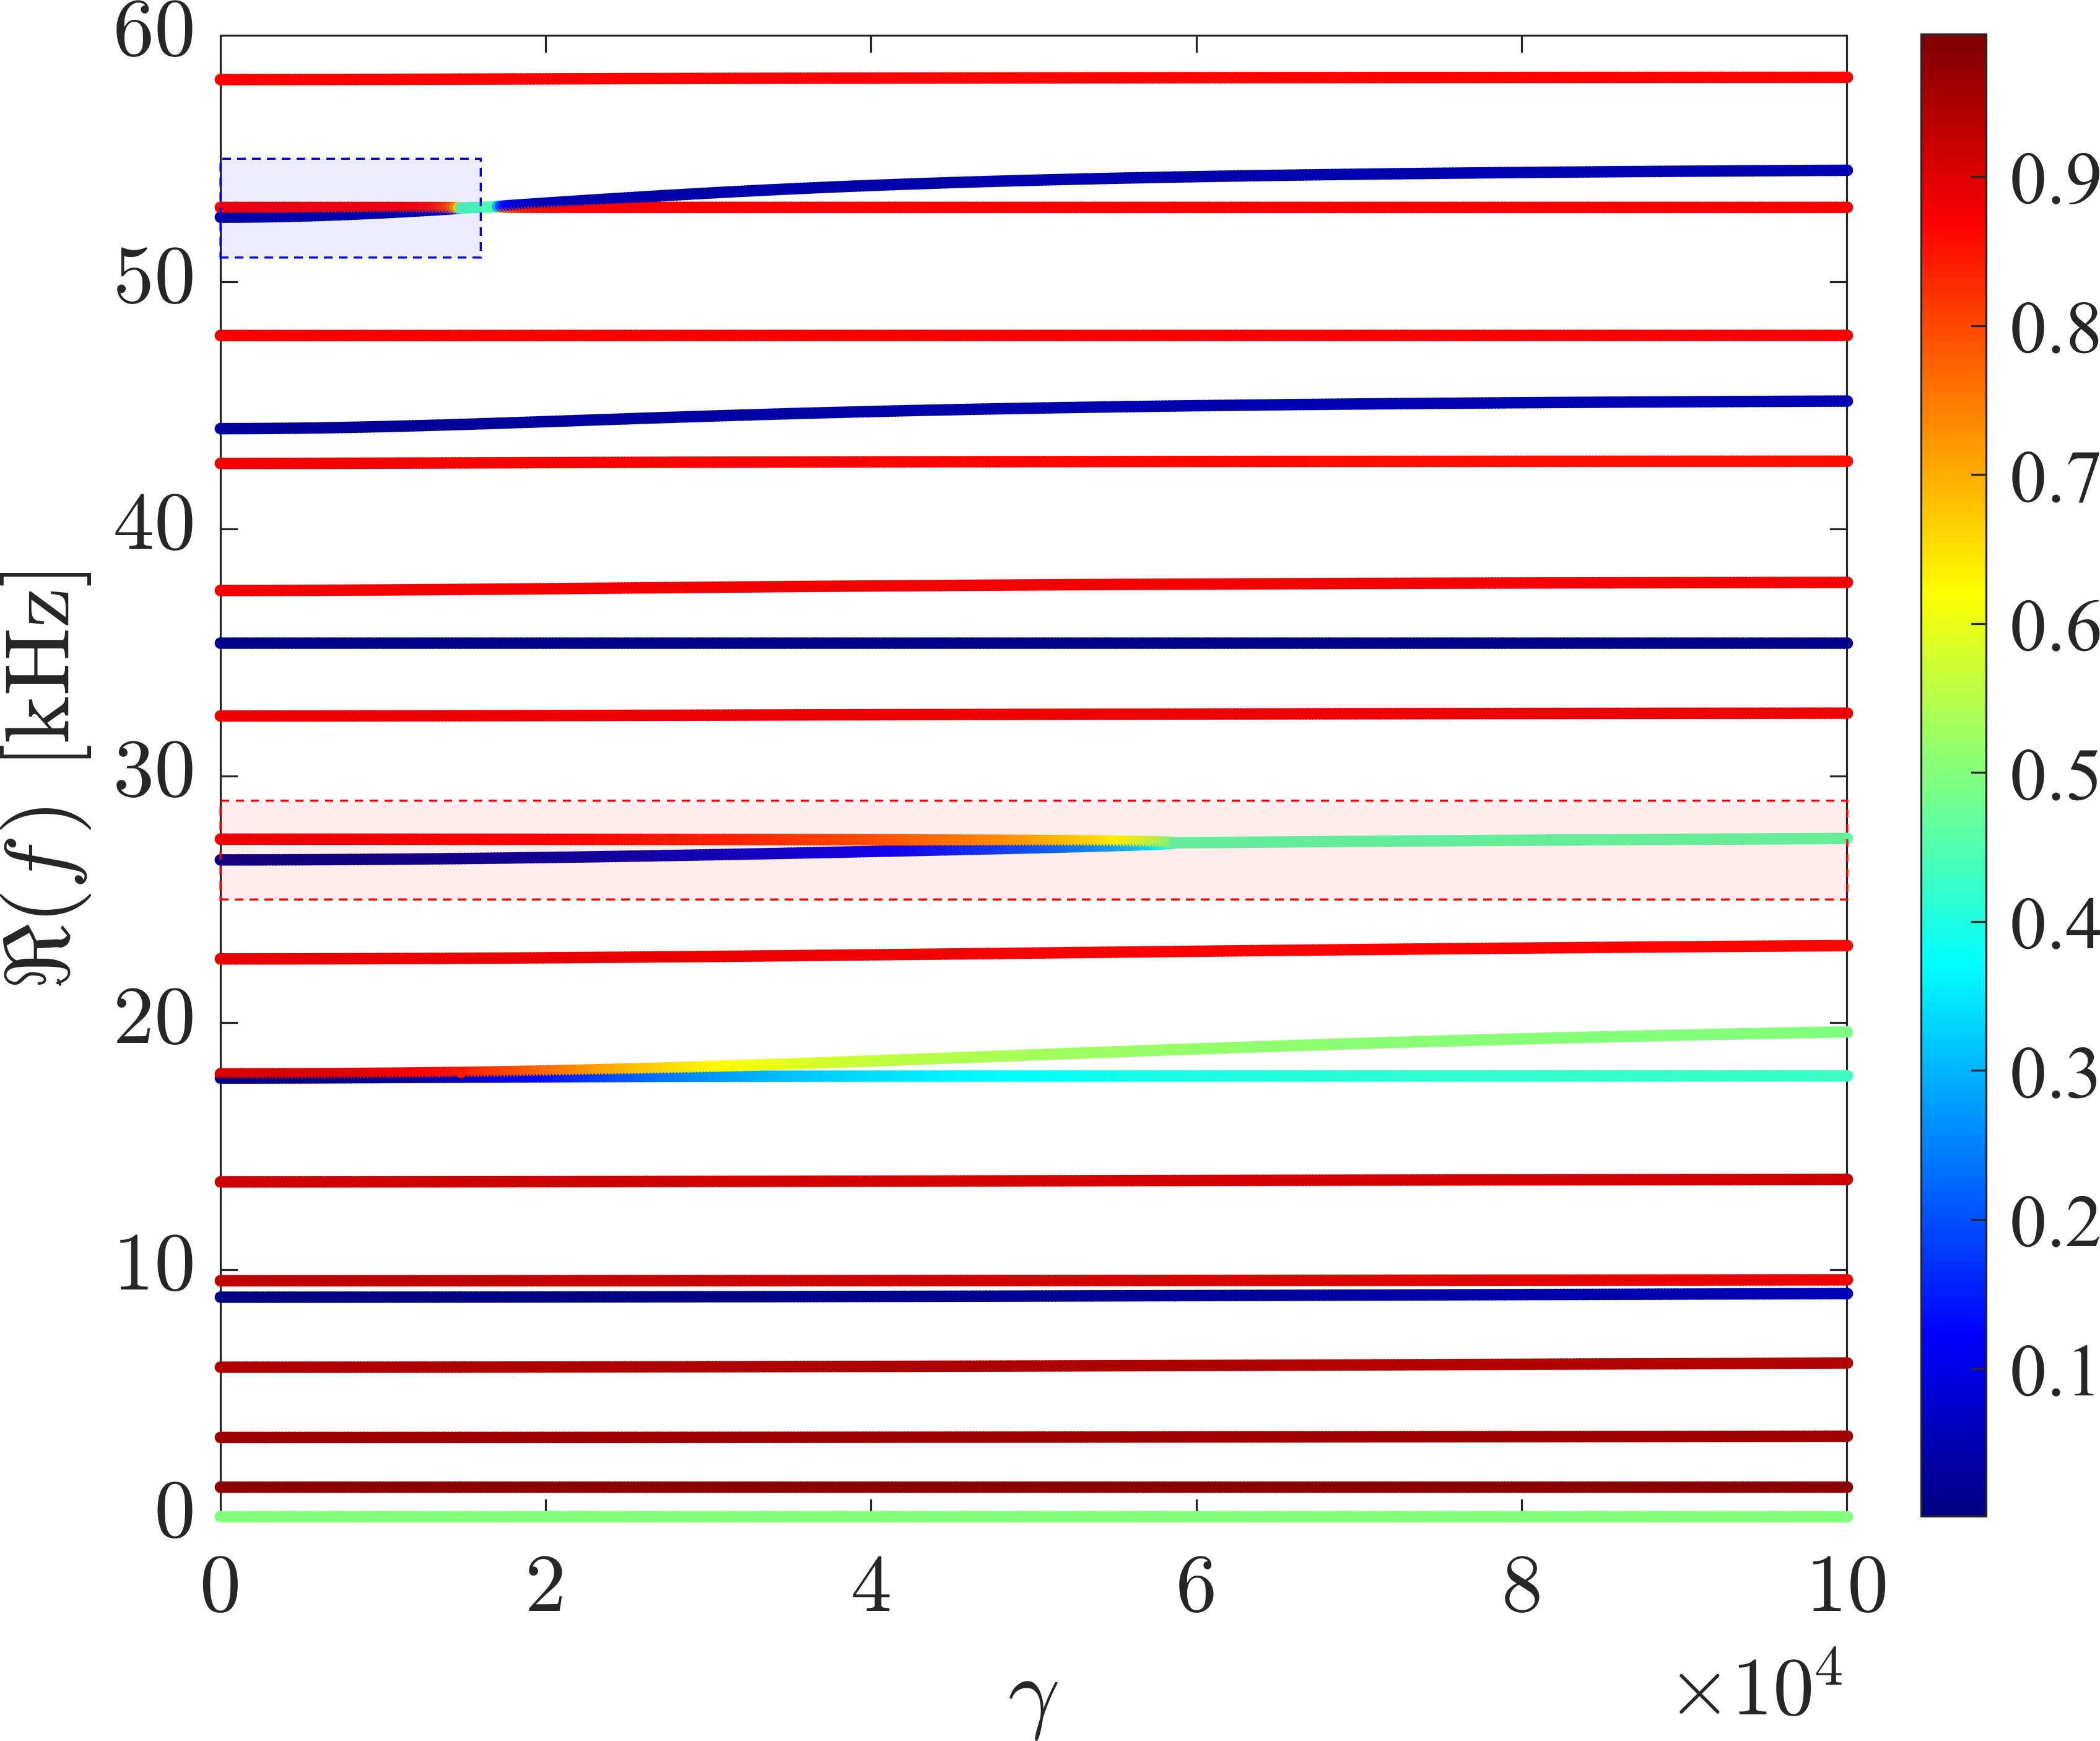
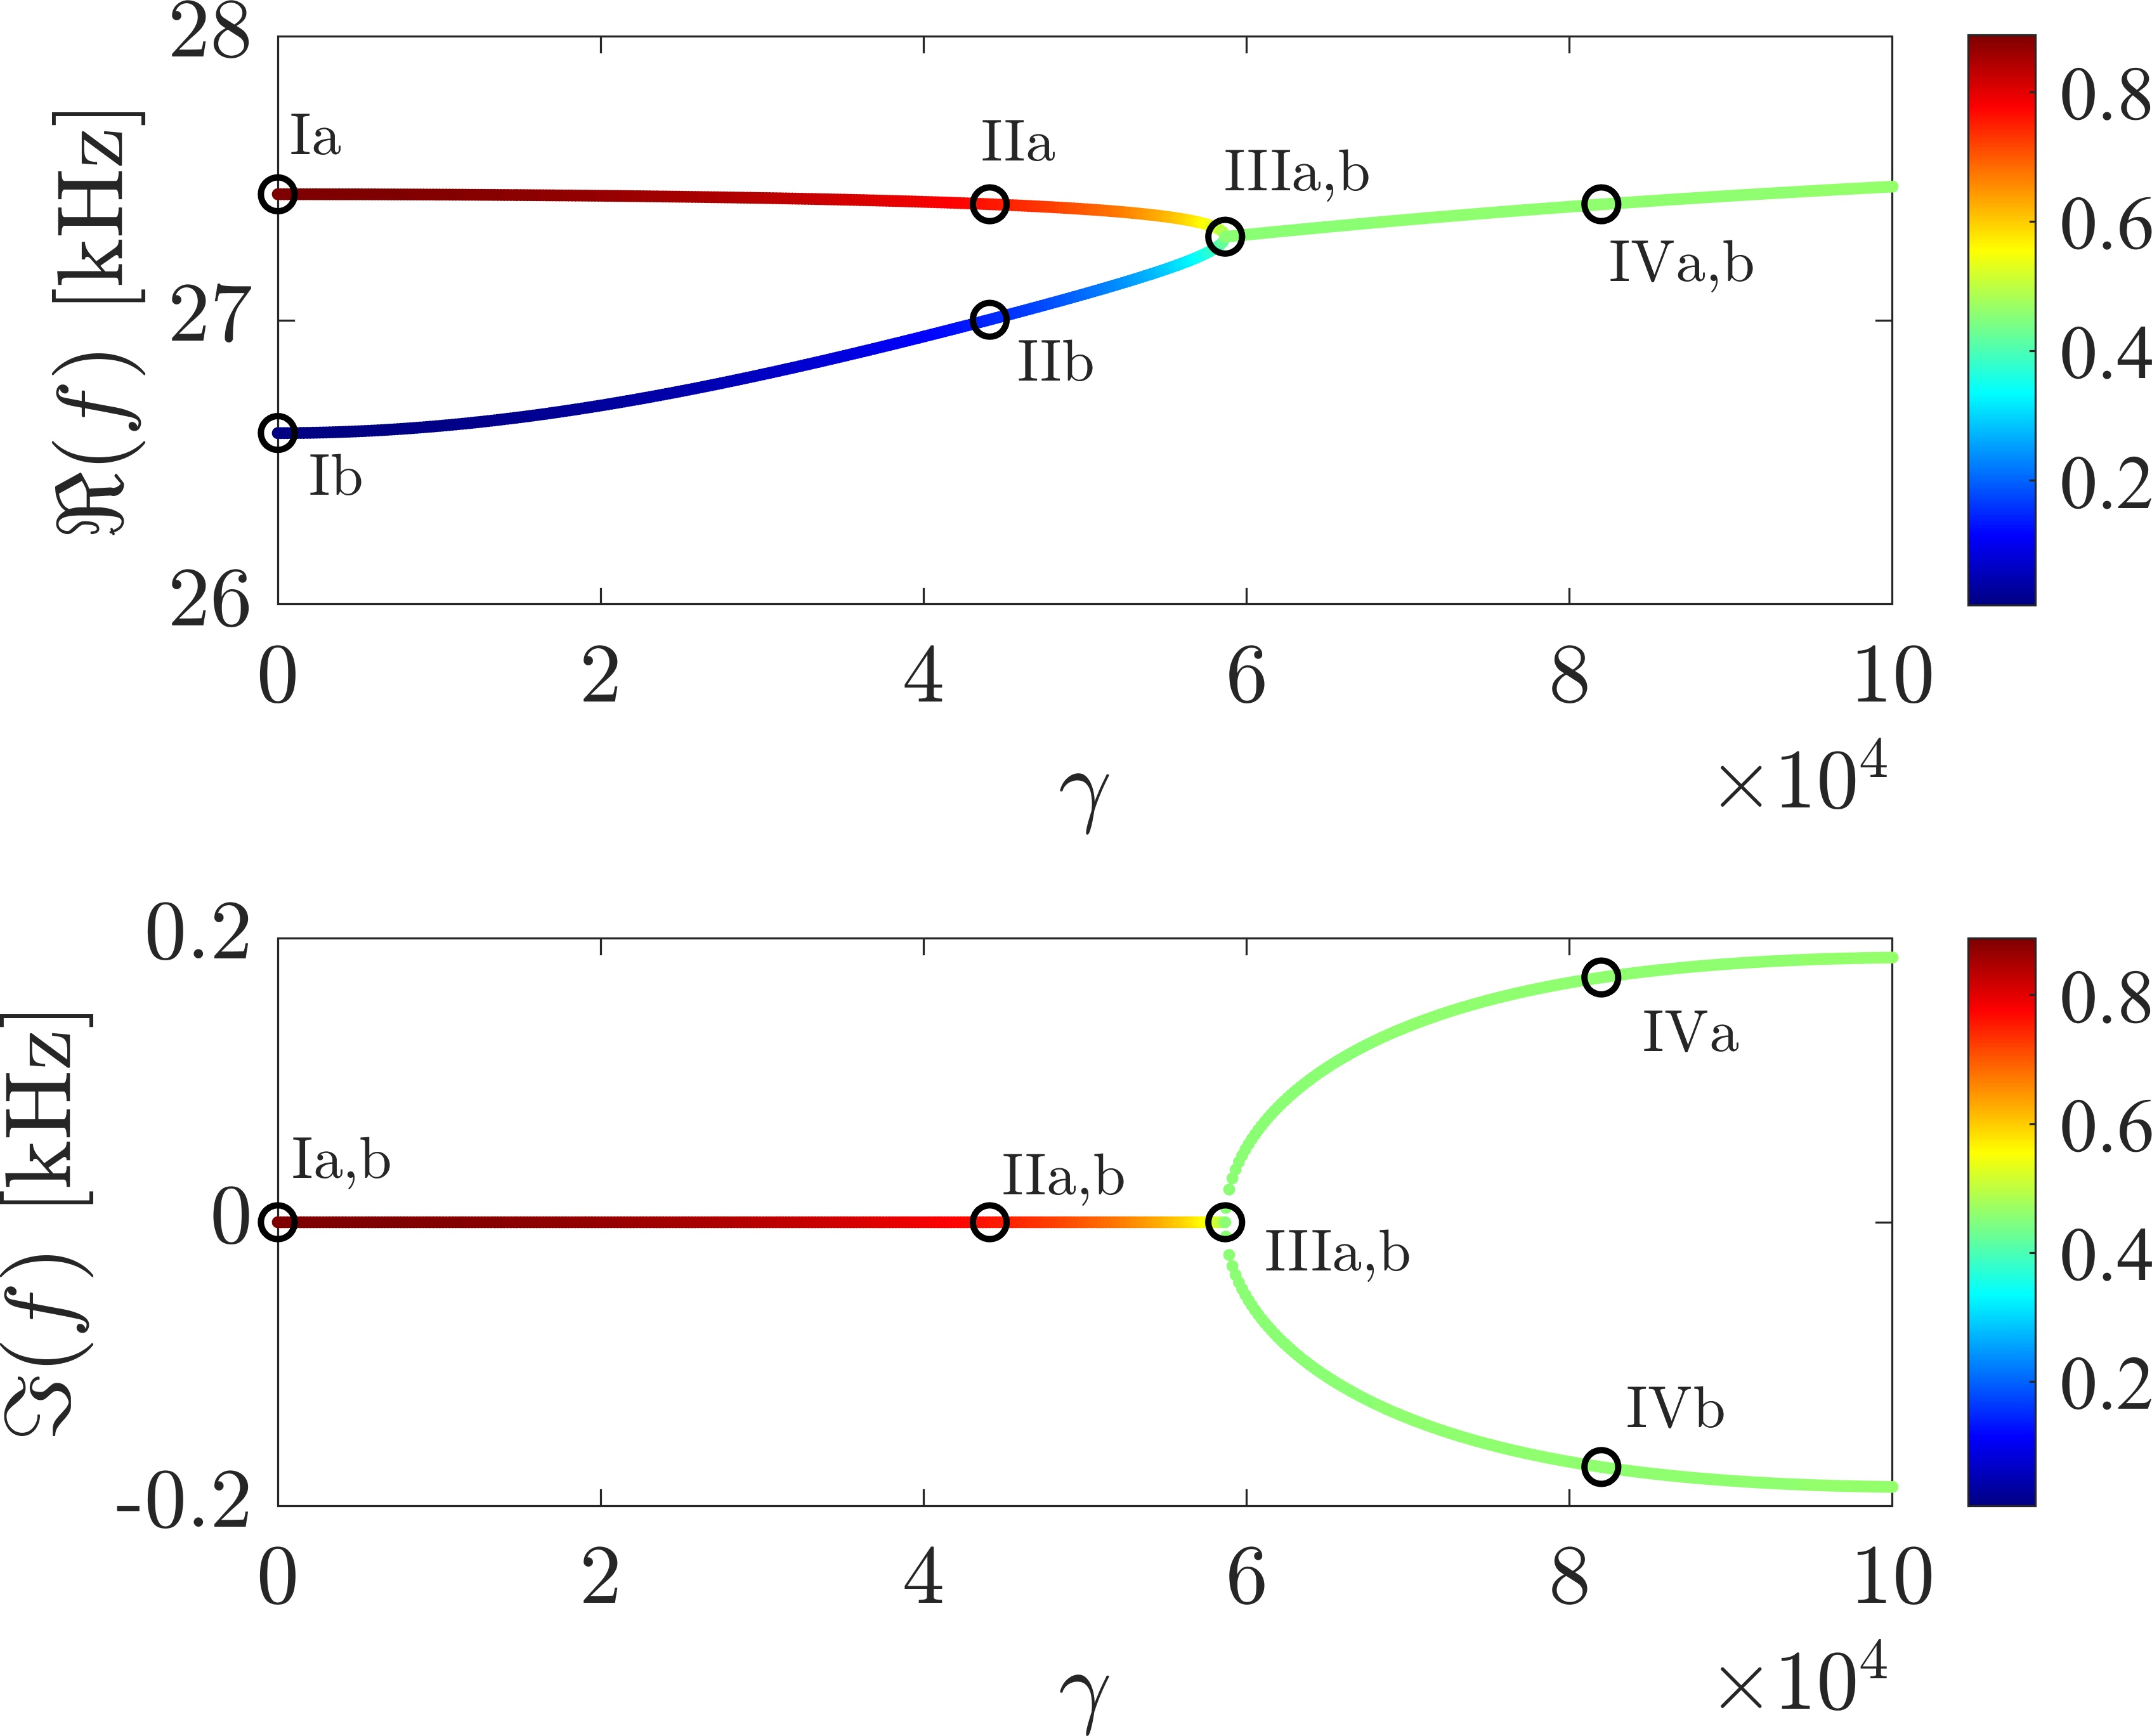
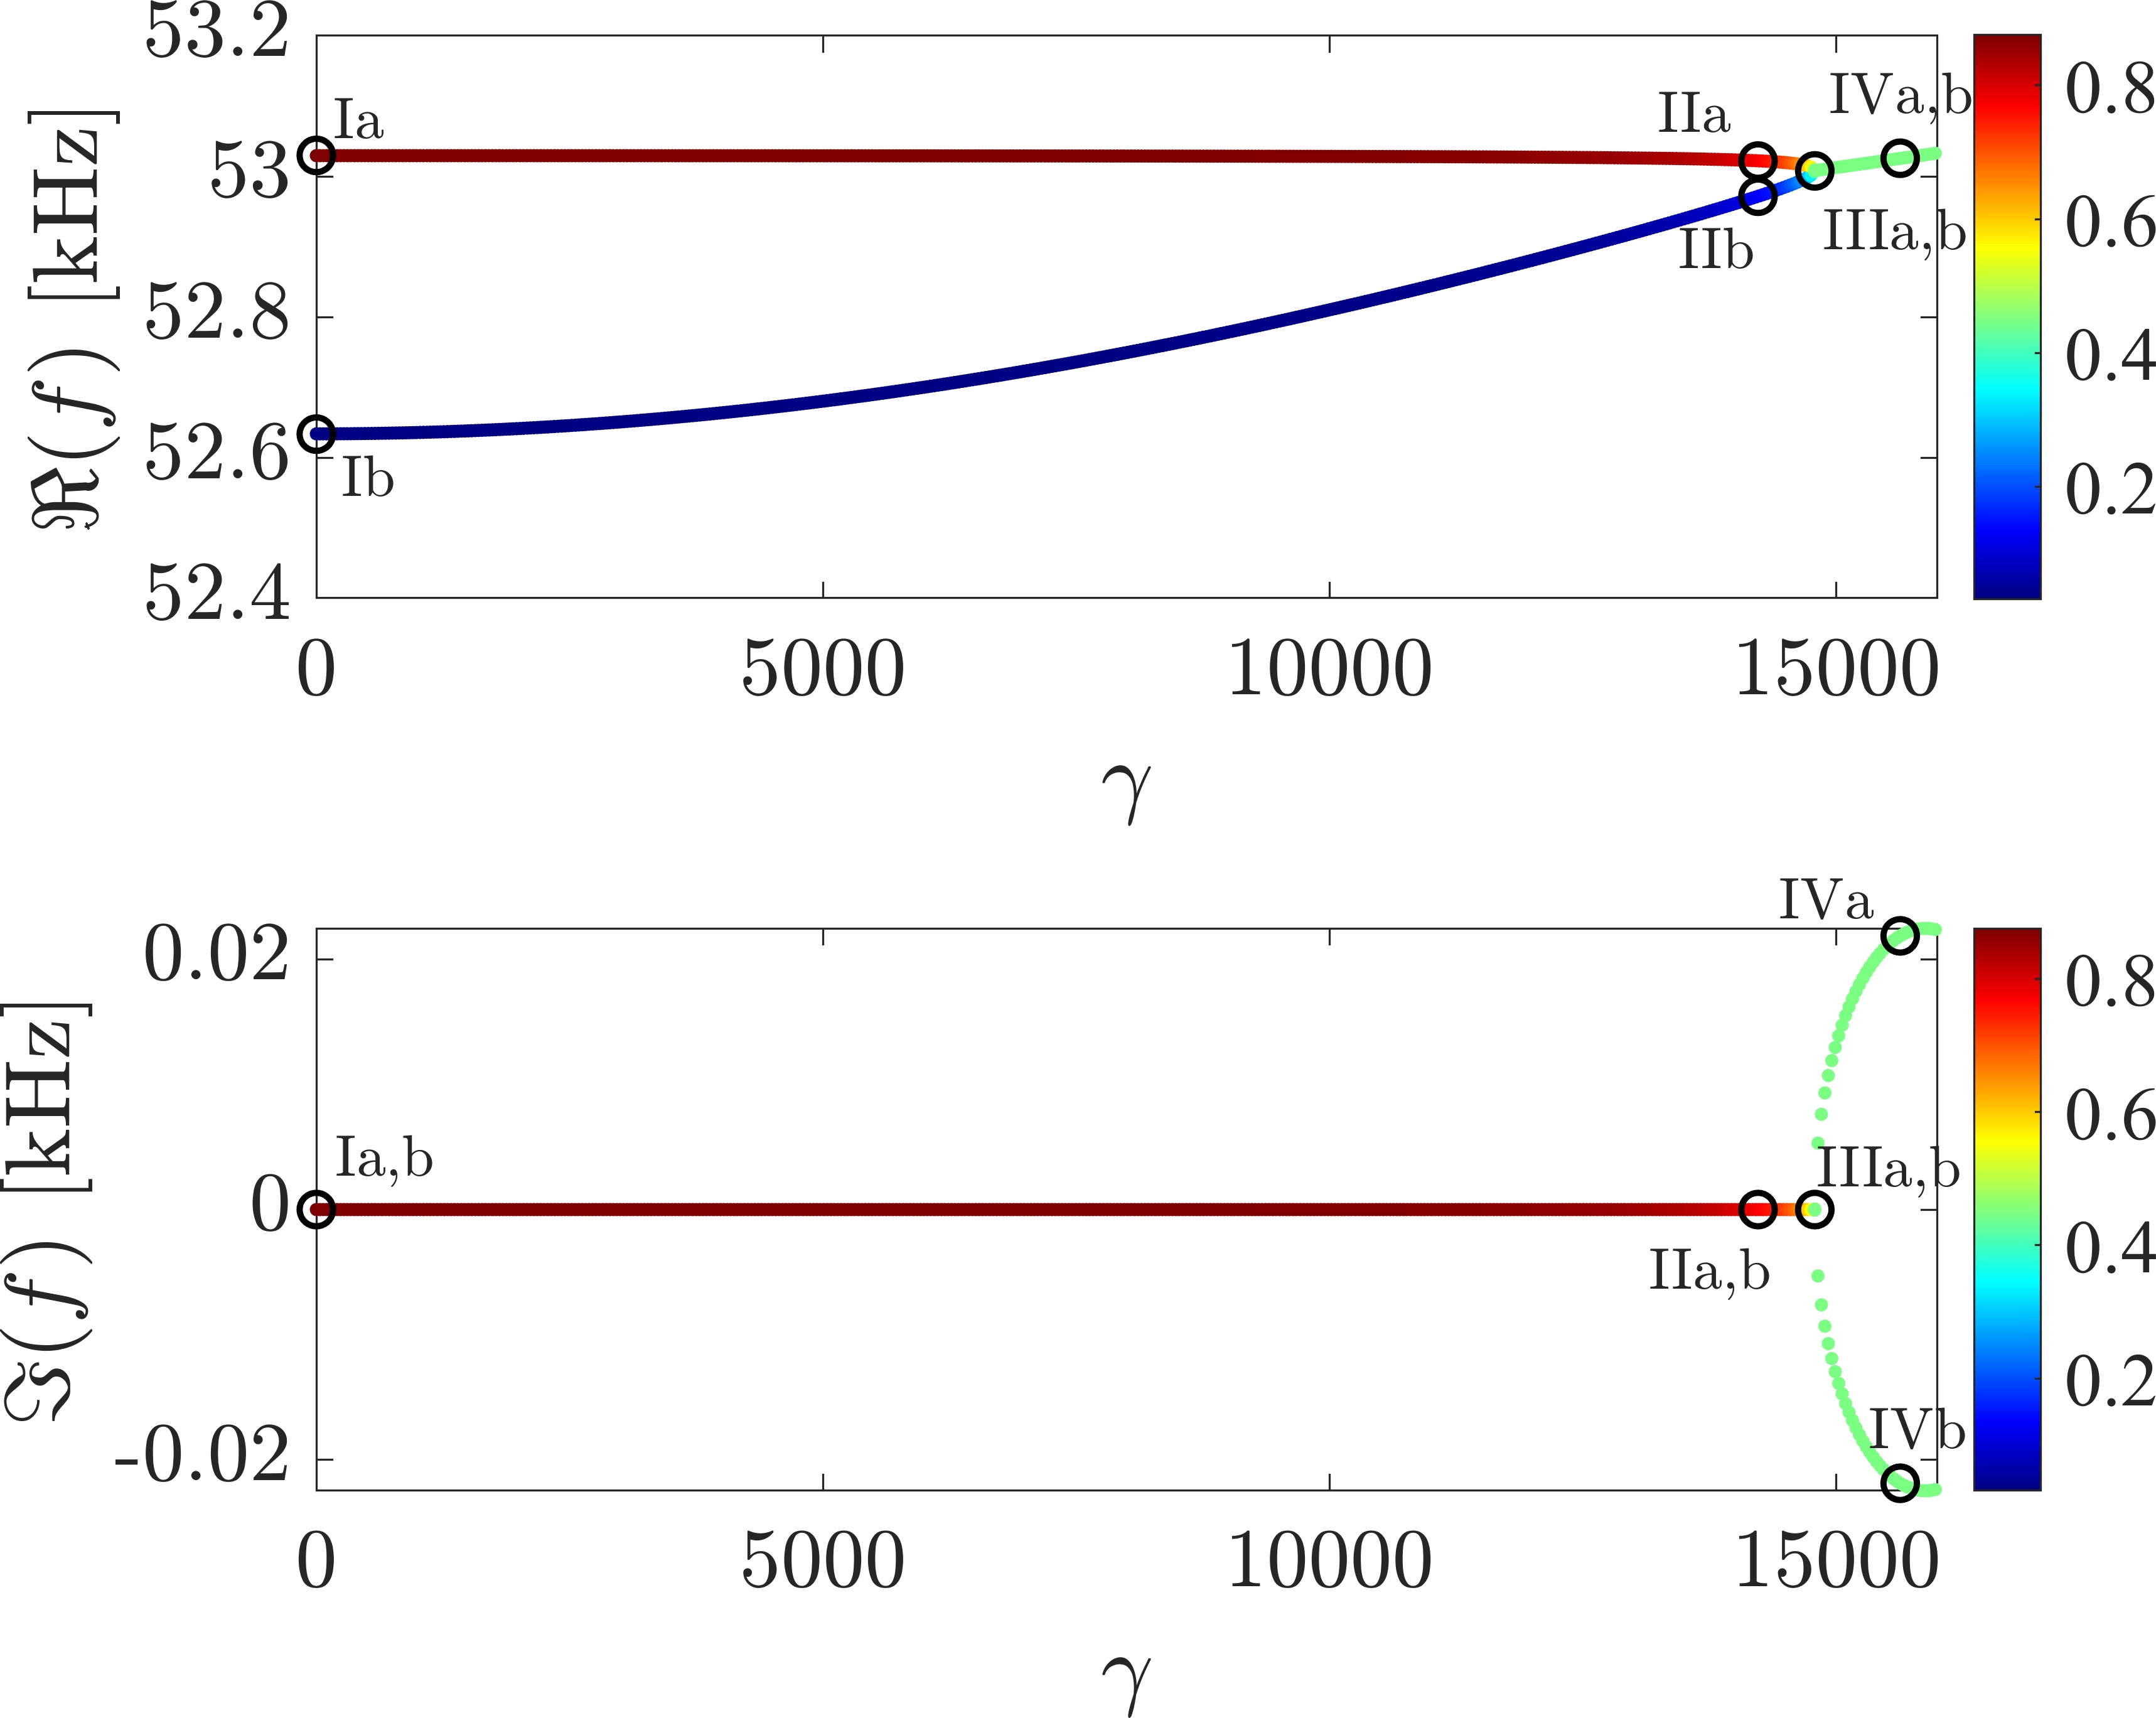


The variation of the corresponding frequencies with is displayed in Fig. 9. The introduction of the PT symmetric pair of piezoelectric transducers leads to the formation of two EPs in the considered frequency range, which are highlighted by the shaded red and blue areas in Fig. 9, while Figs. 9(b,c) display zoomed views of their real and imaginary frequency components. As expected, the EPs define a transition from a region with purely real frequencies, to a region with complex conjugate frequencies. Interestingly, both EPs are formed by the hybridization of a longitudinal (S0) and a flexural (A0) mode, as indicated by the color changes as the branches merge. This color change tracks their change in polarization as quantified by . The deformed mode shapes for selected points marked in Figs. 9(b,c) are displayed in Figs. 9(d,e), illustrating the formation of the EP through the hybridization of the modes, with identical mode shapes occurring for the value corresponding to the EP.
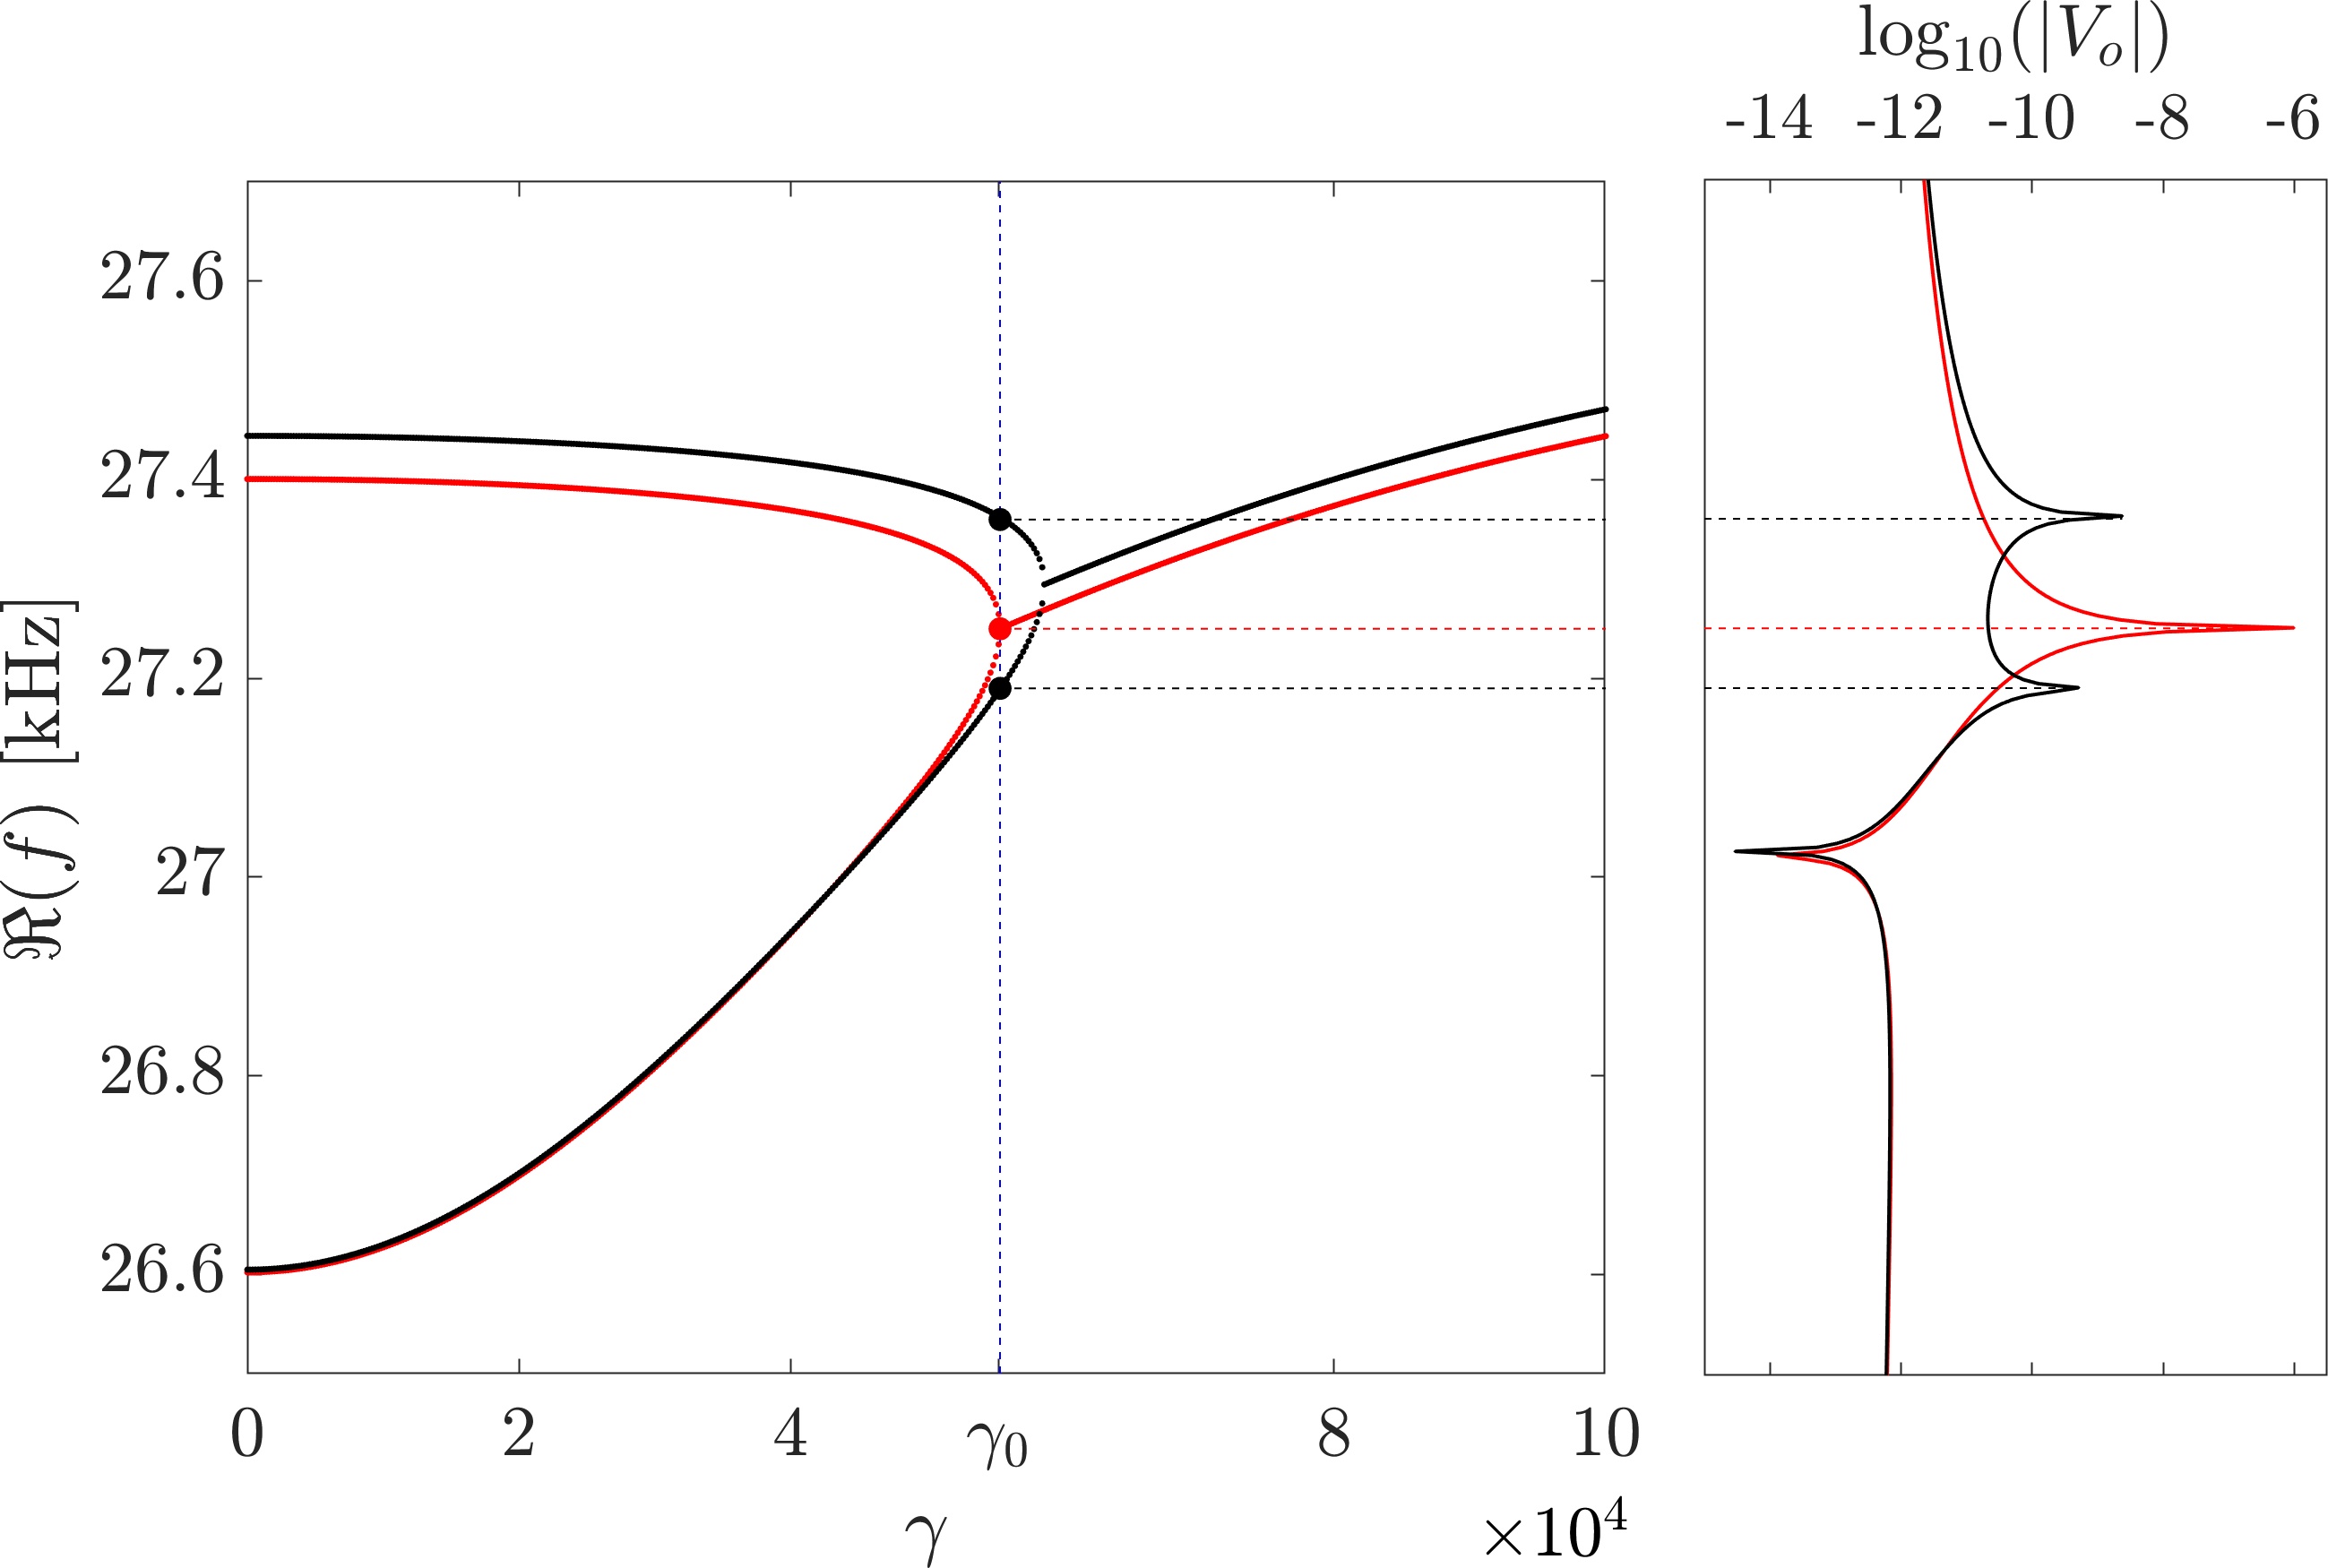
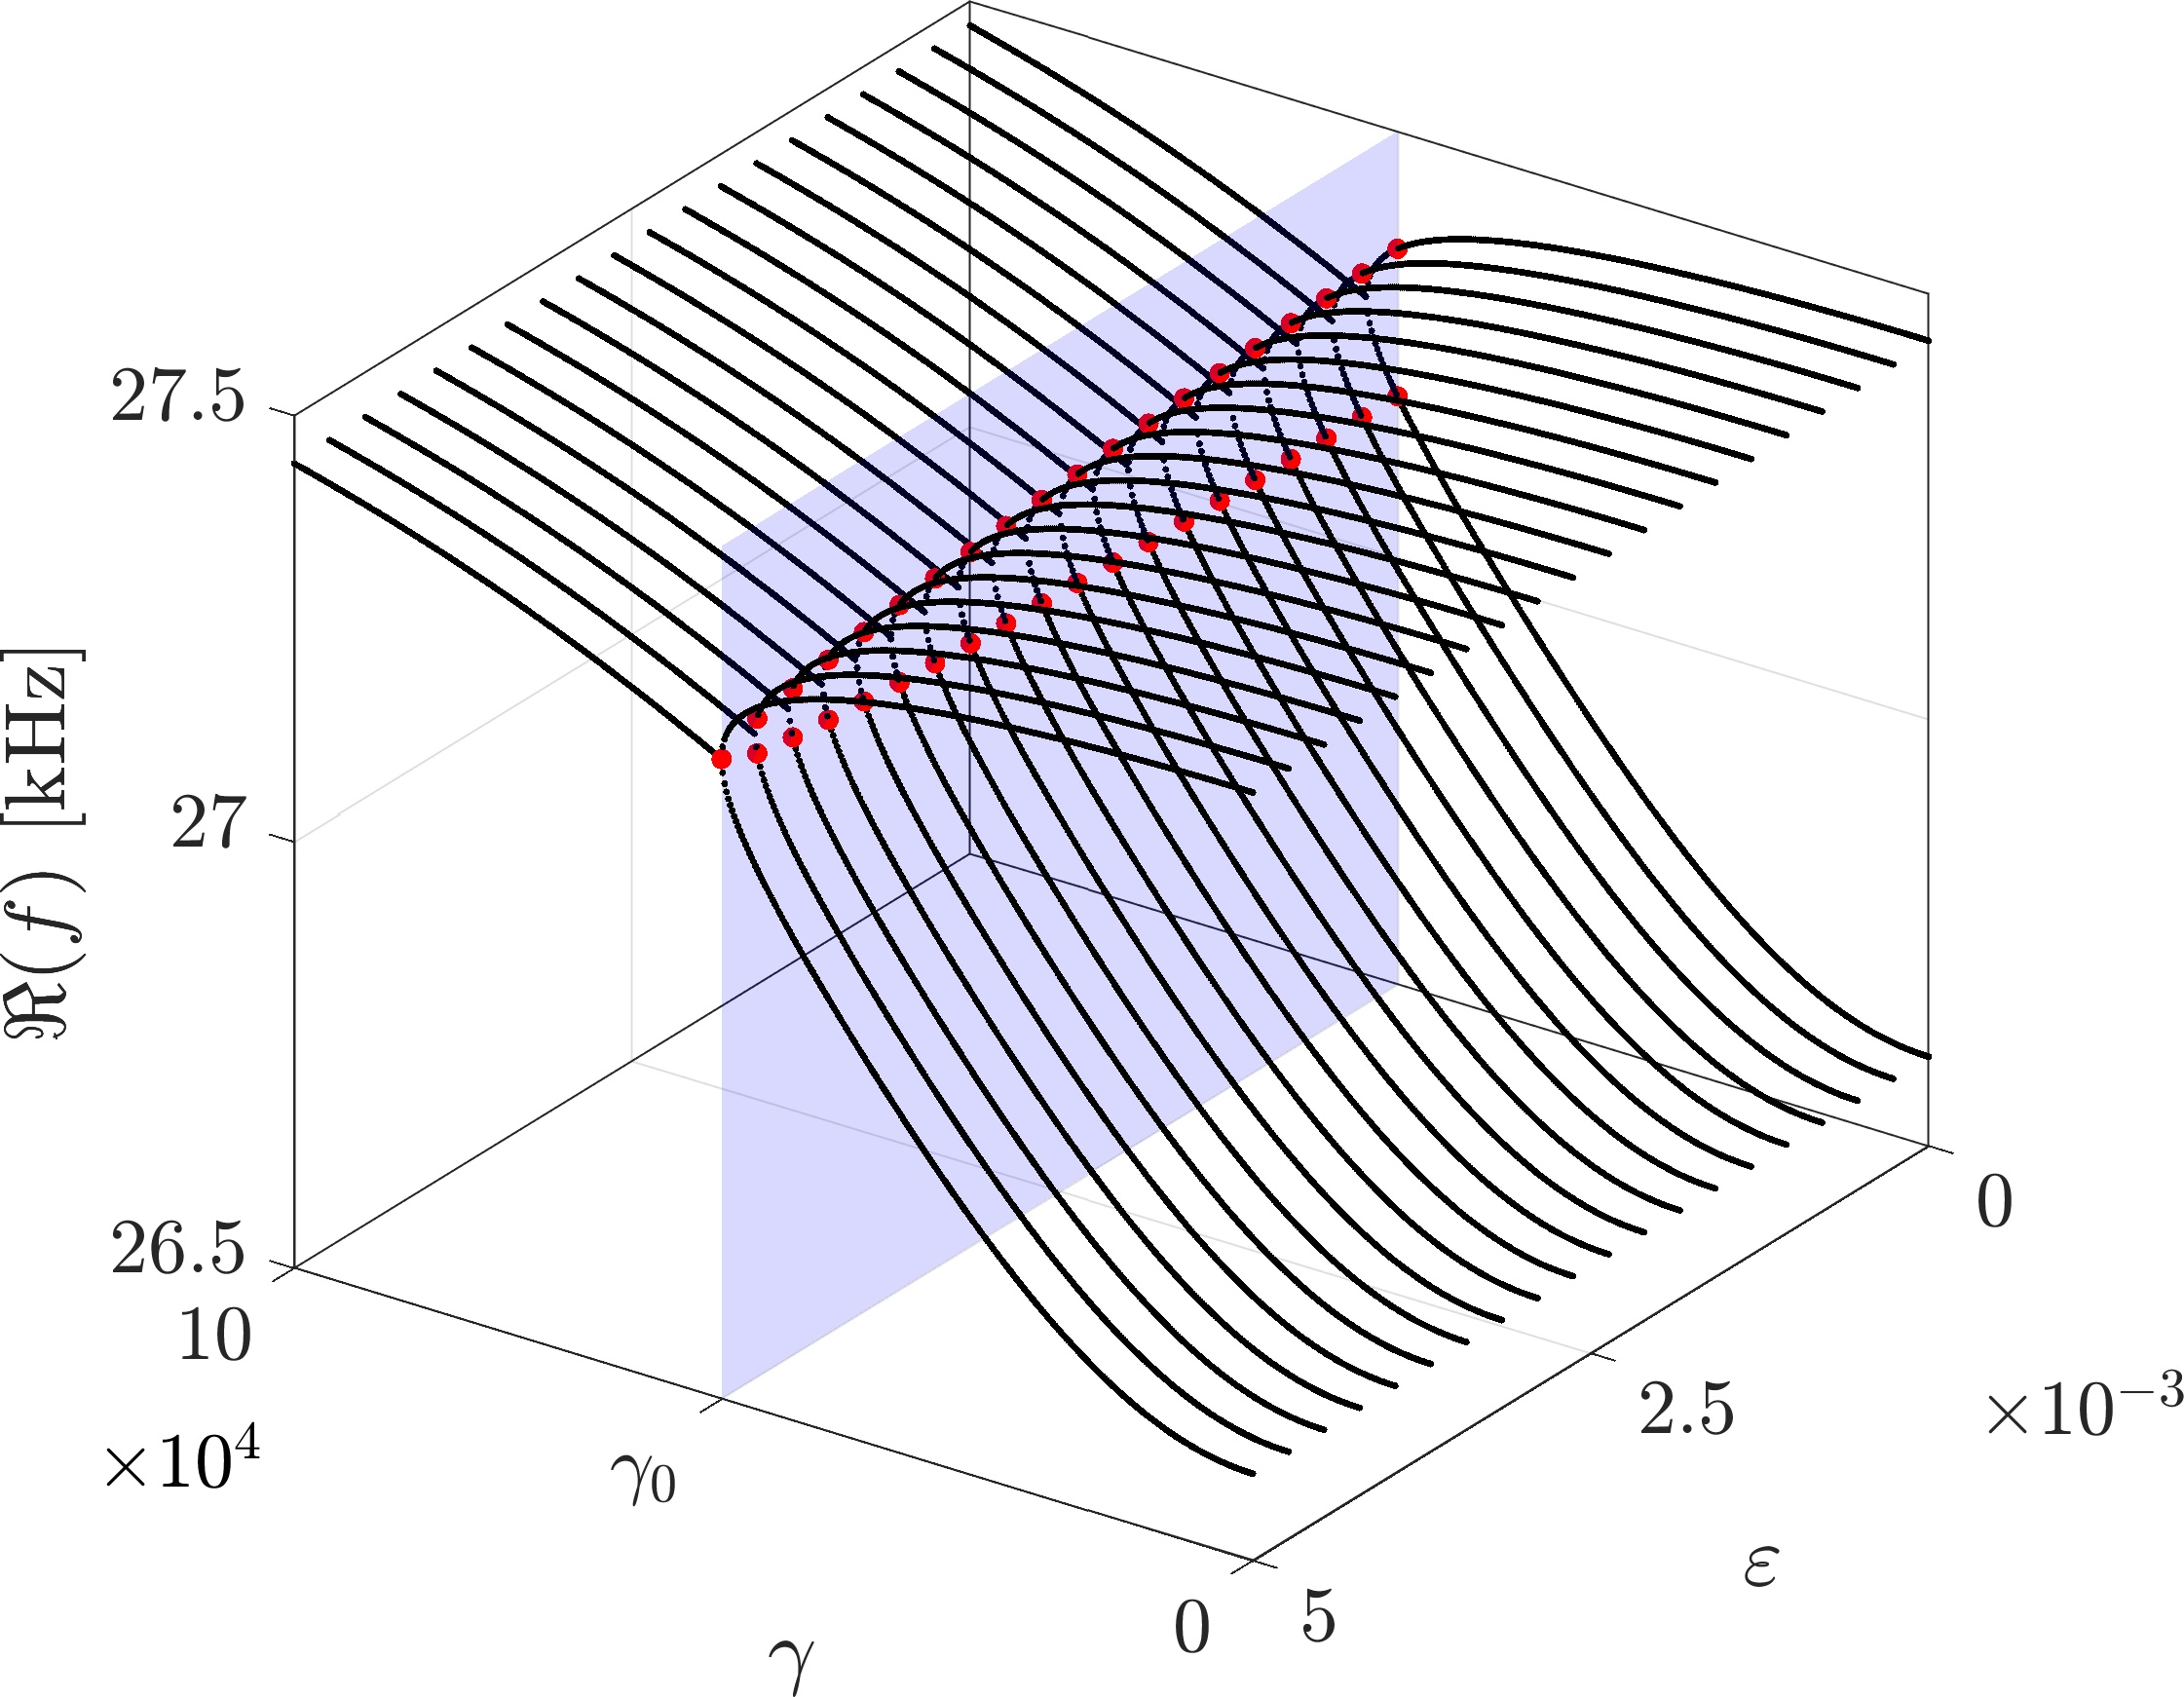
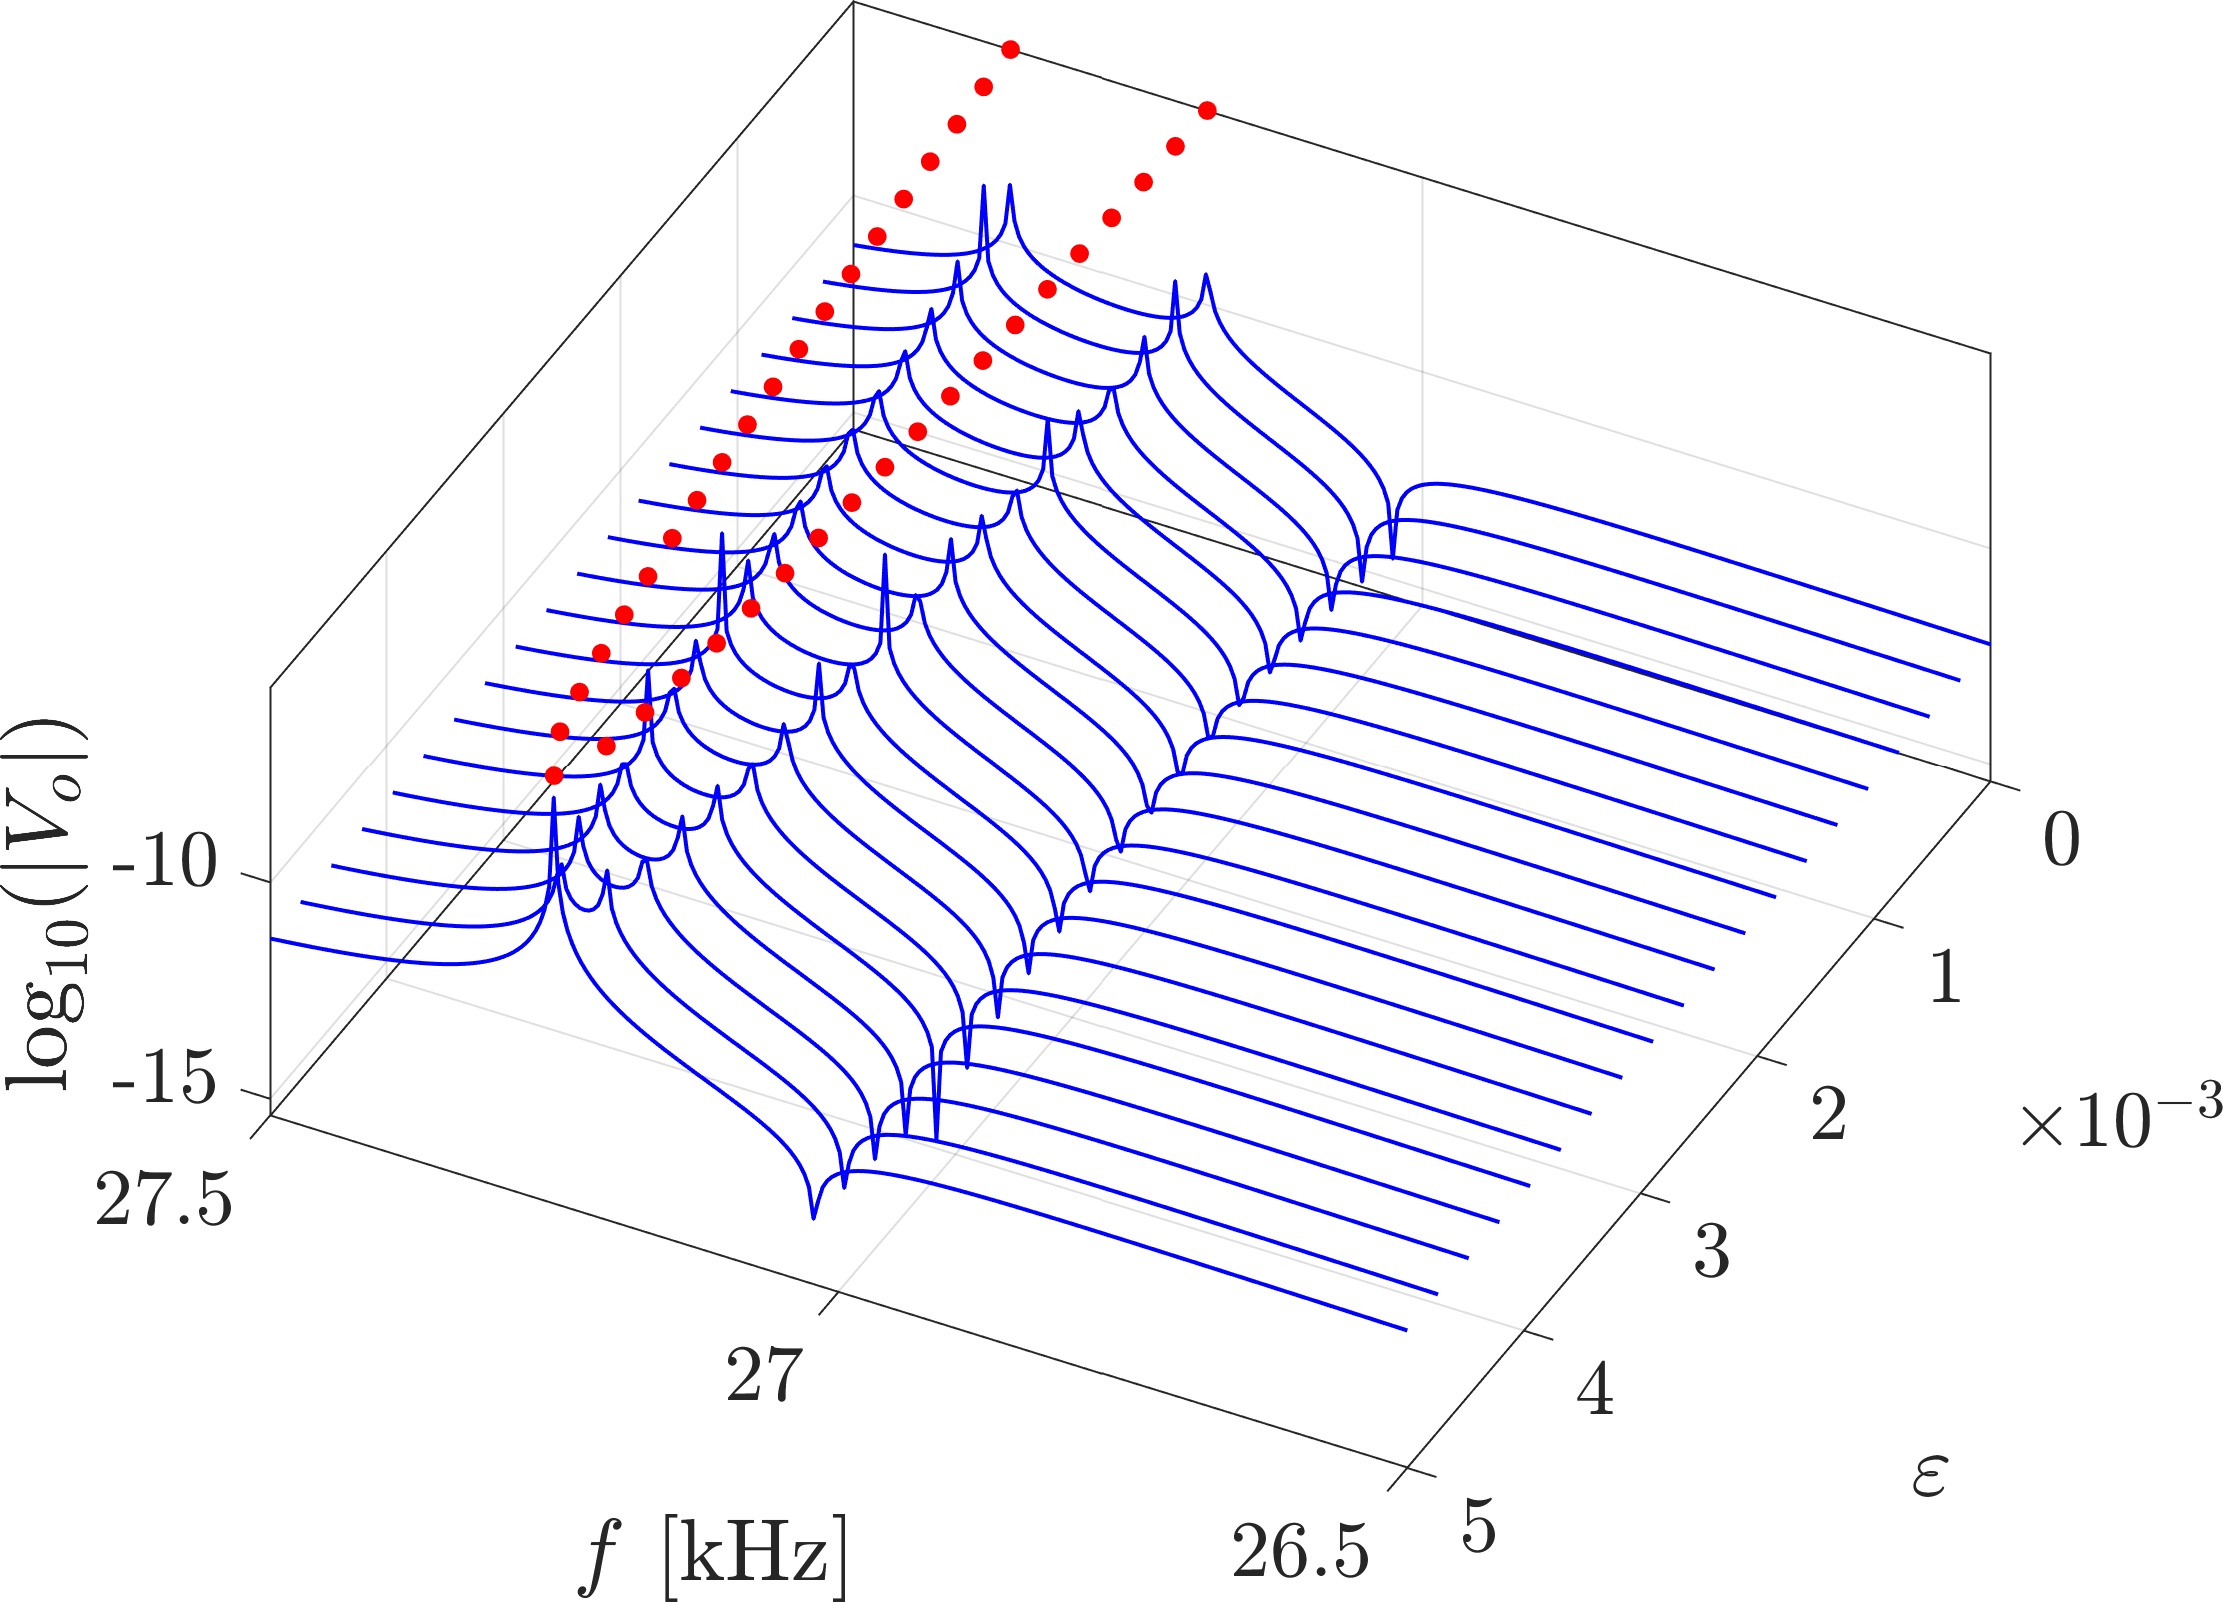
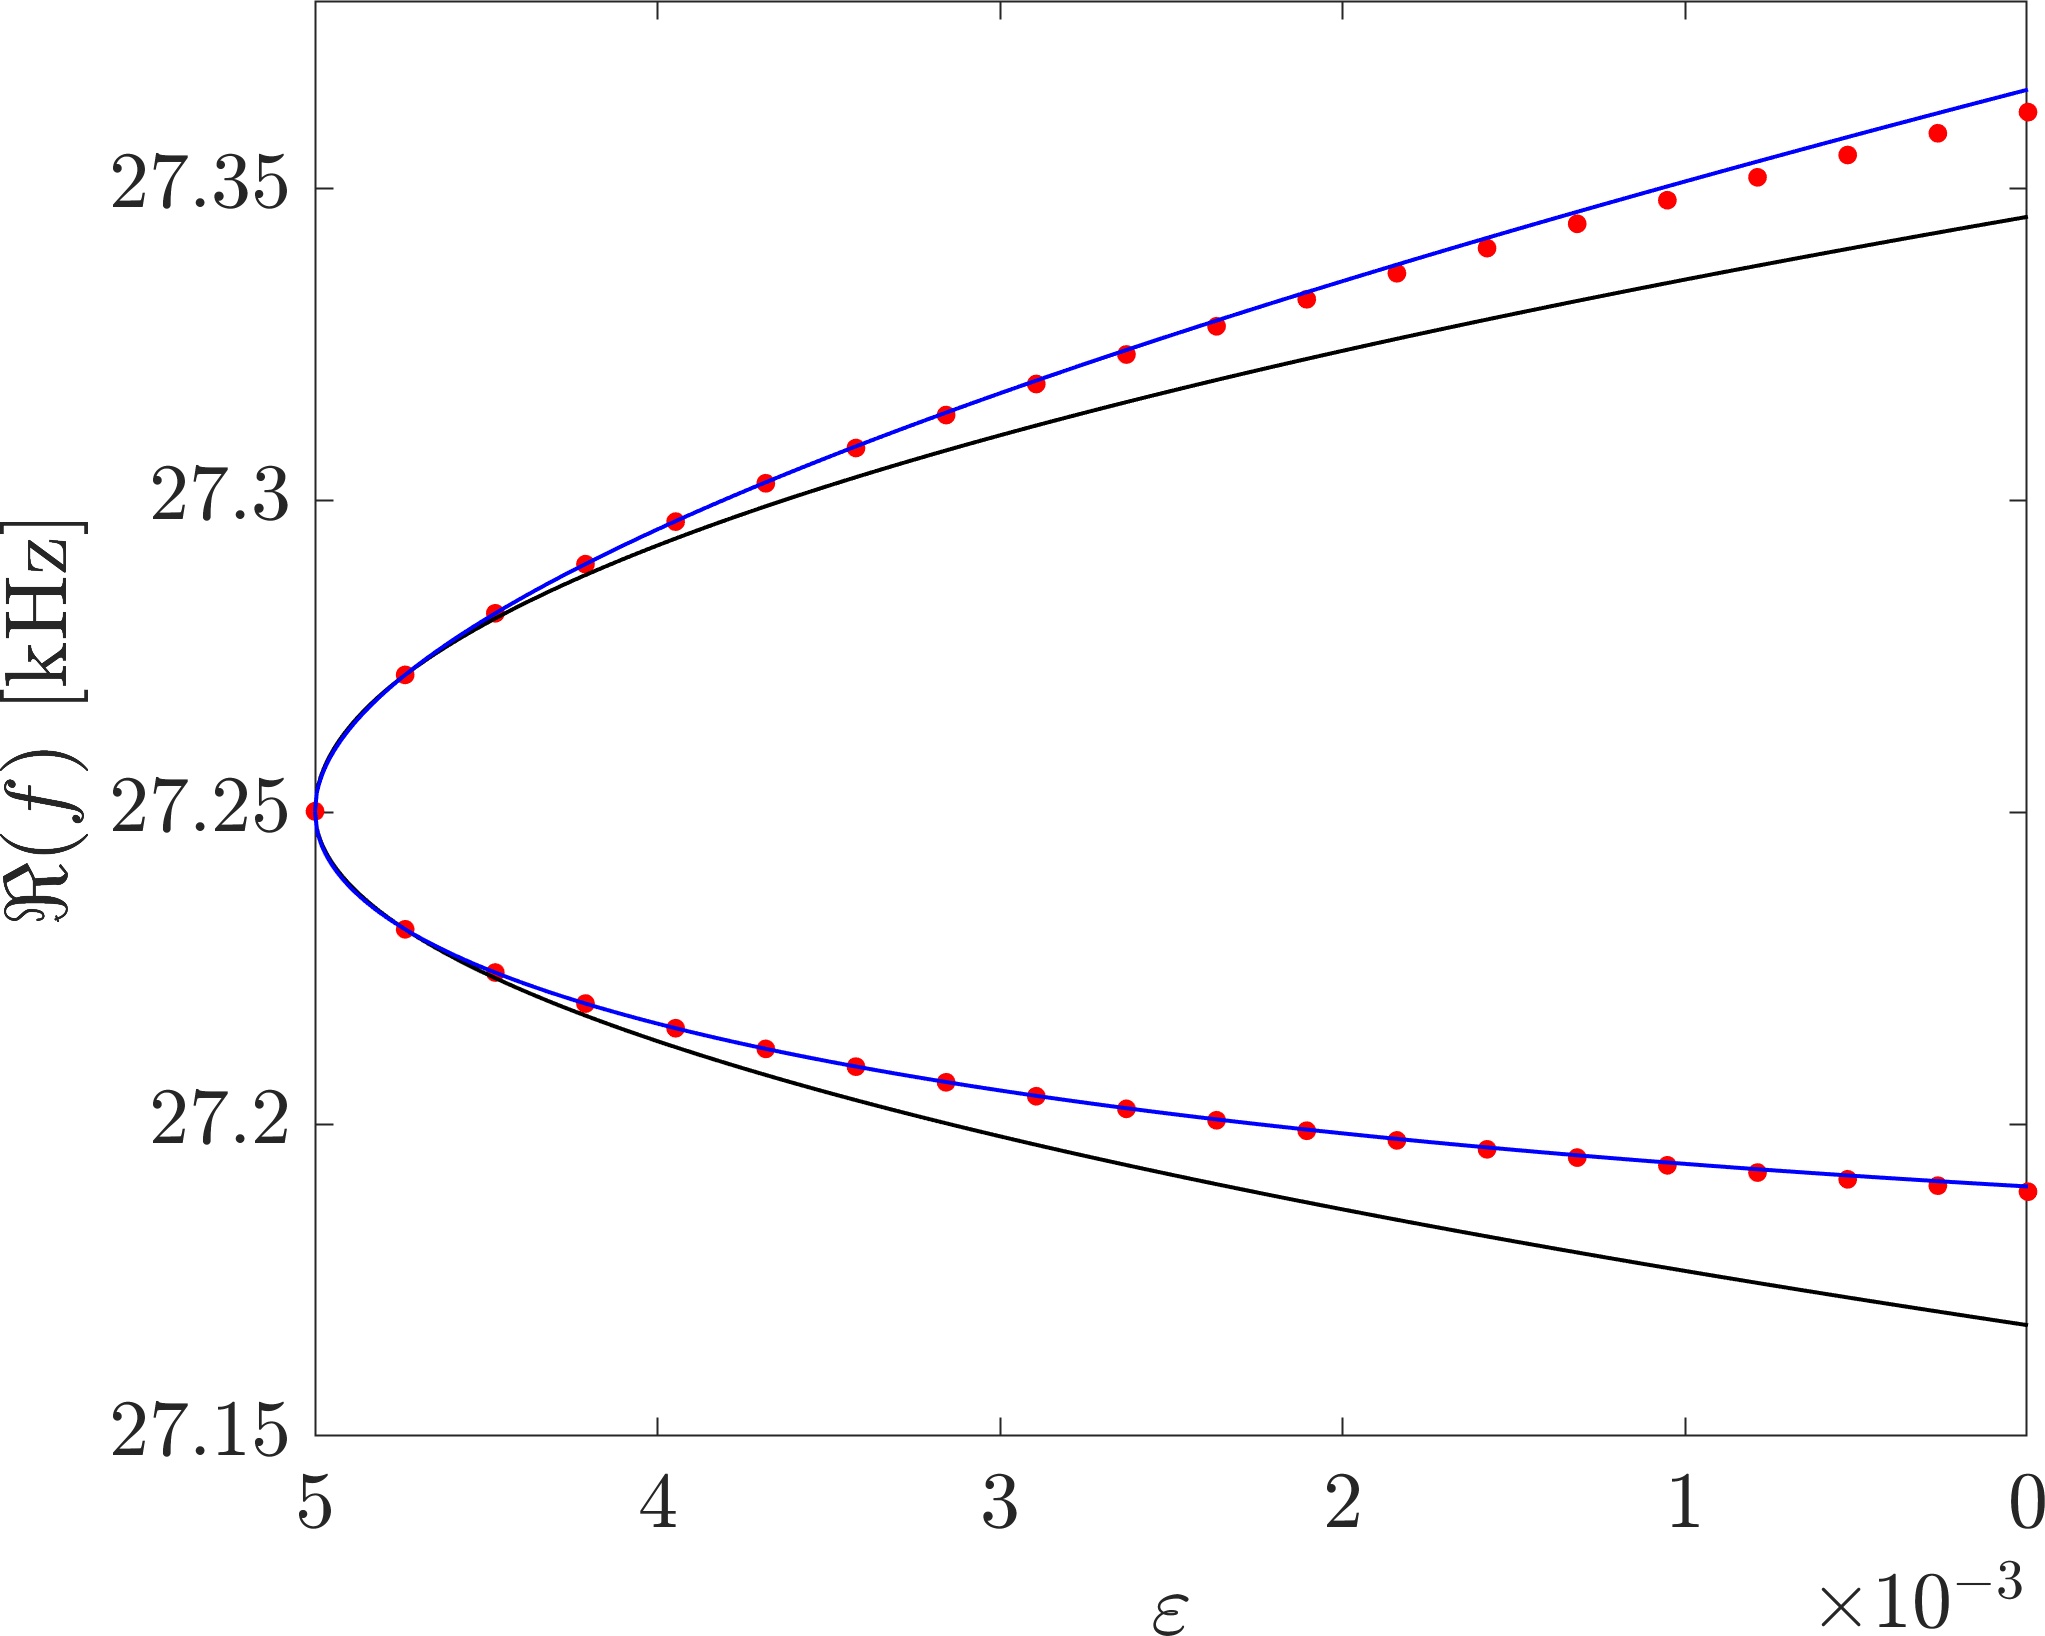
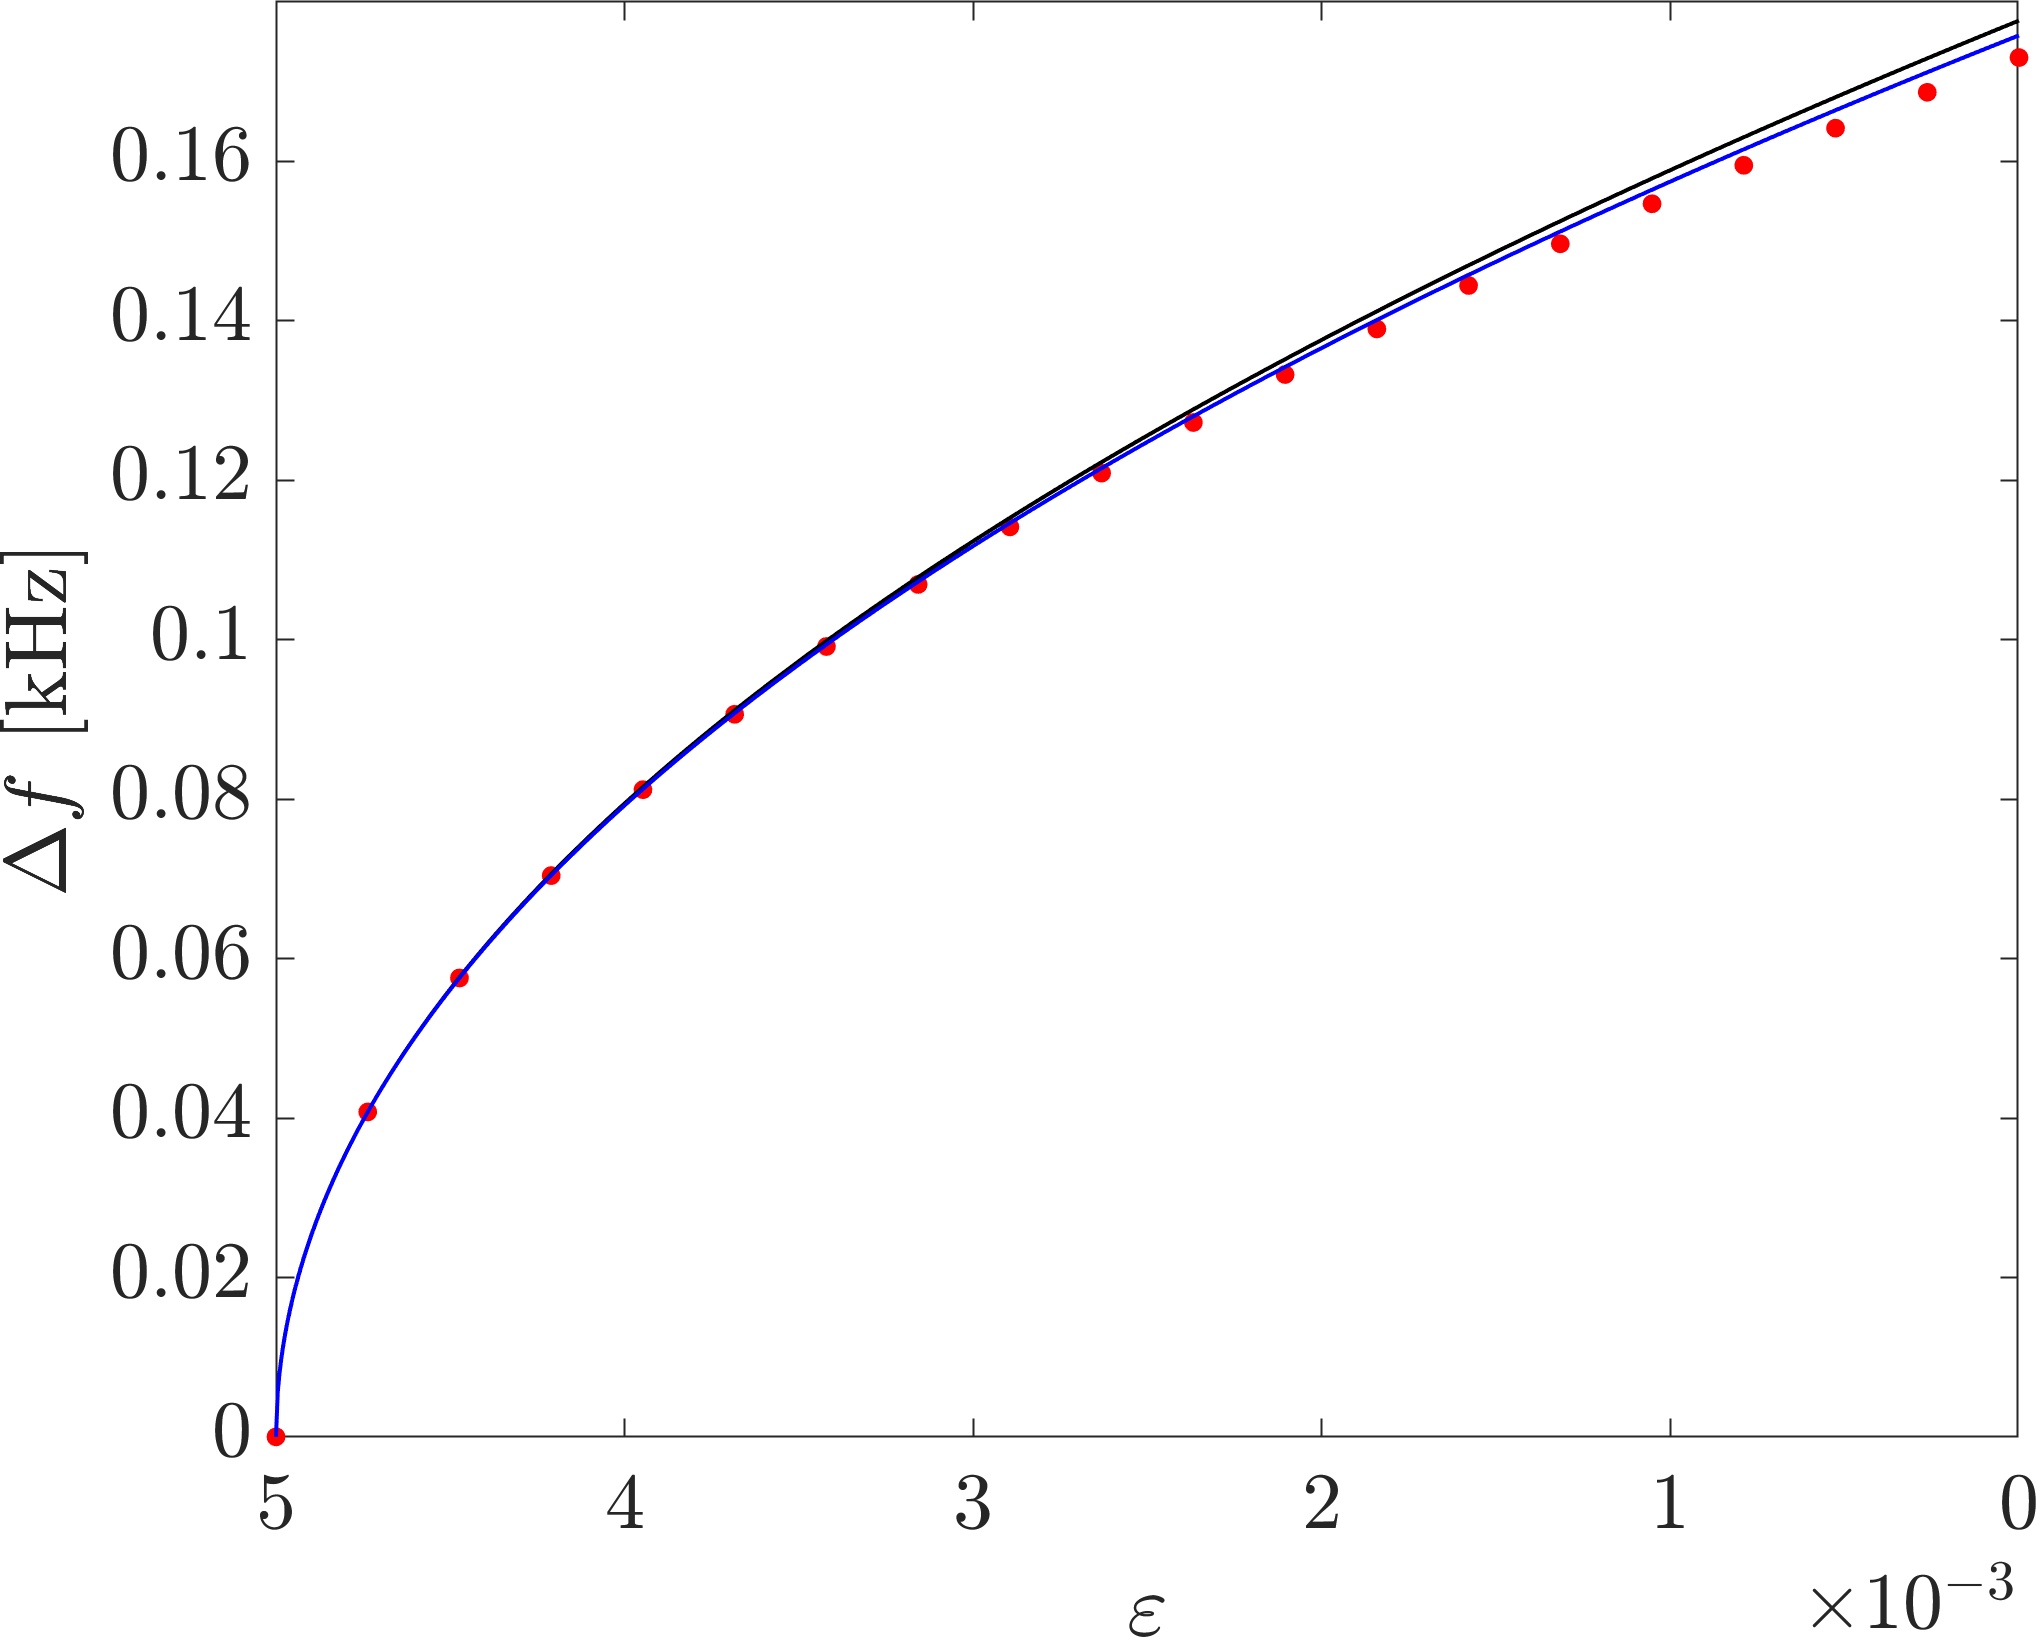
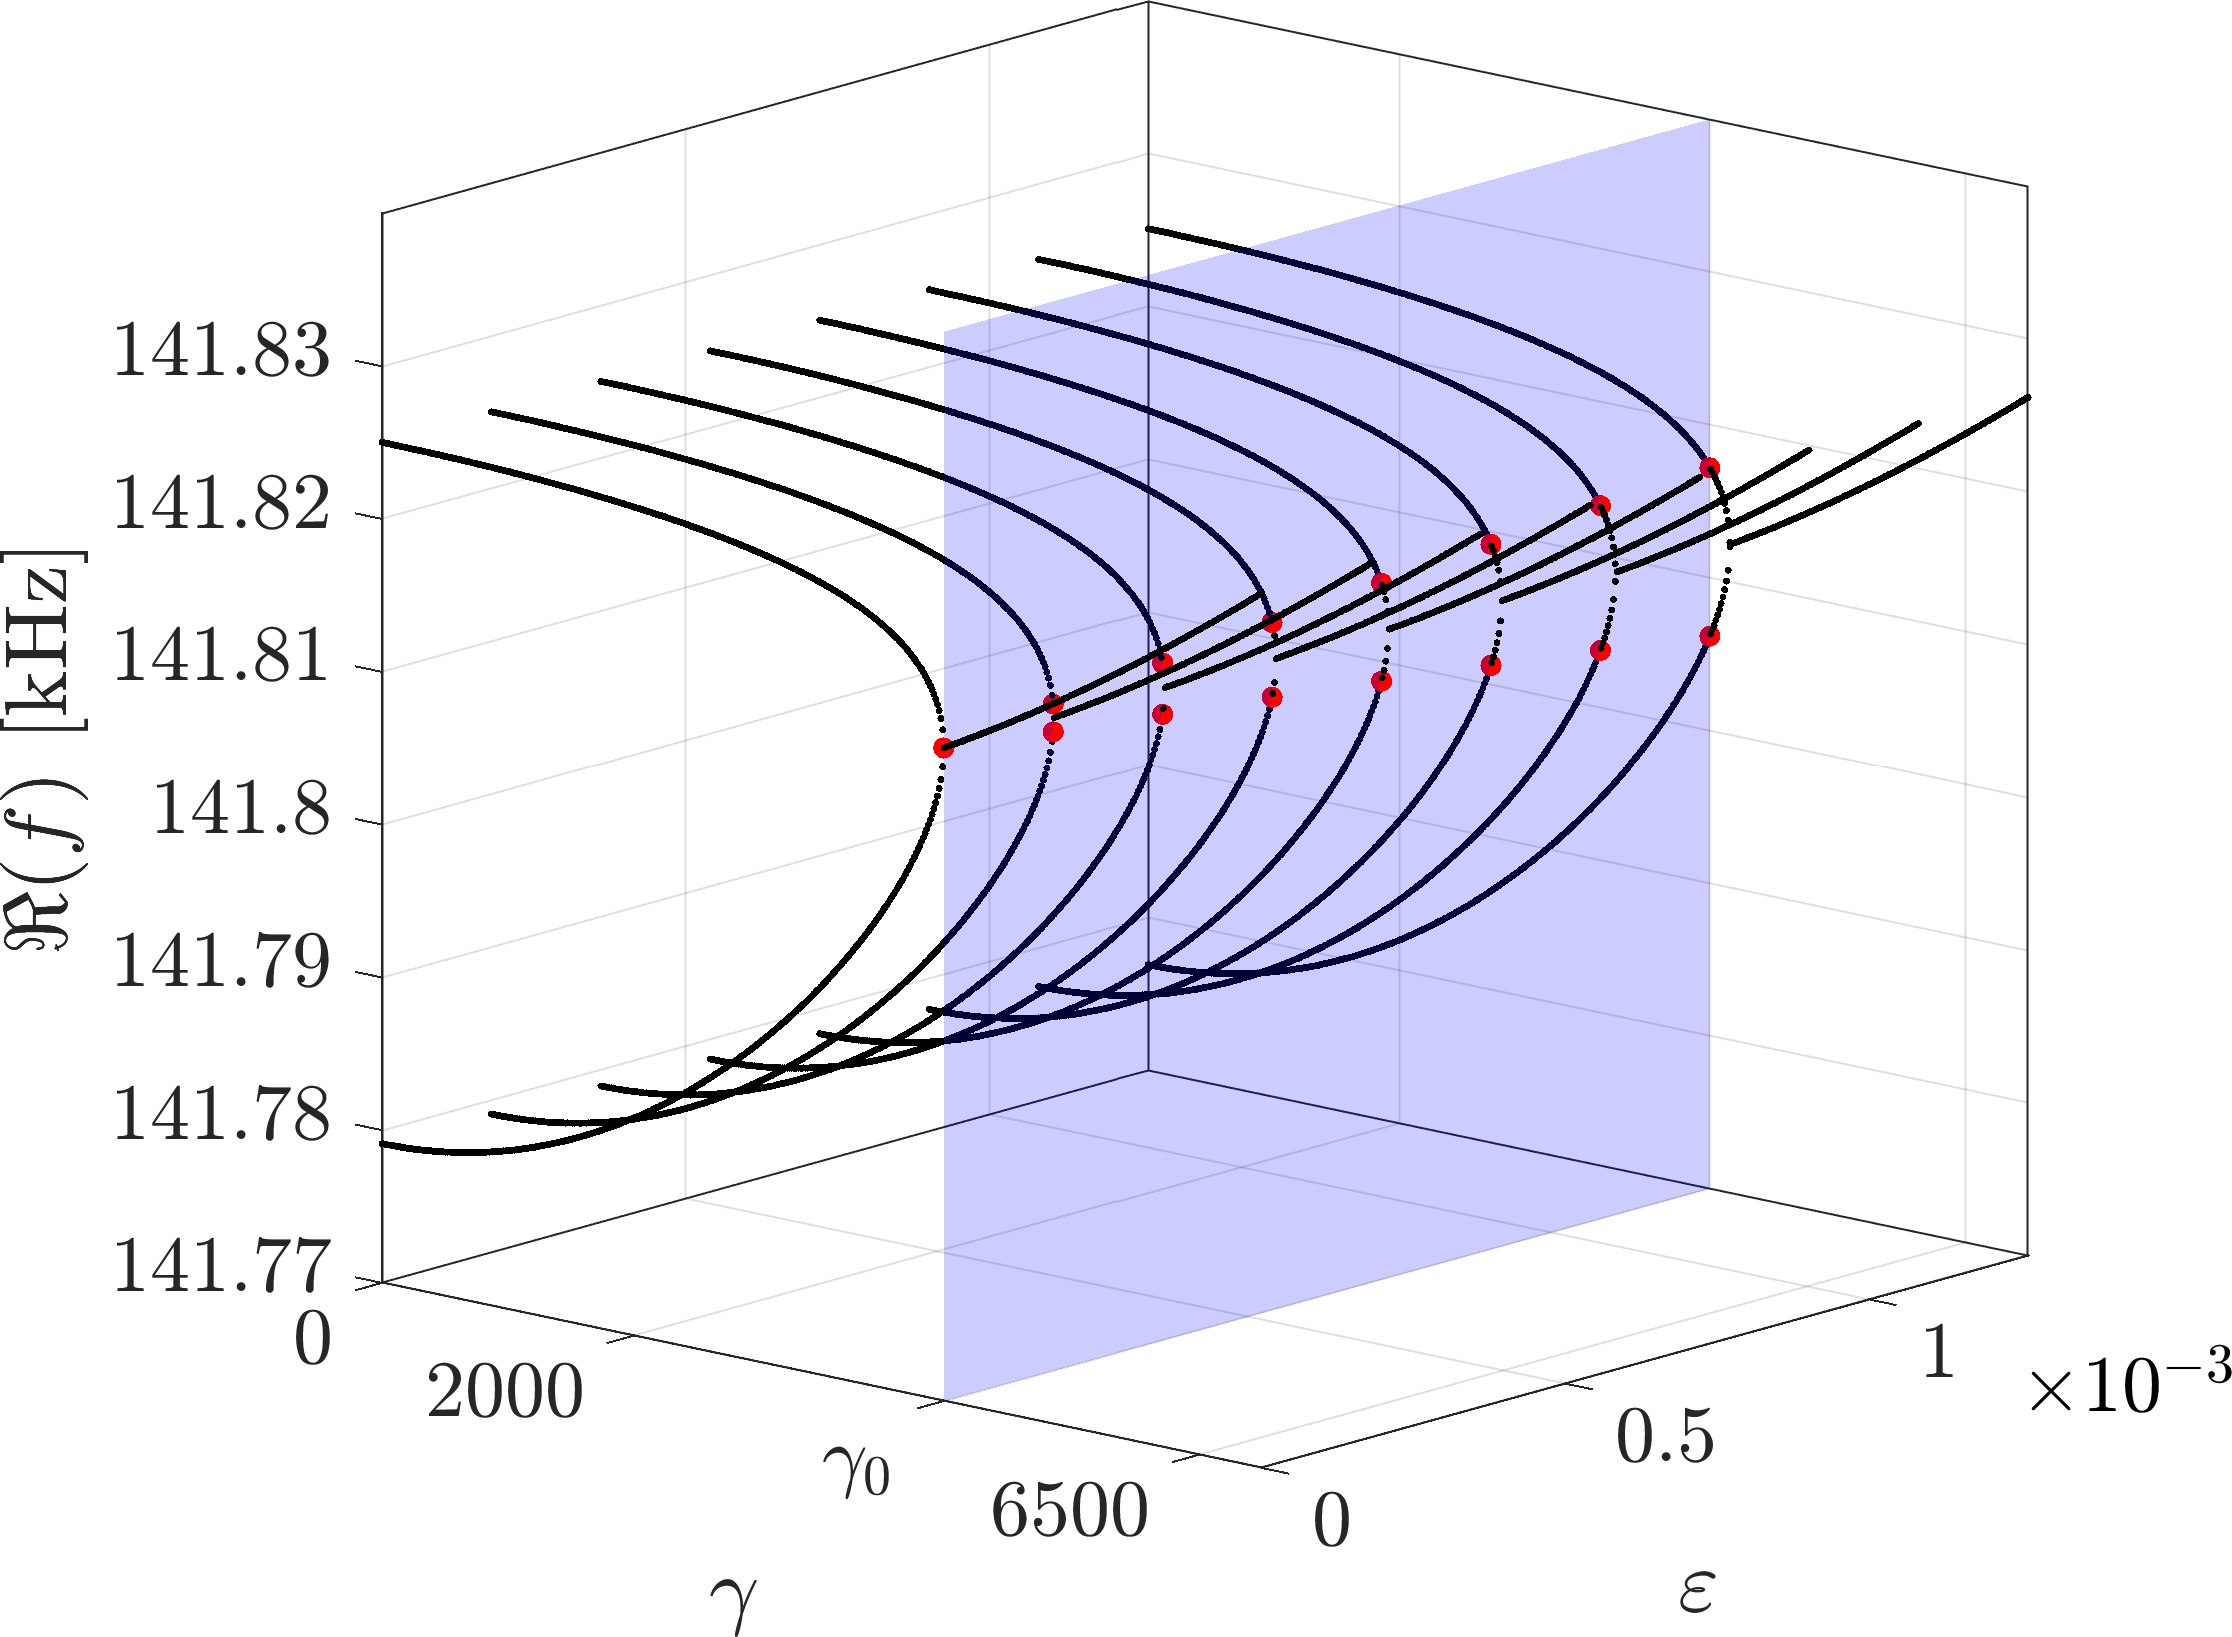
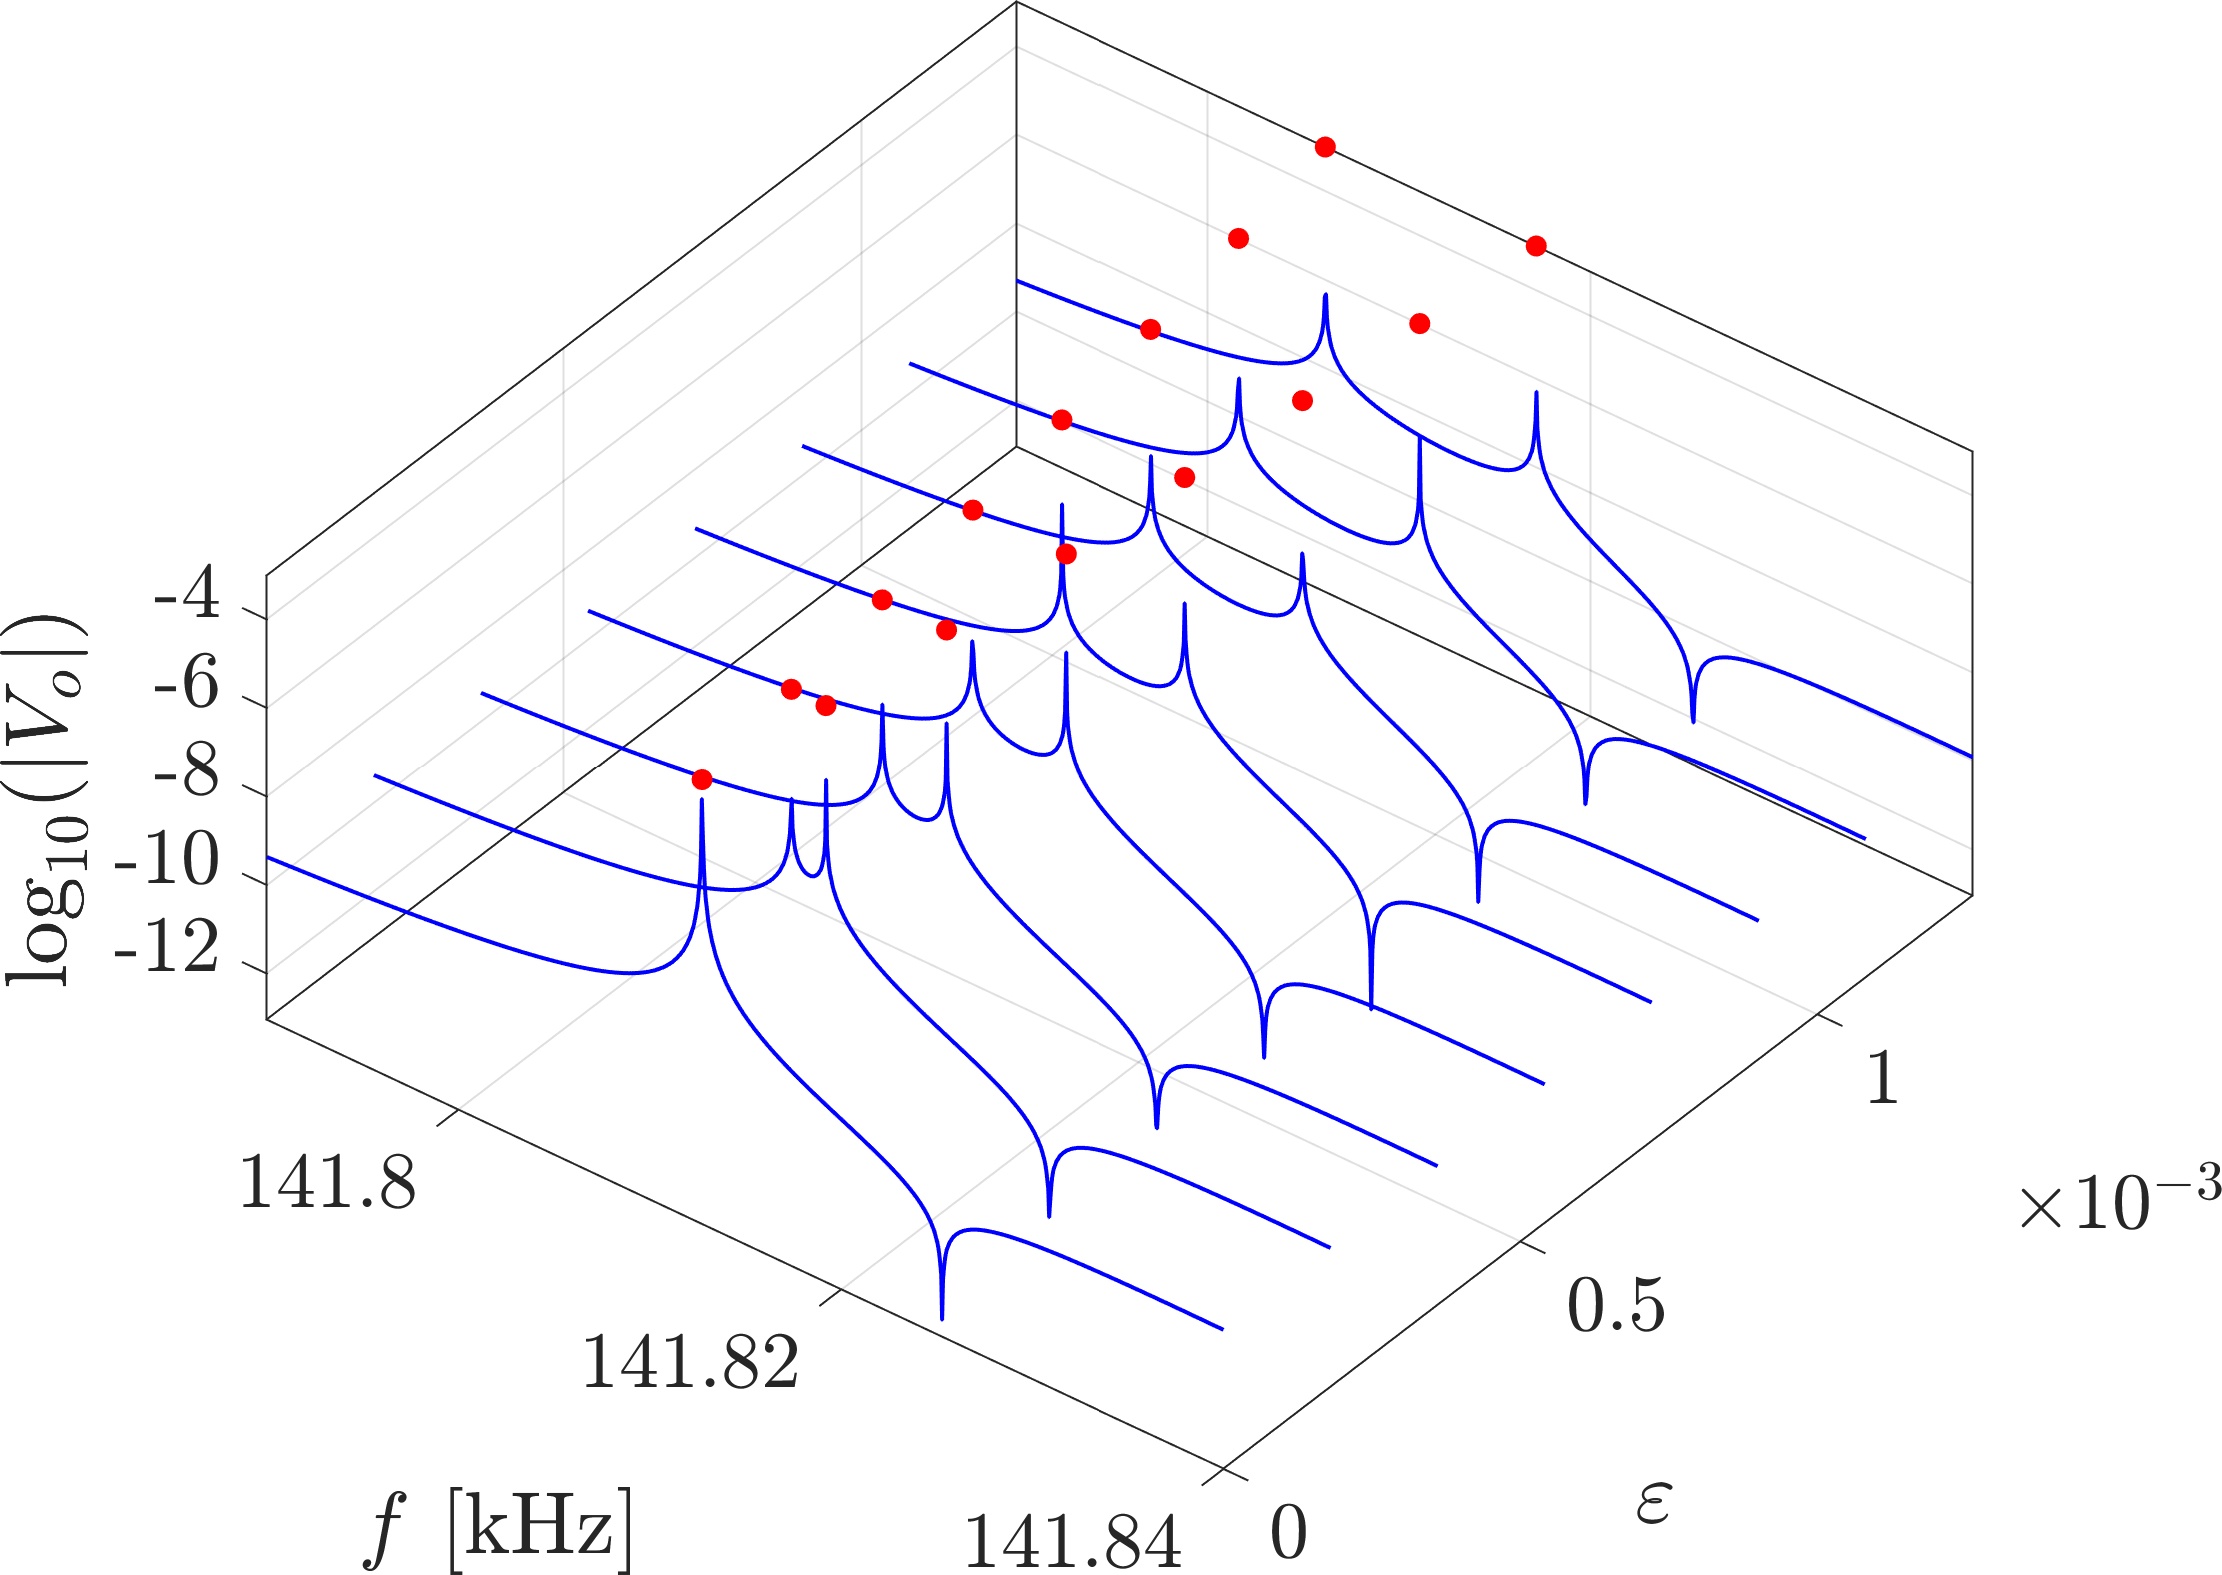
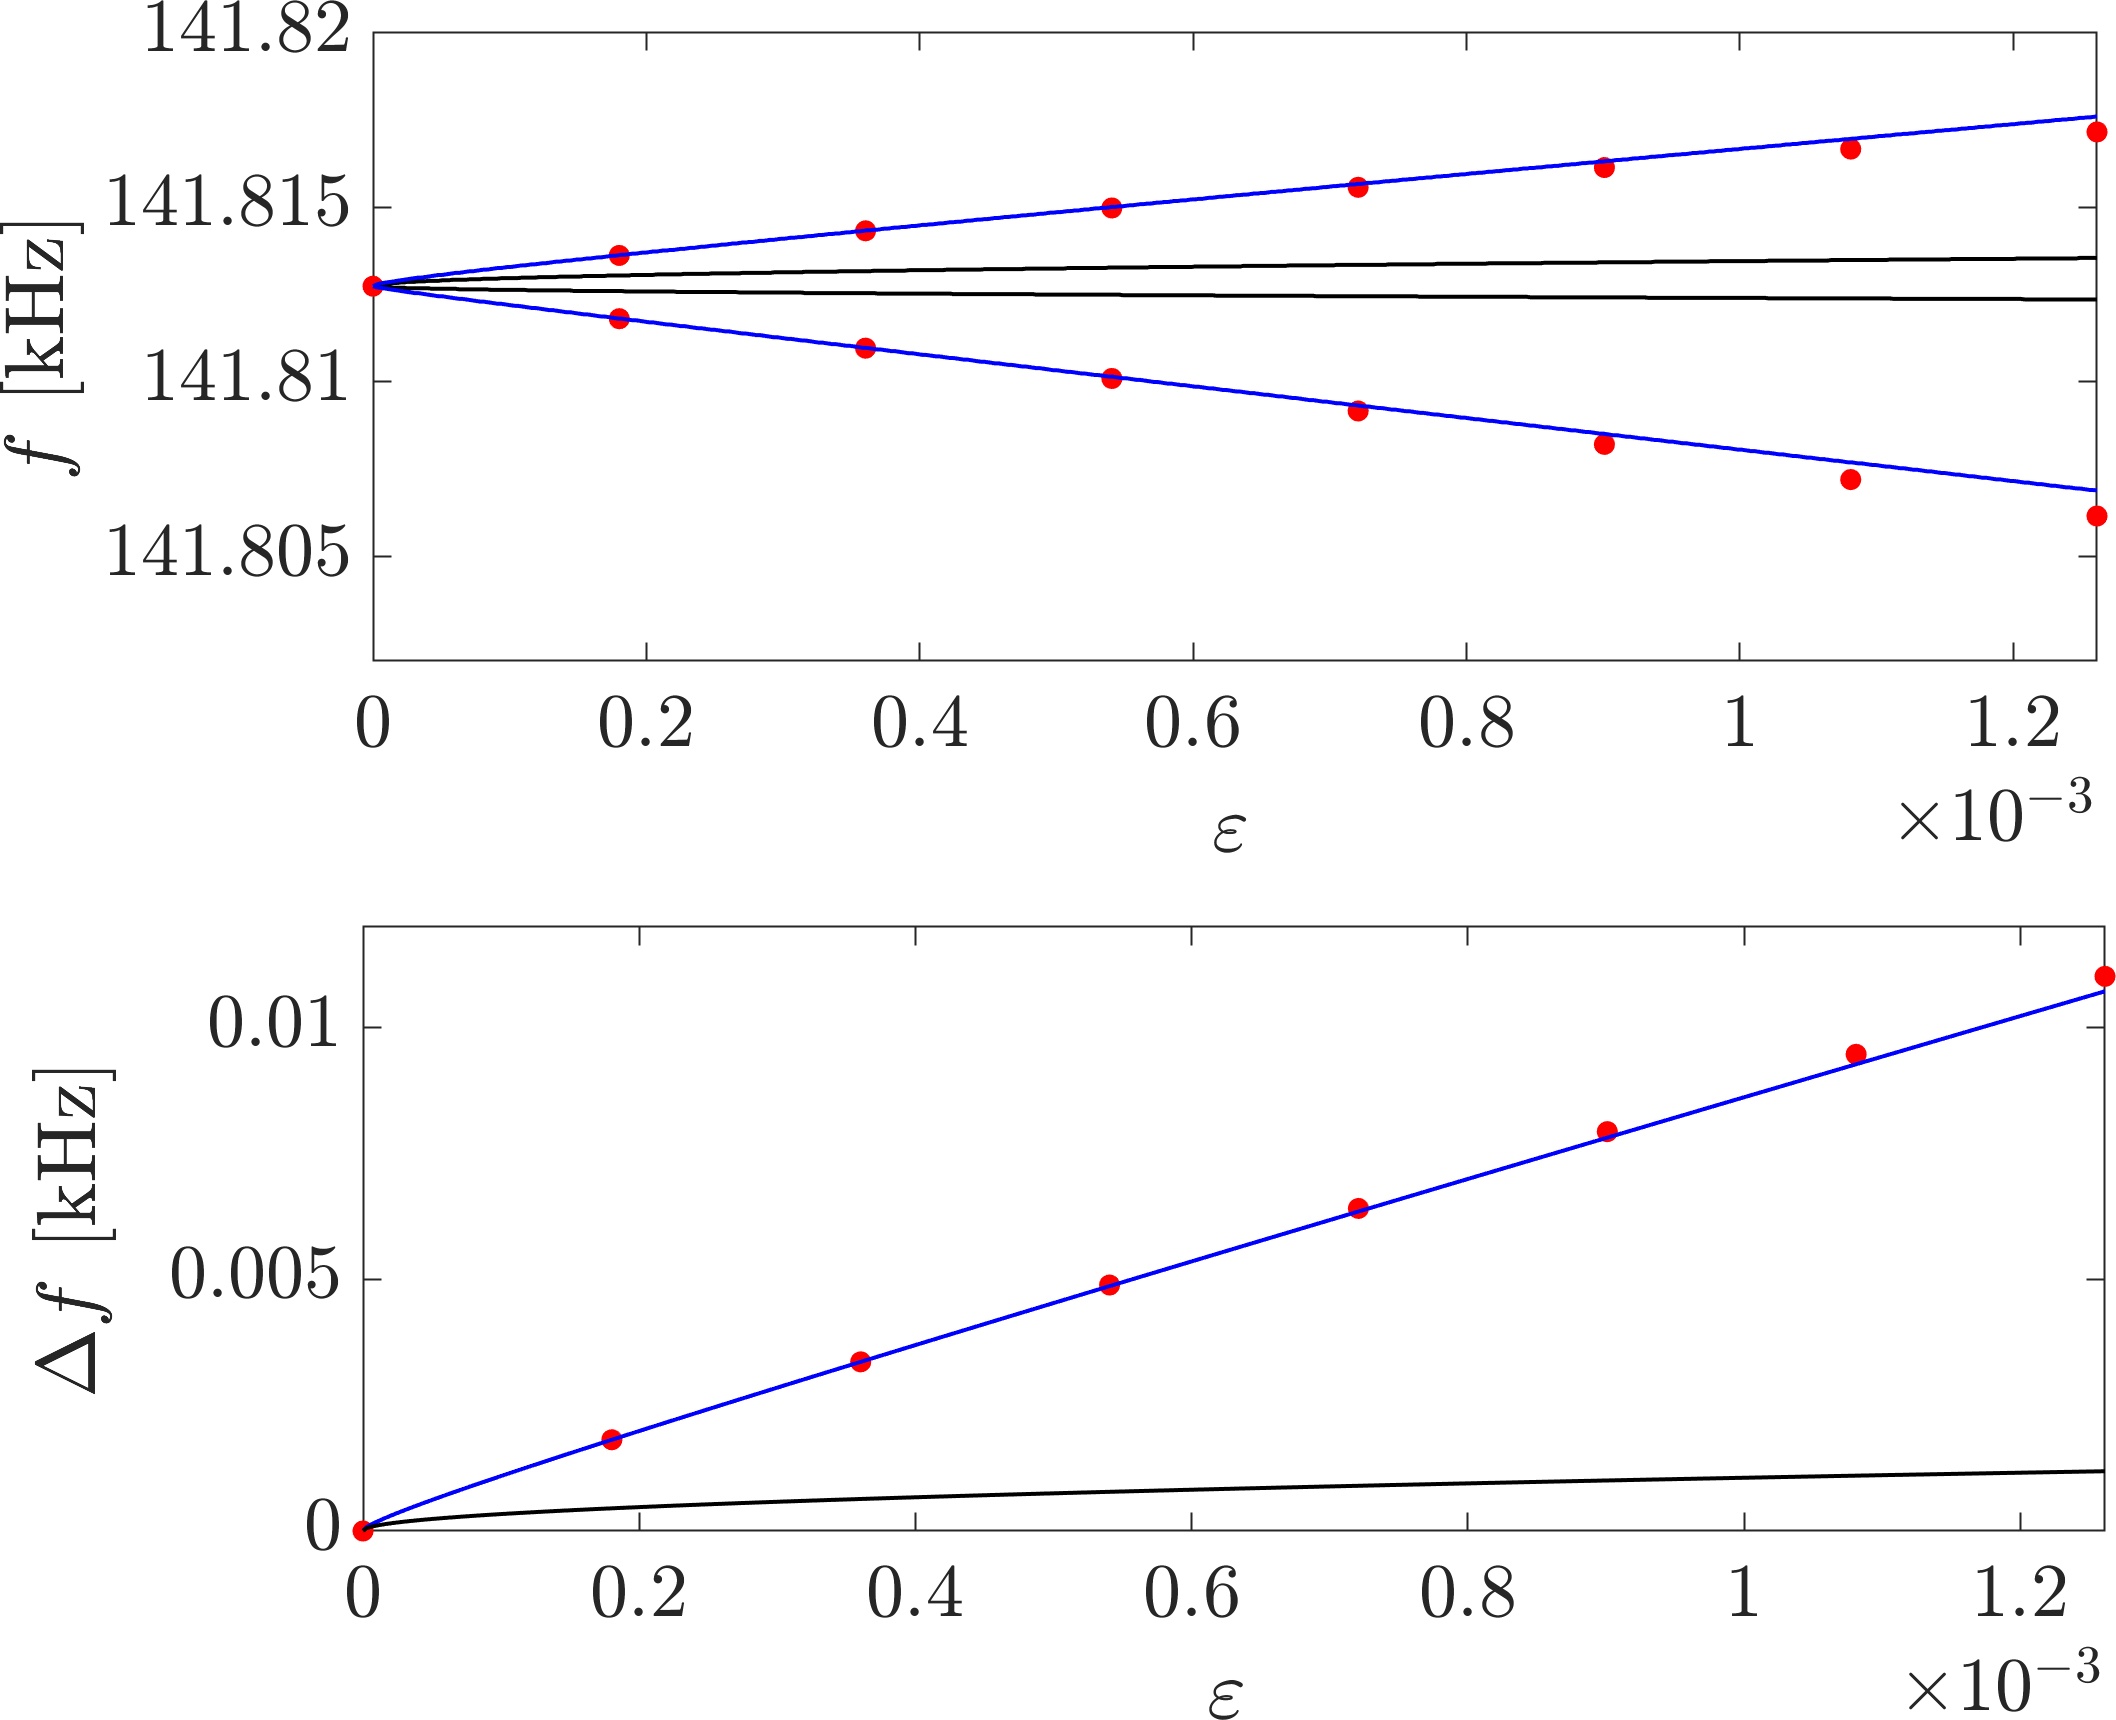
Next, we illustrate the sensitivity of the EP to the point mass inclusion. Figure 10 displays the real frequency component of the first EP for an added mass (red), which is compared to the baseline case with (black). Similar to the first EP of the rod spectrum (Fig. 4), the inclusion produces a considerable shift of the EP to a lower value, which we call . On the right panel, the frequency response measured by the sensor illustrates the splitting of the single resonant peak (red) into two separate peaks (black) occurring for (dashed blue line). The frequencies of the resonant peaks correspond to the eigenfrequencies for , as illustrated by dashed red and black lines. Starting from an added mass , Fig. 10 illustrates the variation of the eigenfrequencies for decreasing values (black), highlighting the bifurcation of the EP into two branches (red dots) for (blue plane). The frequency splitting can be measured by the response in the sensor as illustrated in Fig. 10, where red dots corresponding to the numerical eigenfrequencies match the frequency of the resonant peaks as is varied. Hence, by using the frequency split of the resonant peaks measured by the sensor, one could estimate the value of an inclusion whose mass lies in the considered region. While a perturbation analysis is not conducted for this case, we illustrate in Fig. 10 that the splitting from the EP occurs according to the ansatz given by Eqn. 7. In particular, a polynomial of the form can be fitted exactly to the first 3 points of each branch, resulting in the displayed solid curves. The behavior is similar to that of Fig. 5: the black line corresponds to the solution with only the dependence, showing a good agreement for lower values, while the blue line considers also the linear correction and better approximates the numerical solution for increasing values. The frequency splitting is displayed separately in Fig. 10, with solid curves corresponding to the polynomial fits. Thus, a sensor operating in such conditions would have a high sensitivity for masses around , since in that region.
III.3 Exceptional points from surface waves and crack sensing
We now consider the 2D domain depicted in Fig. 11, similar to that of Fig. 7 but with a higher height cm and fixed boundary conditions on all edges except the top surface. This modification facilitates the formation of vibration modes concentrated at the top surface, where in addition to point mass inclusions we also consider a defect in the form of a rectangular crack of dimensions . The domain also includes the PT symmetric pair of transducers located at cm and cm, with length cm, and the two smaller elements for actuating and sensing as previously defined. The free surface of the 2D domain supports surface (or Rayleigh) waves graff2012wave , whose wave speed can be approximated as , where is the shear wave speed, and is the Poisson’s ratio. This approximation gives m/s for the case at hand. We illustrate the formation of exceptional points from such surface wave modes, and their sensitivity to point mass inclusions and to the crack defect.

Figure 12 displays the real and imaginary eigenfrequency components as a function of in the frequency range of one EP, formed by a surface wave mode and a bulk mode. The modes are differentiated by a polarization factor defined as
| (27) |
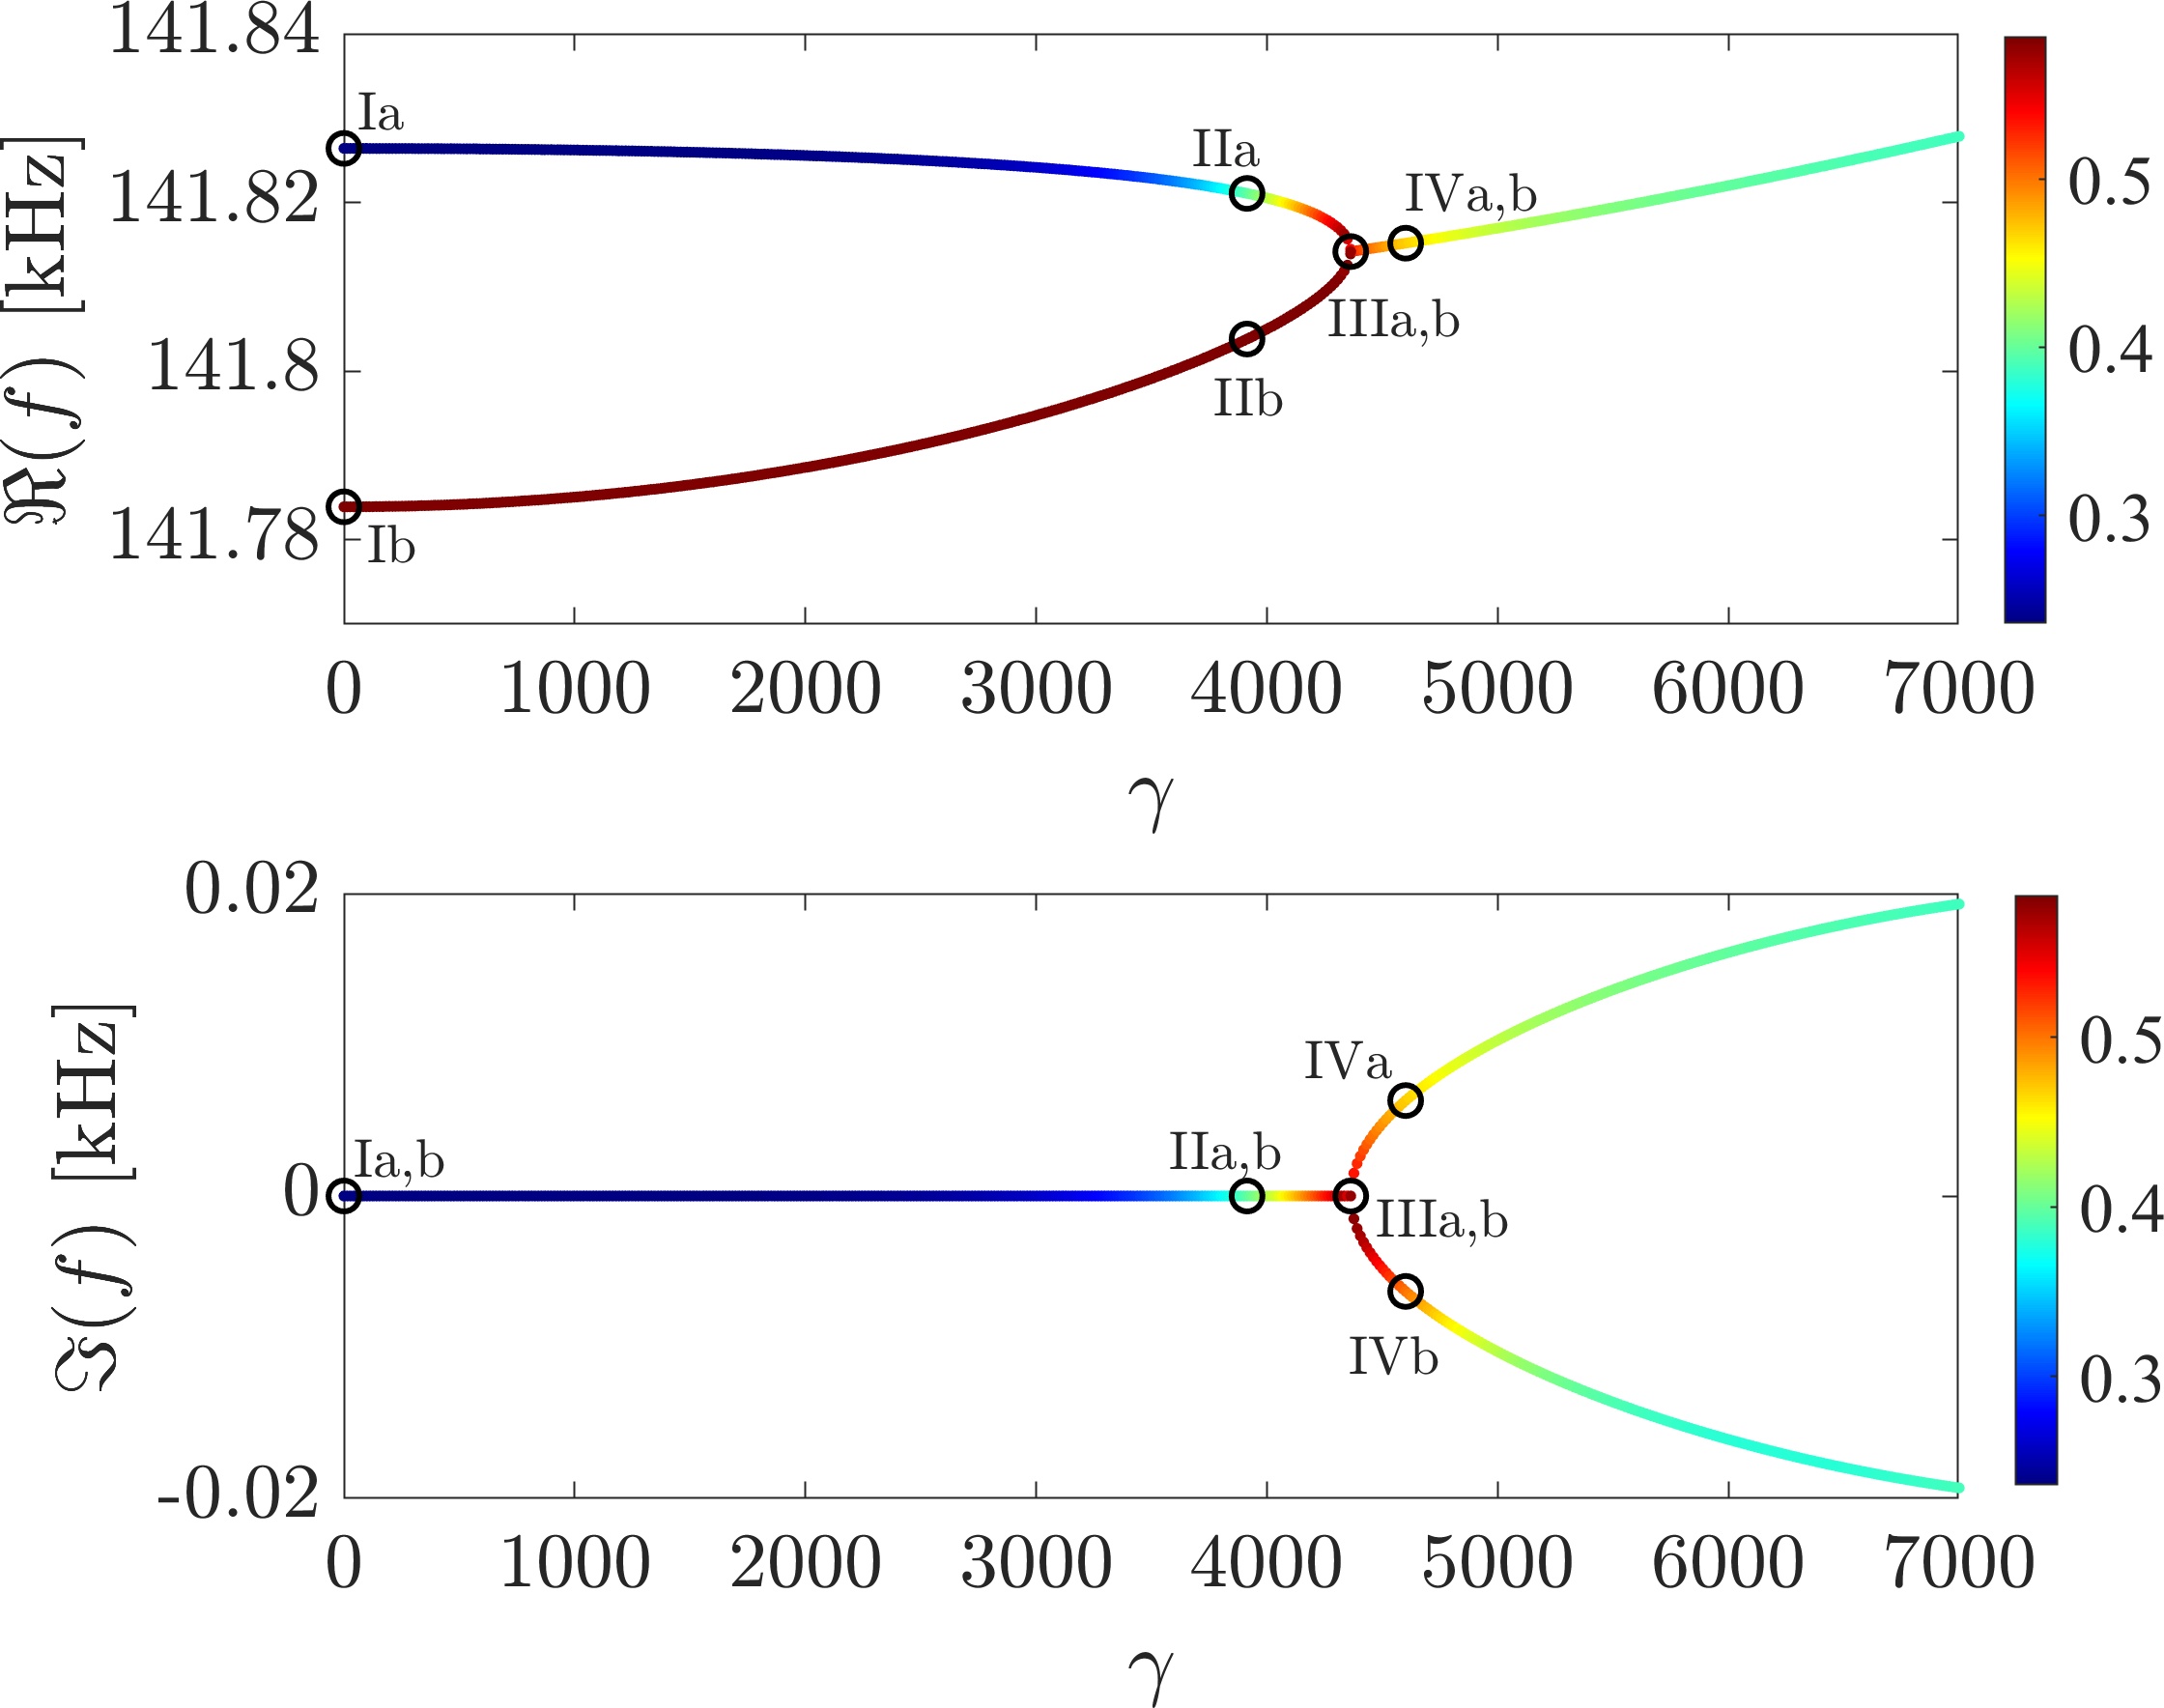
Such polarization factor averages the total displacement at a region near the top surface (), which is then divided by the total displacement integrated in the entire domain, and is employed as the color of the dots representing the eigenfrequencies in Fig. 12. Hence, higher values of (red) signal modes with energy concentrated at the surface, while lower values of (blue) indicate globally spanning modes, as verified in the mode shapes of Fig. 12. The modes concentrated at the surface are formed by a standing rayleigh wave, with a small contribution from other bulk modes. For example, mode Ib in Fig. 12 corresponds to an eigenfrequency of kHz. At that frequency, the non-dispersive rayleigh waves are characterized by a wavelength cm approximately. In the domain with cm, this mode should contain wavelengths approximately, which can be verified in its deformed shape displayed in Fig. 12. As increases, the surface mode hybridizes with the bulk mode to form the EP, as indicated by the color changes associated with , and also visualized in the deformed mode shapes displayed in Fig. 12. At the exceptional point, both eigenfrequencies produce a single linearly independent eigenvector, constituted primarily of a surface wave mode.

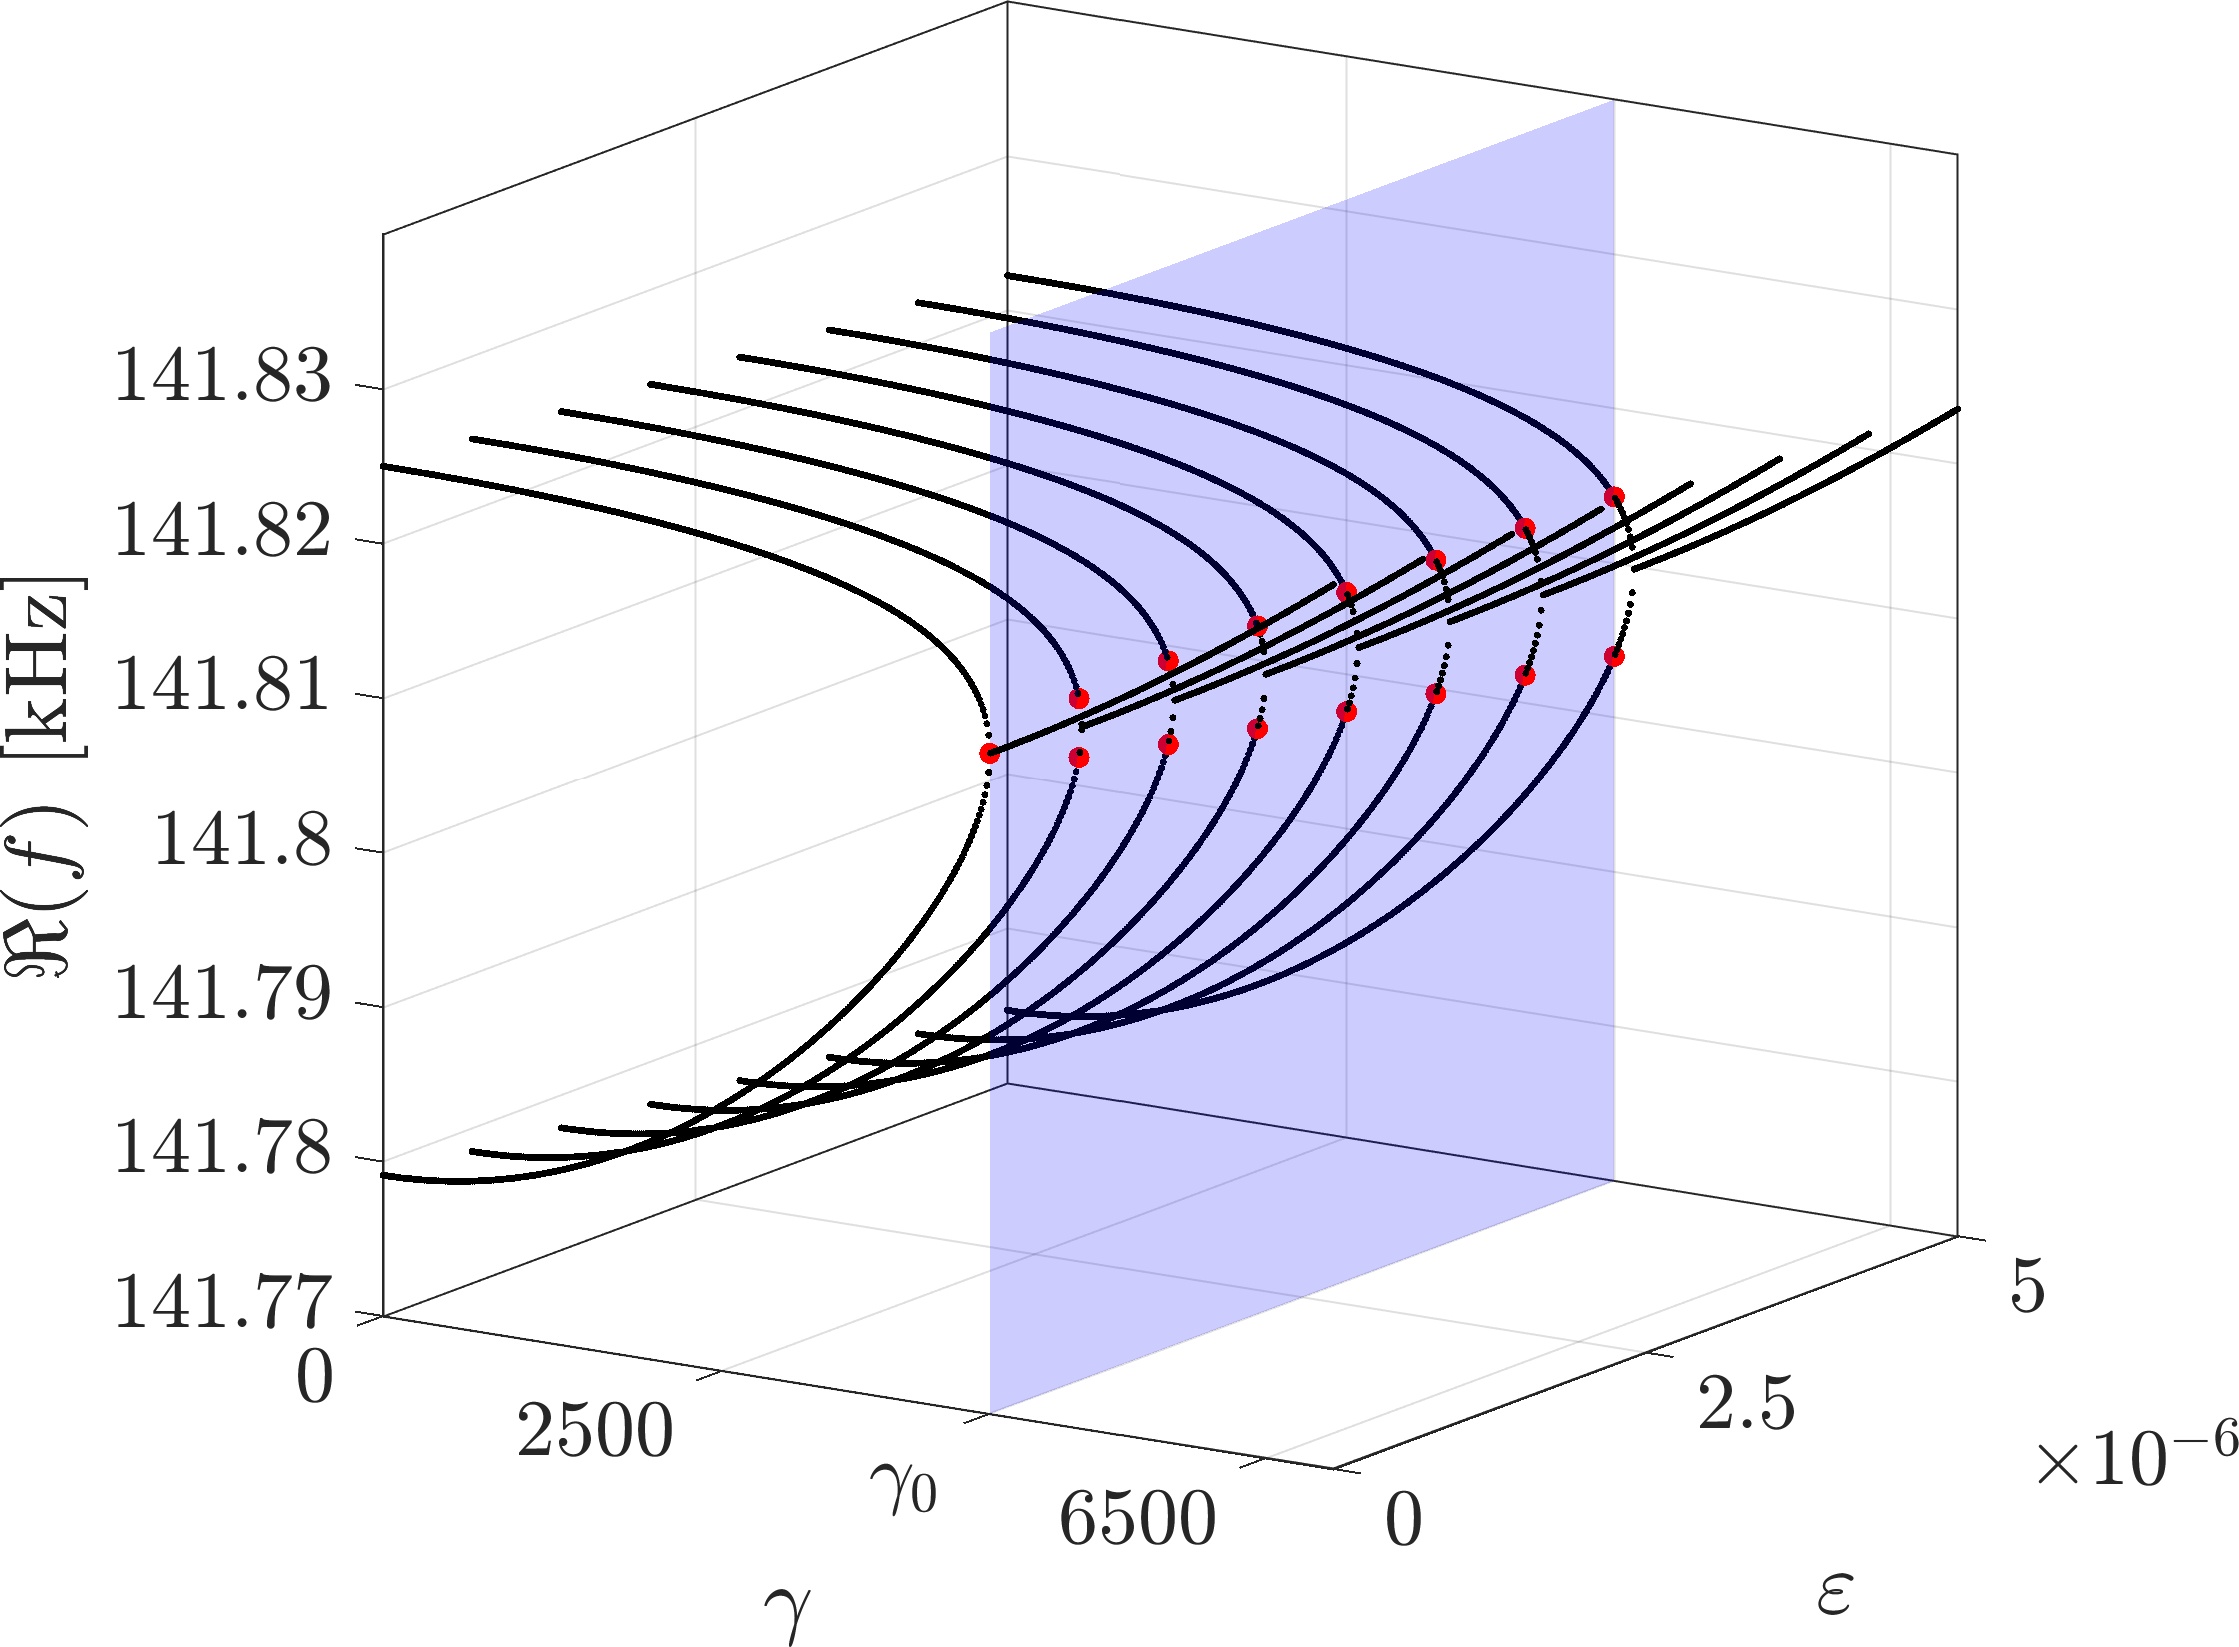
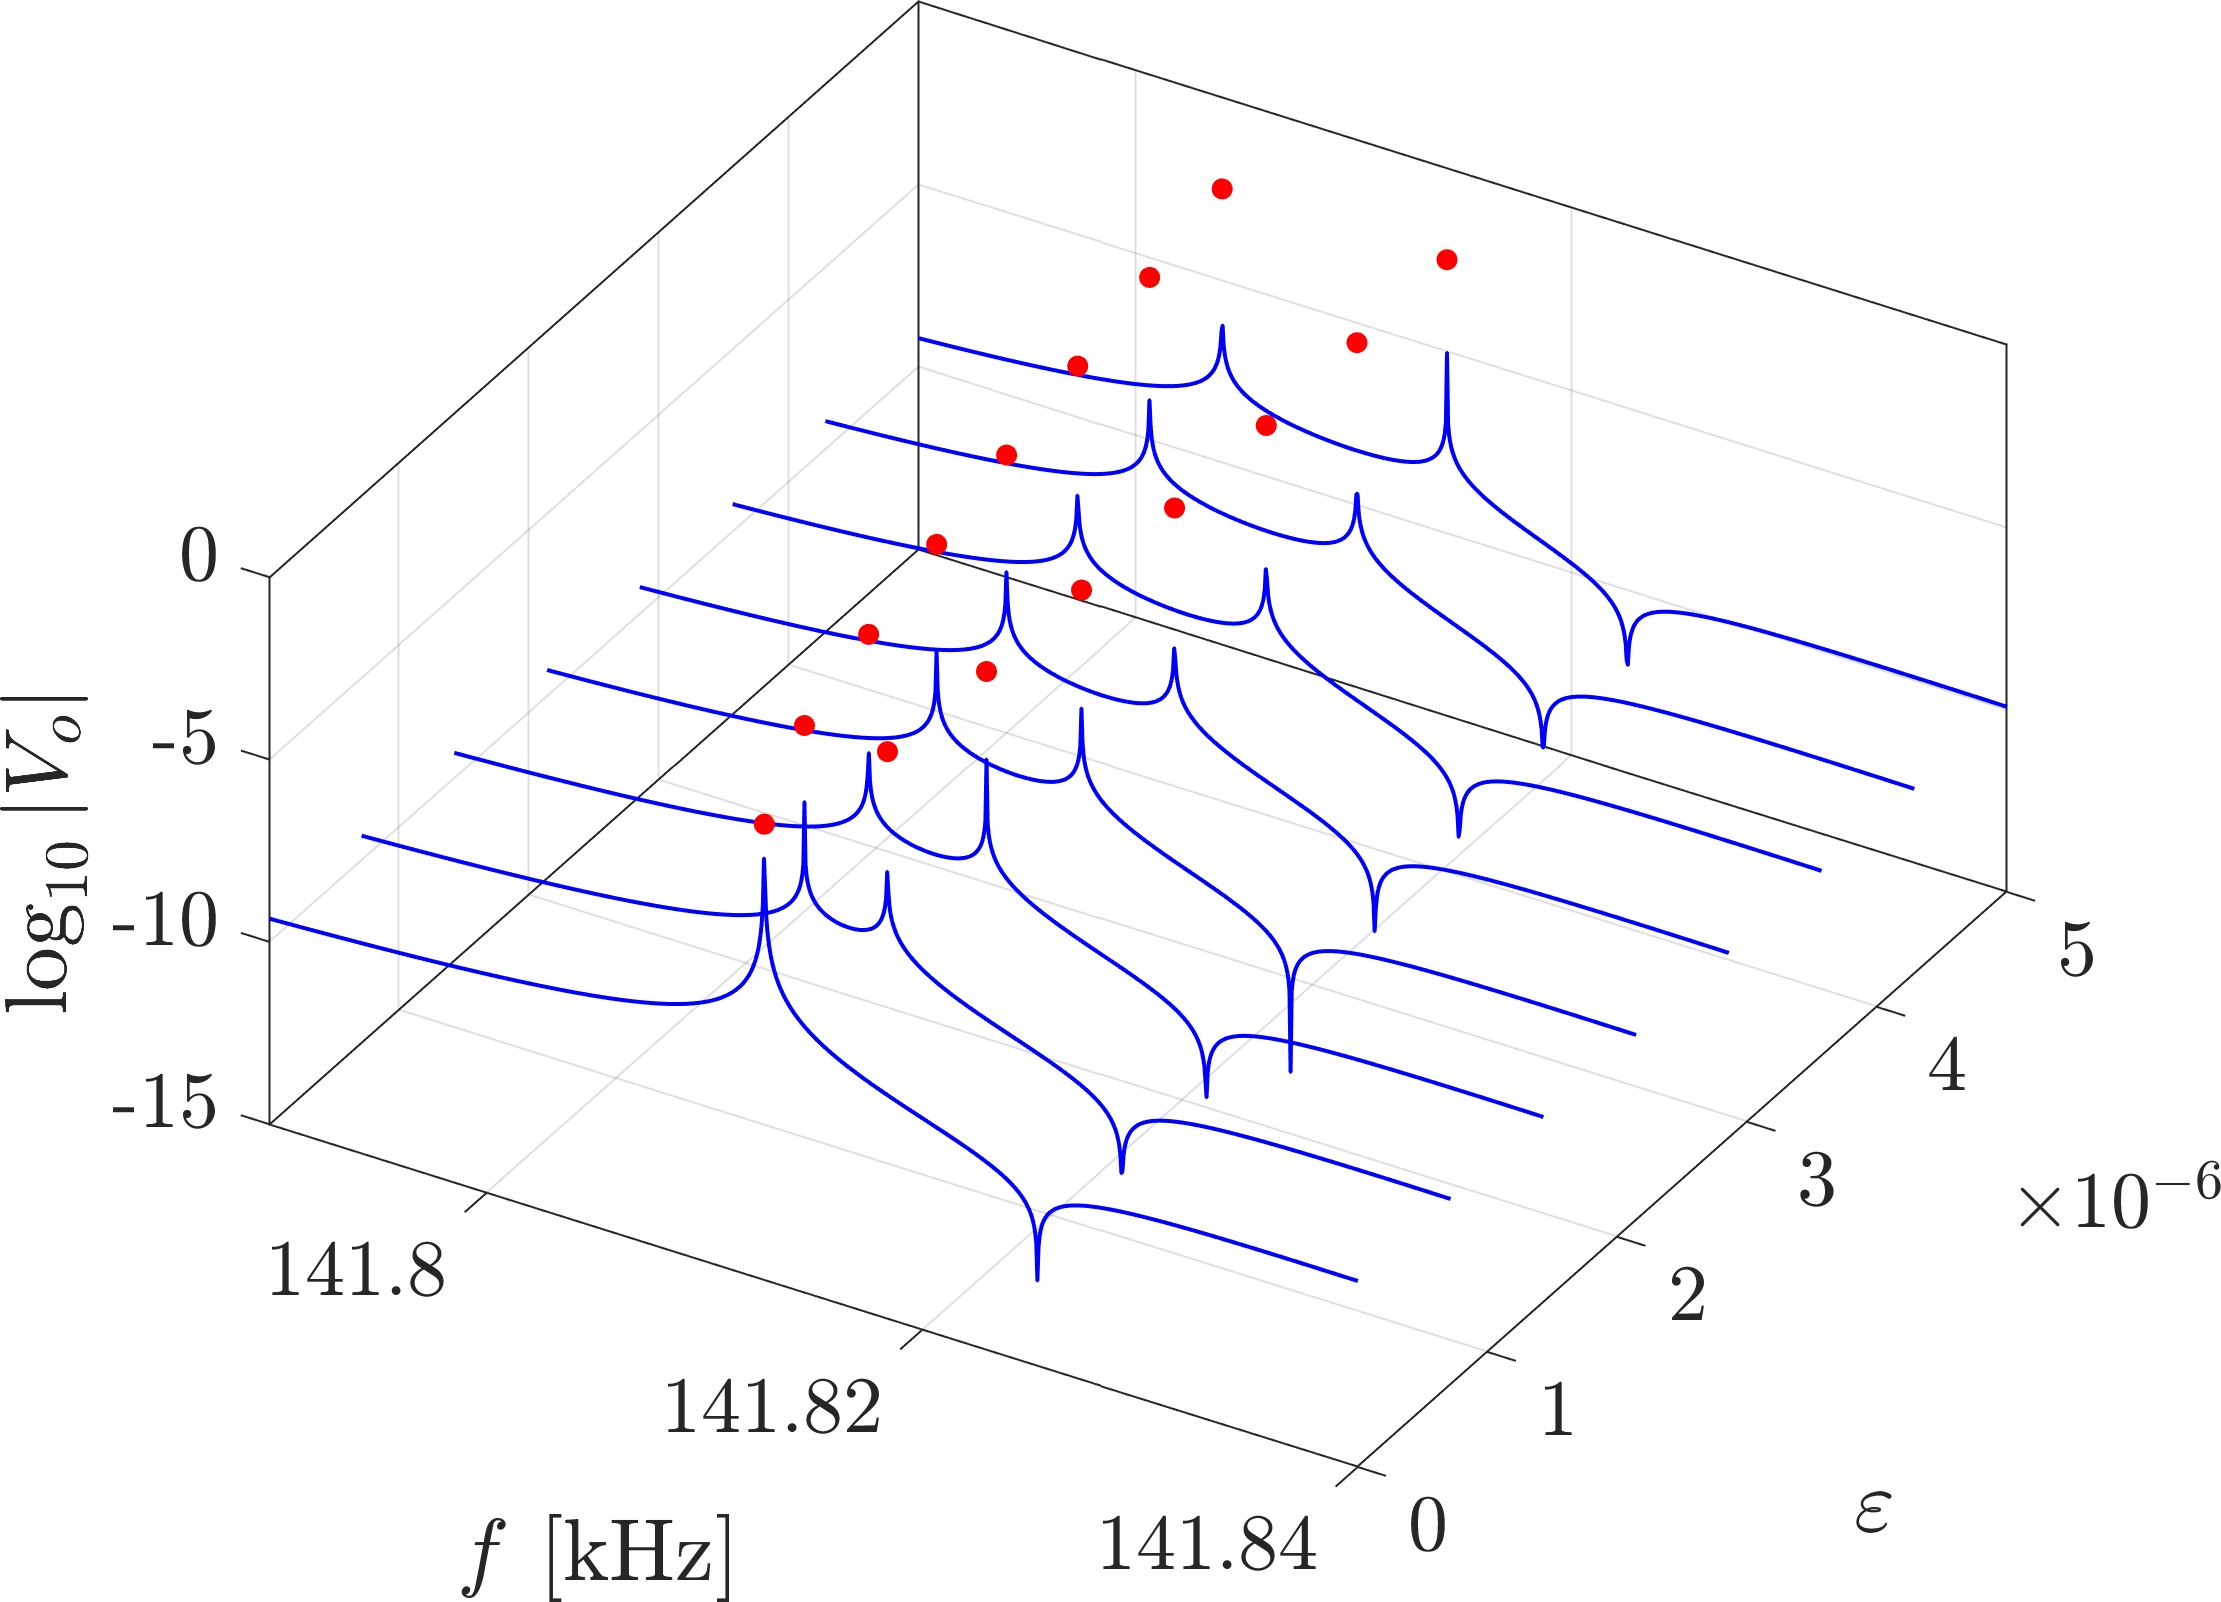
Finally, we investigate the sensitivity of the EP to a point mass inclusions and to a small crack defect. Fig. 13 displays the variation of the EP with the added mass , while Fig. 13 displays the variation with the crack height , for a fixed crack width of m. The blue planes for highlights the bifurcation of the EP as a function of the perturbation (red dots). Similar to previous results, this eigenfrequency splitting may be detected by monitoring the resonant peaks split (Figs. 13(b,d)). The corresponding frequency splits for the added mass and the crack are displayed in the top and bottom panels of Figs. 13(c,f), along with solid curves representing the polynomial fits previously described. Compared with previous results in this paper, we note that considerable shows a larger linear dependence on the perturbation, and a smaller square root dependence, especially for the case of the surface crack. A dominant square root dependence would be found for even smaller , which would generate a that would challenge the frequency resolution of sensing systems. These considerations will be the subject of future investigations.
IV Conclusions
In this work we have investigated elastic media such as 1D waveguides and 2D elastic domains, where PT-symmetric attachments leads to the formation of exceptional points in their vibrational spectra. We have illustrated the sensitivity of the EPs to defects such as point mass inclusions and surface cracks. In particular, the defects produce a bifurcation of the EP into two eigenfrequency branches which can be measured through the splitting of resonant peaks in the frequency response. Several opportunities are identified for future studies, such as the design of higher order EPs hodaei2017enhanced ; xiao2019enhanced which provide even higher sensitivity, investigations of alternative structures and PT-symmetric gain/loss strategies, influence of noise and non-linearities and experimental demonstrations. Also, this work suggests the monitoring of resonant peaks associated with global vibration modes as a detection strategy, but other methods based on wave scattering xiao2019enhanced might be of significance for future work on surface waves.
Acknowledgments
The authors gratefully acknowledge the support from the National Science Foundation (NSF) through the EFRI 1741685 grant and from the Army Research Office through grant W911NF-18-1-0036.
References
- [1] Y. Ashida, Z. Gong, M. Ueda, Non-hermitian physics, arXiv preprint arXiv:2006.01837 (2020).
- [2] T. E. Lee, Anomalous edge state in a non-hermitian lattice, Physical review letters 116 (13) (2016) 133903.
- [3] Y. Xiong, Why does bulk boundary correspondence fail in some non-hermitian topological models, Journal of Physics Communications 2 (3) (2018) 035043.
- [4] Z. Gong, Y. Ashida, K. Kawabata, K. Takasan, S. Higashikawa, M. Ueda, Topological phases of non-hermitian systems, Physical Review X 8 (3) (2018) 031079.
- [5] H. Shen, B. Zhen, L. Fu, Topological band theory for non-hermitian hamiltonians, Physical review letters 120 (14) (2018) 146402.
- [6] K. Kawabata, K. Shiozaki, M. Ueda, M. Sato, Symmetry and topology in non-hermitian physics, Physical Review X 9 (4) (2019) 041015.
- [7] A. Ghatak, M. Brandenbourger, J. van Wezel, C. Coulais, Observation of non-hermitian topology and its bulk-edge correspondence, arXiv preprint arXiv:1907.11619 (2019).
- [8] M. Brandenbourger, X. Locsin, E. Lerner, C. Coulais, Non-reciprocal robotic metamaterials, arXiv preprint arXiv:1903.03807 (2019).
- [9] M. I. Rosa, M. Ruzzene, Dynamics and topology of non-hermitian elastic lattices with non-local feedback control interactions, New Journal of Physics 22 (5) (2020) 053004.
- [10] S. Longhi, Parity-time symmetry meets photonics: A new twist in non-hermitian optics, EPL (Europhysics Letters) 120 (6) (2018) 64001.
- [11] R. El-Ganainy, K. G. Makris, M. Khajavikhan, Z. H. Musslimani, S. Rotter, D. N. Christodoulides, Non-hermitian physics and pt symmetry, Nature Physics 14 (1) (2018) 11–19.
- [12] M.-A. Miri, A. Alù, Exceptional points in optics and photonics, Science 363 (6422) (2019) eaar7709.
- [13] C. M. Bender, S. Boettcher, Real spectra in non-hermitian hamiltonians having p t symmetry, Physical Review Letters 80 (24) (1998) 5243.
- [14] C. M. Bender, B. K. Berntson, D. Parker, E. Samuel, Observation of pt phase transition in a simple mechanical system, American Journal of Physics 81 (3) (2013) 173–179.
- [15] Z. Lin, H. Ramezani, T. Eichelkraut, T. Kottos, H. Cao, D. N. Christodoulides, Unidirectional invisibility induced by p t-symmetric periodic structures, Physical Review Letters 106 (21) (2011) 213901.
- [16] R. Fleury, D. Sounas, A. Alu, An invisible acoustic sensor based on parity-time symmetry, Nature communications 6 (2015) 5905.
- [17] L. Feng, Z. J. Wong, R.-M. Ma, Y. Wang, X. Zhang, Single-mode laser by parity-time symmetry breaking, Science 346 (6212) (2014) 972–975.
- [18] H. Hodaei, A. U. Hassan, S. Wittek, H. Garcia-Gracia, R. El-Ganainy, D. N. Christodoulides, M. Khajavikhan, Enhanced sensitivity at higher-order exceptional points, Nature 548 (7666) (2017) 187.
- [19] W. Chen, Ş. K. Özdemir, G. Zhao, J. Wiersig, L. Yang, Exceptional points enhance sensing in an optical microcavity, Nature 548 (7666) (2017) 192.
- [20] Z. Xiao, H. Li, T. Kottos, A. Alù, Enhanced sensing and nondegraded thermal noise performance based on p t-symmetric electronic circuits with a sixth-order exceptional point, Physical Review Letters 123 (21) (2019) 213901.
- [21] X. Zhu, H. Ramezani, C. Shi, J. Zhu, X. Zhang, P t-symmetric acoustics, Physical Review X 4 (3) (2014) 031042.
- [22] J. Christensen, M. Willatzen, V. Velasco, M.-H. Lu, Parity-time synthetic phononic media, Physical review letters 116 (20) (2016) 207601.
- [23] T. Liu, X. Zhu, F. Chen, S. Liang, J. Zhu, Unidirectional wave vector manipulation in two-dimensional space with an all passive acoustic parity-time-symmetric metamaterials crystal, Physical review letters 120 (12) (2018) 124502.
- [24] Q. Wu, Y. Chen, G. Huang, Asymmetric scattering of flexural waves in a parity-time symmetric metamaterial beam, The Journal of the Acoustical Society of America 146 (1) (2019) 850–862.
- [25] Z. Hou, B. Assouar, Tunable elastic parity-time symmetric structure based on the shunted piezoelectric materials, Journal of Applied Physics 123 (8) (2018) 085101.
- [26] Z. Zhang, M. R. López, Y. Cheng, X. Liu, J. Christensen, Non-hermitian sonic second-order topological insulator, Physical review letters 122 (19) (2019) 195501.
- [27] M. R. López, Z. Zhang, D. Torrent, J. Christensen, Multiple scattering theory of non-hermitian sonic second-order topological insulators, Communications Physics 2 (1) (2019) 1–7.
- [28] V. Domínguez-Rocha, R. Thevamaran, F. Ellis, T. Kottos, Environmentally induced exceptional points in elastodynamics, Physical Review Applied 13 (1) (2020) 014060.
- [29] R. Kononchuk, T. Kottos, Orientation-sensed optomechanical accelerometers based on exceptional points, Physical Review Research 2 (2) (2020) 023252.
- [30] G. Shmuel, N. Moiseyev, Linking scalar elastodynamics and non-hermitian quantum mechanics, Physical Review Applied 13 (2) (2020) 024074.
- [31] V. Sharma, M. Ruzzene, S. Hanagud, Perturbation methods for the analysis of the dynamic behavior of damaged plates, International Journal of Solids and Structures 43 (16) (2006) 4648–4672.
- [32] H. Luo, S. Hanagud, An integral equation for changes in the structural dynamics characteristics of damaged structures, International Journal of Solids and Structures 34 (35-36) (1997) 4557–4579.
- [33] W. Staszewski, C. Boller, G. R. Tomlinson, Health monitoring of aerospace structures: smart sensor technologies and signal processing, John Wiley & Sons, 2004.
- [34] V. Giurgiutiu, Structural health monitoring: with piezoelectric wafer active sensors, Elsevier, 2007.
- [35] M. Ruzzene, Frequency-wavenumber domain filtering for improved damage visualization, in: Ultrasonic and Advanced Methods for Nondestructive Testing and Material Characterization, World Scientific, 2007, pp. 591–611.
- [36] S. S. Kessler, S. M. Spearing, C. Soutis, Damage detection in composite materials using lamb wave methods, Smart materials and structures 11 (2) (2002) 269.
- [37] B. Jakoby, M. J. Vellekoop, Viscosity sensing using a love-wave device, Sensors and Actuators A: Physical 68 (1-3) (1998) 275–281.
- [38] J. Du, G. Harding, J. A. Ogilvy, P. Dencher, M. Lake, A study of love-wave acoustic sensors, Sensors and Actuators A: Physical 56 (3) (1996) 211–219.
- [39] L. Meirovitch, Elements of vibration analysis, McGraw-Hill Science, Engineering & Mathematics, 1975.
-
[40]
R. K. Pal, M. I. N. Rosa, M. Ruzzene,
Topological bands and
localized vibration modes in quasiperiodic beams, New Journal of Physics
21 (9) (2019) 093017.
doi:10.1088/1367-2630/ab3cd7.
URL https://doi.org/10.1088%2F1367-2630%2Fab3cd7 - [41] A. P. Seyranian, A. A. Mailybaev, Multiparameter stability theory with mechanical applications, Vol. 13, World Scientific, 2003.
- [42] A. Raghavan, C. E. Cesnik, Finite-dimensional piezoelectric transducer modeling for guided wave based structural health monitoring, Smart materials and structures 14 (6) (2005) 1448.
- [43] M. Collet, M. Ruzzene, K. Cunefare, Generation of lamb waves through surface mounted macro-fiber composite transducers, Smart Materials and Structures 20 (2) (2011) 025020.
- [44] J. Marconi, E. Riva, M. Di Ronco, G. Cazzulani, F. Braghin, M. Ruzzene, Experimental observation of nonreciprocal band gaps in a space-time-modulated beam using a shunted piezoelectric array, Physical Review Applied 13 (3) (2020) 031001.
- [45] Y. Xia, E. Riva, M. I. Rosa, G. Cazzulani, A. Erturk, F. Braghin, M. Ruzzene, Experimental observation of temporal pumping in electro-mechanical waveguides, arXiv preprint arXiv:2006.07348 (2020).
- [46] K. F. Graff, Wave motion in elastic solids, Courier Corporation, 2012.