The AWAKE Collaboration
Proton Bunch Self-Modulation in Plasma with Density Gradient
Abstract
We study experimentally the effect of linear plasma density gradients on the self-modulation of a 400 GeV proton bunch. Results show that a positive/negative gradient in/decreases the number of micro-bunches and the relative charge per micro-bunch observed after 10 m of plasma. The measured modulation frequency also in/decreases. With the largest positive gradient we observe two frequencies in the modulation power spectrum. Results are consistent with changes in wakefields’ phase velocity due to plasma density gradient adding to the slow wakefields’ phase velocity during self-modulation growth predicted by linear theory.
Self-modulation (SM) of long, relativistic charged particle bunches was proposed in order to take advantage of bunches that carry large amounts of energy (kilojoules) to drive large amplitude wakefields (1 GV/m) in long plasma KumarFirstSMI10 . In the SM process the transverse component of noise wakefields from the plasma or bunch, or a transverse component externally imposed as seed, grows and transforms the long bunch into a train of micro-bunches through periodic focusing and defocusing. In a neutral plasma with electron density the periodicity of the micro-bunches is given by the plasma electron angular frequency: =2, where bib:cst . Micro-bunches are shorter than . The incoming bunch is considered as long when its duration is . The SM of a 400 GeV, 230 ps rms duration proton bunch in a 10 m-long plasma with density in the 1014-1015 cm-3 range (11t3.5 ps) was recently demonstrated experimentally bib:karl ; bib:turner . Results show that the modulation frequency observed after the plasma is equal to the plasma electron frequency inferred from the singly-ionized rubidium (Rb) vapor density bib:karl , and that the SM process grows both along the bunch and plasma bib:turner , all as expected from theory. Transition between the instability regime and the seeded regime was also observed bib:fabianSSMSMI , demonstrating the ability to control the SM process, a necessary condition for practical accelerators.
It was recognized in two simultaneous theory/simulation papers bib:phasevelocity ; bib:schroeder that during growth of the SM process the wakefields’ phase velocity is slower than the speed of the 400 GeV proton bunch. The wakefields’ phase velocity reaches essentially the velocity of the bunch only after saturation of the SM process. Both papers focused on the effect of slow wakefields’ phase velocity on electron acceleration during wakefields’ growth. Both also refer to a possible solution that was devised for the case of a long laser pulse self-modulating in a plasma: a plasma density gradient to manipulate the effective wakefields’ phase velocity bib:pukhov2 . Plasma density gradients were proposed to overcome dephasing limitations on energy gain in laser wakefield accelerators bib:kats . One can expect a plasma density gradient to also affect the SM process of a particle bunch, perhaps leading to larger amplitude wakefields after saturation.
In this Letter we focus on the effect of plasma density gradients on the bunch that drives wakefields. In the experiment, we measure the effect of linear density gradients on the parameters of a 400 GeV proton bunch after 10 m of propagation in plasma. We show that the time-resolved train of micro-bunches resulting from the SM process becomes longer/shorter and that the relative charge per micro-bunch exiting the plasma in/decreases as the gradient is made more positive/negative, in practice with density larger/smaller at the plasma exit than at its entrance. An independent time integrated charge diagnostic confirms the increase in charge remaining near the bunch axis with increasing density gradient value . We show with two diagnostics that the proton bunch modulation frequency, equal to the plasma frequency without gradient bib:karl , in/decreases with in/decreasing gradient values. At large gradient values (1%/m) we observe saturation and for =+1.9%/m two frequencies appearing in the spectrum of the modulated bunch.
Changes in charge and modulation frequency are consistent with change in phase velocity of the wakefields. The larger/smaller charge measured with positive/negative gradient is consistent with the wakefields’ phase velocity being slower than that of protons, or negative in the protons’ reference frame. Results presented here have been obtained in the AWAKE experiment MuggliPPCF17 .
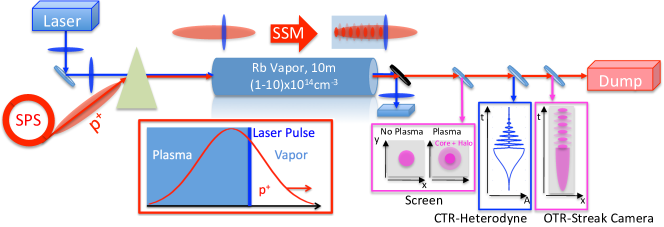
A schematic of the AWAKE experimental setup is shown in Fig. 1. The 400 GeV proton bunch from the CERN Super Proton Synchrotron with a population of (2.980.16)1011 particles is focused to a rms transverse size near the entrance of the plasma. It has a rms duration =230 ps. A 120 fs-long laser pulse with an energy of 110 mJ creates the plasma by singly ionizing a Rb vapor to form a cylinder of plasma, 1 mm in radius, over the 10 m-long vapor column. The sharp (28.3 ps for the plasma density used here), relativistic ionization front created by the laser pulse provides seeding for the SM process bib:karl ; bib:fabianSSMSMI . The SM process and its phase are reproducible from event to event, i.e., in the seeded self-modulation (SSM) regime MuggliPPCF17 ; bib:fabianSSMSMI . For this purpose the laser pulse is co-propagating within the proton bunch, at a time =128 ps (0.56) ahead of the bunch center (see Fig. 1 Inset).
Experiments were performed with a fixed vapor density of =(1.8040.004)cm-3 at the plasma entrance, varying density at its exit. The vapor density gradient is controlled by the temperature of two reservoirs evaporating Rb into the source bib:oz14 ; GennadyVapourSource18 . We precisely measure the vapor density (0.5%) at both ends with white-light interferometry ErdemRbDiagNIMA16 . For small density differences between the two ends (1.9%/m over 10 m at densities 1015 cm-3), vapor flow is small enough so that the density gradient can be considered as linear along the source () GennadyVapourSource18 . The density gradient (=) is therefore calculated by dividing the difference in density measured at both ends by the length of the vapor column (10 m). We demonstrated in Ref. bib:karl that laser ionization yields a plasma density equal to the Rb vapor density within 0.1% Therefore, though we measure Rb vapor densities, hereafter we quote the corresponding plasma density and gradient values (=.
Three diagnostics provide information about the self-modulated proton bunch after the plasma (see Fig. 1). A scintillating screen located 2 m downstream from the plasma exit yields the time-integrated transverse population density distribution of protons MarleneTwoScreen17 . One meter downstream, the bunch train enters a metallic screen where it produces coherent transition radiation (CTR). We send the CTR to a heterodyne frequency measurement system that yields modulation frequency along the bunch (spectrogram CTRdiagEAACNiMa18 ). Protons then produce backward (incoherent) optical transition radiation (OTR) when entering another nearby metallic screen bib:karlrsi ; bib:karl . We image the OTR onto the entrance slit of a streak camera that yields a time-resolved image of the proton bunch transverse density distribution in a -wide slice about the bunch propagation axis (bunch rms width without plasma).
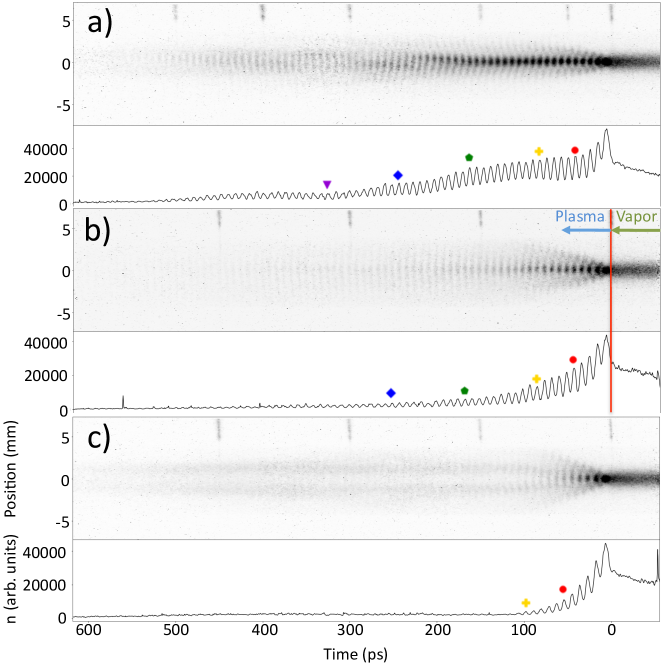
Figure 2 shows time-resolved images of the bunch density with three of eight different plasma density gradient values for which data was acquired (see below). To obtain these 620 ps-long images, several images with an acquisition time of 209 ps and time resolution of 3 ps were stitched together using a marker laser pulse as time reference, as described in FabianStitchedMeth . Marker laser pulses are visible at the top of Fig. 2 images. To evidence modulation, we plot for each image a time profile of the bunch train, obtained by summing the counts on the image over a rms transverse range about the bunch axis. Only the part of the bunch propagating in the plasma (0 with respect to the seed point) exhibits modulation. Images clearly show that with the positive density gradient (=+1.99%/m Fig. a)) there are more micro-bunches along the train. This is confirmed by the corresponding time profiles. In the negative gradient value case (Fig. c)) there are no visible micro-bunches at times later than 130 ps (0.6), while they are visible up to 250 ps (1.1) in the case of (essentially) constant plasma density (Fig. b)), and up to 350 ps (1.5) with the positive gradient value. With the largest negative gradient value (=-1.93%/m), there is no charge visible along the bunch axis for 130 ps. The defocused protons are clearly visible away from the axis (Fig. c), 150 ps) with a modulation pattern with the wakefields’ periodicity. Images with gradient values near =0%/m (e.g., Fig. 2 b)) appear to have very symmetric and regular charge distribution. With the largest positive gradient (=+1.99%/m, Fig. 2 a)) the charge density distribution exhibits significant irregularities.
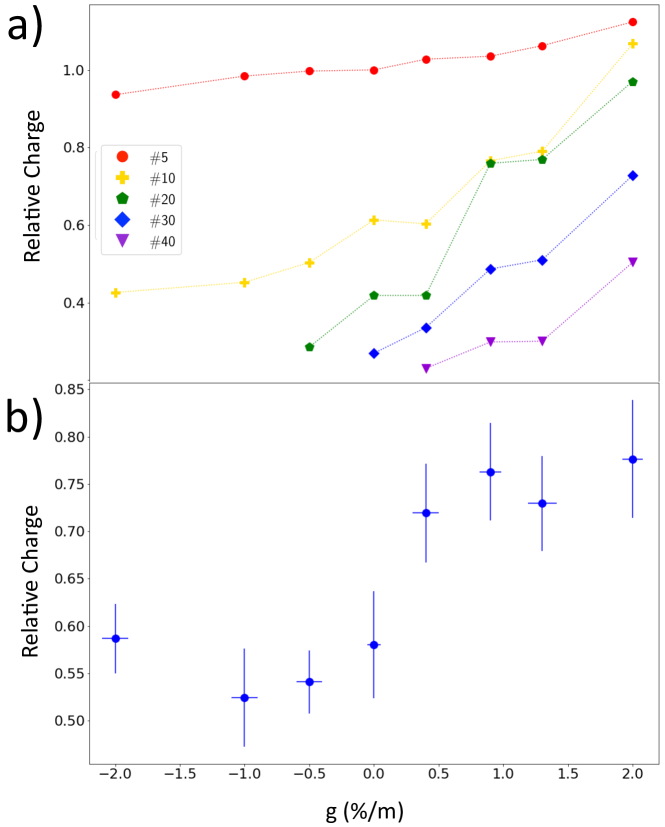
In order to quantify the charge remaining along the self-modulated bunch, Fig. 3 a) shows the relative charge contained in micro-bunches number 5, 10, 20, 30 and 40 behind the seed point, as a function of , and calculated according to the procedure detailed in Ref. bib:annaeaac . One can clearly observe that for all these micro-bunches, the charge is in/decreasing with in/decreasing gradient values. Further along the bunch, micro-bunches and charge are present on axis only with large positive gradient values, e.g., bunches number 30 and 40 and +1%/m.
A similar trend for the bunch relative charge along its axis as a function of gradient is obtained from time integrated images of the transverse charge distribution MarleneTwoScreen17 . Figure 3 b) shows the bunch relative charge measured in one rms radius around the bunch center, i.e., its core. The charge contained in the core consists of the charge ahead of the seed point (29%), therefore unaffected by the SM process, and of that of the micro-bunches and thus remaining near the axis. The charge not in the core is found in the halo surrounding the core bib:turner . The charge in the core generally in/decreases as a function of in/decreasing gradient, except for large negative values (-1.0%/m). This measurement is consistent with the results from time-resolved images, i.e., more charge in micro-bunches or core with more positive values.
We note here that an estimate for the expected charge near the bunch is that a maximum of 50% could remain after the seed point, assuming linear theory fields bib:keinings with half of the wakefields’ period focusing for protons. With a Gaussian longitudinal profile and a seed point at time =+128 ps along the bunch a fraction of 64% would remain in the core. An optimum modulation would be with charge remaining only in the decelerating and focusing phase of the wakefields. That is only a quarter period in linear plasma wakefields’ theory and thus a fraction of 47% would remain. Figure 3 b) shows that without gradient the charge fraction remaining is 57%. Measured values (52 to 77%) are a bit larger than expected ones, possibly because the ideal bunching is not reached and because charge from the defocused regions remains within the rms radius of the bunch.
We determine the bunch modulation frequency with the CTR diagnostic CTRdiagEAACNiMa18 . The CTR spectrum of a periodic bunch train consists of peaks at the modulation frequency and at its harmonics. We use heterodyne systems operating near the fundamental (120 GHz) and the second harmonic (240 GHz) frequencies of the modulation. Bench measurements show that these systems measure frequencies with 1 GHz accuracy CTRdiagEAACNiMa18 . The presence of harmonics in the signal indicates deep modulation of the charge density along the bunch, an indication of the nonlinear stage reached by the SM process, as can be seen in the profiles of Fig. 2. Time profiles are shallower than in reality due to the limited streak camera time resolution (3 ps).
The discrete Fourier transform (DFT) frequency analysis used in bib:karl is also applied to the time-resolved images (Fig. 2 and others) to obtain the modulation frequency bib:DFT .
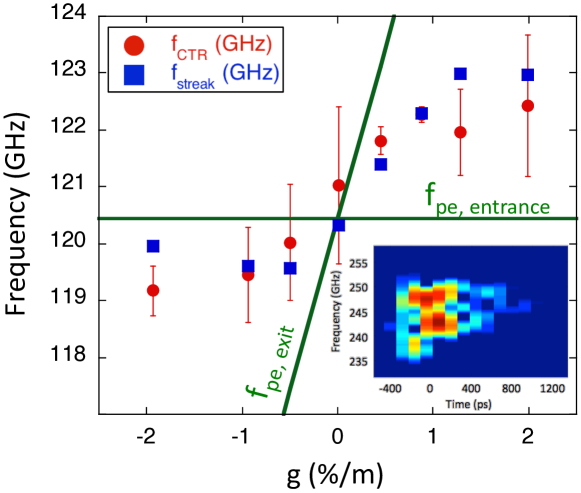
Figure 4 shows these two sets of measured modulation frequencies as a function of . There is very good agreement between the two independent measurement results. The modulation frequencies generally in/decrease with in/decreasing values and saturate at the largest absolute values. Measured frequencies are between the plasma frequencies determined from the entrance and exit plasma densities (==2n). With the largest values, the mean measured frequencies (=119.2 GHz, =120.0 GHz for =-1.93%/m, =122.4 GHz, =123.0 GHz for =+1.99%/m) are significantly different from plasma frequencies at the end of the plasma, 108.2 and 131.9 GHz, respectively.
With large positive or negative gradient values (1%/m), we observe two distinct frequency peaks in the CTR power spectrum, as shown for a single event in the spectrogram inset of Fig. 4 spectrogram . This frequency measurement was performed at the second harmonic of fCTR. The corresponding frequencies at the fundamental are 121.4 and 123.8 GHz. The density gradient constantly detunes the resonance between the bunch modulation frequency and the local plasma frequency. This detuning generates an amplitude beating that has been observed in simulation results with plasma density gradients bib:lotovbeat . For excitation over a finite amount of time, this beating of the two frequencies becomes detectable when their separation is at least on the order of the inverse of the beating duration, here: 1/()=2.8 GHz. In this case 2.4 GHz satisfies this condition.
A higher/lower modulation frequency at the end of the plasma than at the entrance for positive/negative density gradient is direct evidence of the expected effect: the change in wakefields’ phase velocity. Indeed, a higher/lower frequency corresponds to wakefields contracting/stretching along the bunch and plasma, with respect to the fixed seed point. This effect adds to the stretching away from the seed point occurring in a uniform density plasma where the wakefields’ phase velocity is slower than the protons’ velocity. A larger positive/negative phase velocity of wakefields along the bunch (in the bunch frame) means that protons spend less/more time in the passing defocusing fields and fewer/more of them are thus lost from the bunch train. This effect is stronger further along the bunch and explains the lengthening/shortening of the bunch train and gain/loss of charge observed with positive/negative values.
Theoretical calculations show that, during the growth process, the wakefields’ phase velocity at position along the bunch and along the plasma with electron density differs from the particles or bunch velocity by bib:phasevelocity :
| (1) |
The wakefields’ phase velocity is slower than that of the bunch during the growth of the SM process. This difference increases along the bunch.
In a plasma with a density gradient, a point of constant phase , initially at position along the bunch behind the seed point, moves closer to (0), or further (0) from the seed point. In the case of a linear plasma density gradient this corresponds to a velocity:
| (2) |
Possible compensation of the two opposite phase velocities with 0 strictly occurs only for a given plasma length (at ) and position along the bunch (at ). Also, the first effect (Eq. 1) only occurs over the growth length of the SM process, while the second one occurs all along the plasma. The overall effect is still to decrease the difference between the bunch and wakefields’ velocities all along the bunch, as shown in Fig. 4 of Ref. bib:phasevelocity . One can thus expect it to lead to less overall dephasing, to more charge and micro-bunches to be preserved and possibly, for some parameters, to larger amplitude wakefields to be driven. However, this can occur only over a distance on the order of the growth length of the SM process. At longer distances the positive velocity of Eq. 2 has the same deleterious effect on the SM process as that that a positive gradient can counter. The effect of the negative gradient and negative wakefields’ velocities has a compounding deleterious effect on the bunch train, as seen in the experimental data. The asymmetry of the effect of the plasma density gradient confirms that the phase velocity of the wakefields is slower than that of the protons bib:phasevelocity ; bib:schroeder .
Globally, the effect of a density gradient is to suppress the SM process growth bib:schroedergrad . According to Ref. bib:schroedergrad and within the assumptions of the model, the reduction in final relative radial modulation (assumed to be small) would be of about a factor three with respect to the constant density case, with a plasma density of 1015 cm-3 and =+2%/m. This suppression occurs because of relative dephasing between the wakefields and the micro-bunching, as explained above. In order to determine the effect of the number of micro-bunches and of their charge on wakefields’ amplitude, one must determine the longitudinal and transverse distribution of the protons in the wakefields. This is not possible without simultaneous measurement of the electron plasma density perturbation driven by the train. However, Fig. 2 of Ref. bib:schroedergrad does show a slight increase in SM growth for small gradient values, similar to those for which energy gain increase was observed in bib:AWAKEelAccNature ; bib:AWAKERoyal . This increase in growth could result in shorter saturation length and longer acceleration length and/or larger wakefields’ amplitude. In bib:AWAKEelAccNature ; bib:AWAKERoyal the density gradient may also have affected the electrons’ capture process.
We presented experimental results on the effect of linear plasma density gradients on the self-modulation of a 400 GeV proton bunch. Results show that, when compared to the no or negative gradients cases, positive density gradients up to 2%/m along the beam path increase the number of micro-bunches observed, as well as their charge. Density gradients also lead to modulation frequency shifts with saturation at large values (positive or negative). Two frequencies appear in the frequency spectra at high gradients (2% m). These observations are consistent with modification of the wakefields’ phase velocity, leading to fewer/more protons being defocused for 0%/m or 0%/m. Energy gain measurements bib:AWAKEelAccNature suggest that modest gradients value (up to =+0.2%/m) lead to larger energy gain than with a plasma with constant density (=0%/m). Capture of electrons at larger gradient values decreased with this injection scheme, thus preventing observation of possible decrease in energy gain.
It is clear that a density gradient cannot be sustained over very long plasma lengths and could be beneficial only over the saturation length of the self-modulation process bib:turnersat (as far as this process and not the acceleration one is concerned). A positive density step, sharp bib:lotovstep or continuous bib:minakov , has so far been chosen for the Run 2 of AWAKE to maintain wakefields’ amplitudes at large values over longer distances for larger energy gain than in a constant density plasma bib:muggliRun2 .
Acknowledgements
This work was supported in parts by a Leverhulme Trust Research Project Grant RPG-2017-143 and by STFC (AWAKE-UK, Cockroft Institute core and UCL consolidated grants), United Kingdom; a Deutsche Forschungsgemeinschaft project grant PU 213-6/1 “Three-dimensional quasi-static simulations of beam self-modulation for plasma wakefield acceleration”; the National Research Foundation of Korea (Nos. NRF-2016R1A5A1013277 and NRF-2019R1F1A1062377); the Portuguese FCT—Foundation for Science and Technology, through grants CERN/FIS-TEC/0032/2017, PTDC-FIS-PLA-2940-2014, UID/FIS/50010/2013 and SFRH/IF/01635/2015; NSERC and CNRC for TRIUMF’s contribution; the U.S. National Science Foundation under grant PHY-1903316; the Wolfgang Gentner Programme of the German Federal Ministry of Education and Research (grant no. 05E15CHA); and the Research Council of Norway. M. Wing acknowledges the support of the Alexander von Humboldt Stiftung and DESY, Hamburg. Support of the Wigner Datacenter Cloud facility through the ”Awakelaser” project and the support of Péter Lévai is acknowledged. The work of V. Hafych has been supported by the European Union’s Framework Programme for Research and Innovation Horizon 2020 (2014–2020) under the Marie Sklodowska-Curie Grant Agreement No. 765710. The AWAKE collaboration acknowledge the SPS team for their excellent proton delivery.
References
- (1) N. Kumar, A. Pukhov, and K. Lotov, Phys. Rev. Lett. 104, 255003 (2010).
- (2) Constants have usual meaning: electron charge, vacuum permittivity, electron mass, speed of light in vacuum.
- (3) E. Adli et al., (AWAKE Collaboration), Phys. Rev. Lett. 122, 054802 (2019).
- (4) M. Turner et al., (AWAKE Collaboration), Phys. Rev. Lett. 122, 054801 (2019).
- (5) F. Batsch and P. Muggli et al., (AWAKE Collaboration), to be submitted (2020).
- (6) A. Pukhov, N. Kumar, T. Tückmantel, A. Upadhyay, K. Lotov, P. Muggli, V. Khudik, C. Siemon, and G. Shvets, Phys. Rev. Lett. 107, 145003 (2011).
- (7) C. B. Schroeder , C. Benedetti, E. Esarey, F. J. Grüner, and W. P. Leemans, Phys. Rev. Lett. 107, 145002 (2011).
- (8) A. Pukhov and I. Kostyukov, Phys. Rev. E 77, 025401 (R) (2008).
- (9) T. Katsouleas, Phys. Rev. A 33, 2056 (1986).
- (10) P. Muggli et al., (AWAKE Collaboration), Plas. Phys. and Contr. Fus. 60, 014046 (2018).
- (11) G. Plyushchev, R. Kersevan, A. Petrenko, and P. Muggli, J. of Phys. D: Applied Physics, 51(2), 025203 (2017).
- (12) E. Öz and P. Muggli, Nucl. Instr. and Meth. in Phys. Res. A 740, 197 (2014).
- (13) F. Batsch, M. Martyanov, E. Öz, J. Moody, E. Gschwendtner, A. Caldwell, and P. Muggli, Nucl. Instr. and Meth. in Phys. Res. A, 909, 359 (2018).
- (14) M. Turner, B. Biskup, S. Burger, E. Gschwendtner, S. Mazzoni, and A. Petrenko, Nucl. Instr. and Meth. in Phys. Res. A 854, 100 (2017).
- (15) F. Braunmueller, M. Martyanov, S. Alberti, and P. Muggli, Nucl. Instr. and Meth. in Phys. Res. A 909, 76 (2018).
- (16) K. Rieger, A. Caldwell, O. Reimann, R. Tarkeshian, and P. Muggli, Rev. of Sci. Instr. 88, 025110 (2017).
- (17) F. Batsch, accepted for publication in Journal of Physics: Conference Series (JPCS), arXiv:1911.12201 [physics.ins-det].
- (18) A.-M. Bachmann, P. Muggli, accepted for publication in Journal of Physics: Conference Series (JPCS) and arXiv:1912.00779 [physics.acc-ph].
- (19) R. Keinigs, and M. E. Jones, Phys. Fluids 30, 252 (1987).
- (20) We note here that the entire image width was used for the DFT. Analysis of narrower image widths yields more complete results on the modulation frequency. These will be detailed in an upcoming manuscript.
- (21) Frequency of the first harmonic of CTR obtained from discrete Fourier transform of a heterodyne system signal fIF=, with harmonic number n=12, in 130 ps long successive time windows.
- (22) K. Lotov, A. Pukhov, and A. Caldwell, Physics of Plasmas 20, 013102 (2013).
- (23) C. B. Schroeder, C. Benedetti, E. Esarey, F. J. Grüner, and W. P. Leemans, Physics of Plasmas 19, 010703 (2012).
- (24) E. Adli et al., (AWAKE Collaboration), Nature 561, 363 (2018).
- (25) E. Gschwendtner, M. Turner et al., (AWAKE Collaboration), Royal Society Proceedings 666, 666 (2019).
- (26) M. Turner, P. Muggli et al., (AWAKE collaboration), submitted to Phys. Rev. Accel. and Beams, (2020), arXiv:2005.05277 [physics.acc-ph]
- (27) A. Caldwell, and K. Lotov, Phys. Plasmas 18, 103101 (2011).
- (28) K. Lotov and V. Minakov, arXiv:2007.07713 [physics.plasm-ph].
- (29) P. Muggli (AWAKE Collaboration), accepted for publication in Journal of Physics: Conference Series (JPCS), arXiv:1911.07534 [physics.acc-ph].