SN 2018zd: An Unusual Stellar Explosion as Part of the Diverse Type II Supernova Landscape
Abstract
We present extensive observations of SN 2018zd covering the first d after the explosion. This SN shows a possible shock-breakout signal hr after the explosion in the unfiltered light curve, and prominent flash-ionisation spectral features within the first week. The unusual photospheric temperature rise (rapidly from K to above 18,000 K) within the earliest few days suggests that the ejecta were continuously heated. Both the significant temperature rise and the flash spectral features can be explained with the interaction of the SN ejecta with the massive stellar wind (), which accounts for the luminous peak () of SN 2018zd. The luminous peak and low expansion velocity ( km s-1) make SN 2018zd to be like a member of the LLEV (luminous SNe II with low expansion velocities) events originated due to circumstellar interaction. The relatively fast post-peak decline allows a classification of SN 2018zd as a transition event morphologically linking SNe IIP and SNe IIL. In the radioactive-decay phase, SN 2018zd experienced a significant flux drop and behaved more like a low-luminosity SN IIP both spectroscopically and photometrically. This contrast indicates that circumstellar interaction plays a vital role in modifying the observed light curves of SNe II. Comparing nebular-phase spectra with model predictions suggests that SN 2018zd arose from a star of . Given the relatively small amount of 56Ni (), the massive stellar wind, and the faint X-ray radiation, the progenitor of SN 2018zd could be a massive asymptotic giant branch star which collapsed owing to electron capture.
keywords:
supernovae: general – supernovae: individual (SN 2018zd).1 Introduction
Type II supernovae (SNe II) are hydrogen-rich core-collapse events that are observationally divided into Type IIP (SNe IIP), Type IIL (SNe IIL), Type IIn (SNe IIn), and Type IIb (SNe IIb) (for reviews, see, e.g., Filippenko, 1997; Gal-Yam, 2017). Among them, SNe IIP belong to the most abundant subclass, which is characterised by a relatively constant optical luminosity plateau lasting for about three months ( d) after the explosion, followed by a rapid drop to the radioactive tail. The thermalisation of the initial shock wave and the recombination of the ionised hydrogen provide sources to power the plateau light curve (Popov, 1993). SNe IIL were named after their linear (in magnitudes) light-curve decay that starts soon after peak brightness. Based on the understanding of SNe IIP, the absence of a plateau in the light curves of SNe IIL might suggest less energy input at a similar phase, while the absence of an abrupt drop in brightness after a few months might indicate a lower-mass H envelope in their progenitors. However, the higher peak luminosity of SNe IIL ( mag brighter than that of SNe IIP, on average; Patat et al., 1993, 1994; Li et al., 2011; Anderson et al., 2014; Faran et al., 2014b; Sanders et al., 2015) disfavours this hypothesis. The continuous range of early-time light-curve slopes found among SNe II (e.g., Anderson et al., 2014; Sanders et al., 2015), and the observed transitional events (e.g., SN 2013ej, Huang et al., 2015; SN 2013by, Valenti et al., 2015) tends to suggest a continuous progenitor population for SNe IIP and SNe IIL.
A fraction of SNe II exhibit signatures of ejecta interaction with circumstellar material (CSM) produced by mass loss in massive stars, especially at their late phases before core collapse. The events that present prominent interaction signatures are classified as SNe IIn (Schlegel, 1990). The observed diversity of SNe IIn indicates that the circumstellar environments around their progenitors are complicated. The duration of interaction has large scatter, spanning from a few days (e.g., SN 2013fs, Yaron et al., 2017), a few weeks (e.g., SN 1998S, Fassia et al., 2000; Leonard et al., 2000), a few months (e.g., SN 2010jl, Zhang et al., 2012; Fransson et al., 2014), to even a few years (e.g., SN 2015da, Tartaglia et al., 2020).
The spectra of SNe IIb are similar to those of the SNe IIP and IIL (with strong lines of H) near maximum light, but in the following weeks they usually metamorphoze into SNe Ib (Filippenko, 1988; Filippenko, Matheson, & Ho, 1993). We do not discuss SNe IIb in this paper because they show more similarities to hydrogen-poor events (SNe Ibc, Arcavi et al., 2012; Stritzinger et al., 2018).
The physical origin of SNe IIP and IIL, and their connections with SNe IIn regarding the physical characteristics of their progenitor scenarios and explosion properties, have been long-standing issues. There are pieces of evidence indicating that the diversity between SNe IIP and IIL can be partly explained with short-lived interaction (Valenti et al., 2015; Morozova, Piro, & Valenti, 2017). We present optical and ultraviolet (UV) data for the core-collapse SN 2018zd, obtained through an observational campaign that lasted for about 450 d with several telescopes. This SN shows a series of interaction signatures in both spectra and light curves, as well as a large flux drop before entering the radioactive-decay phase.
Observations and data reduction are described in Section 2. The UV and optical light curves are presented in Section 3, while the spectral evolution is shown in Section 4. In Section 5, we discuss the bolometric light curve, explosion parameters, progenitor properties, velocity evolution, the position of this SN in the SNe II family, and the possibility of originating from the electron-capture channel. A brief conclusion is given in Section 6.
2 Observations
Koichi Itagaki reported the discovery of the transient AT 2018zd in the nearby SB(s)ab galaxy NGC 2146 on March 02.49, 2018 (UT dates are used throughout this paper). This transient was discovered at 17.8 mag in an unfiltered image obtained with a 0.5 m reflector at the Takamizawa station of Japan111http://www.k-itagaki.jp. Its J2000 coordinates are and , which is west and north of the centre of the host galaxy.
The earliest spectroscopic observations of AT 2018zd were initiated at Li-Jiang Observatory of Yunnan Observatories (YNAO) with the Li-Jiang 2.4 m telescope (hereafter LJT; Fan et al., 2015) equipped with the YFOSC (Yunnan Faint Object Spectrograph and Camera; Wang et al., 2019) only 3 hr after the discovery. However, the noisy spectrum precluded prompt classification of this transient. SN 2018zd was later classified as a young Type IIn SN from a relatively high-quality spectrum obtained at LJT on March 05.74, 2018, which showed narrow emission lines superimposed on a blue continuum (Zhang, Yu, & Wang, 2018).
Given the close distance and the young phase when the SN was discovered, we triggered a follow-up observational campaign of SN 2018zd with the LJT of YNAO, the Xing-Long 2.16 m telescope (hereafter XLT), the Tsinghua-NAOC (National Astronomical Observatories of China) 0.8 m telescope (hereafter TNT; Wang et al., 2008; Huang et al., 2012) at Xing-Long Observatory of the NAOC, the 0.6/0.9 m Schmidt telescope (hereafter KOT) of the Konkoly Observatory of the Hungarian Academy of Sciences, and the 0.6 m Cassegrain reflector telescope (hereafter WT) at the Astronomical Observatory of the University of Wroclaw, Bialkow, Poland (Mikolajczyk & Wyrzykowski, 2018). The monitoring spanned from d to d (where denotes time after the explosion). Late-time spectra were also collected with the 3.5 m Astrophysical Research Consortium (hereafter ARC) telescope of the Apache Point Observatory (APO), and the Keck-I 10 m telescope on Maunakea, Hawai’i. Moreover, the UV-optical photometry spanning from d to d obtained with UVOT on the Neil Gehrels Swift Observatory (Gehrels et al., 2004; Roming et al., 2005) is also included here.
2.1 Photometry
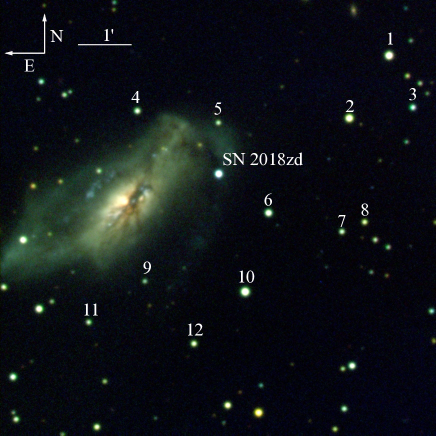
SN 2018zd was densely observed by the LJT in the Johnson bands and the Sloan bands, by the TNT and KOT in Johnson and Cousins , and by the WT in Johnson and Sloan . These images were reduced using IRAF222IRAF, the Image Reduction and Analysis Facility, is distributed by the National Optical Astronomy Observatory, which is operated by the Association of Universities for Research in Astronomy (AURA), Inc. under cooperative agreement with the National Science Foundation (NSF). standard procedures, including corrections for bias, overscan, flat field, and removal of cosmic rays. The point-spread-function fitting method (Stetson, 1987) was used to measure the instrumental magnitudes of the SN. We selected twelve local reference stars in the field of SN 2018zd, as marked in Fig. 1. The instrumental magnitudes of these reference stars are converted to standard (Vega magnitudes) and (AB magnitudes) through transformations established by observing a series of Landolt (1992) and Smith et al. (2002) standard stars on some photometric nights, respectively. These magnitudes are applied to calibrate the photometry of SN 2018zd, as presented in Table 5. The photometry of WT is calibrated via the Cambridge Photometric Calibration Server333http://gsaweb.ast.cam.ac.uk/followup.
Photometry of SN 2018zd was obtained by the Swift/UVOT in three UV filters (, , and ) and three broadband optical filters (, , and ) and is presented in Table 7. These Swift images were reduced using the HEASoft444HEASoft, the High Energy Astrophysics Software http://www.swift.ac.uk/analysis/software.php with the latest Swift calibration database555http://heasarc.gsfc.nasa.gov/docs/heasarc/caldb/swift/.
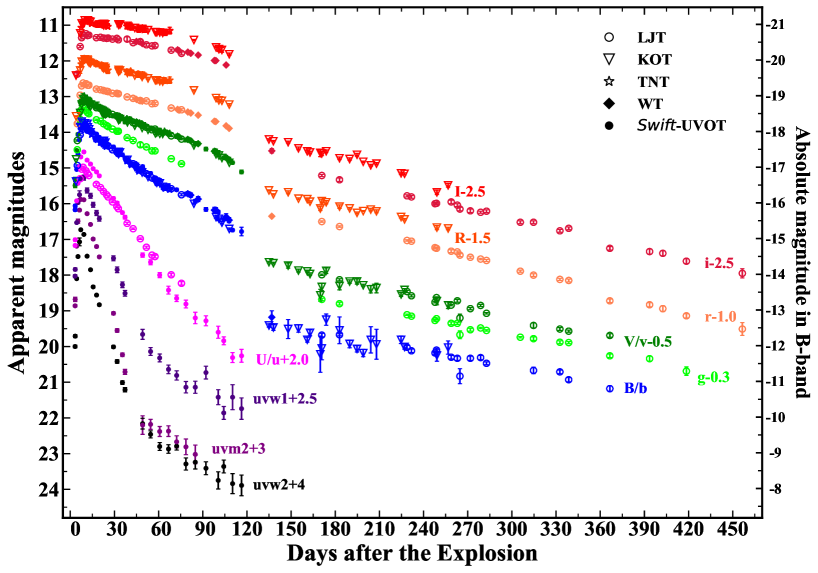
All of the photometry is presented in Fig. 2, which covers the first d since discovery. Note that the instrumental response curves of the UVOT optical filters do not follow exactly those of the Johnson system, especially in Swift where the UVOT coverage is wider than Johnson . Thus, we treat the and bands individually in the following calculation and analysis.
| Band | FWHM (Å) | (d) | (mag) | (mag) | (mag) | (mag) | (mag) | (mag [100 d]-1) | |
|---|---|---|---|---|---|---|---|---|---|
| 1928 | 657 | 6.94(0.05) | 12.71(0.03) | -19.97(0.61) | … | … | 5.94(0.05) | … | |
| 2246 | 498 | 7.27(0.06) | 12.83(0.05) | -20.06(0.67) | … | … | 6.46(0.05) | … | |
| 2600 | 693 | 7.35(0.05) | 12.81(0.03) | -19.61(0.54) | … | … | 4.93(0.04) | … | |
| 3465 | 785 | 8.27(0.05) | 12.58(0.02) | -19.54(0.45) | … | … | 3.30(0.03) | … | |
| 3652 | 485 | 8.46(0.05) | 12.97(0.02) | -19.14(0.44) | … | … | 2.59(0.03) | … | |
| 4312 | 831 | 9.13(0.05) | 13.79(0.01) | -18.19(0.41) | -15.93(0.43) | -12.48(0.43) | 1.53(0.03) | 0.74(0.06) | |
| 4754 | 1280 | 8.77(0.05) | 13.62(0.01) | -18.29(0.39) | … | -13.02(0.45) | 1.24(0.03) | 0.75(0.07) | |
| 5341 | 827 | 8.98(0.05) | 13.55(0.01) | -18.26(0.36) | -16.82(0.38) | -13.43(0.38) | 0.93(0.03) | 0.90(0.07) | |
| 6196 | 1150 | 9.21(0.05) | 13.59(0.01) | -18.15(0.34) | -17.14(0.36) | -14.49(0.38) | 0.63(0.03) | 1.09(0.06) | |
| 6315 | 1742 | 9.28(0.07) | 13.45(0.01) | -18.28(0.33) | -17.31(0.36) | -14.37(0.36) | 0.60(0.02) | 0.80(0.06) | |
| 7690 | 1230 | 9.67(0.05) | 13.74(0.01) | -17.88(0.30) | -17.22(0.32) | -14.06(0.35) | 0.37(0.02) | 0.96(0.06) | |
| 8752 | 1970 | 10.18(0.08) | 13.36(0.01) | -18.19(0.28) | -17.50(0.31) | -14.66(0.33) | 0.35(0.02) | 1.12(0.09) |
aThe , , , and bands of Swift/UOVT, and the Johnson bands, are in the Vega magnitude system. SDSS bands are in the AB magnitude system. The numbers given in brackets are the 1 uncertainties. bDerived by fitting a cubic polynomial to the points around maximum brightness.
2.2 Spectroscopy
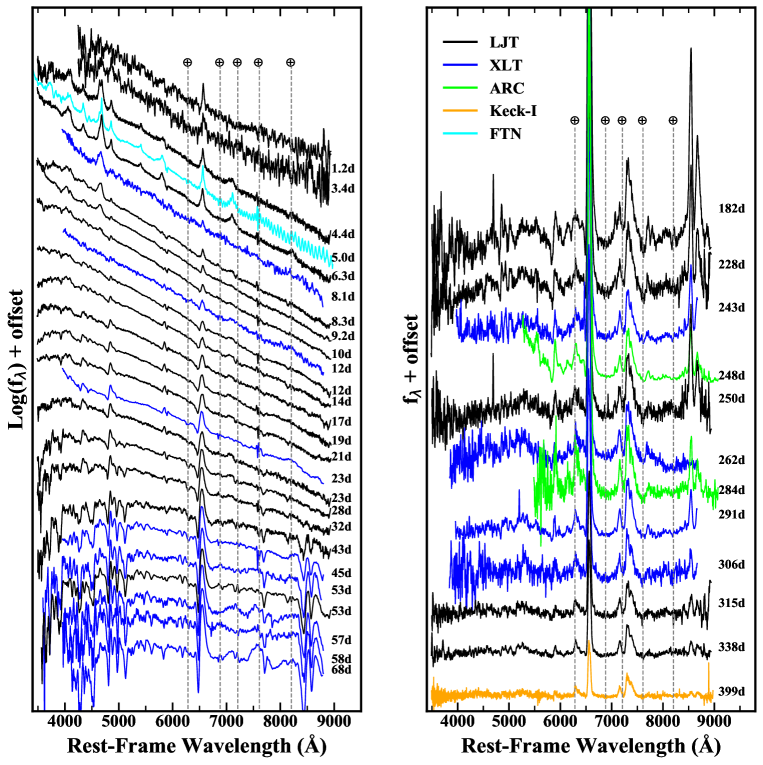
Fig. 3 shows the spectral sequence of SN 2018zd spanning from d to d. The journal of observations is given in Table 8, including twenty-two spectra from LJT (with the YFOSC), twelve from XLT (with the Beijing Faint Object Spectrograph and Camera, BFOSC), two from ARC (with the Dual Imaging Spectrograph, DIS), and one from Keck-I (with the Low-Resolution Imaging Spectrometer, LRIS; Oke et al. 1995). All of these spectra are calibrated in both wavelength and flux, and they are corrected for telluric absorption and redshift. Spectra were obtained with a slit oriented along the parallactic angle to minimise the effects of atmospheric dispersion (Filippenko, 1982); moreover, the continuum shape was further corrected with multiband photometry. One spectrum (presented at the transient name system, TNS666 https://wis-tns.weizmann.ac.il/object/2018zd), obtained using the FLOYDS spectrograph on the Las Cumbres Observatory 2 m Faulkes Telescope North (FTN) on Haleakala, Hawai’i, is also plotted in this figure to help elucidate the rapid evolution at very early times.
2.3 Distance and extinction
The distance of SN 2018zd adopted in the following calculation is Mpc, derived from the averaged measurements of the host galaxy (NGC 2146) listed in the NASA/IPAC Extragalactic Database (NED777http://ned.ipac.caltech.edu). For example, the average estimation from the Tully-Fisher relation is Mpc (Bottinelli et al., 1984; Giraud, 1985; Tully & Fisher, 1988; Schoniger & Sofue, 1994; Tutui & Sofue, 1997), the measurement via the observed angular radius of typical globular clusters in NGC 2146 (comparing with the physical radii of Milky Way globulars) is Mpc (Adamo et al., 2012), and the result from the radial velocity of NGC 2146 ( km s-1, after correcting for Local Group infall into the Virgo Cluster, the Great Attractor, and the Shapley Supercluster Mould et al., 2000) is Mpc with H km s-1 Mpc-1 (Planck, 2014).
In our analysis, we use the interstellar Na i D absorption to estimate the reddening toward SN 2018zd. Two Na i D absorption systems are detected in the spectra of SN 2018zd, with similar equivalent width (EW), Å (see Fig. 8), suggesting significant extinction due to the host galaxy and the Milky Way. The minimum reddening value derived from the existing empirical correlations between reddening and EW of Na i D, mag (Turatto et al., 2003), is mag. However, the Galactic reddening derived by Schlafly & Finkbeiner (2011) is only mag. Considering the large scatter of the reddening measurement via Na i D absorption (e.g., Poznanski et al., 2011), we assume because of the similar EW of Na i D from the host galaxy and the Milky Way. Thus, a total reddening of mag with the extinction law is adopted in this paper. This matches the estimate via the colour in Section 3.4. We caution, however, that the luminosity of SN 2018zd may be underestimated because of the conservative host-galaxy reddening adopted in our analysis.
3 Analysis of the Photometry
3.1 Explosion date and a shock-breakout signal
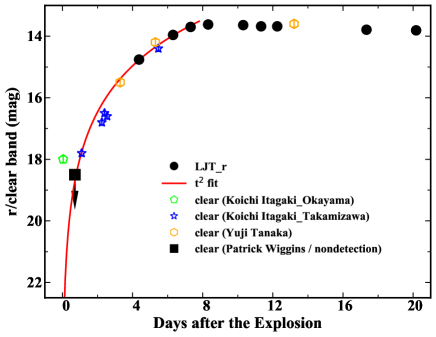
To better estimate the explosion date of SN 2018zd, we also collect the clear-band data obtained by amateur astronomers in the early phase of detections888“Bright Supernovae,” www.rochesterastronomy.org/sn2018/sn2018zd.html, as listed in Table 9. The clear-band photometry roughly matches that of the band of LJT, as shown in Fig. 4.
A simple expanding fireball model, , is applied to fit observations at d except for the earliest detection. The explosion date derived by the expanding fireball model is MJD = 58178.39, which implies that SN 2018zd was first detected (by Itagaki; see below) only 3.6 hr after the explosion. It is reasonable that SN 2018zd was very young at the first detection because its brightness increased by mag when approaching the peak.
Note that Itagaki had a prediscovery detection (obtained with a 0.35 m telescope at Okayama Observatory) at the site of SN 2018zd roughly one day before his official discovery image, with an unfiltered magnitude of 18.0. About 13 hr after this earliest detection, however, Patrick Wiggins999https://wis-tns.weizmann.ac.il/object/2018zd#comment-wrapper-1927 reported a nondetection of SN 2018zd in an unfiltered image with an upper limit of 18.5 mag. Such an intraday dip is very likely related to the shock-breakout phenomenon (as seen in KSN 2011d; Garnavich et al., 2016).
3.2 Photometric results
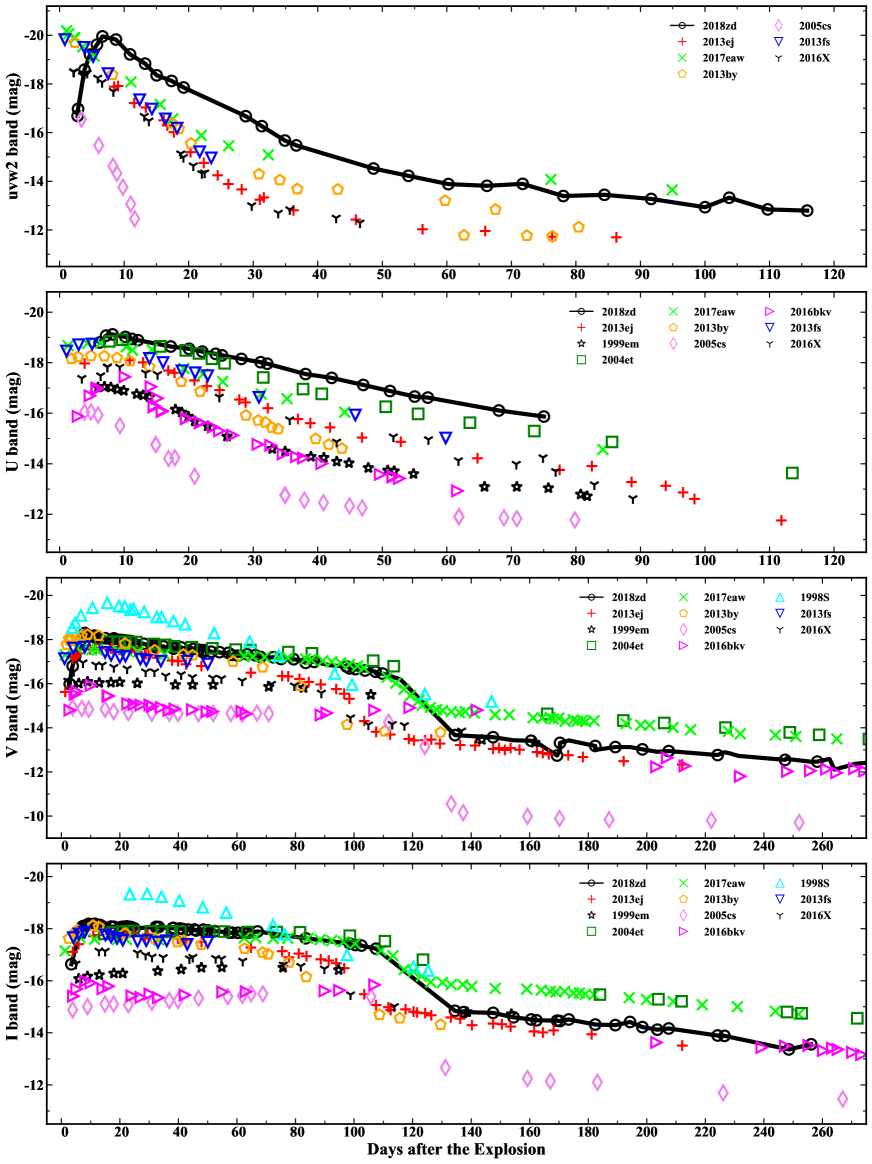
Table LABEL:Tab:LC_res lists estimates of the explosion time to peak brightness (), the apparent () and absolute () magnitude at maximum brightness, the absolute magnitude at the end of the plateau phase (, at d, in the case of SN 2018zd) and at the beginning of the radiative tail (, at d), the decline rate from peak to 50 d later (), and the decline rate per 100 d () during the radioactive tail (at d, when the light curve is powered by radioactive decay and is governed by -ray trapping) of SN 2018zd in all bands presented in Fig. 2.
Compared with the sample from Pritchard et al. (2014), the absolute peak magnitudes of SN 2018zd are located at the luminous end of SNe IIP and SNe IIL, and the faint end of SNe IIn. The UV peak of SN 2018zd ( mag) is brighter than that of SNe IIP ( mag), and is close to the average brightness of SNe IIn ( mag). The optical brightness of SN 2018zd (e.g., mag, in the and bands) lies between the bright end of SNe IIP ( mag) and the faint end of SNe IIn ( mag; Pritchard et al., 2014). Richardson et al. (2002) found that the average -band peak absolute magnitude is mag for 29 SNe IIP and mag for 19 SNe IIL. This indicates that SN 2018zd is brighter than most SNe IIP and comparable to SNe IIL in the optical. Furthermore, considering SNe IIP and IIL as a continuous family, SN 2018zd is at the bright end of the distribution ( mag; Anderson et al., 2014).
As shown in Fig. 2, the light curve of SN 2018zd had a fast decline from the peak to the plateau phase. Faran et al. (2014b) suggested that SNe II with mag in the band can be classified as SNe IIL. Based on such a criterion, SN 2018zd could be placed into the SN IIL group because of a relatively quick decline (i.e., mag). However, a further significant flux drop can be found at d in the optical light curves, with a decline of mag when entering the radioactive-decay tail. Such a significant flux drop has been regarded as a typical feature of SNe IIP when hydrogen recombination process ends in the envelope.
Nevertheless, Anderson et al. (2014) and Valenti et al. (2015) proposed that if all SNe IIL were monitored sufficiently long, they would exhibit a significant drop in their late-time light curves. SN 2018zd is an excellent example supporting the above argument because of the SN IIL-like initial decline rate and the SN IIP-like drop from the end of plateau to the radioactive tail.
We notice that the UV light curves of SN 2018zd showed an unusually slow increase to peak compared to the optical, reaching maximum brightness week after explosion. However, SNe II usually reach their UV maximum much earlier (at –3 d) than in the optical ( d in and d in ). For example, Pritchard et al. (2014) noted that most of their sample were observed before the -band maximum, but only a few before UV maximum even though some were monitored at quite young phases.
3.3 Morphology of the light curves
The multiband light curves of SN 2018zd are shown in Fig. 5, together with those of some well-observed SNe II. The morphology comparison confirms the results derived in Section 3.2:
(1) The UV emission of SN 2018zd rises slowly; it reaches the -band peak –6 d later than the other comparison SNe. The rise time of these SNe in the UV band is uncertain because their peaks occur near the time of the first detection. Thus, these events may have reached their maximum brightness a few days earlier than shown in this figure.
(2) The peak brightness of SN 2018zd is close to that of SNe IIP at the bright end, and it is close to that of SNe IIL and SNe IIn. Among the comparison SNe II, only SN IIn 1998S shows a more luminous peak than SN 2018zd.
(3) SN 2018zd has an intermediate decline rate during the plateau phase, faster than that of regular SNe IIP (e.g., SN 1999em, SN 2004et, and SN 2017eaw), but slower than that of fast-declining SNe II (e.g., SN 2013ej and SN 2013by).
(4) SN 2018zd exhibits the most significant drop from the peak to the end of the plateau phase, even greater than that of SN 2013ej and SN 2013by.
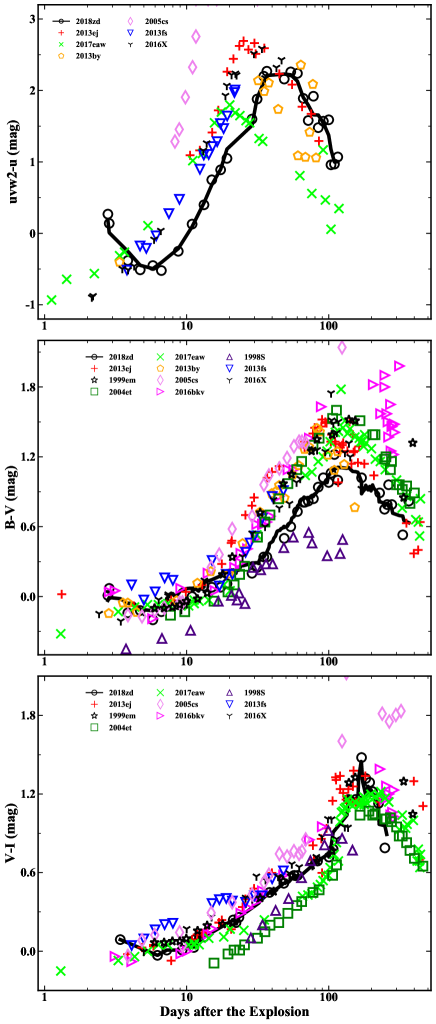
3.4 Colour curves
SN 2018zd shows bluer and colours at d than normal SNe IIP, as presented in Fig. 6, which might result from the contribution of CSM interaction. Based on a similar argument, it is not surprising that the colour of SN 1998S is bluer than that of SN 2018zd because the former might have stronger interaction.
Different comparison samples of SNe II generally exhibit similar colour evolution but with some notable differences. The most obvious is that SN 2018zd shows a very clear reversal (“U-turn”) in the colour curve at early times. A similar but weaker feature is present in the and colour curves. This U-turn behaviour indicates that the temperature increase of SN 2018zd is consistent with the temperature evolution derived in the following section. Besides, the decreased extinction due to dust destruction at the early phase of the explosion could also explain this U-turn behavior. However, no evidence of dust destruction (e.g., the variation of Na i D absorption from the host galaxy) is found in our low-resolution spectra.
The colour U-turn is not typical of the SN II family even among those with very early-time observations, such as SN 2017eaw and SN 2016X. It is suspected that SN 2013ej, SN 2013by, and SN 2016bkv might also have similar colour evolution, as they show the -turn feature in the colour curve; however, their UV data are either absent or too poorly sampled for a detailed comparison.
The colour of SN 2018zd becomes bluer again at d, a reverse “U-turn” shape that is due to the increased H Balmer absorption within the band and the decreased metal line-blanking in the band (e.g., see the UV-optical spectral evolution in Figure 2 of Dessart et al., 2013). The similar reverse “U-turn” seen in the and colours at d is related to the evolution of emission lines in the nebular phase. These reverse “U-turn” shapes seen in the colour curves do not imply that the temperature is rising.
The intrinsic colour of SNe II could be another way to estimate extinction. For example, Hamuy (2003) suggested using the colour as a better reddening indicator than the colour because it is expected to be less sensitive to metallicity effects. The colour of SN 2018zd roughly follows that of SN 1999em, SN 2013ej, SN 2016X, and SN 2017eaw at d. This suggests a smaller effect of interaction in the colour of SN 2018zd than in the bluer colour. Thus, we could estimate the extinction via an empirical relation, such as (Olivares et al., 2010), where the colour corresponds to the colour of a given SN 30 d before the end of the plateau, and is related to (e.g., for ). Based on the colour of SN 2018zd measured at the appropriate phase ( d), the total extinction is estimated to be mag, and for . These values are consistent with the reddening adopted in this paper.
3.5 Spectral energy distribution
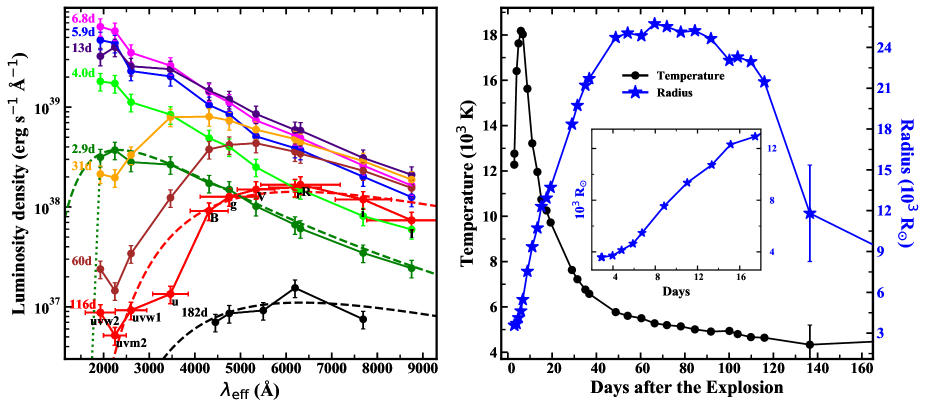
The left panel of Fig. 7 displays the spectral energy distribution (SED) of SN 2018zd at some selected epochs. At d, when Swift-UVOT observations are available, we construct the SED from the observed fluxes in the UV through optical passbands (covering the wavelength from to Å) obtained at the same phase. The missing data are obtained through interpolation of the adjacent data. The SEDs at d are constructed only from the or the photometry.
The SED peaks toward shorter wavelengths in the first few days and then toward longer wavelengths, which conforms to an initial heating followed by cooling processes as indicated in the temperature curve presented in the right panel of Fig. 7. The temperature of SN 2018zd is derived via blackbody fitting of the SED; it increases from K to K in the first week after the explosion. This behaviour might be related to CSM interaction at early times, as is also indicated by the early spectra (see Fig. 8). At these phases, the forward shock accelerates and heats the shocked wind/CSM and the reverse shock reheats the outer layers of the ejecta (Branch & Wheeler, 2017).
For SNe II, it is not common to see the temperature increase at early times. Hosseinzadeh et al. (2018) reported the unexpected temperature rise of SN 2016bkv during a similar period. However, their conclusion is uncertain, owing to a lack of near-UV photometry. Thus, SN 2018zd could be the first SN II for which there is conclusive evidence of a rising temperature at early phases.
The right-hand panel of Fig. 7 also displays the photospheric radius () of SN 2018zd calculated from the relation , where the luminosity is derived by integrating the SED from 1600 Å to 27,000 Å; flux outside the wavelength range of photometric coverage is extrapolated based on a blackbody spectrum.
The photospheric radius of SN 2018zd is at d, increasing slowly during the temperature rising phase. After d of faster expansion, SN 2018zd reached maximum photospheric radius () at d and remained almost unchanged during the next two months; thus, recombination provided the dominant source of energy at this phase. The recombination temperature is K, so the ejecta consist of a mixture of hydrogen and helium (Grassberg & Nadyozhin, 1976). The photospheric radius decreases when recombination ends and the SN envelope becomes transparent.
4 Spectroscopic Analysis
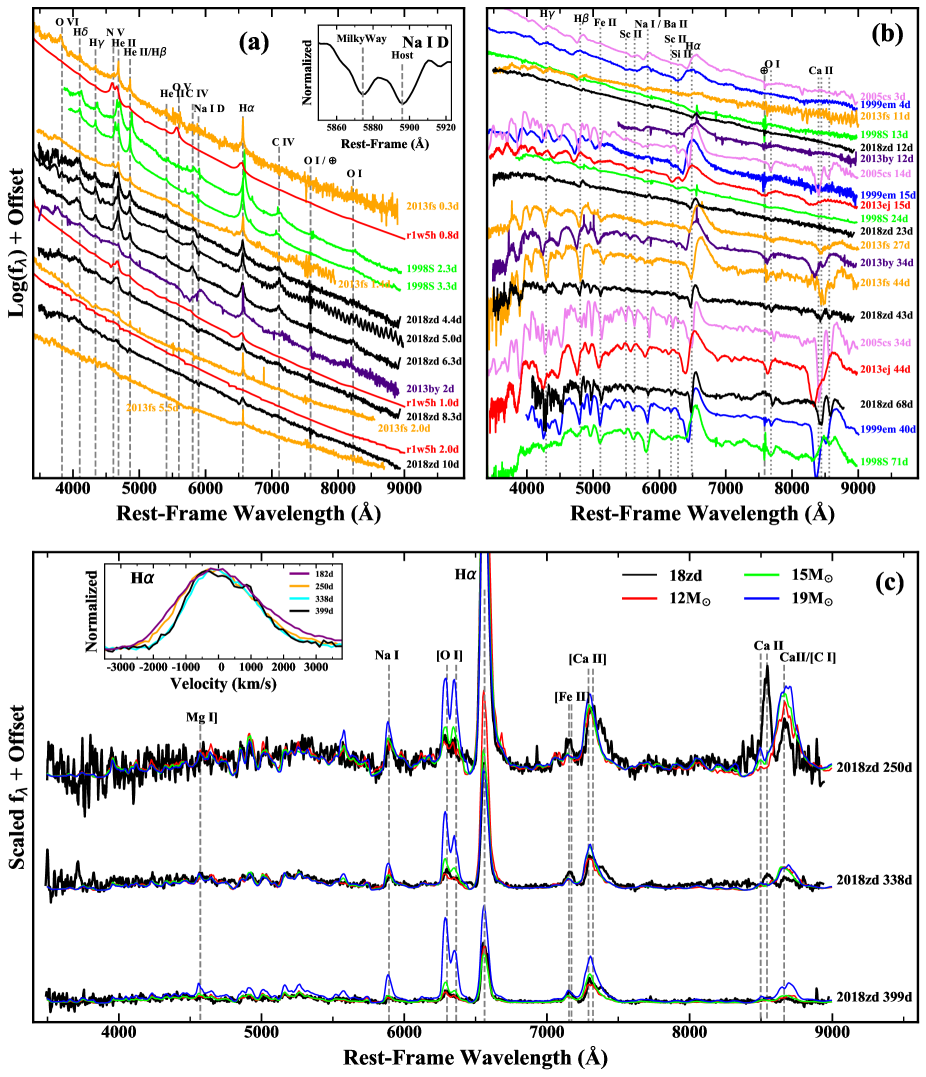
Fig. 8 displays the spectral comparison of SN 2018zd with a selected sample and model spectra obtained at different phases, including the flash-ionisation, photospheric, and nebular phases.
4.1 Flash-ionisation phase
Panel (a) of Fig. 8 displays early-time spectra of SN 2018zd at d, together with that of SN 1998S, SN 2013fs, and the r1w5h model spectra given by Dessart, Hillier, & Audit (2017) at similar phases. The spectra of SN 2018zd are dominated by flashed-ionised features (Gal-Yam et al., 2014) such as the narrow emission lines of hydrogen, N v , 4641, He ii , He ii , C iv , 5812, and C iv . These features are generated by the surrounding wind material which was ionised by X-rays from the shocked ejecta (Branch & Wheeler, 2017). The first two low-quality spectra of SN 2018zd in Fig. 3 show possible H emission, suggesting that the interaction starts d after explosion.
The flash features in SN 2018zd appear to evolve more slowly than in SN 2013fs. A noticeable change from d to d is the weakening of N v , 4641, which suggests a decreasing ionisation. However, this seems to conflict with the increasing surface temperature inferred at this phase (see Section 3.5); perhaps the temperature derived from the SED may not fully reflect radiation in the ionisation region.
The spectra of SN 1998S at d and 3.3 d are similar to that of SN 2018zd at d. The similarity of the two spectra of SN 1998S (separated by 1 d) might suggest slower spectral evolution than that of SN 2018zd. In contrast, SN 2013fs went through very rapid changes during the first few days after the explosion. The narrow emissions seen in SN 2013fs showed pronounced variations on a timescale of hours and almost vanished d after the explosion.
Dessart, Hillier, & Audit (2017) applied radiation hydrodynamics and nonlocal-thermodynamic-equilibrium (NLTE) radiative transfer to produce observational features of SNe II with short-lived flash spectra considering different physical states of the progenitor before the explosion. The ionisation features produced in the r1w5h (where r1 means the progenitor star radius with , w5 means a wind mass-loss rate of , and h means the atmospheric density scale height of ) model is the closest to that seen in SN 2018zd among their models.
One can see that the r1w5h model can reproduce the dominant spectral features observed in SN 2018zd, but the model evolves too fast. For example, the model spectrum at d shows a similar continuum and spectral features (e.g., N v and He ii lines) as the d spectrum of SN 2018zd. The Balmer lines in the model spectrum are weaker than those of SN 2018zd. The model spectrum at d exhibits line features similar to those in the d spectrum of SN 2018zd. The continuum of the featureless model spectrum at d has a slope similar to that of SN 2018zd at d.
The slower spectral evolution and the longer-lived flash features of SN 2018zd in comparison with SN 2013fs and the r1w5h model are consistent with the slower light-curve rise seen in SN 2018zd. This difference might suggest a more massive and extended stellar wind surrounding SN 2018zd. On the other hand, the spectral evolution of SN 2018zd during the flash phase seems to be faster than that of SN 1998S. Therefore, we propose that SN 2018zd might have an environment (e.g., the mass of wind/CSM) lying between that of SN 2013fs and SN 1998S in mass immediately before the explosion.
4.2 Photospheric phase
Panel (b) of Fig. 8 displays spectra of SN 2018zd from d to d compared with photospheric-phase spectra of SNe 1999em and 2005cs, as well as with spectra of SNe 1998S, 2013by, 2013ej, and 2013fs at similar epochs.
At this phase, spectra of SN 2018zd are still characterised by a featureless blue continuum, likely due to continuous heating by CSM interaction. Consequently, the spectrum of SN 2018zd at d looks younger than that of SN 2005cs at d and SN 1999em at d; it has a bluer colour and a weaker P-Cygni H profile. Given its blue and featureless spectrum, SN 2018zd might be classified as a very young SN II (e.g., 1–2 d after the explosion) if it had not been spectrally observed until d. Moreover, cross-correlation with a library of SN spectra using the supernova identification code (SNID; Blondin & Tonry, 2007) shows that spectra of SN 2018zd at , 43, and 68 d respectively match those of SN 2005cs at , 10, and 13 d, SN 1999em at , 11, and 33 d, and SN 2004et at , 9, and 40 d.
Khazov et al. (2016) reported that 14% of their SN II sample observed at d show flash spectral features. This fraction might be underestimated because interaction makes SNe II look somewhat younger than their real age. For example, SN 2018zd might have been counted as a young SN II without flash features if both the discovery date and classification date had been delayed by d.
At d, the spectrum of SN 2018zd looks similar to that of SN 1998S at a comparable phase, but it shows a more pronounced P-Cygni profile of the H line than the latter. The spectrum of SN 2013fs at d exhibits a redder continuum and more noticeable Balmer lines than that of SN 2018zd, suggesting short-lived contribution of ionisation/interaction in the former, as seen in the flash phase.
The evolution in the light curve, surface radius, and temperature indicate that SN 2018zd starts recombination at d. After this phase, the spectrum of SN 2018zd (e.g., d) evolves to be like that of SNe IIP. For example, the spectrum of SN 2018zd at d is somewhat similar to that of SN 1999em at d, but with narrower and shallower spectral features. The contribution of CSM interaction still exists months after the explosion, as suggested by the bluer and colours of SN 2018zd at the same phase.
The EW ratio between the blue absorption wing and red emission wing of H in spectra of SN 2018zd () is smaller than that of SN 1999em () but larger than that of SN 2013by (), at – 30 d. SN 1998S does not show a well-developed H absorption component at d (). The relatively weak H absorption of SN 2013by and SN 19998S is usually seen in other SNe IIL (Schlegel, 1996). The narrower H profile and the lower of SN 2018zd might be related to a slower bulk expansion velocity than that of typical SNe IIP (Dessart et al., 2009). It is consistent with the low expansion velocity of SN 2018zd seen in Section 5.1 and 5.3.
4.3 Nebular phase
In the nebular phase, spectra of SN 2018zd evolve to be more like that of a normal SN IIP, dominated by emission lines of [O i], H, [Fe ii], [Ca ii], and Ca ii. Panel (c) of Fig. 8 shows three nebular spectra of SN 2018zd and model spectra of different progenitor masses (Jerkstrand et al., 2012). Comparison of the strength of [O i] 6300, 6364 between the observation and model suggests that the progenitor mass of SN 2018zd is in the range from 12 M⊙ to 15 M⊙, but preferring a lower mass.
The inset panel shows a close-up view of the H emission; the profile of has been corrected for the instrumental broadening effect, FWHMcorr = (FWHM FWHM, where FWHMobs is the observed full width at half-maximum intensity (FWHM), and FWHMinst is the instrumental FWHM. This emission becames progressively narrower from d to d, and then it levels off. The asymmetric H emission at d might imply an asymmetric structure in the inner part of this SN.
Maguire et al. (2012) reported a relation that can be roughly used to estimate the 56Ni mass from FWHMcorr: , where and . The FWHMcorr of SN 2018zd at d is measured to be Å, which yields . This estimate is consistent with the value derived from the light-curve tail (see Section 5.2).
5 Discussion
5.1 Ejecta velocities
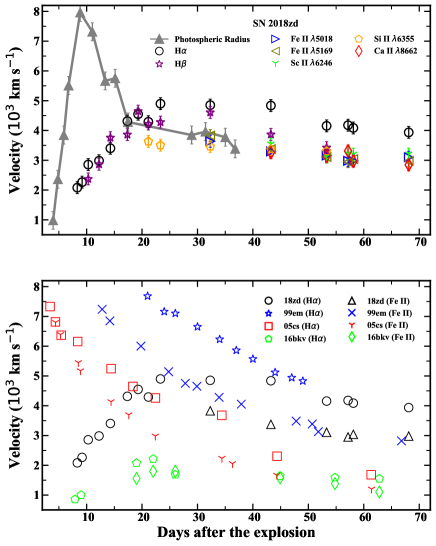
The ejecta velocities of SN 2018zd measured from the absorption minima (including H, H, Fe ii 5018, Fe ii 5169, Sc ii 6246, Si ii 6355, and Ca ii 8662) and the expanded photospheric radius are presented in the top panel of Fig. 9. For comparison, the ejecta velocities of SNe 1999em, 1998S, 2005cs, and 2016bkv derived from absorption minima of H and Fe ii 5169 are plotted in the bottom panel.
The velocity derived from the expanding photospheric radius of SN 2018zd () is km s-1 at d, which accelerates at an average of 1200 km s-1 d-1 in the next five days. It reaches the maximum velocity ( km s-1) at d when the bolometric luminosity rose to the peak. This velocity decreases quickly during the next week and reaches a velocity plateau at km s-1. The acceleration inferred from the photospheric radius might relate to the surrounding density structure of the SN. A CSM cloud with a density profile increasing outward may absorb progressively more energy from the shock, resulting in a fast-rising luminosity curve that may mimic an accelerating expansion of the photosphere.
The remarkable acceleration is seen in the velocity derived from the absorption minima of H and H of SN 2018zd at d. At the same phase, the H velocity of SN 2016bkv shows a similar increase, as noted by Nakaoka et al. (2018). This acceleration might imply distinct line-forming regions. At early phases, the weak H absorption forms in the wind/CSM that is above the optically-thick photosphere. The shocked ejecta ionise and accelerate this material to yield the observed spectral lines and acceleration. The H absorption lines in the well-developed P-Cygni profile at d form in the ejecta that decelerate owing to obstruction by the outer material.
At d, some well-developed absorptions can be used to estimate the velocity of SN 2018zd besides of the H lines. The velocity derived from those absorptions at d is close to that from the photospheric radius but is 1000 km s-1 slower than that from H lines. As usually seen in the normal SNe IIP, the velocity derived from H lines is higher than those from the other ions (Leonard et al., 2002). Considering these differences, we use Fe ii5169 and Sc ii 6246 as the tracker of photospheric velocity instead of H lines, as suggested by Hamuy (2003) and Maguire et al. (2010). The velocity of SN 2018zd at d interpolated by the velocity of Fe ii5169 and Sc ii 6246 is about 3300 km s-1, which is at the slow side of normal SNe IIP (as seen in Section 5.3) and is faster than the low-velocity SNe IIP (e..g., SN 2005cs).
| Supernova | Distance (Mpc) | E(B-V)total | Explosion date (MJD) | Ref.c | ||
|---|---|---|---|---|---|---|
| SN 2018zd | 18.4 (4.5) | 0.17 (0.05) | 1.36 (0.63) | 0.035 (0.012) | 58178.4 (0.5) | 1 |
| SN 1999em | 8.2 (0.6) | 0.10 (0.05) | 0.15 (0.03) | 0.033 (0.006) | 51475.1 (1.4) | 2 |
| SN 2013by | 14.8 (1.0) | 0.20 (0.03) | 1.15 (0.24) | 0.036 (0.006) | 56397.5 (2.0) | 3,1 |
| SN 2013ej | 9.6 (0.7) | 0.10 (0.03) | 0.57 (0.08) | 0.024 (0.005) | 56496.5 (1.5) | 4 |
aThe parameters in Fig. 10 . The number given in the brackets are the 1 uncertainties. b.Mass of derived by the bolometric luminosity during 130 d 180 d via Eq. 2. cReference of the distance, reddening and explosion date adopted in the calculation: 1. This work, 2. Leonard et al. (2002), 3. Valenti et al. (2015), 4. Huang et al. (2015).
5.2 Bolometric flux and explosion parameters
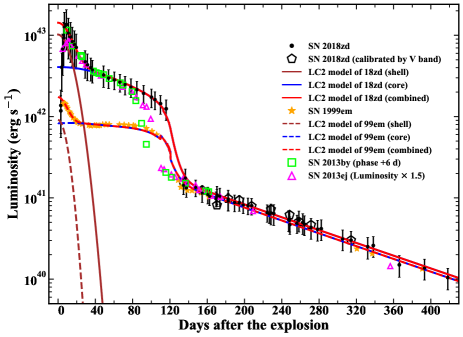
Fig. 10 displays the bolometric light curve of SN 2018zd based on the SED presented in Section 3.5. The flux at wavelengths redder than the photometry is derived by extrapolating a blackbody fit to the SED. The flux at wavelengths shorter than 1216 Å is assumed to be zero because of absorption in the H-rich atmosphere (Lyman series). At d, when UV photometry is available, we extrapolate the band (or the band if mag to avoid the red leak of the band; Brown et al., 2016) flux using a straight line to zero flux at 1216 Å (as seen in Fig. 7). In the tail phase, we omit the flux at wavelengths shorter than 3600 Å and extrapolate the flux beyond the wavelength range covered by the photometry via the blackbody directly. The latter treatment yields a luminosity match to that derived using the -band photometryvia the equation (Bersten & Hamuy, 2009)101010The “” in Equation 4 of Bersten & Hamuy (2009) is altered to be “+11.64” to correct the typo. during 135 d 338 d:
| (1) |
where is given in units of erg s-1, the colour term mag, and is the SN distance in units of cm.
The bolometric light curves of SN 1999em, SN 2013by, and SN 2013ej produced by the same method, and the bolometric light curve generated by the two-component model (LC2) of Nagy & Vinkó (2016), are also shown for comparison. LC2 is a semianalytical light-curve model, which computes the bolometric light curve of a homologous expanding supernova using the radiative diffusion approximation as introduced by Arnett & Fu (1989).
SN 2018zd reached its bolometric peak at d, erg s-1, higher than that of SN 1999em by a factor of eight, as listed in Table LABEL:Tab:boloLC. The large peak luminosity of SN 2018zd is partly due to the contribution of interaction between the shocked ejecta and stellar wind/CSM. This SN reached UV and optical maxima almost simultaneously, which also helped explain the higher peak bolometric luminosity. At the tail phase ( d), however, these two SNe are found to have similar luminosity ( erg s-1 at d) and decline rate ( mag 100 d-1, as expected from CoFe decay).
The expansion velocity of SN 2018zd matches that of SN 1999em within km s-1 at 50 d, as presented in Fig. 9. They are expected to have a similar middle plateau luminosity at a statistical uncertainty of 0.5 mag if they follow the velocity-luminosity relation (Hamuy, 2003), as seen in panel (a) of Fig. 11. Moreover, SN 2018zd exhibits a tail similar to that of SN 1999em after the contribution of CSM interaction disappeared. Thus, it might be reasonable to assume that the energy produced in the explosion of SN 2018zd is close to that of SN 1999em at the uncertain level of the velocity-luminosity relation if the former has no extra energy input from the interaction. Assuming all of the excess emission inferred in SN 2018zd relative to that of SN 1999em is converted from the kinetic energy of the ejecta (, where the photospheric ejecta velocity is derived from the absorption minimum of Fe ii lines, as presented in Fig. 9; at d is set to 3300 km s-1, the integration limit is from the first date when SN 2018zd having multi-band photometry to the end of plateau phase), we find that of wind material is required to produce the extra flux seen in SN 2018zd. The uncertainty in the wind-mass estimate includes the uncertainties in bolometric flux and the velocity-luminosity relation. This stellar wind is more massive than that of SN 2013fs (; estimated via the line luminosity of the narrow H emission in Yaron et al., 2017, and spectral modeling in Dessart, Hillier, & Audit, 2017) but less massive than that of SN 1998S (; derived from spectral modeling in Dessart et al., 2016).
SN 2013by shows a bolometric light curve similar to that of SN 2018zd at d if its epoch is shifted by +6 d. Given that the closest available prediscovery image of SN 2013by is about 22 d earlier than the discovery image (Parker et al., 2013) it is possible that SN 2013by exploded a few days earlier than the explosion date reported by Valenti et al. (2015). Thus, we adopt MJD = 56397.5 as the explosion date of SN 2013by for the following calculation. With this modified explosion date, the colour curve and light curve of SN 2013by matches that of SN 2018zd better. At d, SN 2013by ends the plateau phase and fades quickly. However, its tail luminosity meets that of SN 2018zd again.
The bolometric light curve of SN 2013ej roughly matches that of SN 2018zd and SN 2013by except the middle part (80 d 120 d) if the luminosity of SN 2013ej is multiplied by 1.5. These three SNe show a faster-declining plateau and a more significant drop from the plateau to the radioactive tail than does SN 1999em.
We estimate the mass of 56Ni ejected by the SN based on the tail bolometric luminosity via (Hamuy, 2003):
| (2) |
where is the phase after explosion, is the tail-phase luminosity in units of erg s-1, and is the redshift of the SN. SN 2018zd, SN 1999em, and SN 2013by produced similar amounts of 56Ni, as listed in Table LABEL:Tab:boloLC, given the similar radioactive tails.
| Parameter | SN 2018zd | SN 1999em | ||
|---|---|---|---|---|
| “core” | ‘shell” | “core” | “shell” | |
| Initial | model | parameters | ||
| ( cm) | 4.8 | 7.0 | 3.5 | 5.0 |
| (M⊙) | 9.80 | 0.55 | 13.50 | 0.20 |
| (M⊙) | 0.033 | 0 | 0.030 | 0 |
| (K) | 6000 | 0 | 7000 | 0 |
| ( erg) | 2.20 | 1.30 | 1.48 | 0.40 |
| ( erg) | 1.90 | 0.40 | 0.40 | 0.02 |
| 1.6 | 0.0 | 0.0 | 0.0 | |
| (cm2 g-1) | 0.28 | 0.40 | 0.26 | 0.40 |
| Calculated | physical | properties | ||
| (d) | 95.6 | 18.7 | 102.9 | 11.7 |
| (km s-1) | 6580 | 23200 | 4290 | 21300 |
a is the initial radius of the ejecta, is the ejected mass, is the initial nickel mass, is the recombination temperature, is initial kinetic energy, is the initial thermal energy, is the density profile exponent, is the opacity, is the light-curve timescale, and is the maximum expansion velocity.
It is not surprising to see that the mass of 56Ni derived by the LC2 model, ), is consistent with the above results, because they rely on a shared physical basis (Arnett, 1982; Arnett & Fu, 1989). Thus, the mean value of Ni) derived via the tail-phase flux matches the result from the nebular spectra. Since the estimate from the nebular spectra is relies only on the FWHM of H emission, which is independent of distance and extinction, the agreement between these two methods suggests that the distance and extinction of SN 2018zd adopted in this paper are reasonable.
The LC2 model reproduces the light curve of SN 1999em and also the light curve of SN 2018zd at d with the parameters listed in Table 3. Note that all models shown are not from formal fitting to the data. Instead, they can be considered only as representative examples that look similar to the observations. Thus, formal uncertainties cannot be assigned to the parameters shown in Table 3, but they are at least per cent according to Nagy & Vinkó (2016).
The velocity derived in the LC2 model is about 2000 km s-1 higher than that of SN 2018zd obtained from the spectral features, as presented in Section 5.1. This suggests that extra energy is required to produce such a luminous SN in the scheme of regular SNe IIP. A significant amount of the SN kinetic energy may be converted to thermal energy via the CSM interaction, conforming to the high temperature seen in Fig. 7.
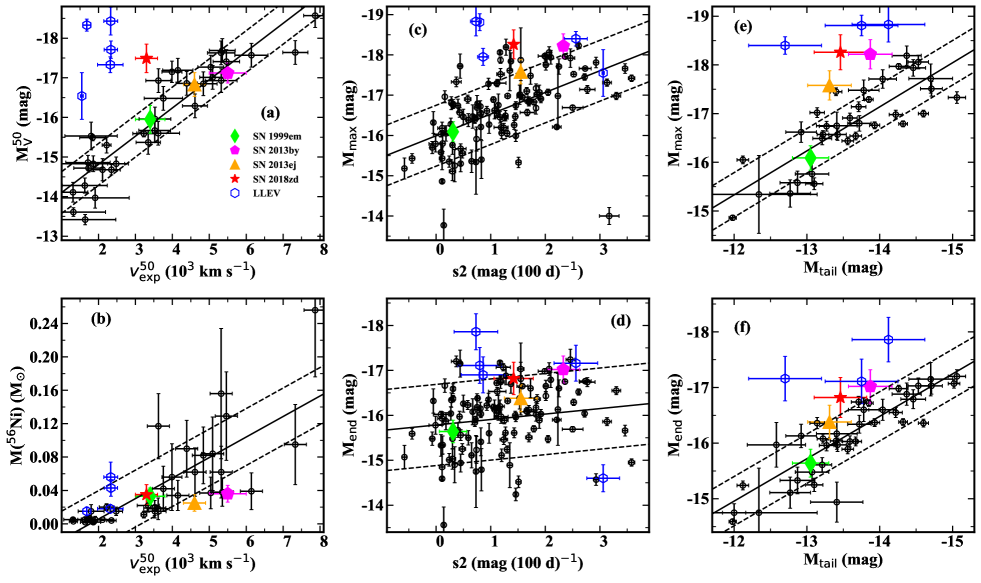
5.3 Comparison with other SNe II
Fig. 11 displays the position of SN 2018zd in the spectroscopic and photometric parameter space of SNe II. Comparing with the linear fitting in each panel, we note the following:
(1) The peak () and middle plateau () of SN 2018zd are (respectively) 1.50 mag and mag brighter than the sample SNe having a similar decline rate (Anderson et al., 2014) and ejecta expansion velocity () in panels (a) and (c).
(2) SN 2018zd experienced a significant luminosity drop from the peak to the tail, a departure from the linear fitting of vs. in panel (e).
(3) The tail brightness of SN 2018zd follows that of the SN II family. For example, the mass of synthesised 56Ni in SN 2018zd matches the
vs. Ni) relation in panel (b), and the brightness at the beginning of the tail phase is located in the region of vs. space in panel (d).
Two other SNe II, SN 2013ej and SN 2013by, show somewhat similar behaviour not only in bolometric light curves but also their positions in the SN II family. They have an intermediate flux drop during the transition from the plateau to the radioactive tail, smaller than that of SN 2018zd but more significant than the sample cluster. Combined with their fast light-curve decline rate during the photospheric phase, these two SNe might have extra energy injected by CSM interaction. Valenti et al. (2015) also suggest that the interaction scenario explains the fast-declining light curves of SN 2013by based on the flash spectral features in the spectrum at 2 d (as seen in Fig. 8) and the detection of the X-ray emission. Moreover, Morozova, Piro, & Valenti (2017) use a dense wind-like CSM interaction model to produce the luminous and fast-declining light curve of SN 2013ej and SN 2013by. The brightness of SN 2013ej and SN 2013by in the middle of the plateau phase follows the velocity-luminosity relation of SNe IIP, as seen in the panel (a) of Fig. 11. It seems that the extra energy in these two SNe disappeared at d, which suggests an interaction lasting for a period shorter than that of SN 2018zd.
SN 2018zd is an outlier in velocity-brightness space, as seen in panel (a). However, a group of luminous SNe with low expansion velocities (LLEV SNe; Rodríguez et al., 2020) is located in a more distant region relative to the bulk of sample than SN 2018zd. The middle plateau brightness of the LLEV SNe is –3 mag brighter than that of SNe II having the same ejecta expansion velocity. A larger drop from the peak to the tail in the light curve is also found in the LLEV SNe. Rodríguez et al. (2020) listed the observational characteristics of the LLEV SNe that are also found in SN 2018zd, such as the ejecta-CSM interaction signs at early phases, blue colours, weakness of metal lines, and luminous peak and plateau compared with the low expansion velocities. All of these properties were reproduced, assuming ejecta-CSM interaction that lasts between 4 and 11 weeks post-explosion, in the model work of Rodríguez et al. (2020). It confirms the interaction scenario of SN 2018zd suggested by our analysis here.
5.4 Electron-capture supernova
The typical temperature of the shocked CSM is K and that of the shocked ejecta is K, and both radiate in the X-ray band (Branch & Wheeler, 2017). These X-ray photons ionise the atoms in the surrounding wind/CSM, which then radiate narrow emission lines in the UV-optical band (i.e., the flashed spectral features) owing to recombination. Thus, we expect to detect the X-rays from SNe II if this radiation is not strongly absorbed by the unshocked material. However, Chandra, Chevalier, & Fransson (2018) reported the nondetection of SN 2018zd with the Swift X-ray telescope (XRT) between March 04 and March 11, 2018. They found an upper flux limit of erg cm2 s-1 (0.3–10 keV). Adopting Mpc, the upper limit for the X-ray luminosity of SN 2018zd is erg s-1, slightly less than the detected luminosity of SN 2013by ( erg s-1; Valenti et al., 2015). The weaker X-ray radiation of SN 2018zd than that of SN 2013by might be related to the stronger flash emission features of the former. It is possible that the majority of the X-ray photons from the shocked material are absorbed by the wind/CSM, producing stronger emission lines in the optical spectra.
Moriya et al. (2014) suggested that the optically bright but X-ray-faint SNe IIn can arise from electron-capture supernovae (ECSNe) that is exploded from the super-asymptotic giant branch (super-AGB) star (Miyaji et al., 1980; Nomoto et al., 1982; Miyaji & Nomoto, 1987). Super-AGB stars have a dense and massive circumstellar environment due to its high mass-loss rate wind, which could create narrow emission lines during the SN explosion, as seen in SN 2018zd. ECSNe is possible to be as luminous as SNe IIn at the peak phase due to the larger radius of the progenitor star, but the tail is faint because of the intrinsic low explosion energy and a small amount of 56Ni (Tominaga, Blinnikov & Nomoto, 2013; Moriya et al., 2014). The synthesised mass of 56Ni in SN 2018zd is relatively small compared to its luminous peak. Furthermore, this SN produced even less 56Ni if a shorter distance is adopted in the calculation. For example, it yields only M⊙ if Mpc (Bottinelli et al., 1984), which is close to the upper limit mass of 56Ni produced in ECSNe (; Kitaura, Janka & Hillebrandt, 2006).
Thus, given the luminous UV-optical peak, the relatively weak X-ray radiation, the massive wind/CSM environment, and a relatively small amount of synthesised 56Ni, the electron-capture trigged supernova explosion is also a possible scenario of SN 2018zd.
6 Conclusions
We present an extensive set of observations of SN 2018zd from the early “flash-ionisation” spectroscopic phase (e.g., d) to the later nebular phase (e.g., d). The flux excess observed in the clear-band light curve hr after the explosion might be a signal of shock breakout. The overluminous peak [e.g., erg s-1] of this SN accompanied by flash spectra at early times is likely caused by extra energy injection via interaction between the shocked ejecta and the massive wind (). This effect does not disappear immediately when the flash signatures in the spectra fade away. Energy is stored in the H-rich envelope and heats it, making SN 2018zd bluer than regular SNe IIP, as seen in its colour curve and spectrum during the photospheric phase. Meanwhile, this energy makes a brighter mid-plateau for SN 2018zd than regular SNe II having the same expansion velocity. SN 2018zd is thus a gap-filler event between the central cluster and separated LLEV SNe in velocity-brightness space, perhaps implying a continuous distribution of the interaction contribution. Given the similar fast-declining light curve of SNe II reported by Huang et al. (2015) for SN 2013ej and Valenti et al. (2015) for SN 2013by, there is a group of transitional events located at the boundary between SNe IIP and SNe IIL in the sense of decline rate. Finally, the nebular spectra and the light-curve tail of SN 2018zd resemble those of typical SNe IIP when the injected energy has been released. Thus, the observations of SN 2018zd presented in this paper are key to understanding the nature of the diverse origins of SNe II.
Acknowledgements
An anonymous referee made many useful suggestions that improved this paper. We acknowledge the support of the staff of the LJT, TNT, XLT, KOT, WT, and Keck. Funding for the LJT has been provided by the CAS and the People’s Government of Yunnan Province. The LJT is jointly operated and administrated by YNAO and Center for Astronomical Mega-Science, CAS. Some of the data presented herein were obtained at the W. M. Keck Observatory, which is operated as a scientific partnership among the California Institute of Technology, the University of California, and NASA; the Observatory was made possible by the generous financial support of the W. M. Keck Foundation. We are grateful for discussions with Luc Dessart, Osmar Rodríguez, Mario Hamuy, Peter Brown, Paolo Mazzali, and Pina Elena about this work.
J.Z. is supported by the National Natural Science Foundation of China (NSFC, grants 11773067, 11403096), by the Western Light Youth Project, and by the Youth Innovation Promotion Association of the CAS (grant 2018081). This work is sponsored (in part) by the CAS South America Center for Astronomy (CASSACA) in Santiago, Chile. X.W. is supported by NSFC (grants 11633002 and 11761141001) and the Major State Basic Research Development Program (grant 2016YFA0400803). J.V. and his group at Konkoly Observatory are supported by the project “Transient Astrophysical Objects” GINOP 2.3.2-15-2016-00033 of the National Research, Development and Innovation Office (NKFIH), Hungary, funded by the European Union. R.K.-T. is also supported by the ÚNKP-19-02 New National Excellence Program of the Ministry for Innovation and Technology. Ł.W. acknowledges support from the the Polish NCN DAINA grant 2017/27/L/ST9/03221 and EC’s H2020 OPTICON grant 730890. A.V.F.’s supernova group is grateful for financial assistance from the Christopher R. Redlich Fund, the TABASGO Foundation, and the Miller Institute for Basic Research in Science (U.C. Berkeley). P.M. acknowledges support provided by the Polish National Science Center (NCN) through grant 2016/21/B/ST9/01126. We acknowledge the Gaia Photometric Alerts group and the use of the Cambridge Photometric Calibration Server (http://gsaweb.ast.cam.ac.uk/followup), developed by Sergey Koposov and maintained by Łukasz Wyrzykowski, Arancha Delgado, and Pawel Zielinski, funded by the European Union’s Horizon 2020 research and innovation programmer under grant agreement 730890 (OPTICON). K.V. and L.K. are grateful for financial support from the National Research, Development and Innovation Office (NKFIH), Hungary, under grants NKFI-K-131508 and NKFI-KH-130526. Á.S., A.B., C.K., and K.V. are supported by the Lendület program grant LP2018-7/2019 of the Hungarian Academy of Sciences.
References
- Adamo et al. (2012) Adamo, A., Smith, L. J., Gallagher, J. S., et al. 2012, MNRAS, 426, 1185
- Anderson et al. (2014) Anderson, J. P., Conzález-Gaitán, S., Hamuy, M., et al. 2014, ApJ, 786, 67
- Arcavi et al. (2012) Arcavi, I., Gal-Yam, A., Cenko, S. B., et al. 2012, ApJL, 756, L30
- Arnett (1982) Arnett, W. D. 1982, ApJ, 253, 786
- Arnett & Fu (1989) Arnett, W. D., & Fu, A. 1989, ApJ, 340, 396
- Bersten & Hamuy (2009) Bersten, M., & Hamuy, M., 2009, ApJ, 701, 200
- Blondin & Tonry (2007) Blondin, S., & Tonry, J. 2007, ApJ, 666, 1024
- Bottinelli et al. (1984) Bottinelli, L., Gouguenheim, L., Paturel, G., et al. 1984, A&A, 56, 381
- Branch & Wheeler (2017) Branch, D., & Wheeler, J. C. 2017, in Supernova Explosions (Springer), Chapter 6
- Brown et al. (2016) Brown, P., Breeveld., A., Roming, P., et al. 2016, AJ, 152, 102
- Bullivant et al. (2018) Bullivant, C., Smith, N., Williams, G. G., et al. 2018, MNRAS, 476, 1497
- Chandra, Chevalier, & Fransson (2018) Chandra, P., Chevalier R. A., & Fransson, C. 2018, ATel. #11405
- Danziger (1988) Danziger, I. J. 1988, Sky and Telescope, 75, 611
- Dessart, Hillier, & Audit (2017) Dessart, L., Hillier, D. J., & Audit, E. 2017, A&A, 605, 83
- Dessart et al. (2013) Dessart, L., Hillier, D. J., Waldman, R., et al. 2013, MNRAS, 433, 1745
- Dessart et al. (2016) Dessart, L., Hillier, D. J., Audit, E., et al. 2016, MNRAS, 458, 2094
- Dessart et al. (2009) Dessart, L., Hillier, D. J., Gezari, S., et al. 2009, MNRAS, 394, 21
- Dhungana et al. (2016) Dhungana, G., Kehoe, R., Vinkó, J., et al. 2016, ApJ, 822, 6
- Elmhamdi et al. (2003) Elmhamdi, A., Danziger, I. J., Chugai, N., et al. 2003, MNRAS, 338, 939
- Fan et al. (2015) Fan, Y.-F., Bai, J.-M., Zhang, J.-J., et al. 2015, RAA, 15, 918
- Faran et al. (2014b) Faran, T., Poznanski, D., Filippenko, A.V., et al. 2014, MNRAS, 445, 554
- Fassia et al. (2001) Fassia, A., Meikle, W. P. S., Chugai, N., et al. 2001, MNRAS, 325, 907
- Fassia et al. (2000) Fassia, A., Meikle, W. P. S., Vacca, W. D., et al. 2000, MNRAS, 318, 1093
- Filippenko (1982) Filippenko, A. V. 1982, PASP, 94, 715
- Filippenko (1988) Filippenko, A. V. 1988, AJ, 96, 1941
- Filippenko (1997) Filippenko, A. V. 1997, ARAA, 35, 309
- Filippenko, Matheson, & Ho (1993) Filippenko, A. V., Matheson, T., & Ho, L. C. 1993, ApJ, 415, L103
- Fransson et al. (2014) Fransson, C., Ergon, M., Challis, P.J., et al. 2014, ApJ, 797, 118
- Gal-Yam (2017) Gal-Yam, A. 2017, in Handbook of Supernovae (Springer), 195
- Gal-Yam et al. (2014) Gal-Yam, A., Arcavi, I., Ofek, E. O., et al. 2014, Nature, 509, 471
- Garnavich et al. (2016) Garnavich, P. M., Tucker, B. E., Rest, A., et al. 2016, ApJ, 820, 23
- Gehrels et al. (2004) Gehrels, N., Chincarini, G., Giommi, P. et al. 2004, ApJ, 611, 1005
- Giraud (1985) Giraud, E. 1985, A&A, 153, 125
- Grassberg & Nadyozhin (1976) Grassberg, E. K., & Nadyozhin, D. K. 1976, Ap&SS, 44, 409
- Hamuy (2001) Hamuy, M. 2001, Ph.D. thesis, Univ. Arizona
- Hamuy (2003) Hamuy, M. 2003, ApJ, 582, 905
- Hamuy et al. (2001) Hamuy, M., Pinto, P. A., Maza, J., et al. 2001, ApJ, 558, 615
- Hosseinzadeh et al. (2018) Hosseinzadeh, G., Valenti, S., McCully, C., et al. 2018, ApJ, 861, 63
- Huang et al. (2012) Huang, F., Li, J. Z., Wang, X. F., et al. 2012, RAA, 11, 1585
- Huang et al. (2015) Huang, F., Wang, X. F., Zhang, J. J., et al. 2015, ApJ, 807, 59
- Jerkstrand et al. (2018) Jerkstrand, A., Ertl, T., Janka, H.-T., et al. 2018, MNRAS, 475, 277
- Jerkstrand et al. (2012) Jerkstrand, A., Fransson, C., Maguire, K., et al. 2012, A&A, 546, 28
- Khazov et al. (2016) Khazov, D., Yaron, O., Gal-Yam, A., et al. 2016, ApJ, 818, 3
- Kitaura, Janka & Hillebrandt (2006) Kitaura F. S., Janka H.-T., & Hillebrandt W., 2006, A&A, 450, 345
- Krisciunas et al. (2009) Krisciunas, K., Hamuy, M., Suntzeff, N.B., et al. 2009, ApJ, 137, 34
- Landolt (1992) Landolt, A. V. 1992, AJ, 104, 340
- Leonard et al. (2000) Leonard, D. C., Filippenko A. V., Barth, A. J., et al. 2000, ApJ, 536, 239
- Leonard et al. (2002) Leonard, D. C., Filippenko, A. V., Gates, E. L., et al. 2002, PASP, 114, 35
- Li et al. (2011) Li, W., Leaman, J., Chornock, R., et al. 2011, MNRAS, 412, 1441
- Maguire et al. (2010) Maguire, K., DiCarlo, E., Smartt, S. J., et al. 2010, MNRAS, 404, 981
- Mikolajczyk & Wyrzykowski (2018) Mikolajczyk, P., & Wyrzykowski, L. 2018, ATel. #12079
- Misra et al. (2007) Misra, K., Pooley, D., Chandra P., et al. 2007, MNRAS, 381, 280
- Miyaji et al. (1980) Miyaji, S., Nomoto, K., Yokoi, K., & Sugimoto, D. 1980, PASJ, 32, 303
- Miyaji & Nomoto (1987) Miyaji, S., & Nomoto, K. 1987, ApJ, 318, 307
- Moriya et al. (2014) Moriya, T. J., Tominaga, N., Langer, N., et al. 2014, A&A, 569, 57
- Morozova, Piro, & Valenti (2017) Morozova, V., Piro, A. L., & Valenti, S., et al. 2017, ApJ, 838, 28
- Mould et al. (2000) Mould, J. R., Huchra, J. P., Freedman, W. L., et al. 2000, ApJ, 529, 786
- Nomoto et al. (1982) Nomoto, K., Sugimoto, D., Sparks, W. M., et al. 1982, Nature, 299, 803
- Nagy & Vinkó (2016) Nagy, A., & Vinkó, J. 2016, A&A, 589, 53
- Nakaoka et al. (2018) Nakaoka, T., Kawabata, K. S., Maeda, K., et al. 2018, ApJ, 859, 78
- Oke et al. (1995) Oke, J. B., Cohen, J. G., Carr, M., et al. 1995, PASP, 107, 375
- Olivares et al. (2010) Olivares, F., Hamuy, M., Pignata, G., et al. 2010, ApJ, 715, 833
- Parker et al. (2013) Parker S., Kiyota, S., Morrell, N., et al., 2013, Cent. Bur. Electron. Telegrams, 3506, 1
- Pastorello et al. (2006) Pastorello, A., Sauer, D., Taubenberger, S., et al. 2006, MNRAS, 370, 1752
- Pastorello et al. (2009) Pastorello, A., Valenti, S., Zampieri, L., et al. 2009, MNRAS, 394, 2266
- Patat et al. (1993) Patat, F., Barbon, R., Cappellaro, E., & Turatto, M. 1993, A&AS, 98, 443
- Patat et al. (1994) Patat, F., Barbon, R., Cappellaro, E., & Turatto, M. 1994, A&A, 282, 731
- Planck (2014) Planck Collaboration, et al. 2014, A&A, 571, 1
- Poon et al. (2011) Poon, H., Pun, J. C. S., Lam, T. Y., 2011, arXiv.org:1109.0899
- Popov (1993) Popov D. V., 1993, ApJ, 414, 712
- Poznanski et al. (2011) Poznanski, D., Ganeshalingam, M., Silverman, J. M., & Filippenko, A. V. 2011, MNRAS, 415, L81
- Pritchard et al. (2014) Pritchard, T. A., Roming, P. W. A., Brown, P. J., et al. 2014, ApJ, 787, 157
- Richardson et al. (2002) Richardson, D., Branch, D., Casebeer, D., et al. 2002, AJ, 123, 745
- Rodríguez et al. (2020) Rodríguez, O., Pignata, G., Anderson, J., et al. 2020, MNRAS, 494, 5882
- Roming et al. (2005) Roming, P., Kennedy, T., Mason, K., et al. 2005, Space Sci. Rev., 120, 95
- Rui et al. (2019) Rui, L. M., Wang, X. F., Mo, J., et al. 2019, MNRAS, 485, 1990
- Sahu et al. (2006) Sahu, D. K., Anupama, G. C., Srividya, S., & Muneer, S. 2006, MNRAS, 372, 1315
- Sanders et al. (2015) Sanders N. E., Soderberg, A. M., Gezari, S., et al. 2015, ApJ, 799, 208
- Schlafly & Finkbeiner (2011) Schlafly, E. F., & Finkbeiner, D. P. 2011, ApJ, 737, 103
- Schlegel (1990) Schlegel, E. M., 1990, MNRAS, 244, 269
- Schlegel (1996) Schlegel, E. M., 1996, AJ, 111, 1660
- Schoniger & Sofue (1994) Schoniger, F., & Sofue, Y. 1994, A&A, 283, 21
- Shivvers et al. (2015) Shivvers, I., Groh, J. H., Mauerhan, J. C., et al. 2015, ApJ, 806, 213
- Smith et al. (2002) Smith, J., Tucker, D., Kent, S., et al. 2002, AJ, 123, 2121
- Spiro et al. (2014) Spiro, S., Pastorello, A., Pumo, M. L., et al. 2014, MNRAS, 439, 2873
- Stritzinger et al. (2018) Stritzinger, M. D., Anderson, J. P., Contreras, C., et al. 2018, A&A, 609, 134
- Stetson (1987) Stetson, P. 1987, PASP, 99, 191
- Suntzeff & Bouchet (1990) Suntzeff, N. B., & Bouchet, P., 1990, AJ, 99, 650
- Szalai et al. (2019) Szalai, T., Vinkó, J., Könyves-Tóth, R., et al. 2019, ApJ, 876, 1
- Tartaglia et al. (2020) Tartaglia, L., Pastorello, A., Sollerman, J., et al. 2020, A&A, 635, 39
- Tominaga, Blinnikov & Nomoto (2013) Tominaga, N., Blinnikov, S. I., & Nomoto, K. 2013, ApJ, 771, L12
- Tully & Fisher (1988) Tully, R. B., & Fisher, J. R. 1988, Catalog of Nearby Galaxies (Cambridge: Cambridge University Press)
- Turatto et al. (2003) Turatto, M., Benetti, S., & Cappellaro, E. 2003, in From Twilight to Highlight: The Physics of Supernovae, ed. W. Hillebrandt & B. Leibundgut (Berlin: Springer-Verlag), 200
- Tutui & Sofue (1997) Tutui, Y., & Sofue, Y. 1997, A&A, 326, 915
- Valenti et al. (2015) Valenti, S., Sand, D., Stritzinger, M., et al. 2015, MNRAS, 2608, 2616
- Wang et al. (2019) Wang, C.-J., Bai, J.-M., Fan, Y.-F., et al. 2019, RAA, arXiv:1905.05915
- Wang et al. (2008) Wang, X., Li, W., Filippenko, A. V., et al. 2008, ApJ, 675, 626
- Woosley et al (1989) Woosley, S. E., Hartmann, D., & Pinto, P. A. 1989, ApJ, 346, 395
- Yaron et al. (2017) Yaron, O., Perley, D. A., Gal-Yam, A., et al. 2017, Nature Physics, 13, 510
- Yuan et al. (2016) Yuan, F., Jerkstrand, A., Valenti, S., et al. 2016, MNRAS, 465, 2003
- Zhang, Yu, & Wang (2018) Zhang, J.-J., Yu, X.-G., & Wang, X.-F. 2018, ATel. #11379.
- Zhang et al. (2014) Zhang, J.-J., Wang, X.-F., Mazzali, P., et al. 2014, ApJ, 797, 5
- Zhang et al. (2012) Zhang, T.-M., Wang, X.-F., Wu, C., et al. 2012, AJ, 144, 131
Appendix A Photometric and spectroscopic data
| Star | (mag) | (mag) | (mag) | (mag) | (mag) | (mag) | (mag) | (mag) |
|---|---|---|---|---|---|---|---|---|
| 1 | 14.88(0.01) | 14.63(0.01) | 13.79(0.01) | 13.40(0.02) | 13.02(0.02) | 14.17(0.01) | 13.56(0.01) | 13.40(0.01) |
| 2 | 15.47(0.01) | 14.92(0.01) | 13.98(0.01) | 13.53(0.03) | 13.12(0.01) | 14.42(0.01) | 13.68(0.01) | 13.47(0.01) |
| 3 | 16.35(0.02) | 16.47(0.01) | 15.93(0.02) | 15.58(0.02) | 15.26(0.02) | 16.15(0.01) | 15.78(0.01) | 15.67(0.01) |
| 4 | 16.49(0.01) | 16.32(0.01) | 15.54(0.03) | 15.10(0.01) | 14.69(0.01) | 15.90(0.01) | 15.31(0.01) | 15.11(0.01) |
| 5 | 17.54(0.04) | 17.26(0.03) | 16.41(0.03) | 15.96(0.04) | 15.53(0.02) | 16.79(0.01) | 16.18(0.01) | 15.96(0.01) |
| 6 | 15.48(0.02) | 15.48(0.02) | 14.80(0.02) | 14.41(0.01) | 14.04(0.01) | 15.09(0.01) | 14.61(0.01) | 14.46(0.01) |
| 7 | 17.08(0.01) | 16.86(0.02) | 16.06(0.02) | 15.61(0.01) | 15.19(0.02) | 16.42(0.01) | 15.82(0.01) | 15.61(0.01) |
| 8 | 17.48(0.02) | 16.86(0.02) | 15.92(0.01) | 15.45(0.02) | 15.03(0.02) | 16.35(0.02) | 15.61(0.01) | 15.40(0.02) |
| 9 | 17.94(0.01) | 17.89(0.01) | 17.08(0.01) | 16.59(0.02) | 16.13(0.02) | 17.45(0.01) | 16.83(0.01) | 16.59(0.01) |
| 10 | 14.56(0.01) | 14.44(0.02) | 13.72(0.01) | 13.40(0.01) | 13.08(0.01) | 14.02(0.01) | 13.56(0.01) | 13.45(0.01) |
| 11 | 17.26(0.03) | 17.07(0.01) | 16.27(0.01) | 15.85(0.02) | 15.46(0.03) | 16.63(0.01) | 16.04(0.01) | 15.85(0.01) |
| 12 | 16.85(0.01) | 16.52(0.01) | 15.67(0.01) | 15.24(0.01) | 14.83(0.03) | 16.06(0.01) | 15.42(0.01) | 15.23(0.01) |
aSee Fig. 1 for the finder chart of these reference stars. bands in Vega magnitude system, bands in AB magnitude system. Uncertainties (in parentheses) are .
| Date (UT) | MJD | Epoch (d)b | (mag) | (mag) | (mag) | (mag) | (mag) | (mag) | (mag) | (mag) | Facility |
|---|---|---|---|---|---|---|---|---|---|---|---|
| Mar. 04 2018 | 58181.91 | 3.52 | … | 15.38(0.01) | 15.26(0.01) | 15.05(0.01) | 14.91(0.01) | … | … | … | KOT |
| Mar. 05 2018 | 58182.76 | 4.37 | … | 14.93(0.01) | 14.73(0.01) | … | … | 14.79(0.01) | 14.76(0.01) | 14.87(0.01) | LJT |
| Mar. 07 2018 | 58184.70 | 6.31 | 13.30(0.02) | 14.07(0.02) | 13.91(0.01) | … | … | 13.94(0.01) | 13.96(0.01) | 14.10(0.01) | LJT |
| Mar. 07 2018 | 58184.73 | 6.34 | … | 13.85(0.08) | 13.96(0.05) | 13.77(0.08) | 13.73(0.05) | … | … | … | KOT |
| Mar. 08 2018 | 58185.48 | 7.09 | … | 13.93(0.01) | 13.67(0.01) | 13.59(0.01) | 13.57(0.01) | … | … | … | TNT |
| Mar. 08 2018 | 58185.70 | 7.31 | 13.03(0.03) | 13.82(0.02) | 13.65(0.01) | … | … | 13.68(0.01) | 13.70(0.01) | 13.85(0.02) | LJT |
| Mar. 08 2018 | 58185.75 | 7.36 | … | 13.70(0.05) | 13.72(0.04) | 13.52(0.10) | 13.45(0.09) | … | … | … | KOT |
| Mar. 09 2018 | 58186.47 | 8.08 | … | 13.81(0.05) | 13.51(0.10) | 13.45(0.08) | 13.43(0.09) | … | … | … | TNT |
| Mar. 09 2018 | 58186.70 | 8.31 | 12.98(0.03) | 13.79(0.02) | 13.55(0.01) | … | … | 13.63(0.01) | 13.62(0.01) | 13.78(0.01) | LJT |
| Mar. 10 2018 | 58187.48 | 9.09 | … | 13.81(0.04) | 13.49(0.04) | 13.44(0.07) | 13.40(0.04) | … | … | … | TNT |
| Mar. 10 2018 | 58187.79 | 9.40 | … | 13.75(0.03) | 13.63(0.02) | 13.46(0.03) | 13.36(0.04) | … | … | … | KOT |
| Mar. 11 2018 | 58188.70 | 10.31 | 13.08(0.03) | 13.86(0.01) | 13.58(0.01) | … | … | 13.69(0.01) | 13.64(0.02) | 13.74(0.01) | LJT |
| Mar. 12 2018 | 58189.47 | 11.08 | … | 13.93(0.04) | 13.55(0.04) | 13.46(0.09) | 13.37(0.04) | … | … | … | TNT |
| Mar. 12 2018 | 58189.72 | 11.33 | 13.16(0.04) | 13.94(0.03) | 13.63(0.01) | … | … | 13.75(0.01) | 13.68(0.01) | 13.79(0.01) | LJT |
| Mar. 12 2018 | 58189.74 | 11.35 | … | 13.76(0.07) | 13.65(0.04) | 13.46(0.07) | 13.36(0.07) | … | … | … | KOT |
| Mar. 12 2018 | 58189.92 | 11.53 | … | 13.86(0.03) | 13.71(0.02) | 13.50(0.05) | 13.36(0.07) | … | … | … | KOT |
| Mar. 13 2018 | 58190.64 | 12.25 | 13.21(0.02) | 13.95(0.02) | 13.64(0.01) | … | … | 13.78(0.02) | 13.68(0.01) | 13.78(0.01) | LJT |
| Mar. 13 2018 | 58190.81 | 12.42 | … | 13.92(0.02) | 13.76(0.01) | 13.55(0.03) | 13.39(0.04) | … | … | … | KOT |
| Mar. 14 2018 | 58191.77 | 13.38 | … | 14.00(0.02) | 13.78(0.01) | 13.56(0.03) | 13.41(0.04) | … | … | … | KOT |
| Mar. 15 2018 | 58192.48 | 14.09 | … | 14.06(0.05) | 13.65(0.04) | 13.53(0.08) | 13.46(0.05) | … | … | … | TNT |
| Mar. 18 2018 | 58195.47 | 17.08 | … | 14.19(0.04) | 13.75(0.04) | 13.57(0.07) | 13.47(0.08) | … | … | … | TNT |
| Mar. 18 2018 | 58195.73 | 17.34 | 13.46(0.04) | 14.18(0.01) | 13.81(0.01) | … | … | 13.95(0.01) | 13.79(0.02) | 13.85(0.01) | LJT |
| Mar. 19 2018 | 58196.48 | 18.09 | … | 14.21(0.05) | 13.75(0.10) | 13.59(0.07) | 13.47(0.09) | … | … | … | TNT |
| Mar. 21 2018 | 58198.49 | 20.10 | … | 14.29(0.04) | 13.83(0.05) | 13.62(0.04) | 13.48(0.06) | … | … | … | TNT |
| Mar. 21 2018 | 58198.56 | 20.17 | 13.55(0.03) | 14.22(0.01) | 13.83(0.01) | … | … | 13.99(0.01) | 13.81(0.01) | 13.84(0.01) | LJT |
| Mar. 22 2018 | 58199.48 | 21.09 | … | 14.29(0.04) | 13.83(0.03) | 13.63(0.05) | 13.48(0.04) | … | … | … | TNT |
| Mar. 22 2018 | 58199.78 | 21.39 | … | 14.25(0.02) | 13.97(0.01) | 13.68(0.03) | 13.47(0.03) | … | … | … | KOT |
| Mar. 23 2018 | 58200.47 | 22.08 | … | 14.33(0.05) | 13.85(0.06) | 13.65(0.07) | 13.50(0.05) | … | … | … | TNT |
| Mar. 23 2018 | 58200.61 | 22.22 | 13.66(0.03) | 14.30(0.01) | 13.89(0.01) | … | … | 14.06(0.01) | 13.83(0.02) | 13.86(0.01) | LJT |
| Mar. 23 2018 | 58200.76 | 22.37 | … | 14.30(0.03) | 13.99(0.02) | 13.71(0.03) | 13.51(0.03) | … | … | … | KOT |
| Mar. 23 2018 | 58200.87 | 22.48 | … | 14.24(0.05) | 13.93(0.04) | 13.66(0.06) | 13.46(0.06) | … | … | … | KOT |
| Mar. 24 2018 | 58201.49 | 23.10 | … | 14.37(0.04) | 13.87(0.05) | 13.66(0.03) | 13.49(0.04) | … | … | … | TNT |
| Mar. 24 2018 | 58201.84 | 23.45 | … | 14.29(0.04) | 13.99(0.02) | 13.70(0.04) | 13.47(0.04) | … | … | … | KOT |
| Mar. 25 2018 | 58202.47 | 24.08 | … | 14.40(0.04) | 13.89(0.07) | 13.68(0.09) | 13.49(0.07) | … | … | … | TNT |
| Mar. 25 2018 | 58202.67 | 24.28 | 13.75(0.03) | 14.36(0.01) | 13.93(0.01) | … | … | 14.11(0.01) | 13.85(0.01) | 13.87(0.01) | LJT |
| Mar. 26 2018 | 58203.51 | 25.12 | … | … | 14.01(0.05) | 13.76(0.09) | 13.54(0.05) | … | … | … | TNT |
| Mar. 26 2018 | 58203.67 | 25.28 | 13.81(0.03) | 14.38(0.02) | 13.94(0.01) | … | … | 14.14(0.02) | 13.86(0.02) | 13.86(0.02) | LJT |
| Mar. 29 2018 | 58206.67 | 28.28 | 13.95(0.02) | 14.49(0.01) | 14.00(0.01) | … | … | 14.21(0.01) | 13.91(0.01) | 13.89(0.01) | LJT |
| Apr. 01 2018 | 58209.65 | 31.26 | 14.08(0.02) | 14.55(0.02) | 14.04(0.02) | … | … | 14.27(0.02) | 13.91(0.02) | 13.87(0.02) | LJT |
| Apr. 02 2018 | 58210.67 | 32.28 | 14.14(0.03) | 14.60(0.02) | 14.05(0.02) | … | … | 14.27(0.02) | 13.92(0.02) | 13.91(0.01) | LJT |
| Apr. 02 2018 | 58210.79 | 32.40 | … | 14.55(0.06) | 14.11(0.04) | 13.75(0.08) | 13.48(0.07) | … | … | … | KOT |
| Apr. 02 2018 | 58210.82 | 32.43 | … | 14.61(0.02) | 14.16(0.01) | 13.80(0.02) | 13.49(0.03) | … | … | … | KOT |
| Apr. 03 2018 | 58211.78 | 33.39 | … | 14.56(0.05) | 14.13(0.03) | 13.77(0.06) | 13.48(0.06) | … | … | … | KOT |
| Apr. 08 2018 | 58216.48 | 38.09 | … | 14.80(0.05) | 14.12(0.06) | 13.81(0.04) | 13.53(0.08) | … | … | … | TNT |
| Apr. 08 2018 | 58216.61 | 38.22 | 14.55(0.03) | 14.78(0.02) | 14.18(0.01) | … | … | 14.45(0.02) | 14.01(0.02) | 13.89(0.03) | LJT |
| Apr. 08 2018 | 58216.80 | 38.41 | … | 14.77(0.03) | 14.22(0.02) | 13.84(0.05) | 13.51(0.05) | … | … | … | KOT |
| Apr. 10 2018 | 58218.49 | 40.10 | … | 14.88(0.04) | 14.15(0.04) | 13.79(0.04) | 13.54(0.10) | … | … | … | TNT |
| Apr. 11 2018 | 58219.49 | 41.10 | … | 14.91(0.06) | 14.17(0.05) | 13.83(0.08) | 13.56(0.08) | … | … | … | TNT |
| Apr. 12 2018 | 58220.67 | 42.28 | 14.70(0.02) | 14.88(0.02) | 14.23(0.01) | … | … | 14.53(0.01) | 14.05(0.02) | 13.99(0.01) | LJT |
aUncertainties (in parentheses) are .
bThe epoch is relative to the explosion date, MJD = 58178.39.
. Date (UT) MJD Epoch (d)b (mag) (mag) (mag) (mag) (mag) (mag) (mag) (mag) Facility Apr. 13 2018 58221.83 43.44 … 14.97(0.02) 14.32(0.02) 13.91(0.02) 13.58(0.01) … … … KOT Apr. 14 2018 58222.96 44.57 … 14.91(0.04) 14.21(0.04) … … … 14.08(0.01) 13.96(0.04) WT Apr. 15 2018 58223.49 45.10 … 15.04(0.05) 14.24(0.04) 13.87(0.08) 13.58(0.08) … … … TNT Apr. 16 2018 58224.51 46.12 … 15.09(0.04) 14.25(0.03) 13.89(0.08) 13.62(0.09) … … … TNT Apr. 17 2018 58225.56 47.17 14.98(0.02) 15.05(0.03) 14.27(0.02) … … 14.65(0.03) 14.11(0.03) 13.96(0.03) LJT Apr. 18 2018 58226.49 48.10 … … 14.27(0.05) 13.89(0.09) 13.58(0.07) … … … TNT Apr. 12 2018 58226.81 48.42 … 15.13(0.03) 14.38(0.02) 13.95(0.05) 13.60(0.05) … … … KOT Apr. 18 2018 58226.91 48.52 … 15.02(0.04) 14.27(0.04) … … … 14.13(0.02) 14.01(0.04) WT Apr. 20 2018 58228.51 50.12 … … 14.32(0.05) 13.91(0.06) 13.61(0.10) … … … TNT Apr. 21 2018 58229.70 51.31 15.22(0.03) 15.16(0.03) 14.36(0.01) … … 14.71(0.01) 14.12(0.01) 14.05(0.02) LJT Apr. 22 2018 58230.82 52.43 … 15.25(0.02) 14.43(0.02) 13.99(0.03) 13.64(0.03) … … … KOT Apr. 25 2018 58233.53 55.14 15.44(0.02) 15.28(0.02) 14.43(0.01) … … 14.82(0.02) 14.20(0.01) 14.08(0.01) LJT Apr. 27 2018 58235.56 57.17 15.48(0.04) 15.31(0.03) 14.41(0.02) … … 14.82(0.01) 14.19(0.01) 14.07(0.02) LJT Apr. 27 2018 58235.80 57.41 … 15.38(0.01) 14.53(0.03) 14.04(0.02) 13.69(0.01) … … … KOT Apr. 28 2018 58236.81 58.42 … 15.42(0.07) 14.51(0.03) 14.04(0.06) 13.70(0.03) … … … KOT Apr. 30 2018 58238.82 60.43 … 15.43(0.05) 14.54(0.02) 14.07(0.05) 13.70(0.06) … … … KOT Mar. 02 2018 58240.80 62.41 … 15.53(0.06) 14.55(0.04) 14.08(0.06) 13.72(0.05) … … … KOT May 03 2018 58241.51 63.12 … 15.53(0.05) 14.48(0.04) 14.05(0.08) 13.71(0.07) … … … TNT May 04 2018 58242.52 64.13 … 15.57(0.06) 14.52(0.05) 14.06(0.04) 13.70(0.09) … … … TNT May 07 2018 58245.53 67.14 … 15.60(0.05) 14.54(0.04) 14.04(0.09) 13.65(0.10) … … … TNT May 08 2018 58246.56 68.17 15.99(0.04) 15.58(0.01) 14.60(0.01) … … 15.04(0.01) 14.32(0.01) 14.20(0.01) LJT May 13 2018 58250.87 72.48 … … 14.61(0.06) … … … 14.36(0.02) 14.19(0.05) WT May 14 2018 58251.86 73.47 … … 14.63(0.05) … … … 14.38(0.02) 14.21(0.03) WT May 15 2018 58253.54 75.15 16.23(0.05) 15.75(0.02) 14.69(0.01) … … 15.18(0.01) 14.37(0.02) 14.29(0.02) LJT May 20 2018 58257.86 79.47 … 15.72(0.06) 14.70(0.06) … … … 14.43(0.02) 14.25(0.04) WT May 22 2018 58259.87 81.48 … 15.76(0.06) 14.74(0.05) … … … 14.46(0.02) 14.29(0.04) WT Mar. 23 2018 58261.98 83.59 … 16.00(0.02) 14.87(0.02) 14.33(0.02) 13.92(0.02) … … … KOT May 27 2018 58264.89 86.50 … 15.87(0.07) 14.82(0.05) … … … 14.52(0.02) 14.34(0.04) WT Jun. 06 2018 58275.88 97.49 … 16.18(0.08) 15.03(0.06) … … … 14.69(0.03) 14.49(0.04) WT Jun. 07 2018 58276.88 98.49 … 16.18(0.07) 15.04(0.07) … … … 14.70(0.04) 14.49(0.04) WT Jun. 07 2018 58277.00 98.61 … 16.37(0.03) 15.12(0.03) 14.54(0.02) 14.12(0.02) … … … KOT Jun. 09 2018 58278.96 100.57 … 16.42(0.05) 15.15(0.03) 14.61(0.03) 14.17(0.07) … … … KOT Jun. 11 2018 58281.01 102.62 … 16.53(0.03) 15.22(0.02) 14.62(0.03) 14.19(0.07) … … … KOT Jun. 14 2018 58283.89 105.50 … 16.37(0.09) 15.21(0.06) … … … 14.82(0.02) 14.62(0.04) WT Jun. 16 2018 58285.88 107.49 … 16.46(0.07) 15.27(0.07) … … … 14.89(0.02) … WT Jun. 16 2018 58286.00 107.61 … 16.71(0.03) 15.35(0.01) 14.73(0.03) 14.31(0.04) … … … KOT Jul. 13 2018 58312.97 134.58 … 19.41(0.05) 18.14(0.03) 17.13(0.02) 16.70(0.02) … … … KOT Jul. 15 2018 58314.89 136.50 … 19.18(0.18) … … … … 17.35(0.04) 17.02(0.06) WT Jul. 16 2018 58315.98 137.59 … 19.47(0.08) 18.17(0.03) 17.24(0.02) 16.75(0.02) … … … KOT Jul. 26 2018 58326.00 147.61 … 19.51(0.27) 18.23(0.07) 17.18(0.04) 16.78(0.03) … … … KOT Aug. 03 2018 58333.01 154.62 … 19.50(0.10) 18.37(0.04) 17.36(0.02) 16.95(0.04) … … … KOT Aug. 08 2018 58338.99 160.60 … 19.81(0.07) 18.39(0.03) 17.37(0.02) 17.03(0.03) … … … KOT Aug. 10 2018 58340.85 162.46 … 19.61(0.08) 18.47(0.03) 17.44(0.03) 17.06(0.04) … … … KOT Aug. 17 2018 58347.85 169.46 … 20.22(0.51) 19.06(0.17) 17.63(0.06) 17.08(0.10) … … … KOT Aug. 18 2018 58348.83 170.44 … 20.06(0.32) 18.83(0.10) 17.43(0.05) 17.09(0.06) … … … KOT Aug. 08 2018 58348.86 170.47 … 19.68(0.05) 18.49(0.02) … … 18.98(0.02) 17.50(0.02) 17.71(0.01) LJT Aug. 21 2018 58351.86 173.47 … 19.25(0.16) 18.38(0.08) 17.46(0.05) 17.03(0.04) … … … KOT Aug. 30 2018 58360.89 182.50 … 19.67(0.03) 18.63(0.02) … … 19.10(0.02) 17.64(0.02) 17.83(0.02) LJT Aug. 30 2018 58360.90 182.51 … 19.55(0.37) 18.81(0.11) 17.58(0.05) 17.23(0.04) … … … KOT Sep. 06 2018 58367.76 189.37 … 19.93(0.11) 18.68(0.05) 17.63(0.03) 17.25(0.04) … … … KOT Sep. 11 2018 58372.78 194.39 … 20.07(0.09) 18.68(0.07) 17.76(0.03) 17.13(0.04) … … … KOT Sep. 15 2018 58377.01 198.62 … 20.18(0.10) 18.78(0.03) 17.71(0.01) 17.33(0.02) … … … KOT Sep. 20 2018 58382.12 203.73 … 19.81(0.37) 18.90(0.10) 17.67(0.04) 17.42(0.03) … … … KOT Sep. 24 2018 58386.00 207.61 … 19.94(0.42) 18.86(0.14) 17.71(0.04) 17.38(0.03) … … … KOT Oct. 11 2018 58402.71 224.32 … 19.81(0.11) 19.04(0.06) 17.87(0.03) 17.65(0.03) … … … KOT Oct. 14 2018 58405.07 226.68 … 20.01(0.06) 18.91(0.04) 17.94(0.02) 17.66(0.03) … … … KOT Oct. 15 2018 58406.76 228.37 … 20.02(0.05) 18.96(0.02) … … 19.41(0.03) 18.03(0.02) 18.28(0.02) LJT Oct. 18 2018 58409.76 231.37 … 20.12(0.05) 19.08(0.01) … … 19.45(0.01) 18.05(0.03) 18.31(0.03) LJT Nov. 03 2018 58425.76 247.37 … 20.18(0.05) 19.26(0.03) … … 19.57(0.02) 18.23(0.02) 18.50(0.03) LJT Nov. 04 2018 58426.79 248.40 … 20.10(0.05) 19.13(0.03) … … 19.52(0.02) 18.25(0.02) 18.49(0.03) LJT Nov. 05 2018 58427.04 248.65 … 20.25(0.16) 19.23(0.10) 18.17(0.06) 18.18(0.06) … … … KOT Nov. 12 2018 58434.68 256.29 … 20.03(0.19) 19.35(0.09) 18.19(0.04) 17.99(0.05) … … … KOT Nov. 14 2018 58436.76 258.37 … 20.30(0.05) 19.34(0.02) … … 19.65(0.04) 18.33(0.04) 18.45(0.05) LJT Nov. 18 2018 58440.92 262.53 … 20.33(0.06) 19.22(0.04) … … 19.65(0.03) 18.35(0.03) 18.54(0.04) LJT Nov. 20 2018 58442.68 264.29 … 20.83(0.21) 19.70(0.11) … … 19.97(0.11) 18.44(0.04) 18.65(0.05) LJT Nov. 27 2018 58449.76 271.37 … 20.33(0.06) 19.44(0.03) … … 19.83(0.04) 18.50(0.03) 18.70(0.05) LJT Dec. 04 2018 58456.75 278.36 … 20.31(0.06) 19.35(0.03) … … 19.78(0.02) 18.55(0.02) 18.74(0.03) LJT Dec. 08 2018 58460.74 282.35 … 20.47(0.04) 19.57(0.02) … … 19.85(0.02) 18.59(0.03) 18.71(0.04) LJT Dec. 31 2018 58483.70 305.31 … … … … … 20.04(0.02) 18.89(0.03) 19.02(0.04) LJT Jan. 09 2019 58492.68 314.29 … 20.67(0.09) 19.91(0.07) … … 20.08(0.05) 19.00(0.04) 19.02(0.04) LJT Jan. 27 2019 58510.59 332.20 … 20.71(0.05) 20.01(0.04) … … 20.18(0.04) 19.12(0.03) 19.26(0.04) LJT Feb. 02 2019 58516.59 338.20 … 20.93(0.06) 20.07(0.03) … … 20.19(0.03) 19.15(0.04) 19.19(0.04) LJT Mar. 02 2019 58544.53 366.14 … 21.18(0.08) 20.19(0.05) … … 20.56(0.05) 19.72(0.05) 19.75(0.05) LJT Mar. 29 2019 58571.53 393.14 … … … … … 20.64(0.07) 19.83(0.06) 19.84(0.07) LJT Apr. 07 2019 58580.52 402.13 … … … … … … 19.94(0.08) 19.89(0.07) LJT Apr. 23 2019 58596.53 418.14 … … … … … 20.99(0.12) 20.14(0.06) 20.11(0.07) LJT May 31 2019 58634.54 456.15 … … … … … … 20.51(0.18) 20.45(0.13) LJT aUncertainties (in parentheses) are .
bThe epoch is relative to the explosion date, MJD = 58178.39.
| Date (UT) | MJD | Epoch (d)b | (mag) | (mag) | (mag) | (mag) | (mag) | (mag) |
|---|---|---|---|---|---|---|---|---|
| Mar. 04 2018 | 58181.29 | 2.90 | 16.00(0.04) | 15.86(0.03) | 15.53(0.04) | 15.17(0.04) | 16.17(0.04) | 15.99(0.06) |
| Mar. 04 2018 | 58181.35 | 2.96 | 15.71(0.04) | 15.68(0.06) | 15.34(0.04) | 15.01(0.04) | 16.06(0.04) | 15.82(0.06) |
| Mar. 05 2018 | 58182.35 | 3.96 | 14.10(0.02) | 14.19(0.02) | 14.03(0.02) | 13.92(0.03) | 15.04(0.03) | 15.01(0.04) |
| Mar. 06 2018 | 58183.21 | 4.82 | 13.48(0.02) | 13.49(0.06) | 13.47(0.03) | 13.43(0.03) | 14.61(0.03) | 14.56(0.04) |
| Mar. 07 2018 | 58184.28 | 5.89 | 13.07(0.11) | 13.18(0.03) | 13.25(0.11) | 12.96(0.04) | 14.21(0.04) | 14.24(0.07) |
| Mar. 08 2018 | 58185.14 | 6.75 | 12.73(0.02) | 12.88(0.03) | 12.79(0.07) | 12.69(0.03) | 13.88(0.03) | 13.84(0.04) |
| Mar. 10 2018 | 58187.23 | 8.84 | 12.86(0.02) | 12.89(0.02) | 12.77(0.07) | 12.55(0.03) | 13.71(0.02) | 13.61(0.03) |
| Mar. 12 2018 | 58189.42 | 11.03 | 13.47(0.02) | 13.28(0.02) | 13.13(0.07) | 12.78(0.03) | 13.85(0.02) | 13.68(0.03) |
| Mar. 14 2018 | 58191.74 | 13.35 | 13.85(0.02) | 13.58(0.02) | 13.28(0.07) | 12.89(0.03) | 13.92(0.03) | 13.66(0.03) |
| Mar. 16 2018 | 58193.53 | 15.14 | 14.33(0.03) | 13.99(0.03) | 13.53(0.07) | 13.02(0.03) | 14.00(0.03) | 13.75(0.03) |
| Mar. 18 2018 | 58195.85 | 17.46 | 14.56(0.02) | 14.20(0.03) | 13.76(0.07) | 13.11(0.03) | 14.05(0.02) | 13.80(0.03) |
| Mar. 20 2018 | 58197.72 | 19.33 | 14.83(0.03) | 14.49(0.03) | 13.92(0.07) | 13.22(0.03) | 14.14(0.03) | 13.86(0.03) |
| Mar. 30 2018 | 58207.34 | 28.95 | 16.01(0.04) | 16.07(0.04) | 15.03(0.07) | 13.85(0.03) | 14.41(0.03) | 14.04(0.04) |
| Apr. 01 2018 | 58209.83 | 31.44 | 16.42(0.05) | 16.55(0.05) | 15.35(0.08) | 13.98(0.03) | 14.50(0.03) | 14.08(0.04) |
| Apr. 05 2018 | 58213.41 | 35.02 | 17.01(0.05) | 17.23(0.05) | 15.77(0.08) | 14.25(0.03) | 14.63(0.03) | 14.12(0.03) |
| Apr. 07 2018 | 58215.18 | 36.79 | 17.21(0.06) | 17.71(0.07) | 16.01(0.08) | 14.38(0.03) | 14.72(0.03) | 14.21(0.04) |
| Apr. 19 2018 | 58227.13 | 48.74 | 18.16(0.15) | 19.20(0.26) | 17.16(0.14) | 15.44(0.06) | 14.96(0.04) | 14.29(0.05) |
| Apr. 24 2018 | 58232.54 | 54.15 | 18.46(0.10) | 19.18(0.14) | 17.64(0.11) | 15.64(0.04) | 15.15(0.03) | 14.38(0.03) |
| Apr. 30 2018 | 58238.74 | 60.35 | 18.80(0.11) | 19.38(0.14) | 17.82(0.11) | 16.00(0.05) | 15.34(0.03) | 14.44(0.03) |
| May 06 2018 | 58244.72 | 66.33 | 18.87(0.12) | 19.37(0.15) | 18.14(0.12) | 16.42(0.06) | 15.50(0.03) | 14.52(0.03) |
| May 12 2018 | 58250.25 | 71.86 | 18.79(0.11) | 19.67(0.17) | 18.31(0.13) | 16.65(0.07) | 15.61(0.03) | 14.62(0.04) |
| May 18 2018 | 58256.55 | 78.16 | 19.29(0.17) | 19.81(0.22) | 18.64(0.16) | 16.81(0.08) | 15.73(0.03) | 14.72(0.04) |
| May 24 2018 | 58262.92 | 84.53 | 19.24(0.19) | 20.02(0.26) | 18.64(0.17) | 17.20(0.11) | 15.93(0.04) | 14.82(0.04) |
| Jun. 01 2018 | 58270.16 | 91.77 | 19.41(0.18) | … | 18.23(0.18) | 17.28(0.10) | 16.16(0.03) | 14.97(0.04) |
| Jun. 09 2018 | 58278.51 | 100.12 | 19.75(0.24) | … | 18.92(0.21) | 17.60(0.12) | 16.23(0.04) | 15.08(0.04) |
| Jun. 13 2018 | 58282.26 | 103.87 | 19.36(0.18) | … | 19.36(0.18) | 17.84(0.11) | 16.44(0.04) | 15.21(0.04) |
| Jun. 19 2018 | 58288.23 | 109.84 | 19.84(0.28) | … | 18.92(0.35) | 18.31(0.14) | 16.74(0.04) | 15.35(0.04) |
| Jun. 25 2018 | 58294.34 | 115.95 | 19.89(0.29) | … | 19.24(0.30) | 18.26(0.18) | 16.78(0.12) | 15.61(0.05) |
aUncertainties (in parentheses) are .
bThe epoch is relative to the explosion date, MJD = 58178.39.
| Date (UT) | MJD | Epoch (d)a | Range (Å) | Disp. (Å pix-1) | Exp (s) | airmass | Telescope+Inst. |
|---|---|---|---|---|---|---|---|
| Mar. 02, 2018 | 58179.61 | 1.22 | 3500–8900 | 2.85 | 2100 | 1.64 | LJT+YFOSC |
| Mar. 04, 2018 | 58181.74 | 3.35 | 3500–8900 | 2.85 | 750 | 2.03 | LJT+YFOSC |
| Mar. 05, 2018 | 58182.74 | 4.35 | 3500–8900 | 2.85 | 2100 | 2.00 | LJT+YFOSC |
| Mar. 07, 2018 | 58184.69 | 6.30 | 3500–8900 | 2.85 | 1500 | 1.83 | LJT+YFOSC |
| Mar. 09, 2018 | 58186.52 | 8.13 | 3960–8820 | 2.78 | 2400 | 1.30 | XLT+BFOSC |
| Mar. 09, 2018 | 58186.71 | 8.32 | 3500–8900 | 2.85 | 1200 | 1.93 | LJT+YFOSC |
| Mar. 10, 2018 | 58187.57 | 9.18 | 3500–8900 | 2.85 | 1500 | 1.62 | LJT+YFOSC |
| Mar. 11, 2018 | 58188.68 | 10.29 | 3500–8900 | 2.85 | 1500 | 1.84 | LJT+YFOSC |
| Mar. 13, 2018 | 58190.47 | 12.08 | 3980–8830 | 2.78 | 2100 | 1.27 | XLT+BFOSC |
| Mar. 13, 2018 | 58190.62 | 12.23 | 3500–8900 | 2.85 | 1800 | 1.71 | LJT+YFOSC |
| Mar. 15, 2018 | 58192.68 | 14.29 | 3500–8900 | 2.85 | 1500 | 1.87 | LJT+YFOSC |
| Mar. 18, 2018 | 58195.74 | 17.35 | 3500–8900 | 2.85 | 1500 | 2.18 | LJT+YFOSC |
| Mar. 20, 2018 | 58197.68 | 19.29 | 3500–8900 | 2.85 | 1500 | 1.94 | LJT+YFOSC |
| Mar. 22, 2018 | 58199.53 | 21.14 | 3500–8900 | 2.85 | 1500 | 1.62 | LJT+YFOSC |
| Mar. 24, 2018 | 58201.47 | 23.08 | 3960–8820 | 2.78 | 2400 | 1.29 | XLT+BFOSC |
| Mar. 24, 2018 | 58201.71 | 23.32 | 3500–8900 | 2.85 | 1500 | 2.12 | LJT+YFOSC |
| Mar. 29, 2018 | 58206.67 | 28.28 | 3500-8900 | 2.85 | 1800 | 2.04 | LJT+YFOSC |
| Apr. 02, 2018 | 58210.69 | 32.30 | 3500–8900 | 2.85 | 1800 | 2.11 | LJT+YFOSC |
| Apr. 13, 2018 | 58221.63 | 43.24 | 3500–8900 | 2.85 | 1300 | 2.01 | LJT+YFOSC |
| Apr. 15, 2018 | 58223.53 | 45.14 | 3960–8820 | 2.78 | 2400 | 1.44 | XLT+BFOSC |
| Apr. 23, 2018 | 58231.50 | 53.11 | 3450–8780 | 2.78 | 2700 | 1.42 | XLT+BFOSC |
| Apr. 23, 2018 | 58231.68 | 53.29 | 3500–8900 | 2.85 | 1350 | 2.39 | LJT+YFOSC |
| Apr. 27, 2018 | 58235.54 | 57.15 | 3960–8820 | 2.78 | 2400 | 1.53 | XLT+BFOSC |
| Apr. 28, 2018 | 58236.51 | 58.12 | 3960–8820 | 2.78 | 2400 | 1.45 | XLT+BFOSC |
| May 08, 2018 | 58246.50 | 68.11 | 4090–8800 | 2.78 | 2700 | 1.50 | XLT+BFOSC |
| Aug. 30, 2018 | 58360.87 | 182.48 | 3500–8900 | 2.85 | 2100 | 1.96 | LJT+YFOSC |
| Oct. 15, 2018 | 58406.73 | 228.34 | 3500–8900 | 2.85 | 2100 | 2.00 | LJT+YFOSC |
| Oct. 30, 2018 | 58421.80 | 243.41 | 3980–8830 | 2.78 | 3000 | 1.27 | XLT+BFOSC |
| Nov. 04, 2018 | 58426.18 | 247.79 | 5280–9300 | 2.29 | 1800 | 1.91 | APO+DIS |
| Nov. 06, 2018 | 58428.71 | 250.32 | 3500–8900 | 2.85 | 2700 | 1.87 | LJT+YFOSC |
| Nov. 18, 2018 | 58440.86 | 262.47 | 3860–8680 | 2.78 | 3600 | 1.33 | XLT+BFOSC |
| Dec. 10, 2018 | 58462.40 | 284.01 | 5260–9400 | 2.30 | 1800 | 1.45 | APO+DIS |
| Dec. 17, 2018 | 58469.79 | 291.40 | 3970–8830 | 2.78 | 3600 | 1.34 | XLT+BFOSC |
| Nov. 01, 2019 | 58484.59 | 306.20 | 3850–8680 | 2.78 | 3600 | 1.28 | XLT+BFOSC |
| Jan. 10, 2019 | 58493.61 | 315.22 | 3500–8900 | 2.85 | 3000 | 1.68 | LJT+YFOSC |
| Feb. 02, 2019 | 58516.62 | 338.23 | 3500–8900 | 2.85 | 3600 | 1.68 | LJT+YFOSC |
| Apr. 04, 2019 | 58577.27 | 398.88 | 3110–10300 | 0.91 | 940 | 2.06 | Keck I+LRISb |
aThe epoch is relative to the explosion date, MJD = 58178.39.
bBlue and red sides combined; parameters listed are the average values.
| Date (UT) | MJD | Epoch (d)b | Mag | Observer |
|---|---|---|---|---|
| Mar. 01.54, 2018 | 58178.54 | 0.15 | 18.0 | Koichi Itagaki |
| Mar. 02.49, 2018 | 58179.49 | 1.10 | 17.8 | Koichi Itagaki |
| Mar. 03.49, 2018 | 58180.64 | 2.25 | 16.8 | Koichi Itagaki |
| Mar. 03.64 2018 | 58180.79 | 2.40 | 16.5 | Koichi Itagaki |
| Mar. 03.79, 2018 | 58180.94 | 2.55 | 16.6 | Koichi Itagaki |
| Mar. 04.53, 2018 | 58181.68 | 3.29 | 15.5 | Yuji Tanaka |
| Mar. 06.54, 2018 | 58183.69 | 5.30 | 14.2 | Yuji Tanaka |
| Mar. 06.71, 2018 | 58183.86 | 5.47 | 14.4 | Koichi Itagaki |
| Mar. 14.45, 2018 | 58191.60 | 13.21 | 13.6 | Yuji Tanaka |
awww.rochesterastronomy.org/sn2018/sn2018zd.html; uncertainties are mag, considering the translation between the clear band and the band.
bThe epoch is relative to the explosion date, MJD = 58178.39.