Inequity exemplified by underrepresented minority students receiving lower grades and having higher rates of attrition across STEM disciplines
Abstract
Underrepresented minority (URM) students are subjected to historically rooted inequities when pursuing an education, especially in STEM disciplines with little diversity. In order to make STEM education equitable and inclusive, evidence for how students from different racial/ethnic demographics are faring is necessary. We use 10 years of institutional data at a large public university to investigate trends in the majors that Asian, URM, and White students declare, drop after declaring, and earn degrees in as well as the GPA of the students who drop or earn a degree. We find that higher percentages of the URM students drop most majors compared to other students and these trends are particularly pronounced in physics and economics. Moreover, we find alarming GPA trends in that the URM students consistently earn lower grades than their Asian and White peers. Furthermore, in some STEM disciplines, the URM students who earn a degree are earning the same grades as the Asian and White students who dropped the major. This troubling trend may signify lack of sufficient support, mentoring, and guidance to ensure excellence of the URM students who are already severely disadvantaged. These quantitative findings call for making learning environments equitable and inclusive so that many URM students who come to college with severe disadvantages are appropriately supported and can excel similar to other students.
I Introduction and Theoretical Framework
Increasingly, Science, Technology, Engineering, and Mathematics (STEM) departments across the US are focusing on using evidence to improve the learning of all students, regardless of their background and making learning environments equitable and inclusive Parappilly et al. (2019); Johnson (2012); Johnson et al. (2017); Mayo et al. (2009); Metcalf et al. (2018); Molin et al. (2019); King (2016); Maltese and Tai (2011); Maltese and Cooper (2017); Means et al. (2018); Gregorcic and Haglund (2018); Borrego et al. (2008); Borrego and Bernhard (2011); Borrego and Henderson (2014); Johansson (2018); Henderson and Dancy (2008); Henderson et al. (2012); Dancy and Henderson (2010); Bossér and Lindahl (2019). However, racial/ethnic minority students are still severely underrepresented in many STEM disciplines National Science Board (2018)‘ In order to understand the successes and shortcomings of the current state of education, the use of institutional data to investigate past and current trends is crucial. In the past few decades, institutions have been keeping increasingly large digital databases of student records. We have now reached the point where there are sufficient data available at many institutions for robust statistical analyses using data analytics that can provide invaluable information for transforming learning environments and making them more equitable and inclusive for all students Baker and Inventado (2014); Papamitsiou and Economides (2014). Studies utilizing many years of institutional data can lead to analyses that were previously limited by statistical power. This is particularly true for studies of performance and persistence in STEM programs that rely on large sample sizes Ohland et al. (2008); Lord et al. (2009); Eris et al. (2010); Maltese and Tai (2011); Min et al. (2011); Lord et al. (2015); Ohland and Long (2016); Matz et al. (2017); Witherspoon and Schunn (2019); King (2016); Safavian (2019); Maltese and Cooper (2017); Means et al. (2018).
In this study, we use 10 years of institutional data from a large state-related research university to investigate how patterns of student major-declaration and subsequent degree-earning may differ by self-reported race/ethnicity. We will consider the two racial/ethnic groups that are over-represented in US Bachelor’s degree attainment National Science Board (2018), namely Asian and White students, separately from other students whom we call underrepresented minority (URM) students. The theoretical framework for this study has two main foundations: critical theory and expectancy value theory.
Critical theories, e.g., of race and gender, focus on historical sources of inequities within society, i.e., societal norms that perpetuate obstacles to the success of certain groups of disadvantaged people Gopalan and Nelson (2019); Crenshaw et al. (1995); Kellner (2003); Yosso (2005); Gutiérrez (2009); Taylor et al. (2009); Tolbert et al. (2018); Schenkel and Calabrese Barton (2020); Metcalf et al. (2018). Critical theory tells us that the dominant group in a society perpetuates these norms, which are born out of their interests, and pushes back against support systems that seek to subvert these norms Crenshaw et al. (1995); Kellner (2003); Yosso (2005). In our case, critical race theory provides a historical perspective on the much-studied racial/ethnic inequities in STEM. Much important work has been done that relates to critical theory of race and ethnicity in STEM education Ashby and Mensah (2020); Wong (2016); Bancroft (2018); Johnson et al. (2017); Solorzano et al. (2000); Lewis et al. (2009); Bang and Medin (2010); Ong et al. (2018); Tolbert et al. (2018); Green et al. (2019); Mutegi et al. (2019); Sheth (2019); Schenkel and Calabrese Barton (2020), e.g., pervasive stereotypes about who can and cannot succeed in STEM puts additional burden on URM students in STEM courses.
Expectancy value theory (EVT) is another framework that is central to our investigation and states that a student’s persistence and engagement in a discipline are related to their expectancy about their success as well as how the student values the task Eccles (Parsons); Eccles et al. (1990); Eccles (1994). In an academic context, “expectancy,” which refers to the individual’s beliefs about their success in the discipline, is closely related to Bandura’s construct of self-efficacy, defined as one’s belief in one’s capability to succeed at a particular task or subject Bandura (1991, 1994, 1997, 1999, 2001, 2005); Eccles (Parsons); Eccles et al. (1990); Eccles (1994).
There are four main factors that influence students’ expectancy or self-efficacy, namely vicarious experiences (e.g., instructors or peers as role models), social persuasion (e.g., explicit mentoring, guidance, and support), level of anxiety, and performance feedback (e.g., via grades on assessment tasks) Bandura (1991, 1994, 1997, 1999, 2001, 2005). URM students generally have lower self-efficacy than non-URM students in many STEM disciplines because these four factors negatively influence them Astin (1993); Cross (1993); Bianchini et al. (2002); Britner and Pajares (2006); Bianchini (2013); Basile and Lopez (2015); Hilts et al. (2018). For example, URM students are underrepresented in their classrooms across STEM, and less likely to have a role model they can relate to among the faculty National Science Board (2018). Further, the stereotypes surrounding URM students in many STEM disciplines can affect how they are treated by mentors, even if such an effect is subconscious Astin (1993); Cross (1993); Bianchini et al. (2002); Britner and Pajares (2006); Bianchini (2013); Basile and Lopez (2015); Hilts et al. (2018). Moreover, URM students are susceptible to stress and anxiety from stereotype threat (i.e., the fear of confirming stereotypes about URM students in many STEM disciplines) which is not experienced by their non-URM peers Astin (1993); Cross (1993); Bianchini et al. (2002); Britner and Pajares (2006); Bianchini (2013); Basile and Lopez (2015); Hilts et al. (2018). This stress and anxiety can rob them of their cognitive resources, especially during high-stakes assessments such as exams.
Expectancy can influence grades earned as well as the interest and likelihood to persist in a program Bandura (1991, 1994, 1997, 1999, 2001, 2005); Wan (2019). Stereotype threats that URM students in many STEM disciplines experience can increase anxiety in learning and test-taking situations and lead to deteriorated performance. Since anxiety can increase when performance deteriorates, these factors working against URM students in STEM can force them into a feedback loop and hinder their performance further, which can further lower their self-efficacy and can continue to affect future performance Bandura (1991, 1994, 1997, 1999, 2001, 2005); Wan (2019).
In EVT, value is typically defined as having four facets: intrinsic value (i.e., interest in the task), attainment value (i.e., the importance of the task for the student’s identity), utility value (i.e., the value of the task for future goals such as career), and cost (i.e., opportunity cost or psychological effects such as stress and anxiety) Eccles (Parsons); Eccles et al. (1990); Eccles (1994). In the context of URM students’ enrollment and persistence in many STEM disciplines, the societal stereotypes can influence all facets of the students’ value of these STEM disciplines. Intrinsic value can be informed by societal stereotypes surrounding the STEM disciplines, and attainment and utility values can be further tempered by these stereotypes. Utility value is an important facet of student education in STEM, since a degree in a STEM field provides many job opportunities for graduating students. In addition, the psychological cost of majoring in these disciplines can be inflated by the stereotype threat. All of these effects can conspire to suppress the likelihood of students choosing and/or persisting in various STEM disciplines Wan (2019).
In order to measure the long-term effects of these systemic disadvantages, we investigate the differences in attrition rates and choices of major of Asian, URM, and White students over the course of their studies at one large public research university using 10 years of institutional data. Since these disadvantages to students can be context-dependent, we will consider the attrition rates in many different STEM majors and non-STEM majors in order to understand the trends in each discipline.
I.1 Research Questions
Our research questions regarding the relationships between race/ethnicity and persistence in a degree are as follows.
-
RQ1.
How many students major in each discipline? How many Asian, URM, and White students major in each discipline?
-
RQ2.
Do rates of attrition from the various majors differ? Do rates of attrition from the various majors differ for Asian, URM, and White students?
-
RQ3.
Among those students who drop a given major, what degree, if any, do those students earn? How do these trends differ for Asian, URM, and White students?
-
RQ4.
What fraction of declared majors ultimately earn a degree in that major in each STEM subject area? How do these trends differ for Asian, URM, and White students?
-
RQ5.
What are the GPA trends over time among students who earn a degree in a given major and those who drop that major? How do these trends differ for Asian, URM, and White students?
II Methodology
II.1 Sample
Using the Carnegie classification system, the university at which this study was conducted is a public, high-research doctoral university, with balanced arts and sciences and professional schools, and a large, primarily residential undergraduate population that is full-time and reasonably selective with low transfer-in from other institutions Indiana University Center for Postsecondary Research (2018).
The university provided for analysis the de-identified institutional data records of students with Institutional Review Board approval. In this study, we examined these records for undergraduate students enrolled in two schools within the university: the School of Engineering and the School of Arts and Sciences. This sample of students includes all of those from ten cohorts who met several selection criteria, namely that the student had first enrolled at the university in a Fall semester from Fall 2005 to Fall 2014, inclusive, and the student had either graduated and earned a degree, or had not attended the university for at least a year as of Spring 2019. This sample of students is 49.8% female and had the following race/ethnicities: 77.8% White, 11.1% Asian, 6.9% Black, 2.5% Hispanic, and 1.8% other or multiracial.
II.2 Measures
II.2.1 Race/Ethnicity
The institutional data provided by the university included self-reported race/ethnicity of the students. Students were asked to indicate all of the following racial/ethnic groups with which they identified: American Indian/Alaskan, Asian, Black, Hawaiian/Pacific Islander, Hispanic, White, or Other. The researchers converted the student answers to this question into three categories for analysis, defined as follows.
-
•
“Asian”: Students who selected only Asian or only Asian and White.
-
•
“White”: Students who selected only White.
-
•
“URM”: Underrepresented minority students who selected any option(s) other than Asian or White.
A very small number of students chose not to answer this question, and were removed from analysis.
II.2.2 Academic Performance
Measures of student academic performance were also included in the provided data. High school GPA was provided by the university on a weighted scale from 0-5 that includes adjustments to the standard 0-4 scale for Advanced Placement and International Baccalaureate courses. The data also include the grade points earned by students in each course taken at the university. Grade points are on a 0-4 scale with , , , , , where the suffixes “” and “” add or subtract, respectively, grade points (e.g. ), with the exception of which is reported as the maximum 4 grade points. The courses were categorized as either STEM or non-STEM courses, with STEM courses being those courses taken from any of the following departments: biological sciences, chemistry, computer science, economics, any engineering department, geology and environmental science, mathematics, neuroscience, physics and astronomy, and statistics. We note that for the purposes of this paper, “STEM” does not include the social sciences other than economics, which has been included due to its mathematics-intensive content.
II.2.3 Declared Major and Degree Earned
For each student, the data include their declared major(s) in each semester as well as the major(s) in which they earned a degree, if any. The data were transformed into a set of binary flags for each semester, one flag for each possible STEM major as well as psychology and a general non-STEM category for all other majors. A similar set of flags was created for the degrees earned by students. From these flags, we tabulated a number of major-specific measures in each semester, including
-
•
current number of declared majors,
-
•
number of newly declared majors from the previous semester,
-
•
number of dropped majors from the previous semester,
-
•
number of retained majors from the previous semester.
The total number of unique students that ever declared or dropped a major were also computed. The subset of students that dropped each major were further investigated and the major in which they ultimately earned a degree, if any, was determined.
Throughout this paper we group the STEM majors into two clusters: chemistry, computer science, engineering, mathematics, and physics and astronomy; and biological sciences, economics, geology and environmental science, neuroscience, and statistics. When ordering majors (i.e., in figures and tables), the majors will be presented in the order they are listed in the previous sentence (first by group, then alphabetically within each group), followed by non-STEM and psychology. Further, we group the final three STEM majors (geology and environmental science, neuroscience, and statistics) into a category labeled “Other STEM” for figures and tables. Similarly, “engineering” groups together all engineering majors for departments in the School of Engineering at the studied university. These majors include chemical, computer, civil, electrical, environmental, industrial, and mechanical engineering as well as bioengineering and materials science.
Finally, we will make use of shortened labels for the majors in figures and tables. These shortened labels are defined in Table 1.
| Major | Short Label |
|---|---|
| Chemistry | Chem |
| Computer Science | CS |
| Engineering | Engr |
| Mathematics | Math |
| Physics and Astronomy | Phys |
| Biological Sciences | Bio |
| Economics | Econ |
| Geology and | Other STEM |
| Environmental Science | |
| Neuroscience | Other STEM |
| Statistics | Other STEM |
| Non-STEM | Non-STEM |
| Psychology | Psych |
II.2.4 Year of Study
Finally, the year in which the students took each course was calculated from the students’ starting term and the term in which the course was taken. Since the sample only includes students who started in fall semesters, each “year” contains courses taken in the fall and subsequent spring semesters, with courses taken over the summer omitted from this analysis. For example, if a student first enrolled in Fall 2007, then their “first year” occurred during Fall 2007 and Spring 2008, their “second year” during Fall 2008 and Spring 2009, and so on in that fashion. If a student is missing both a fall and spring semester during a given year but subsequently returns to the university, the numbering of those post-hiatus years is reduced accordingly. If instead a student is only missing one semester during a given year, no corrections are made to the year numbering.
II.3 Analysis
For each student, we calculate their grade point average (GPA) across courses taken in each year of study from their first to sixth years. In addition, we calculate the student’s STEM GPA in each year, that is, the GPA in STEM courses alone. The mean GPA as well as the standard error of the mean is computed for various groupings of students Freedman et al. (2007).
Further, proportions of students in various groups (i.e., grouped by major and/or demographic group) are calculated along with the standard error of a proportion Freedman et al. (2007). In particular, the proportions we report are
-
•
the proportion of students in each major that are Asian, URM, or White students,
-
•
the proportion of Asian, URM, and White students, respectively, that declare each subject as a major,
-
•
the proportion of declared majors that drop the major,
-
•
the proportion of those who drop each major that earn a degree in each other major, and
-
•
the proportion of all declared majors that ultimately earn a degree in that major.
III Results
III.1 Major Declaration Patterns
There are many angles with which we can approach RQ1 and investigate patterns of student major declaration. First, Fig. 1 shows the number of students that ever declared each major. This is done both overall (Fig. 1a) and for Asian students (1b), URM students (1c), and White students (1d) separately. These results provide an important context for the upcoming analyses that may be partially explained by the number of students in each major.
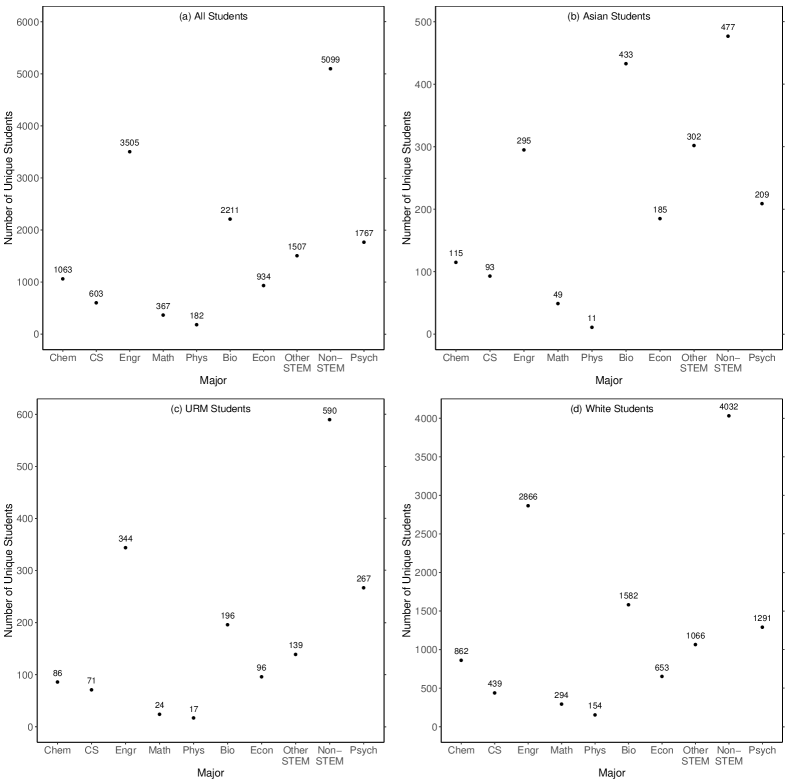
Figures 1b and 1c begin to hint at differences in enrollment patterns for the different racial/ethnic groups. URM and White students (Figs. 1c and 1d) have relatively similar patterns, with some small differences such as a slightly higher fraction of White students declaring engineering majors and a slightly higher fraction of URM students declaring psychology majors. Asian students show some trends that differ from both URM and White students, in particular a higher fraction of Asian students major in biological sciences, other STEM (i.e., geology and environmental science, neuroscience, and statistics), and economics. These patterns are explored further in Fig. 2 by standardizing the scales in two ways. In Fig. 2a, we consider the populations of each major separately and calculate the percentages of that population that consist of Asian, URM, or White students. This provides insight into what these students might be seeing in the classes for their major. The trends seen in Fig. 2a are largely dominated by the relative representation of Asian, URM, and White students in the university as a whole.
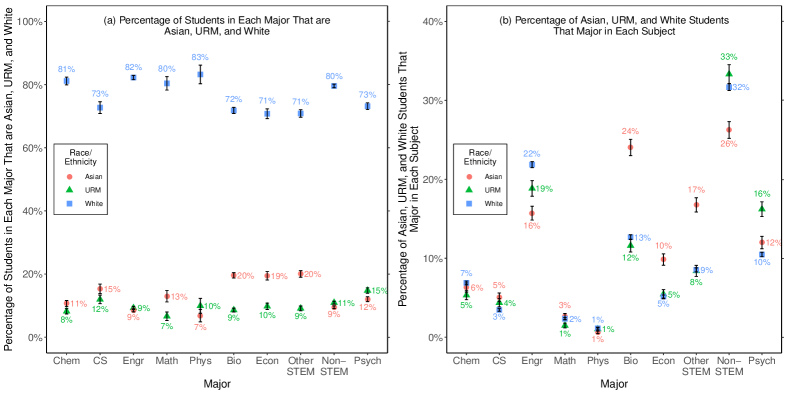
Another way to represent the population of these majors is to consider what percentage of all Asian, URM, or White students choose each major, as seen in Fig. 2b. While the main signal of this plot mimics those of Figs. 1b, 1c, and 1d, we can now see the differences noted earlier more clearly. For example, in Fig. 2b we can again see that the majors chosen by URM and White students are similar, with the exceptions of engineering (chosen by slightly more White students) and psychology (chosen by slightly more URM students). We can also see in Fig. 2b the differing trends for Asian students noted earlier, with Asian students more often choosing majors in biological sciences, economics, and the other STEM category, and now we can see that conversely Asian students are less likely than URM and White students to major in engineering and non-STEM.
Finally, another piece of information about enrollment patterns that is missing from Figs. 1 and 2 is when these students declare each major. Figure 3 shows, for each major, the average term in which students added the major as well as the peak term (that is, the term with the highest number of new students adding the major). As with Fig. 1, this is done separately for all students (Fig. 3a), Asian students (3b), URM students (3c), and White students (3d).
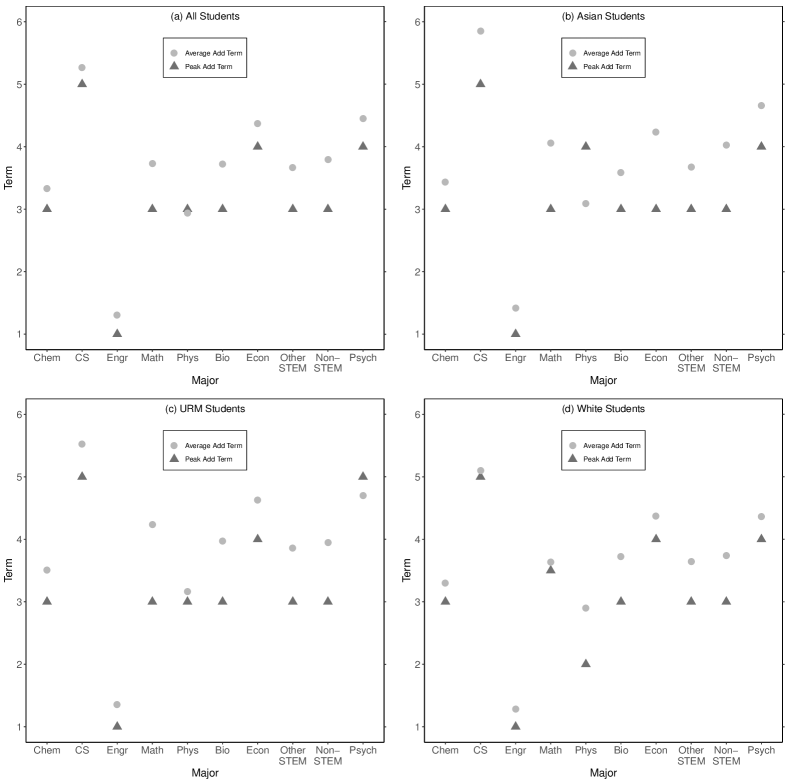
For the majority of majors in Fig. 3a, the peak of students adding the major is in the third term (that is, the start of their second year), with an average of three to four terms. Two majors, economics and psychology, depart slightly from this general trend, each with a peak in the fourth term and an average between fourth and fifth terms. Two other majors, computer science and engineering, depart more significantly from the general trend in ways that can be explained by their particular implementation at the studied university.
Engineering has a peak in the first term in Fig. 3a, with an average only slightly later. Engineering is the earliest major in our data, since all admitted students who enroll in the School of Engineering are considered “undeclared engineering” majors (they have not declared subdisciplines within engineering) and so the majority of engineering students are in the engineering program in their first term. Computer science instead has the latest peak term in Fig. 3a, namely in the fifth term with a slightly higher average. This is due to the structure of the computer science program at the studied university, which does not allow students to declare the major until they have completed five of the required courses for the major. These trends in engineering and computer science are important to keep in mind while considering the results presented elsewhere in this paper, since in computer science we are not able to capture attrition that occurs during the terms before a student officially declares a major. Conversely in engineering, we are able to capture almost all attrition in the first year due to the unique enrollment conditions of engineering students, which is also not possible for majors within the School of Arts and Sciences who choose majors at their convenience.
Turning then to Figs. 3b, 3c and 3d, we see almost identical trends as in Fig. 3. Broadly, the differences occur for majors in which two terms have similar numbers of students declaring that major. When considering a subset of all students, which of these two terms is the peak will sometimes shift.
A more detailed accounting of the number of students that enroll in each term for each major are reported in Tables 2 and 3 in Appendix A. Further, summaries of the total number of unique students as well as the peak term and number of concurrent students in each major, students adding each major, and students dropping each major are available in Tables 4, 5, 6, and 7 in Appendix B.
III.2 Attrition Rates
In order to answer RQ2, we further considered patterns of attrition rates by race/ethnicity. In Fig. 4, we consider the drop rates of students in each major or group of majors for all students (Fig. 4a), Asian students (Fig. 4b), URM students (Fig. 4c), and White students (Fig. 4d). Further, Figs. 4b, 4c, and 4d are combined into Fig. 4e, with the error bars omitted for clarity. In Fig. 4a, we see that computer science, non-STEM, and psychology students are the least likely to drop their major, while physics and mathematics students are the most likely to drop. We note that the relatively low drop rate of computer science majors could be due to the late declaration of the computer science major seen in Fig. 3. That is, attrition from computer science prior to when students are allowed to declare the major is not accounted for in Fig. 4.
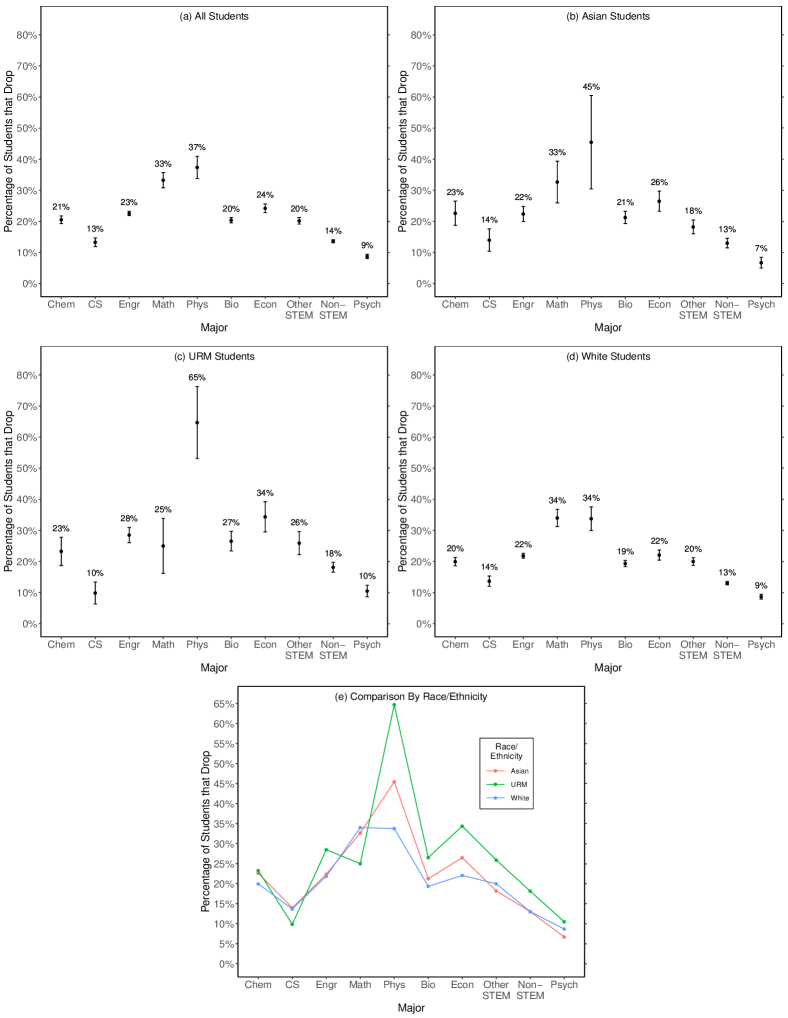
Though the patterns in each subset of students largely mimic the pattern overall in Fig. 4a, there are a few potential exceptions. Figure 4e draws attention to two majors that may have differential rates of attrition by race/ethnicity (namely, in physics and economics), though the size of the error bars in Figs. 4b, 4c, and 4d indicates that these differences may not be statistically significant. In both cases, URM students have the highest rate of attrition, followed by Asian students, and finally White students have the lowest rates of attrition.
In economics, the drop rates range from 34% of URM economics majors dropping the major (Fig. 4c) to 22% of White economics majors (Fig. 4d). These differences could prove to be meaningful as more data becomes available, but the large standard error prohibit strong conclusions from this data. Physics, despite having even larger standard error due to a small sample size, shows an even larger disparity between URM and White students. In particular, 65% of URM physics majors (Fig. 4c), 45% of Asian physics majors (Fig. 4b), and 34% of White physics majors (Fig. 4d) drop the major. While distinguishing between the drop rates of Asian students and other students is not possible given the standard errors, the particularly high drop rate of URM physics students relative to White students may be more meaningful.
III.3 Trajectories of Students After Dropping a Major
Knowing now how many students drop each major, we answer RQ3 by plotting where those dropped majors ended up in Fig. 5. In particular, the major indicated in the legends of Fig. 5a and 5b shows which major was dropped, while the plot shows which percentage of those who dropped that major ultimately earned a degree in each of the majors on the horizontal axis, including “no degree.” For example in Fig. 5a, we see that among the students that drop a physics major (indicated by the line color in the legend), roughly 15% of them end up earning a degree in mathematics (by looking at this line’s value above “Math” on the horizontal axis). We see that the two most common destinations for those who drop any major is either no degree or a degree in non-STEM, except for non-STEM majors who are most likely to earn no degree or a degree in psychology.
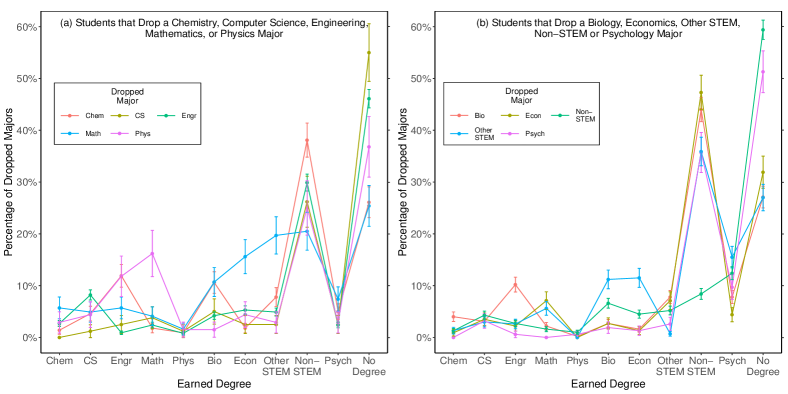
Apart from that main signal of dropped STEM majors later earning degrees in non-STEM or leaving the university without a degree, we see a few other interesting spikes. For instance, those who drop a physics major are likely to earn a degree in mathematics (Fig. 5a) and those who drop chemistry and physics (Fig. 5a) as well as biological science (Fig. 5b) are likely to earn engineering degrees. Further, those who drop from the “other STEM” category (geology and environmental science, neuroscience, and statistics) are likely to major in economics and biology (Fig. 5b). While all students who drop any major are very likely to earn no degree, the percentage of dropped majors in this category exceeds 50% for computer science (Fig. 5a), non-STEM, and psychology.
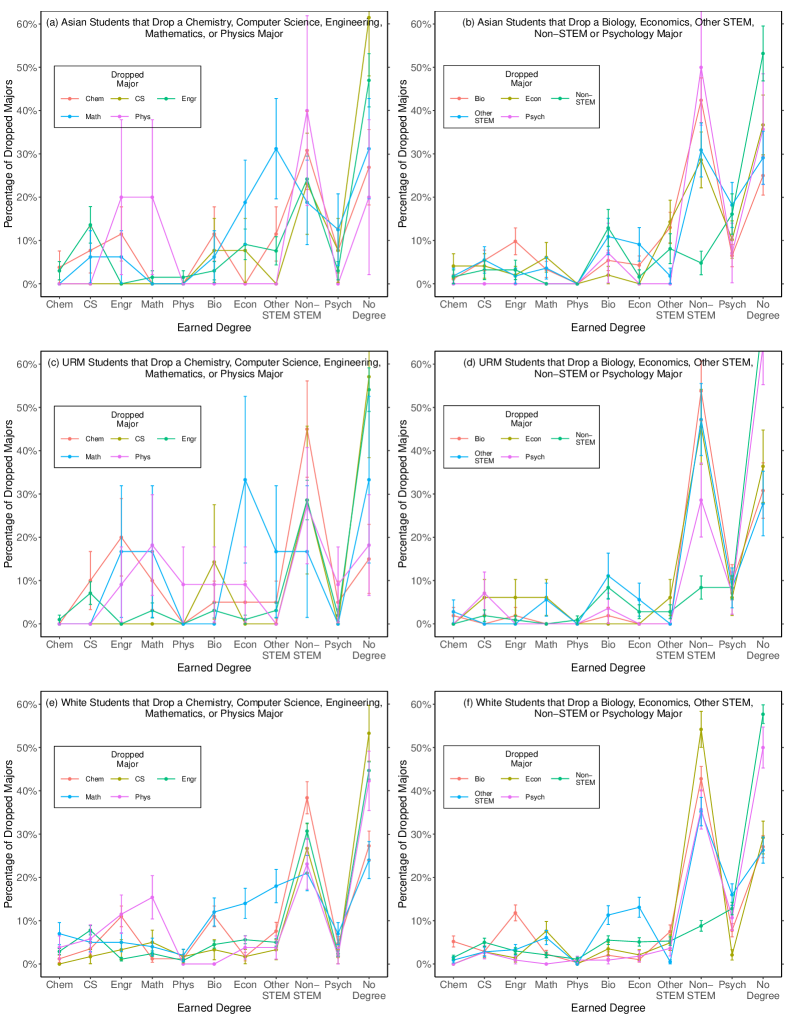
In order to further answer RQ3, Fig. 6 plots these same proportions of degrees earned by students who drop a major separately for Asian students (Figs. 6a and 6b), URM students (Figs. 6c and 6d), and White students (Figs. 6e and 6f). We see for the most part very similar patterns between Asian, URM, and White students, with a few notable differences. For example, among students who drop a biology major, we see that roughly 10-12% of the Asian students (Fig. 6b) and White students (Fig. 6f) go on the earn a degree in engineering, compared with roughly 2% of URM students (Fig. 6d). We see a similar pattern among students who drop a chemistry major, with roughly 10% of the Asian and White students subsequently earning a degree in biology (Figs. 6a and 6e) compared with roughly 5% of URM students (Fig. 6c).
III.4 Degree-Earning Rates
In order to answer RQ4, we investigated how many students successfully earn a degree in each major. Figure 7a shows these degree-earning rates for all students in each major, while Fig. 7b shows these rates for Asian students, Fig. 7c for URM students, and Fig. 7d for White students. While these are broadly similar to an inverse of the drop rates in Fig. 4, since some students drop a major and subsequently declare the same major again, these degree-earning rates are a more direct measurement of persistence in a major.
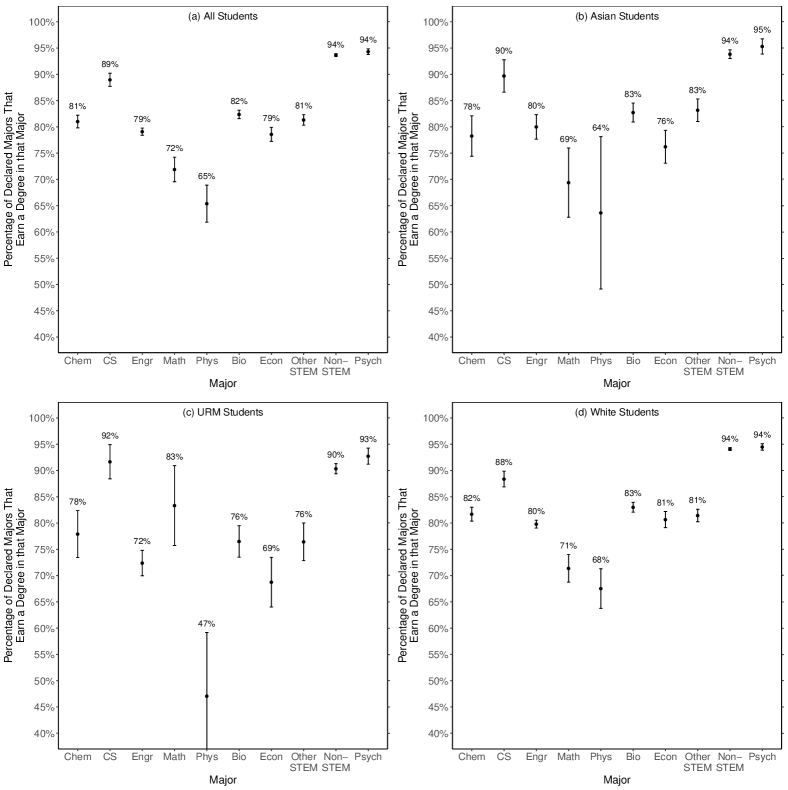
Looking first at the overall rates in Fig. 7a, there are fairly wide differences across majors, from the lowest rate in physics of about 65% to the highest in psychology and non-STEM, each at about 94%. The highest degree-earning rate in STEM occurs in computer science, with about 89% of declared computer science majors completing the degree requirements. As in Fig. 4, this can be at least partially explained by the requirements prior to declaring the major, which causes only students who have already progressed through a significant portion of the computer science curriculum to have declared a computer science major.
Considering then the differences among the different racial/ethnic groups, we see relatively few differences in these degree-earning rates. As in Fig. 4, the largest difference seen here appears to be in physics, with 68% of White physics majors earning a physics degree (Fig. 7d) compared to only 47% of URM physics majors (Fig. 7c), with Asian students very similar to White students with 64% earning a physics degree (Fig. 7b), albeit with large standard error driven by the low sample size in physics shown in Fig. 1. Similarly, White (Fig. 7d) and Asian students (Fig. 7b) are more likely to complete a degree in economics than URM students (Fig. 7c), but again the size of the standard error prevents any conclusive statements about this difference.
Across all of Fig. 7, we note that since we have combined many majors for the “non-STEM” category, this is only a measure of the number of non-STEM majors who successfully earn a degree in any non-STEM major. That is, a student who drops one non-STEM major but earns a degree in a different non-STEM major will still be counted as having successfully earned a non-STEM degree. The same is true for the “other STEM” and “engineering” categories which also combine several majors. The high “success rates” of computer science and psychology may be due in part to the structure of their program encouraging students to declare slightly later than other disciplines, and so this measure may not be capturing attrition that happens prior to an official declaration of major (e.g., a student intending to major in a discipline decides against it before ever declaring that major). On the other hand, since all students enrolled in the engineering school are considered “undeclared engineering,” major, the relatively low degree-earning rate of engineering reflects attrition even from the first to the second term, which is not captured for many other majors in which most students have not yet formally declared a major in their first term. Thus, each reported degree-earning rate here is a ceiling on the true rate that would include those students who intend to major but never declare.
III.5 Mean GPA of Degree-Earners vs. Major-Droppers
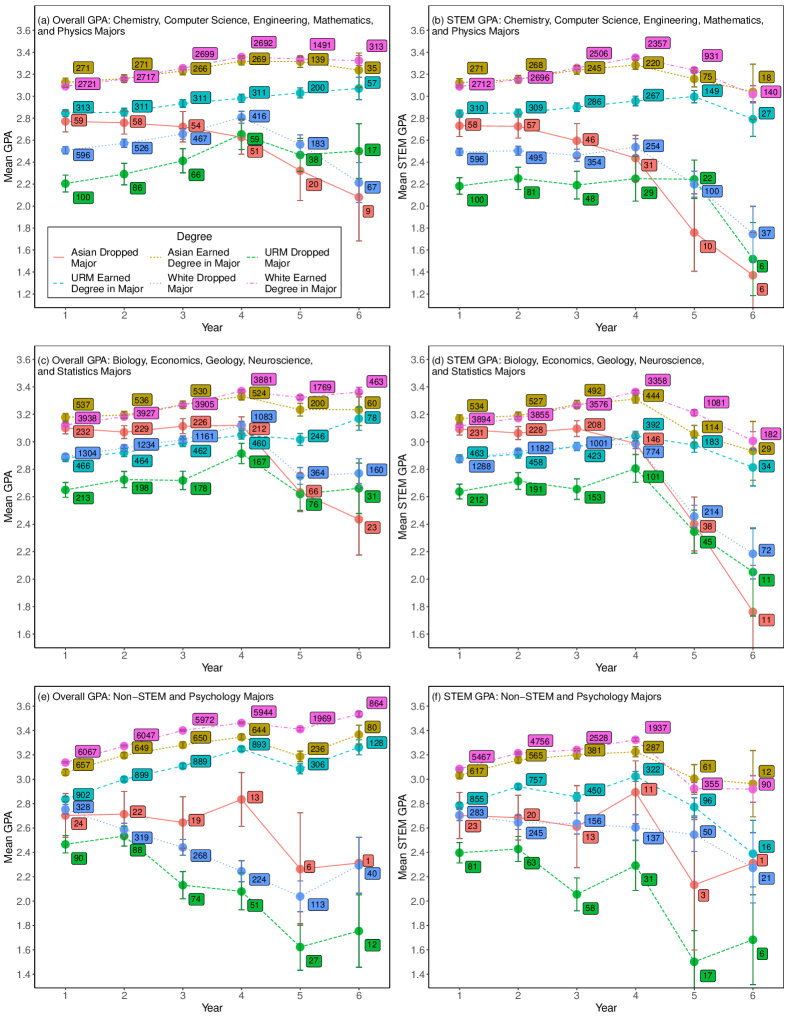
In order to further our understanding of why students may have dropped a given major and answer RQ5, Fig. 8 plots the mean GPA of students who declared different sets of majors and then either earned a degree within that set of majors or dropped those majors. Note that students who dropped a major could have gone on to earn a degree with a different major or left the university without a degree. Both overall GPA (Figs. 8a, 8c, and 8e) and STEM GPA (Figs. 8b, 8d, and 8f) are plotted. Across all of Fig. 8, the large drop in sample size from year four to five and again from five to six is primarily due to students graduating.
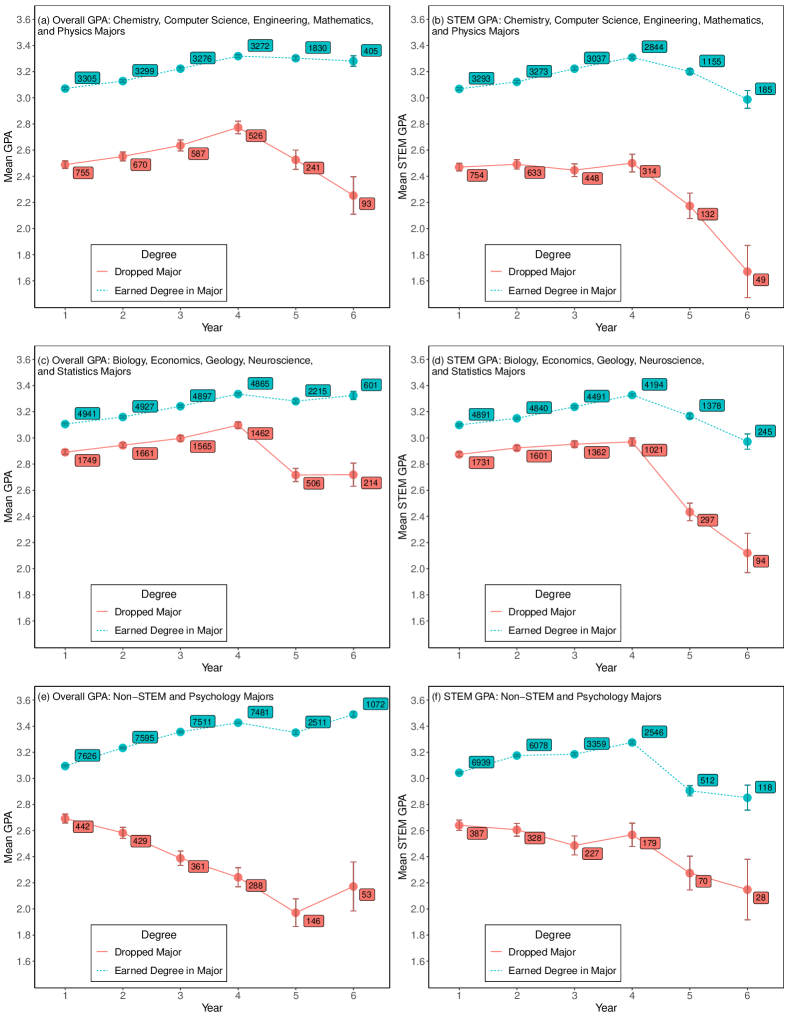
We observe that in general, the students who drop that major have a lower GPA and STEM GPA than students who earned a degree in that major. However, the difference between the two groups varies based on which cluster of majors we consider. For chemistry, computer science, engineering, mathematics, and physics and astronomy majors (Figs. 8a and 8b), those that earned a degree in this set of majors have a GPA of roughly 0.6 grade points higher than those that dropped. This is consistent through the first four years of study, and similar between overall GPA and STEM GPA. This difference in grade points represents a difference of one to two letter grades at the studied university, where, for example, the difference between a B and B is 0.25 grade points and between a B and A is 0.5 grade points. Further, the number of students dropping from this set of majors is roughly 19% of the total.
For biological science, economics, geology and environmental science, neuroscience, and statistics majors (Fig. 8c and 8d), those that earned a degree in this set of majors have a GPA of roughly 0.2 grade points higher than those that dropped, with roughly 26% of majors dropping. As with the first set of majors, this is consistent between overall GPA and STEM GPA, and across the first four years of study.
Finally, for non-STEM majors including psychology (Fig. 8e and 8f), the overall GPA disparity widens over time from roughly 0.4 grade points in the first year to roughly 1.2 grade points in the fourth year, while in STEM courses the GPA disparity rises from roughly 0.4 grade points in the first year to roughly 0.7 grade points in the fourth year. Notably, a much smaller fraction of students are dropping from this set – about 5% of the total number of students – which could be due in part to the wide net of considering all non-STEM majors.
We further consider the same measures separately for URM and non-URM (i.e., Asian and White) students in Fig. 9. In this case, Asian and White students have been combined to improve clarity in the figure since there were few differences between these two groups when considering them separately. A version of Fig. 9 that separately plots Asian and White students can be seen in Fig. 10 in Appendix D.
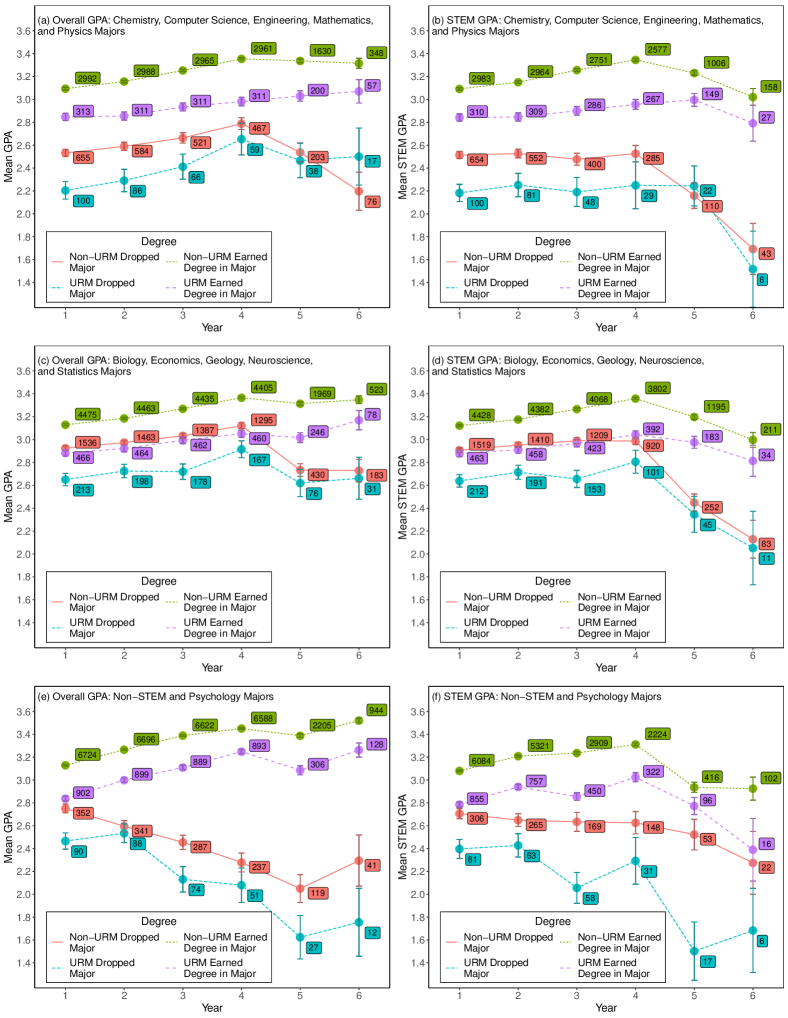
Figure 9 has the same subfigure structure as Fig. 8. That is, overall GPA is plotted in Figs. 9a, 9c, and 9e and STEM GPA in Figs. 9b, 9d, and 9f. And students belonging to different clusters of majors are considered separately: chemistry, computer science, engineering, mathematics, and physics and astronomy majors are included in Figs. 9a and 9b; biological science, economics, geology and environmental science, neuroscience, and statistics majors in Figs. 9c and 9d; and non-STEM and psychology majors in Figs. 9e and 9f.
In all cases, the main finding is that URM students are earning lower grades on average than non-URM students, both among those who drop a given major and those who earn a degree in that major. The degree of this disparity differs by which majors we consider, but among STEM majors it appears relatively similar whether we consider overall GPA (Figs. 9a and 9c) or STEM GPA (Figs. 9b and 9d). In particular, among chemistry, computer science, engineering, mathematics, and physics and astronomy majors, URM students who earn a degree have a GPA (Fig. 9a) and STEM GPA (Fig. 9b) roughly 0.3 grade points lower on average than non-URM students who earn a degree. Among the same majors but considering now students who drop the major, URM students again have roughly 0.3 grade points lower than non-URM students in overall (Fig. 9a) and STEM GPA (Fig. 9b), with the gap in overall GPA (Fig. 9a) somewhat closing by the fourth year.
There is a similar trend among biological sciences, economics, geology, neuroscience, and statistics majors (Figs. 9c and 9d), with URM students having roughly 0.2-0.3 grade points lower than non-URM students, among those students who earn a degree in those majors and those who drop these majors. Similarly among non-STEM majors including psychology, there is an 0.3-0.4 grade point difference between URM and non-URM students in overall GPA (Fig. 9e) and STEM GPA (Fig. 9f).
IV Discussion
In this section, we first discuss general trends and then follow up with a discussion of race/ethnicity differences.
IV.1 General Enrollment Patterns
Despite large differences in the number of students enrolling in different STEM disciplines at the studied university (Fig. 1a), there are broadly similar patterns of when those students declare the major (Fig. 3a), with some exceptions (i.e., engineering and computer science due to the constraints on when a student can declare a major). However, there are notable differences in the attrition of students from the different majors (Fig. 4a), and the corresponding degree-earning rates (Fig. 7a). Notably, a few STEM disciplines stand out as having particularly high rates of attrition (or low rates of degree completion for students who declared those majors),e.g., mathematics and physics. This is consistent with a study by Leslie et al. which identifies mathematics and physics as the two STEM disciplines with the highest “ability belief” (i.e., emphasis on brilliance) Leslie et al. (2015). This trend of high attrition rates is particularly problematic for mathematics and physics, since these disciplines recruit very few students in the first place (Fig. 1). Moreover, mathematics and physics are also two disciplines with deeply hierarchical knowledge structures, which could influence student decision making, e.g., whether to leave the discipline after unsatisfactory experiences in earlier courses.
IV.2 Enrollment Patterns by Race/Ethnicity
The most notable example of race/ethnicity differences in enrollment patterns observed in our analysis is in Fig. 2. We observe that in biological science, geological and environmental science, neuroscience, and economics, Asian students enroll at a higher rate than URM or White students. This trend is hinted at in Fig. 2a, but made clear in Fig. 2b where we see that a substantially higher percentage of Asian students choose these majors relative to URM and White students. Correspondingly, a lower percentage of Asian students choose non-STEM majors than URM and White students, and similarly fewer Asian students choose engineering majors. There are also small differences in just a few other disciplines, such as more URM students majoring in psychology and more White students majoring in engineering relative to their peers.
Apart from these differences, enrollment in the majority of majors is balanced compared to the population as a whole. This is good since it means that race/ethnicity are not playing a large role in the students’ choices of major. However, it is not an equitable situation since URM students are still not being properly represented in classrooms. In particular, for URM students, the inequities often present in opportunities for college preparation and admissions are still present in the classrooms, but they are not worsened by the students’ choices of major.
Moreover, we see no notable differences by race/ethnicity in when the students declare these majors (Fig. 3). Though the term in which the peak number of students add the major may shift, the average term of adding the major is consistent among Asian, URM, and White students.
IV.3 Attrition and Degree-Earning Rates
The primary difference in enrollment patterns found is in the attrition rates of students (Fig. 4) and correspondingly the degree-earning rates (Fig. 7). Though most majors have relatively similar drop rates and degree-earning rates among Asian, URM, and White students, a very notable exception is physics. Figure 4c shows that 65% of URM students who declare a physics major ultimately drop that major, which does not even include those students who decided to change their path before officially declaring a physics major. This is compared to 45% of Asian physics majors (4b) and 34% of White physics majors (4d) dropping the major. This is especially problematic for physics, which recruits very few students to begin with (Fig. 1), especially among Asian (Fig. 1b) and URM students (Fig. 1c). The fact that almost two-thirds of URM students drop the physics major compared to only roughly one-third of White students may be a sign of a lack of appropriate support for students and an inequitable learning environment. Further, this is consistent with prior research showing that underserved students in the sciences are especially vulnerable to stereotype threat Astin (1993); Cross (1993); Bianchini et al. (2002); Britner and Pajares (2006); Bianchini (2013); Basile and Lopez (2015); Hilts et al. (2018), especially in physics which is perceived as a field that requires a high innate “brilliance” to succeed Leslie et al. (2015).
Though no other disciplines show the same degree of racial/ethnic differences in attrition rates, Fig. 4e shows that with the exception of computer science and mathematics, URM students have slightly higher attrition rates from every major. This is a deeply troubling trend, since it runs counter to the somewhat hopeful situation noted in the balanced declarations of major (at least with regard to race/ethnicity) seen in Fig. 2. Thus, although they initially have similar aspirations as their overrepresented peers, URM students in general, including both STEM and non-STEM discplines, are being forced to change their academic plans at higher rates than Asian and White students.
Though we had hoped to be able to shed some more light on what happens to the students who drop each major, the low sample size in Fig. 6 prevents any notable conclusions. This aspect of student attrition from various majors can be revisited as more data becomes available.
IV.4 Racial/Ethnic GPA Differences
We find pervasive and troubling trends in the overall GPA and STEM GPA of STEM majors. We find in Figs. 9a and 9b that among students who major in chemistry, computer science, engineering, mathematics, and physics, URM students consistently earn lower grades than their non-URM peers. This is true both among students that persist in their degree attainment and those that drop the major. This is problematic since these URM students are already forced to contend with stereotypes that pressure them away from STEM, and given the intricate relationship between students’ expectancy or self-efficacy and academic performance Britner and Pajares (2006); Zimmerman (2000); Pintrich (2003); Bandura (1991, 1994, 1997, 1999, 2001, 2005), the feedback that these students obtain only compounds the existing societal pressures working against them and widens the racial/ethnic gap further.
Moreover, among students in the remaining STEM majors (biological sciences, economics, geology and environmental science, neuroscience, and statistics; Figs. 9c and 9d), the URM students who persist and earn a degree earn on average the same grades as the Asian and White students who drop the major. The reason for these troubling trends must be investigated further because they may signify lack of sufficient support, mentoring, and guidance to ensure excellence of the URM students who are already severely disadvantaged.
Students must constantly make decisions about their academic future, and Expectancy Value Theory states that students’ performance is influenced by societal stereotypes, made worse by a non-inclusive classroom learning environment in which they are underrepresented as well as previous performance feedback received. Many of these students, who come into college with a somewhat weaker preparation than their peers through no fault of their own but due to historical disadvantages, must then face these extreme pressures against their success in various STEM fields. It is critical that universities make concerted efforts to mentor and support all of their students, and improve the learning environment of these STEM disciplines to counteract the historically-rooted culture and stereotypes surrounding STEM that unfairly disadvantage URM students.
IV.5 Limitations and Implications
One limitation of this study is the fields with the most consistent racial/ethnic differences, particularly physics, also have the lowest number of students which limits statistical power. Also, this study limits its considerations to race/ethnicity. Other studies with larger data sets could investigate how other underserved populations such as women, first-generation college students, or low-income students may be disadvantaged in STEM.
A critically important extension of this work would be for other institutions of different types and sizes to do similar analyses in order to broaden the wealth of knowledge available and continue to work towards the goal of equitable and inclusive education. Other institutions noting similar problematic trends can help pinpoint common sources of inequities, while institutions that do not observe these trends may be able to identify how they have structured their programs to avoid these inequitable trends. Studies such as this can thus provide a framework for other institutions to perform similar analyses, and for particular departments to understand how their own trends differ from those of other departments at their own university.
Focus on increasing equity and inclusion in learning is especially important in the early courses for these STEM majors, since they are fraught with problematic racial/ethnic differences and may be a significant source of URM students dropping the majors. All STEM instructors should consider how they are supporting their students throughout the curriculum, since even among those that did not show differences in attrition rates we still see problematic GPA differences between URM and non-URM students. All of these issues should be addressed since they are critical for improving equity and inclusion in higher education STEM learning environments.
Acknowledgements.
This research is supported by the National Science Foundation Grant DUE-1524575 and the Sloan Foundation Grant G-2018-11183.References
- Parappilly et al. (2019) M. Parappilly, R. J. Woodman, and S. Randhawa, Research in Science Education , 1 (2019).
- Johnson (2012) A. Johnson, Science Education 96, 960 (2012).
- Johnson et al. (2017) A. Johnson, M. Ong, L. T. Ko, J. Smith, and A. Hodari, The Physics Teacher 55, 356 (2017).
- Mayo et al. (2009) A. Mayo, M. D. Sharma, and D. A. Muller, Research in Science Education 39, 477 (2009).
- Metcalf et al. (2018) H. Metcalf, D. Russell, and C. Hill, American Behavioral Scientist 62, 580 (2018), https://doi.org/10.1177/0002764218768872 .
- Molin et al. (2019) F. Molin, S. Cabus, C. Haelermans, and W. Groot, Research in Science Education , 1 (2019).
- King (2016) B. King, AERA Open 2, 1 (2016), https://doi.org/10.1177/2332858416669709 .
- Maltese and Tai (2011) A. V. Maltese and R. H. Tai, Science Education 95, 877 (2011).
- Maltese and Cooper (2017) A. V. Maltese and C. S. Cooper, AERA Open 3, 1 (2017), https://doi.org/10.1177/2332858417727276 .
- Means et al. (2018) B. Means, H. Wang, X. Wei, E. Iwatani, and V. Peters, AERA Open 4, 1 (2018), https://doi.org/10.1177/2332858418806305 .
- Gregorcic and Haglund (2018) B. Gregorcic and J. Haglund, Research in Science Education , 1 (2018).
- Borrego et al. (2008) M. Borrego, R. A. Streveler, R. L. Miller, and K. A. Smith, Journal of Engineering Education 97, 147 (2008).
- Borrego and Bernhard (2011) M. Borrego and J. Bernhard, Journal of Engineering Education 100, 14 (2011).
- Borrego and Henderson (2014) M. Borrego and C. Henderson, Journal of Engineering Education 103, 220 (2014).
- Johansson (2018) A. Johansson, Research in Science Education , 1 (2018).
- Henderson and Dancy (2008) C. Henderson and M. H. Dancy, American Journal of Physics 76, 79 (2008).
- Henderson et al. (2012) C. Henderson, M. Dancy, and M. Niewiadomska-Bugaj, Phys. Rev. ST Phys. Educ. Res. 8, 020104 (2012).
- Dancy and Henderson (2010) M. Dancy and C. Henderson, American Journal of Physics 78, 1056 (2010).
- Bossér and Lindahl (2019) U. Bossér and M. Lindahl, Research in Science Education 49, 371 (2019).
- National Science Board (2018) National Science Board, Science and Engineering Indicators 2018, NSB-2018-1 (National Science Foundation, Alexandria, VA, 2018) available at https://www.nsf.gov/statistics/indicators/.
- Baker and Inventado (2014) R. S. Baker and P. S. Inventado, in Learning Analytics (Springer, 2014) pp. 61–75.
- Papamitsiou and Economides (2014) Z. Papamitsiou and A. A. Economides, Journal of Educational Technology & Society 17, 49 (2014).
- Ohland et al. (2008) M. W. Ohland, S. D. Sheppard, G. Lichtenstein, O. Eris, D. Chachra, and R. A. Layton, Journal of Engineering Education 97, 259 (2008).
- Lord et al. (2009) S. M. Lord, M. M. Camacho, R. A. Layton, R. A. Long, M. W. Ohland, and M. H. Wasburn, Journal of Women and Minorities in Science and Engineering 15, 167 (2009).
- Eris et al. (2010) O. Eris, D. Chachra, H. L. Chen, S. Sheppard, L. Ludlow, C. Rosca, T. Bailey, and G. Toye, Journal of Engineering Education 99, 371 (2010).
- Min et al. (2011) Y. Min, G. Zhang, R. A. Long, T. J. Anderson, and M. W. Ohland, Journal of Engineering Education 100, 349 (2011).
- Lord et al. (2015) S. M. Lord, R. A. Layton, and M. W. Ohland, IEEE Transactions on Education 58, 141 (2015).
- Ohland and Long (2016) M. W. Ohland and R. A. Long, Advances in Engineering Education 5, 1 (2016).
- Matz et al. (2017) R. L. Matz, B. P. Koester, S. Fiorini, G. Grom, L. Shepard, C. G. Stangor, B. Weiner, and T. A. McKay, AERA Open 3, 1 (2017).
- Witherspoon and Schunn (2019) E. B. Witherspoon and C. D. Schunn, Science Education 104, 144 (2019).
- Safavian (2019) N. Safavian, AERA Open 5, 1 (2019), https://doi.org/10.1177/2332858419869342 .
- Gopalan and Nelson (2019) M. Gopalan and A. A. Nelson, AERA Open 5, 1 (2019), https://doi.org/10.1177/2332858419844613 .
- Crenshaw et al. (1995) K. Crenshaw, N. Gotanda, G. Peller, and K. Thomas, Critical Race Theory: The Key Writings that Formed the Movement (The New Press, 1995).
- Kellner (2003) D. Kellner, Democracy & Nature 9, 51 (2003).
- Yosso (2005) T. J. Yosso, Race Ethnicity and Education 8, 69 (2005).
- Gutiérrez (2009) R. Gutiérrez, Teaching for Excellence and Equity in Mathematics 1, 4 (2009).
- Taylor et al. (2009) E. Taylor, D. Gillborn, and G. Ladson-Billings, Foundations of critical race theory in education (Routledge, 2009).
- Tolbert et al. (2018) S. Tolbert, A. Schindel, and A. J. Rodriguez, Science Education 102, 796 (2018).
- Schenkel and Calabrese Barton (2020) K. Schenkel and A. Calabrese Barton, Science Education (2020).
- Ashby and Mensah (2020) P. Ashby and F. M. Mensah, Research in Science Education 50, 303 (2020).
- Wong (2016) B. Wong, Research in Science Education 46, 113 (2016).
- Bancroft (2018) S. F. Bancroft, Science Education 102, 1319 (2018).
- Solorzano et al. (2000) D. Solorzano, M. Ceja, and T. Yosso, Journal of Negro Education 69, 60 (2000).
- Lewis et al. (2009) J. L. Lewis, H. Menzies, E. I. Nájera, and R. N. Page, Science Education 93, 961 (2009).
- Bang and Medin (2010) M. Bang and D. Medin, Science Education 94, 1008 (2010).
- Ong et al. (2018) M. Ong, J. M. Smith, and L. T. Ko, Journal of Research in Science Teaching 55, 206 (2018).
- Green et al. (2019) A. M. Green, B. R. Brand, and G. E. Glasson, Science Education 103, 241 (2019).
- Mutegi et al. (2019) J. W. Mutegi, B. Sorge, G. A. Fore, and G. S. Gibau, Science Education 103, 1456 (2019).
- Sheth (2019) M. J. Sheth, Science Education 103, 37 (2019).
- Eccles (Parsons) J. Eccles (Parsons), T. Adler, and J. Meece, Journal of Personality and Social Psychology 46, 26 (1984).
- Eccles et al. (1990) J. S. Eccles, J. E. Jacobs, and R. D. Harold, Journal of Social Issues 46, 183 (1990).
- Eccles (1994) J. S. Eccles, Psychology of Women Quarterly 18, 585 (1994).
- Bandura (1991) A. Bandura, Organizational Behavior and Human Decision Processes 50, 248 (1991).
- Bandura (1994) A. Bandura, in Encyclopedia of Psychology, Vol. 3, edited by R. J. Corsini (Wiley, 1994) pp. 368–369.
- Bandura (1997) A. Bandura, Self-efficacy: The Exercise of Control (Macmillan, 1997).
- Bandura (1999) A. Bandura, in Handbook of Personality, Vol. 2, edited by L. A. Pervin and O. P. John (Oxford University Press, 1999) pp. 154–196.
- Bandura (2001) A. Bandura, Annual Review of Psychology 52, 1 (2001).
- Bandura (2005) A. Bandura, in Great Minds in Management, edited by K. G. Smith and M. A. Hitt (Oxford University Press, 2005) pp. 9–35.
- Astin (1993) A. W. Astin, What Matters in College, Vol. 9 (Jossey-Bass, 1993).
- Cross (1993) K. P. Cross, Journal of Engineering Education 82, 9 (1993).
- Bianchini et al. (2002) J. A. Bianchini, D. J. Whitney, T. D. Breton, and B. A. Hilton-Brown, Science Education 86, 42 (2002).
- Britner and Pajares (2006) S. L. Britner and F. Pajares, Journal of Research in Science Teaching: The Official Journal of the National Association for Research in Science Teaching 43, 485 (2006).
- Bianchini (2013) J. A. Bianchini, Science Education 97, 163 (2013).
- Basile and Lopez (2015) V. Basile and E. Lopez, Science Education 99, 519 (2015).
- Hilts et al. (2018) A. Hilts, R. Part, and M. L. Bernacki, Science Education 102, 744 (2018).
- Wan (2019) Z. H. Wan, Research in Science Education , 1 (2019).
- Indiana University Center for Postsecondary Research (2018) Indiana University Center for Postsecondary Research, The Carnegie Classification of Institutions of Higher Education, Tech. Rep. (Indiana University Center for Postsecondary Research, Bloomington, IN, 2018).
- Freedman et al. (2007) D. Freedman, R. Pisani, and R. Purves, Statistics, 4th ed. (W. W. Norton & Co., 2007).
- R Core Team (2019) R Core Team, R: A Language and Environment for Statistical Computing, R Foundation for Statistical Computing, Vienna, Austria (2019).
- Wickham (2017) H. Wickham, tidyverse: Easily Install and Load the ‘tidyverse’ (2017), R package version 1.2.1.
- Leslie et al. (2015) S.-J. Leslie, A. Cimpian, M. Meyer, and E. Freeland, Science 347, 262 (2015).
- Zimmerman (2000) B. J. Zimmerman, Contemporary Educational Psychology 25, 82 (2000).
- Pintrich (2003) P. R. Pintrich, Journal of Educational Psychology 95, 667 (2003).
Appendix A Appendix A: Number of Current Majors and those who Added or Dropped each Major by Term
(a) Chemistry,
| Term | Number of Majors [% of ] | ||
|---|---|---|---|
| Current | Added | Dropped | |
| 1 | 13 [1.2] | 13 [1.2] | 1 [0.1] |
| 2 | 99 [9.3] | 86 [8.1] | 1 [0.1] |
| 3 | 800 [75.3] | 706 [66.4] | 10 [0.9] |
| 4 | 890 [83.7] | 147 [13.8] | 59 [5.6] |
| 5 | 919 [86.5] | 70 [6.6] | 42 [4.0] |
| 6 | 904 [85.0] | 23 [2.2] | 39 [3.7] |
| 7 | 887 [83.4] | 13 [1.2] | 25 [2.4] |
| 8 | 861 [81.0] | 1 [0.1] | 15 [1.4] |
| 9 | 403 [37.9] | 6 [0.6] | 10 [0.9] |
| 10 | 157 [14.8] | 1 [0.1] | 7 [0.7] |
| 11 | 30 [2.8] | 0 [0.0] | 5 [0.5] |
| 12 | 14 [1.3] | 1 [0.1] | 4 [0.4] |
(c) Engineering,
| Term | Number of Majors [% of ] | ||
|---|---|---|---|
| Current | Added | Dropped | |
| 1 | 3164 [90.3] | 3164 [90.3] | 46 [1.3] |
| 2 | 2919 [83.3] | 14 [0.4] | 259 [7.4] |
| 3 | 2908 [83.0] | 158 [4.5] | 169 [4.8] |
| 4 | 2841 [81.1] | 53 [1.5] | 120 [3.4] |
| 5 | 2841 [81.1] | 62 [1.8] | 62 [1.8] |
| 6 | 2841 [81.1] | 27 [0.8] | 27 [0.8] |
| 7 | 2822 [80.5] | 20 [0.6] | 38 [1.1] |
| 8 | 2788 [79.5] | 5 [0.1] | 25 [0.7] |
| 9 | 1586 [45.2] | 4 [0.1] | 15 [0.4] |
| 10 | 627 [17.9] | 1 [0.0] | 15 [0.4] |
| 11 | 112 [3.2] | 0 [0.0] | 7 [0.2] |
| 12 | 48 [1.4] | 0 [0.0] | 7 [0.2] |
(b) Computer Science,
| Term | Number of Majors [% of ] | ||
|---|---|---|---|
| Current | Added | Dropped | |
| 1 | 1 [0.2] | 1 [0.2] | 0 [0.0] |
| 2 | 20 [3.3] | 19 [3.2] | 0 [0.0] |
| 3 | 97 [16.1] | 78 [12.9] | 1 [0.2] |
| 4 | 208 [34.5] | 113 [18.7] | 5 [0.8] |
| 5 | 387 [64.2] | 184 [30.5] | 6 [1.0] |
| 6 | 450 [74.6] | 73 [12.1] | 10 [1.7] |
| 7 | 489 [81.1] | 61 [10.1] | 17 [2.8] |
| 8 | 484 [80.3] | 26 [4.3] | 10 [1.7] |
| 9 | 234 [38.8] | 36 [6.0] | 10 [1.7] |
| 10 | 144 [23.9] | 11 [1.8] | 10 [1.7] |
| 11 | 67 [11.1] | 1 [0.2] | 9 [1.5] |
| 12 | 34 [5.6] | 2 [0.3] | 2 [0.3] |
(d) Mathematics,
| Term | Number of Majors [% of ] | ||
|---|---|---|---|
| Current | Added | Dropped | |
| 1 | 22 [6.0] | 22 [6.0] | 0 [0.0] |
| 2 | 87 [23.7] | 66 [18.0] | 1 [0.3] |
| 3 | 181 [49.3] | 102 [27.8] | 10 [2.7] |
| 4 | 254 [69.2] | 94 [25.6] | 23 [6.3] |
| 5 | 265 [72.2] | 36 [9.8] | 26 [7.1] |
| 6 | 280 [76.3] | 26 [7.1] | 13 [3.5] |
| 7 | 272 [74.1] | 14 [3.8] | 15 [4.1] |
| 8 | 258 [70.3] | 4 [1.1] | 13 [3.5] |
| 9 | 80 [21.8] | 8 [2.2] | 9 [2.5] |
| 10 | 60 [16.3] | 1 [0.3] | 2 [0.5] |
| 11 | 18 [4.9] | 1 [0.3] | 6 [1.6] |
| 12 | 7 [1.9] | 0 [0.0] | 4 [1.1] |
(e) Physics & Astronomy,
| Term | Number of Majors [% of ] | ||
|---|---|---|---|
| Current | Added | Dropped | |
| 1 | 17 [9.3] | 17 [9.3] | 0 [0.0] |
| 2 | 72 [39.6] | 56 [30.8] | 1 [0.5] |
| 3 | 122 [67.0] | 62 [34.1] | 14 [7.7] |
| 4 | 148 [81.3] | 33 [18.1] | 7 [3.8] |
| 5 | 144 [79.1] | 7 [3.8] | 12 [6.6] |
| 6 | 140 [76.9] | 4 [2.2] | 8 [4.4] |
| 7 | 131 [72.0] | 2 [1.1] | 11 [6.0] |
| 8 | 125 [68.7] | 1 [0.5] | 6 [3.3] |
| 9 | 46 [25.3] | 1 [0.5] | 4 [2.2] |
| 10 | 38 [20.9] | 0 [0.0] | 2 [1.1] |
| 11 | 3 [1.6] | 0 [0.0] | 1 [0.5] |
| 12 | 1 [0.5] | 0 [0.0] | 2 [1.1] |
(a) Biological Sciences,
| Term | Number of Majors [% of ] | ||
|---|---|---|---|
| Current | Added | Dropped | |
| 1 | 17 [0.8] | 17 [0.8] | 0 [0.0] |
| 2 | 68 [3.1] | 53 [2.4] | 3 [0.1] |
| 3 | 1205 [54.5] | 1141 [51.6] | 12 [0.5] |
| 4 | 1697 [76.8] | 568 [25.7] | 87 [3.9] |
| 5 | 1933 [87.4] | 307 [13.9] | 82 [3.7] |
| 6 | 1926 [87.1] | 71 [3.2] | 84 [3.8] |
| 7 | 1878 [84.9] | 43 [1.9] | 73 [3.3] |
| 8 | 1795 [81.2] | 11 [0.5] | 48 [2.2] |
| 9 | 350 [15.8] | 7 [0.3] | 34 [1.5] |
| 10 | 221 [10.0] | 2 [0.1] | 16 [0.7] |
| 11 | 40 [1.8] | 1 [0.0] | 6 [0.3] |
| 12 | 13 [0.6] | 0 [0.0] | 5 [0.2] |
(c) Psychology,
| Term | Number of Majors [% of ] | ||
|---|---|---|---|
| Current | Added | Dropped | |
| 1 | 6 [0.3] | 6 [0.3] | 0 [0.0] |
| 2 | 61 [3.5] | 55 [3.1] | 0 [0.0] |
| 3 | 400 [22.6] | 340 [19.2] | 4 [0.2] |
| 4 | 1001 [56.6] | 614 [34.7] | 25 [1.4] |
| 5 | 1436 [81.3] | 458 [25.9] | 23 [1.3] |
| 6 | 1581 [89.5] | 171 [9.7] | 29 [1.6] |
| 7 | 1643 [93.0] | 94 [5.3] | 13 [0.7] |
| 8 | 1536 [86.9] | 21 [1.2] | 28 [1.6] |
| 9 | 262 [14.8] | 18 [1.0] | 12 [0.7] |
| 10 | 134 [7.6] | 3 [0.2] | 10 [0.6] |
| 11 | 30 [1.7] | 0 [0.0] | 6 [0.3] |
| 12 | 15 [0.8] | 0 [0.0] | 4 [0.2] |
(b) Economics,
| Term | Number of Majors [% of ] | ||
|---|---|---|---|
| Current | Added | Dropped | |
| 1 | 15 [1.6] | 15 [1.6] | 0 [0.0] |
| 2 | 98 [10.5] | 85 [9.1] | 5 [0.5] |
| 3 | 290 [31.0] | 200 [21.4] | 9 [1.0] |
| 4 | 543 [58.1] | 267 [28.6] | 21 [2.2] |
| 5 | 685 [73.3] | 170 [18.2] | 30 [3.2] |
| 6 | 740 [79.2] | 86 [9.2] | 33 [3.5] |
| 7 | 742 [79.4] | 69 [7.4] | 51 [5.5] |
| 8 | 694 [74.3] | 27 [2.9] | 29 [3.1] |
| 9 | 179 [19.2] | 11 [1.2] | 21 [2.2] |
| 10 | 89 [9.5] | 4 [0.4] | 15 [1.6] |
| 11 | 33 [3.5] | 4 [0.4] | 4 [0.4] |
| 12 | 11 [1.2] | 0 [0.0] | 8 [0.9] |
(d) Other STEM,
| Term | Number of Majors [% of ] | ||
|---|---|---|---|
| Current | Added | Dropped | |
| 1 | 16 [1.1] | 16 [1.1] | 0 [0.0] |
| 2 | 141 [9.4] | 126 [8.4] | 4 [0.3] |
| 3 | 762 [50.6] | 631 [41.9] | 13 [0.9] |
| 4 | 1184 [78.6] | 466 [30.9] | 51 [3.4] |
| 5 | 1315 [87.3] | 183 [12.1] | 55 [3.6] |
| 6 | 1303 [86.5] | 41 [2.7] | 55 [3.6] |
| 7 | 1254 [83.2] | 27 [1.8] | 56 [3.7] |
| 8 | 1192 [79.1] | 8 [0.5] | 22 [1.5] |
| 9 | 255 [16.9] | 9 [0.6] | 18 [1.2] |
| 10 | 131 [8.7] | 0 [0.0] | 13 [0.9] |
| 11 | 35 [2.3] | 1 [0.1] | 6 [0.4] |
| 12 | 11 [0.7] | 0 [0.0] | 11 [0.7] |
(e) Non-STEM,
| Term | Number of Majors [% of ] | ||
|---|---|---|---|
| Current | Added | Dropped | |
| 1 | 254 [5.0] | 254 [5.0] | 1 [0.0] |
| 2 | 1012 [19.8] | 790 [15.5] | 40 [0.8] |
| 3 | 2456 [48.2] | 1487 [29.2] | 51 [1.0] |
| 4 | 3527 [69.2] | 1159 [22.7] | 110 [2.2] |
| 5 | 4141 [81.2] | 745 [14.6] | 81 [1.6] |
| 6 | 4351 [85.3] | 304 [6.0] | 68 [1.3] |
| 7 | 4367 [85.6] | 216 [4.2] | 110 [2.2] |
| 8 | 4125 [80.9] | 107 [2.1] | 108 [2.1] |
| 9 | 796 [15.6] | 45 [0.9] | 67 [1.3] |
| 10 | 443 [8.7] | 10 [0.2] | 32 [0.6] |
| 11 | 114 [2.2] | 4 [0.1] | 14 [0.3] |
| 12 | 57 [1.1] | 3 [0.1] | 12 [0.2] |
Appendix B Appendix B: Summary Tables of Declared Majors
| All Students | Unique | Max Simultaneous | Max Added | Max Dropped |
|---|---|---|---|---|
| Major | Majors | Majors [Term] | Majors [Term] | Majors [Term] |
| Biological Sciences | 2211 | 1933 [5] | 1141 [3] | 87 [4] |
| Chemistry | 1063 | 919 [5] | 706 [3] | 59 [4] |
| Computer Science | 603 | 489 [7] | 184 [5] | 17 [7] |
| Economics | 934 | 742 [7] | 267 [4] | 51 [7] |
| Engineering | 3505 | 3164 [1] | 3164 [1] | 259 [2] |
| Mathematics | 367 | 280 [6] | 102 [3] | 26 [5] |
| Physics and Astronomy | 182 | 148 [4] | 62 [3] | 14 [3] |
| Psychology | 1767 | 1643 [7] | 614 [4] | 29 [6] |
| Other STEM | 1507 | 1315 [5] | 631 [3] | 56 [7] |
| Non-STEM | 5099 | 4367 [7] | 1487 [3] | 110 [7] |
| Asian Students | Unique | Max Simultaneous | Max Added | Max Dropped |
|---|---|---|---|---|
| Major | Majors | Majors [Term] | Majors [Term] | Majors [Term] |
| Biological Sciences | 433 | 383 [5] | 246 [3] | 22 [6] |
| Chemistry | 115 | 95 [6] | 64 [3] | 10 [4] |
| Computer Science | 93 | 74 [8] | 20 [5] | 4 [7] |
| Economics | 185 | 153 [6] | 53 [3] | 14 [7] |
| Engineering | 295 | 255 [3] | 255 [1] | 16 [2] |
| Mathematics | 49 | 36 [6] | 16 [3] | 6 [4] |
| Physics and Astronomy | 11 | 9 [4] | 5 [4] | 2 [5] |
| Psychology | 209 | 191 [7] | 70 [4] | 6 [6] |
| Other STEM | 302 | 270 [5] | 134 [3] | 13 [6] |
| Non-STEM | 477 | 395 [6] | 124 [3] | 16 [7] |
| URM Students | Unique | Max Simultaneous | Max Added | Max Dropped |
|---|---|---|---|---|
| Major | Majors | Majors [Term] | Majors [Term] | Majors [Term] |
| Biological Sciences | 196 | 166 [6] | 85 [3] | 10 [4] |
| Chemistry | 86 | 70 [5] | 55 [3] | 5 [6] |
| Computer Science | 71 | 62 [8] | 30 [5] | 4 [11] |
| Economics | 96 | 72 [7] | 31 [4] | 7 [8] |
| Engineering | 344 | 310 [1] | 310 [1] | 28 [2] |
| Mathematics | 24 | 19 [8] | 7 [3] | 2 [6] |
| Physics and Astronomy | 17 | 15 [5] | 11 [3] | 3 [7] |
| Psychology | 267 | 243 [7] | 85 [5] | 8 [6] |
| Other STEM | 139 | 120 [5] | 53 [3] | 10 [5] |
| Non-STEM | 590 | 506 [7] | 159 [3] | 20 [8] |
| White Students | Unique | Max Simultaneous | Max Added | Max Dropped |
|---|---|---|---|---|
| Major | Majors | Majors [Term] | Majors [Term] | Majors [Term] |
| Biological Sciences | 1582 | 1384 [5] | 810 [3] | 61 [4] |
| Chemistry | 862 | 758 [5] | 587 [3] | 44 [4] |
| Computer Science | 439 | 363 [7] | 134 [5] | 12 [7] |
| Economics | 653 | 522 [7] | 192 [4] | 33 [7] |
| Engineering | 2866 | 2599 [1] | 2599 [1] | 215 [2] |
| Mathematics | 294 | 226 [6] | 79 [4] | 25 [5] |
| Physics and Astronomy | 154 | 126 [4] | 50 [2] | 12 [3] |
| Psychology | 1291 | 1209 [7] | 463 [4] | 22 [8] |
| Other STEM | 1066 | 925 [5] | 444 [3] | 42 [4] |
| Non-STEM | 4032 | 3470 [7] | 1204 [3] | 83 [4] |
Appendix C Appendix C: Degrees Earned by Dropped Majors
| All Students | % of in a Given Major That Subsequently Earned Degree in Each Major | |||||||||||
|---|---|---|---|---|---|---|---|---|---|---|---|---|
| Other | Non- | No | ||||||||||
| Major | Bio | Chem | CS | Econ | Engr | Math | Phys | Psych | STEM | STEM | Degree | |
| Bio | 450 | 2.7 | 4.0 | 3.1 | 1.6 | 10.2 | 2.2 | 0.2 | 7.8 | 7.8 | 44.0 | 27.1 |
| Chem | 218 | 10.6 | 1.4 | 4.6 | 1.8 | 11.9 | 1.8 | 0.9 | 5.0 | 7.8 | 38.1 | 26.1 |
| CS | 80 | 5.0 | 0.0 | 1.2 | 2.5 | 2.5 | 3.8 | 1.2 | 2.5 | 2.5 | 26.2 | 55 |
| Econ | 226 | 2.7 | 0.9 | 3.5 | 1.3 | 2.2 | 7.1 | 0.0 | 4.4 | 7.1 | 47.3 | 31.9 |
| Engr | 790 | 4.2 | 2.7 | 8.2 | 5.3 | 0.9 | 2.4 | 0.8 | 2.4 | 4.9 | 29.9 | 46.1 |
| Math | 122 | 10.7 | 5.7 | 4.9 | 15.6 | 5.7 | 4.1 | 1.6 | 7.4 | 19.7 | 20.5 | 25.4 |
| Phys | 68 | 1.5 | 2.9 | 4.4 | 4.4 | 11.8 | 16.2 | 1.5 | 2.9 | 2.9 | 25.0 | 36.8 |
| Psych | 154 | 1.9 | 0.0 | 3.2 | 1.3 | 0.6 | 0.0 | 0.6 | 9.7 | 2.6 | 35.7 | 51.3 |
| Other STEM | 304 | 11.2 | 1.3 | 3.0 | 11.5 | 2.6 | 5.6 | 0.0 | 15.5 | 0.7 | 35.9 | 27.0 |
| Non-STEM | 694 | 6.6 | 1.3 | 4.3 | 4.5 | 2.7 | 1.6 | 1.0 | 12.4 | 5.2 | 8.4 | 59.4 |
| Asian Students | % of in a Given Major That Subsequently Earned Degree in Each Major | |||||||||||
|---|---|---|---|---|---|---|---|---|---|---|---|---|
| Other | Non- | No | ||||||||||
| Major | Bio | Chem | CS | Econ | Engr | Math | Phys | Psych | STEM | STEM | Degree | |
| Bio | 92 | 5.4 | 1.1 | 5.4 | 4.3 | 9.8 | 3.3 | 0.0 | 6.5 | 13.0 | 42.4 | 25.0 |
| Chem | 26 | 11.5 | 3.8 | 7.7 | 0.0 | 11.5 | 0.0 | 0.0 | 7.7 | 11.5 | 30.8 | 26.9 |
| CS | 13 | 7.7 | 0.0 | 0.0 | 7.7 | 0.0 | 0.0 | 0.0 | 7.7 | 0.0 | 23.1 | 61.5 |
| Econ | 49 | 2.0 | 4.1 | 4.1 | 0.0 | 2.0 | 6.1 | 0.0 | 10.2 | 14.3 | 28.6 | 36.7 |
| Engr | 66 | 3.0 | 3.0 | 13.6 | 9.1 | 0.0 | 1.5 | 1.5 | 3.0 | 7.6 | 24.2 | 47.0 |
| Math | 16 | 6.2 | 0.0 | 6.2 | 18.8 | 6.2 | 0.0 | 0.0 | 12.5 | 31.2 | 18.8 | 31.2 |
| Phys | 5 | 0.0 | 0.0 | 0.0 | 0.0 | 20.0 | 20.0 | 0.0 | 0.0 | 0.0 | 40.0 | 20.0 |
| Psych | 14 | 7.1 | 0.0 | 0.0 | 0.0 | 0.0 | 0.0 | 0.0 | 7.1 | 0.0 | 50.0 | 35.7 |
| Other STEM | 55 | 10.9 | 1.8 | 5.5 | 9.1 | 1.8 | 3.6 | 0.0 | 18.2 | 1.8 | 30.9 | 29.1 |
| Non-STEM | 62 | 12.9 | 1.6 | 3.2 | 1.6 | 3.2 | 0.0 | 0.0 | 16.1 | 8.1 | 4.8 | 53.2 |
| URM Students | % of in a Given Major That Subsequently Earned Degree in Each Major | |||||||||||
|---|---|---|---|---|---|---|---|---|---|---|---|---|
| Other | Non- | No | ||||||||||
| Major | Bio | Chem | CS | Econ | Engr | Math | Phys | Psych | STEM | STEM | Degree | |
| Bio | 52 | 1.9 | 1.9 | 0.0 | 0.0 | 1.9 | 0.0 | 0.0 | 9.6 | 0.0 | 53.8 | 30.8 |
| Chem | 20 | 5.0 | 0.0 | 10.0 | 5.0 | 20.0 | 10.0 | 0.0 | 5.0 | 5.0 | 45.0 | 15.0 |
| CS | 7 | 14.3 | 0.0 | 0.0 | 0.0 | 0.0 | 0.0 | 0.0 | 0.0 | 0.0 | 28.6 | 57.1 |
| Econ | 33 | 0.0 | 0.0 | 6.1 | 0.0 | 6.1 | 6.1 | 0.0 | 6.1 | 6.1 | 45.5 | 36.4 |
| Engr | 98 | 3.1 | 1.0 | 7.1 | 1.0 | 0.0 | 3.1 | 0.0 | 2.0 | 3.1 | 28.6 | 54.1 |
| Math | 6 | 0.0 | 0.0 | 0.0 | 33.3 | 16.7 | 16.7 | 0.0 | 0.0 | 16.7 | 16.7 | 33.3 |
| Phys | 11 | 9.1 | 0.0 | 0.0 | 9.1 | 9.1 | 18.2 | 9.1 | 9.1 | 0.0 | 27.3 | 18.2 |
| Psych | 28 | 3.6 | 0.0 | 7.1 | 0.0 | 0.0 | 0.0 | 0.0 | 7.1 | 0.0 | 28.6 | 64.3 |
| Other STEM | 36 | 11.1 | 2.8 | 0.0 | 5.6 | 0.0 | 5.6 | 0.0 | 8.3 | 0.0 | 47.2 | 27.8 |
| Non-STEM | 107 | 8.4 | 0.0 | 1.9 | 2.8 | 0.9 | 0.0 | 0.9 | 8.4 | 2.8 | 8.4 | 71.0 |
| White Students | % of in a Given Major That Subsequently Earned Degree in Each Major | |||||||||||
|---|---|---|---|---|---|---|---|---|---|---|---|---|
| Other | Non- | No | ||||||||||
| Major | Bio | Chem | CS | Econ | Engr | Math | Phys | Psych | STEM | STEM | Degree | |
| Bio | 306 | 2.0 | 5.2 | 2.9 | 1.0 | 11.8 | 2.3 | 0.3 | 7.8 | 7.5 | 42.8 | 27.1 |
| Chem | 172 | 11.0 | 1.2 | 3.5 | 1.7 | 11.0 | 1.2 | 1.2 | 4.7 | 7.6 | 38.4 | 27.3 |
| CS | 60 | 3.3 | 0.0 | 1.7 | 1.7 | 3.3 | 5.0 | 1.7 | 1.7 | 3.3 | 26.7 | 53.3 |
| Econ | 144 | 3.5 | 0.0 | 2.8 | 2.1 | 1.4 | 7.6 | 0.0 | 2.1 | 4.9 | 54.2 | 29.2 |
| Engr | 626 | 4.5 | 2.9 | 7.8 | 5.6 | 1.1 | 2.4 | 0.8 | 2.4 | 5.0 | 30.7 | 44.7 |
| Math | 100 | 12.0 | 7.0 | 5.0 | 14 | 5.0 | 4.0 | 2.0 | 7.0 | 18.0 | 21.0 | 24.0 |
| Phys | 52 | 0.0 | 3.8 | 5.8 | 3.8 | 11.5 | 15.4 | 0.0 | 1.9 | 3.8 | 23.1 | 42.3 |
| Psych | 112 | 0.9 | 0.0 | 2.7 | 1.8 | 0.9 | 0.0 | 0.9 | 10.7 | 3.6 | 35.7 | 50.0 |
| Other STEM | 213 | 11.3 | 0.9 | 2.8 | 13.1 | 3.3 | 6.1 | 0.0 | 16.0 | 0.5 | 35.2 | 26.3 |
| Non-STEM | 525 | 5.5 | 1.5 | 5.0 | 5.1 | 3.0 | 2.1 | 1.1 | 12.8 | 5.3 | 8.8 | 57.7 |
Appendix D Appendix D: GPA of Those That Drop vs. Those That Earn a Degree in a Major by Racial/Ethnic Group