Analytical Performance Modeling of NoCs under
Priority Arbitration and Bursty Traffic
Abstract
Networks-on-Chip (NoCs) used in commercial many-core processors typically incorporate priority arbitration. Moreover, they experience bursty traffic due to application workloads. However, most state-of-the-art NoC analytical performance analysis techniques assume fair arbitration and simple traffic models. To address these limitations, we propose an analytical modeling technique for priority-aware NoCs under bursty traffic. Experimental evaluations with synthetic and bursty traffic show that the proposed approach has less than 10% modeling error with respect to cycle-accurate NoC simulator.
I Introduction
Industrial many-core processors incorporate priority arbitration for the routers in NoC [1]. Moreover, these designs execute bursty traffic since real applications exhibit burstiness [2]. Accurate NoC performance models are required to perform design space exploration and accelerate full-system simulations [3, 4]. Most existing analysis techniques assume fair arbitration in routers, which does not hold for NoCs with priority arbitration used in manycore processors, such as high-end servers [5] and high performance computing (HPC) [1]. A recent technique targets priority-aware NoCs [6], but it assumes that the input traffic follows geometric distribution. While this assumption simplifies analytical models, it fails to capture the bursty behavior of real applications [2]. Indeed, our evaluations show that the geometric distribution assumption leads up to 60% error in latency estimation unless the bursty nature of applications is explicitly modeled. Therefore, there is a strong need for NoC performance analysis techniques that consider both priority arbitration and bursty traffic.
This work proposes a novel performance modeling technique for priority-aware NoCs that takes bursty traffic into account. It first models the input traffic as a generalized geometric (GGeo) discrete-time distribution that includes a parameter for burstiness. We achieve high scalability by employing the principle of maximum entropy (ME) to transform the given queuing network into a near equivalent set of individual queue nodes of multiple-classes with revised characteristics (e.g., modifying service process). Furthermore, our solution involves transformations to handle priority arbitration of the routers across a network of queues. Finally, we construct analytical models of the transformed queue nodes to obtain end-to-end latency. The proposed performance analysis technique is evaluated with SYSmark® 2014 SE [7], applications from SPEC CPU® 2006 [8] and SPEC CPU® 2017 [9] benchmark suites, as well as synthetic traffic. The proposed technique has less than 10% modeling error with respect to an industrial cycle-accurate NoC simulator. The major contributions of this work are as follows:
-
•
Accurate and scalable high-level performance modeling of priority-based NoCs considering burstiness,
-
•
Dynamic approximation of realistic bursty traffic via GGeo distribution,
-
•
Thorough evaluations on industrial priority-based NoCs with synthetic traffic and real applications.
II Related Work
NoC analytical performance analysis techniques primarily target fast design space exploration and accelerating full-system simulations. Most of the existing techniques consider NoC routers with fair arbitration [10, 4], but this assumption does not hold for NoCs that employ priority arbitration [1, 5]. Several performance analysis techniques target priority-aware NoCs [3, 6]. The technique presented in [3] assumes that each class of traffic in the NoC occupies different queues. This assumption is not practical since most of the industrial NoCs share queues between multiple traffic classes. Analytical model for industrial NoCs, which estimates average end-to-end latency is proposed in [6]. However, these models assume that the input traffic follows geometric distribution, which is not applicable for workloads with bursty traffic.
Analytical modeling of priority-based queuing networks has also been studied outside of the realm of the on-chip interconnect [11, 12]. Analytical models constructed in [11] considers a queuing network in the continuous-time domain. This assumption is not valid for NoCs, as events happen in discrete clock cycles. In [12], performance analysis models are constructed in the discrete-time domain. Since the number of random variables required in this technique is equal to the number of classes (exponential on the number of routers) present in the NoC, this approach does not scale. In contrast, the analytical models presented in this paper use the discrete-time domain and scale to thousands of traffic classes.
III Background and Overview
The goal of this work is to construct accurate performance models for industrial NoCs under priority-arbitration and bursty traffic. We mainly target manycore processors used in servers, HPC, and high-end client CPUs [1, 5]. The proposed technique takes burstiness and injection rate of the traffic as input and then provides end-to-end latency of each traffic class.
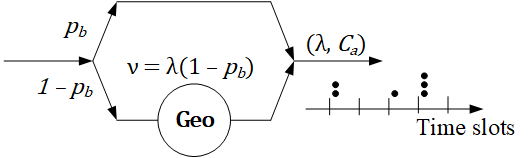
Input traffic model assumptions: Applications usually produce bursty NoC traffic with varying inter-arrival times [2, 4]. We approximate the input traffic using the GGeo discrete-time distribution model, which takes both burstiness and discrete-time feature of NoCs into account [13, 4]. GGeo model includes Geometric and null (no delay) branches, as shown in Figure 1. Selection between branches conforms to the Bernoulli trial, where the null (upper) and Geo (lower) branches are selected with probability and , respectively. The Geo branch leads to geometrically distributed inter-arrival time, while the null branch issues additional flit in the current time slot leading to a burst. Both the number of flits in a time slot and the inter-arrival rate depend on [13]. Hence, we use as a parameter of burstiness. GGeo distribution has two important properties [13]. First, it is pseudo-memoryless, i.e. the remaining inter-arrival time is geometrically distributed. Second, it can be described by its first two moments (, ), where . We exploit these properties to construct analytical models.
IV Systematic Generation of Analytical Models
In industrial NoCs, flits already in the network have higher priority than new injections to achieve predictable latency [1]. This leads to nontrivial timing dependencies between the multi-class flits in the network. Hence, we propose a systematic approach for accurate and scalable performance analysis. We note that the proposed technique can be extended to NoCs with fair arbitration if we assume that all classes have the same priority. However, we do not focus on non-priority NoCs since this domain has been studied in the past [10].
IV-A Maximum entropy for queuing networks
We apply the principle of ME to queuing systems to find the probability distribution of desired metrics (e.g., queue occupancy) [13]. According to this principle, the selected distribution should be the least biased among all feasible distributions satisfying the prior information in the form of mean values. The optimal distribution is found by maximizing the corresponding entropy function: we formulate a nonlinear programming problem and solve it analytically via the Lagrange method of undetermined multipliers as discussed next.
| Mean arrival rate of total traffic and class m | ||
| Probability of burstiness | ||
| , | Original and modified mean service time of class m flits | |
|
||
| Mean server utilization of class m flits (=) | ||
| , |
|
|
|
||
| , |
|
|
| Mean waiting time of class m flits | ||
| Mean and current occupancy of class m flits in a queue-node | ||
| Mean number of bursty arrivals of class m | ||
| Mean queue-node occupancy of class with serving class | ||
| State vector, of priority queue-nodes | ||
| Probability that a queue-node is in state | ||
| Marginal probability of zero flits of class m in a queue-node. | ||
| if class in service and 0 otherwise | ||
| Number of classes that share same server |
IV-B Decomposition of basic priority queuing
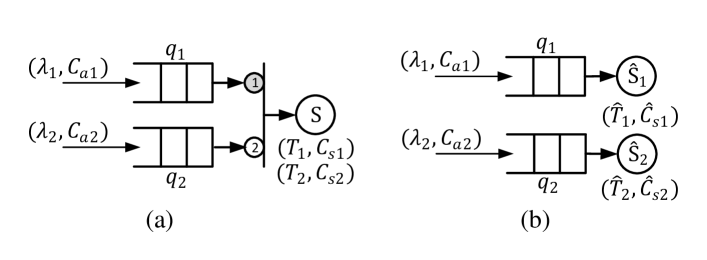
In a non-preemptive priority queuing system, the router does not preempt a higher priority flit while processing a lower priority flit. An example system with two queues and a shared server is shown in Figure 2(a). There are two flows arriving at a priority-based arbiter and a shared server. The shaded circle corresponds to high priority input (class 1) to the arbiter. We denote this structure as basic priority queuing. Our goal is to decompose this system into individual queue-nodes with modified servers, as shown in Figure 2(b). The combination of a queue and its corresponding server is referred to as a queue-node. The effective expected service time of class 2 flits, , is larger than the original mean service time , since class 2 flits wait for the higher priority (class 1) flits in the original system. We calculate the effective service time in the transformed network using Little’s Law as:
| (1) |
where is the marginal probability of having no flits of class in the queue-node, as listed in Table I.
Computing using ME: We find using the ME principle by maximizing the entropy function given in (2) subject to the constraints listed in (3):
| (2) | |||||
| subject to | |||||
| (3) | |||||
The notation means a state vector with all elements set to , and () refers to a vector with the element set to 1 and other elements set to 0. The constraints in (3) comprise three types: normalization, mean server utilization and mean occupancy. We introduced an extended set of mean occupancy constraints compared to [13] to provide further information about the underlying system. When a flit of a certain class arrives at the system, it may find the server busy with its own class or other classes since the server is a shared resource, as shown in Figure 2(a). Therefore, the mean occupancy of each class can be partitioned according to the contribution of each class occupying the server. We exploit this inherent partitioning to generate additional occupancy constraints. The occupancy related constraints depend on three components, , and (defined in Table I) derived in [13, 6].
We solve the nonlinear programming problem in (2, 3) to find which we use to determine the probability of having zero flits of class , . The convergence of this solution is guaranteed when the queuing system is in a stable region. We derived the general expression for queues in a priority structure with a single class per queue as:
| (4) |
Plugging the expression of from (4) into (1), we obtain the first moment of the service process.
Computing second moment of the service time: Since we also need the second moment to characterize the GGeo traffic, we calculate the modified squared coefficient of variation of the service time for class (). We utilize the queuing occupancy formulation of GGeo/G/1 [13] and the modified server utilization to obtain the following expression for :
| (5) |
IV-C Decomposition of priority queuing with partial contention
Priority-aware NoCs involve complex queuing structures that cannot be modeled accurately using only the models for basic priority queuing. The complexity is primarily attributed to the partial priority contention across queues. We identified two basic structures with partial priority dependency that constitute the building blocks of practical priority-aware NoCs.
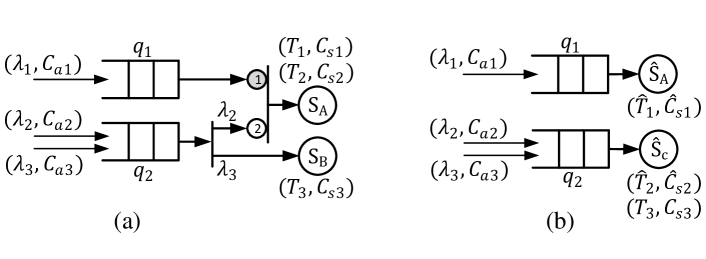
The first basic structure is shown in Figure 3(a) where high priority class 1 is in contention with a portion of the traffic in (class 2) through server . Class 2 and 3 flits have the same priority and share before entering the traffic splitter that assigns class 2 and 3 flits to server and respectively, following a notation similar to the one adopted in [14]. We denote this structure as contention at low priority. To decompose and , we need to calculate the first two moments of the modified service process of class 1 and 2. The decomposed structure is shown in Figure 3(b). First, we set to zero which leads to a basic priority structure. Then, we apply the decomposition method discussed in Section IV-B to obtain () and (). We derived mean queuing time () of individual classes of in the decomposed form as:
| (6) |
where and .
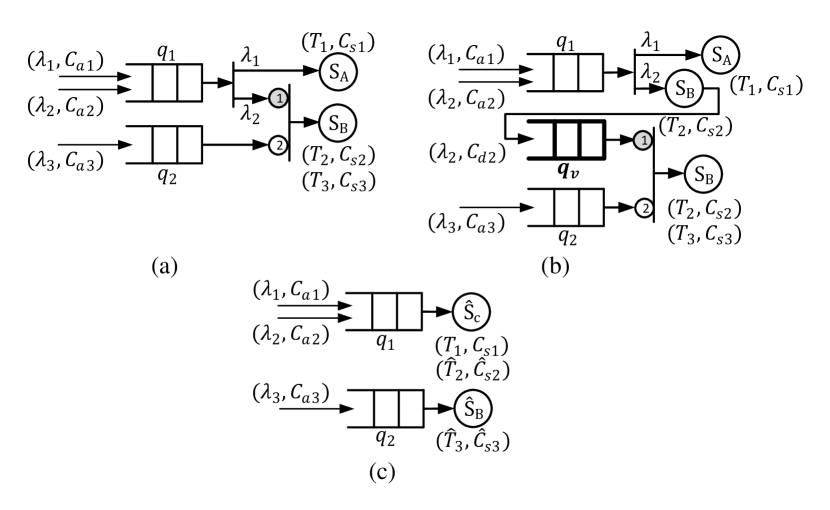
The other basic structure, contention at high priority, is shown in Figure 4(a). In this scenario, only a fraction of the classes in (class 2) has higher priority than class 3 since class 1 in is served by . Determining is challenging due to class 1 that influences the inter-departure time of class 2. To incorporate this effect, we calculate the squared coefficient of variation of inter-departure time, , of class 2 using the split process formulation of GGeo streams given in [13]. We introduce a virtual queue, and feed it with the flits of class 2. Therefore, and form a basic priority structure, as shown in Figure 4(b). Subsequently, we apply the decomposition method described in Section IV-B to calculate () as well as (). The decomposed structure is shown in Figure 4(c).
IV-D Iterative decomposition algorithm
Algorithm 1 shows a step-by-step procedure to obtain the analytical model using our approach described in Section IV-C. The inputs to the algorithm are NoC topology, routing algorithm and server process. The analytical models presented for the canonical queuing system are independent of the NoC topology. Therefore, the analytical models are valid for any NoC, including irregular topologies. First, we identify priority dependencies between different classes in the network. Next, we apply decomposition for contention at high and low priority, as shown in line 7 – 8 of Algorithm 1. Subsequently, we calculate the modified service process (, ) using (1, 4) and (5). Then, we compute the waiting time per class following (6). Finally, we obtain the average waiting time in each queue (), as shown in line 12.
V Experimental Evaluation
| Topology | 61 Ring | 8 Ring | 44 Mesh | 66 Mesh | |||||||||||||||||||||||||||||||||
| 0.2 | 0.4 | 0.6 | 0.2 | 0.4 | 0.6 | 0.2 | 0.4 | 0.6 | 0.2 | 0.4 | 0.6 | ||||||||||||||||||||||||||
| 0.1 | 0.4 | 0.6 | 0.1 | 0.4 | 0.6 | 0.1 | 0.4 | 0.6 | 0.1 | 0.3 | 0.5 | 0.1 | 0.3 | 0.5 | 0.1 | 0.3 | 0.5 | 0.2 | 0.5 | 0.8 | 0.2 | 0.5 | 0.8 | 0.2 | 0.5 | 0.8 | 0.1 | 0.4 | 0.6 | 0.1 | 0.4 | 0.6 | 0.1 | 0.3 | 0.6 | ||
| Err(%) | Prop. | 0.2 | 5.6 | 12 | 0.8 | 0.6 | 12 | 0.2 | 4.3 | 14 | 0.5 | 3.7 | 7.3 | 0.9 | 5.1 | 12 | 0.5 | 3.1 | 12 | 2.3 | 5.0 | 11 | 2.9 | 7.5 | 13 | 2.0 | 9.1 | 12 | 4.7 | 0.6 | 11 | 4.3 | 8.2 | 10 | 6.1 | 7.9 | 12 |
| Ref[3] | 17 | H | H | 30 | H | H | 54 | H | H | 66 | H | H | H | H | H | H | H | H | 30 | H | H | 10 | H | H | 12 | H | H | 28 | H | H | 54 | H | H | 78 | H | H | |
| Ref[6] | 8.5 | 12 | 18 | 20 | 30 | 55 | 36 | 47 | 79 | 7.5 | 8.8 | 11 | 18 | 24 | 39 | 33 | 42 | 85 | 10 | 21 | 40 | 21 | 38 | 82 | 37 | 56 | 88 | 7.2 | 13 | 45 | 14 | 34 | 64 | 28 | 48 | 76 | |
The proposed technique is implemented in C++ to facilitate integration with system-level simulators. Analysis takes 2.7 ms for a 66 NoC and the worst-case complexity is , where is the number of nodes. In all experiments, 200K cycles of warm-up period is considered. The accuracy of the models is evaluated against an industrial cycle-accurate simulator [15] under both real applications and synthetic traffic that models uniformly distributed core to last-level cache traffic with 100% hit rate.
V-A Evaluation on Architectures with Ring NoCs
This section analyzes the accuracy of the proposed analytical models using uniform traffic on a priority-based 61 and 81 ring NoCs, similar to those used in high-end client CPUs with integrated GPU and memory controller. Table II shows that the average errors between our technique and simulation are 6%, 4% and 6% for burst probability of 0.2, 0.4 and 0.6, respectively. These errors hardly reach 14% even at the highest injection, which is hard to model. Table II also shows that priority-based analytical models which do not consider burstiness [6] significantly underestimate the latency by 33% on average (highlighted with the shaded row). In contrast, the work without the proposed decomposition technique [3] leads to over 100% overestimation even at low traffic loads (highlighted with text in italics). In this case, GGeo models can not handle partial contention, since it assumes all packets in the high-priority queue have higher priority than each packet in the low priority queue. These results demonstrate that the proposed priority-aware NoC performance models have significantly higher accuracy than the existing alternatives.
V-B Evaluation on Architectures with Mesh NoCs
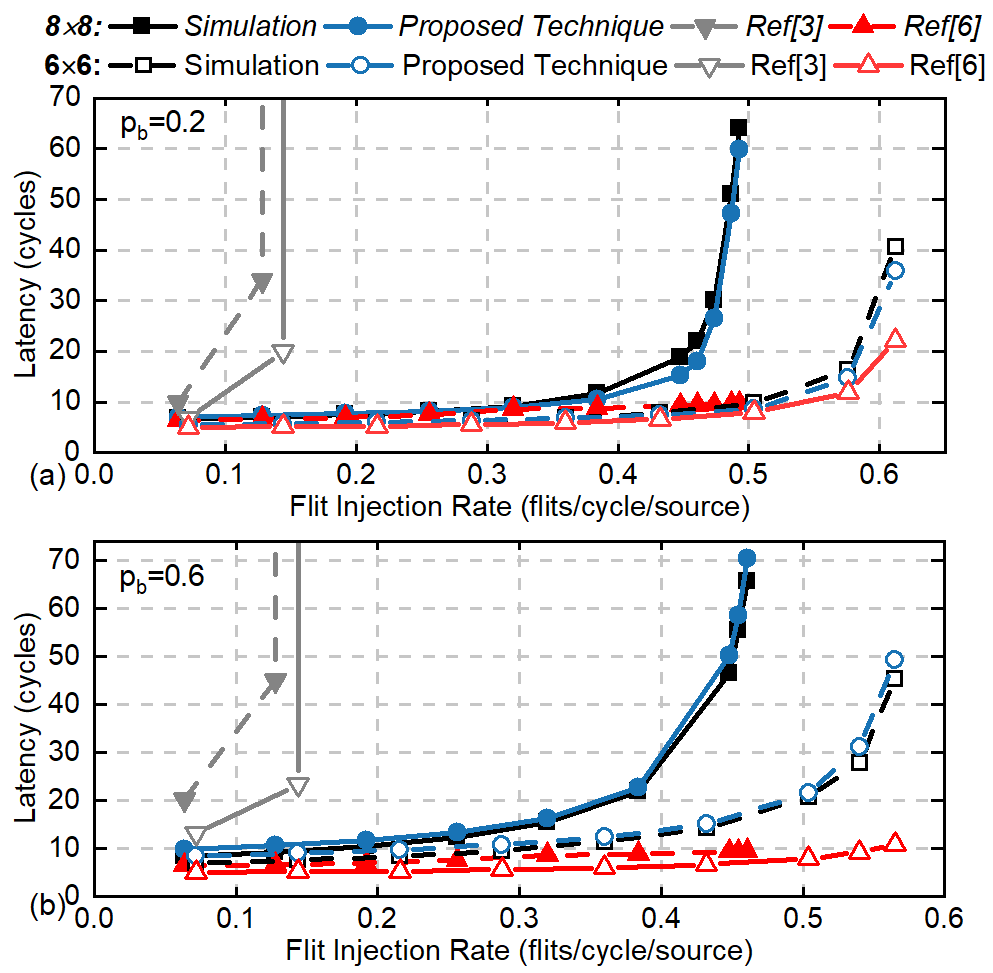
Table II compares the analytical model and simulation results for a priority-based 44 and 66 mesh NoC, similar to those used in high-end servers [1]. Our technique incurs on average 6%, 7% and 10% error for burst probability of 0.2, 0.4 and 0.6, respectively. Priority-based analytical models which neglect burstiness [6] underestimate the latency by 60% on average similar to the results on the ring architectures. Likewise, GGeo models without the proposed decomposition technique lead to overestimation. We also provide detailed comparison of proposed analytical models on 66 and 88 NoC for burst probability of 0.2 and 0.6 in Figure 5(a) and Figure 5(b), respectively. The proposed models significantly outperform the other alternatives and lead to less than 10% error on average.
V-C Evaluation with Real Applications
This section validates the proposed analytical models using SYSmark® 2014 SE [7], and applications from SPEC CPU® 2006 [8] and SPEC CPU® 2017 [9] benchmark suites. These applications are chosen since they show different levels of burstiness. First, we run these applications on gem5 [16] and collect traces with timestamps for each packet injection. Then, we use the traces to compute the injection rate () and .
Computing : For each source, we feed traffic arrivals with timestamps over a 200K clock cycle window into a virtual queue with the same service rate as the NoC to determine the queue occupancy. At the end of the window, we compute the average occupancy. Then, we employ the model described in [13] to find the occupancy and then of each class.
The proposed analytical models are used to estimate the latency using the injection rate and burst parameters, as well as the NoC architecture and routing algorithm. The applications show burstiness in the range of 0.2 – 0.5. As shown in Table III, the proposed technique has on average 2% and 4% error compared to cycle-accurate simulations for 66 mesh and 88 mesh, respectively. In contrast, the analytical models presented in [3] and [6] incur significant modeling error.
|
mcf | gcc | bwaves |
|
|
|
|
||||||||||||
|---|---|---|---|---|---|---|---|---|---|---|---|---|---|---|---|---|---|---|---|
| Prop | 2.17 | 4.97 | 0.92 | 0.15 | 0.38 | 5.10 | 3.63 | 0.73 | |||||||||||
| Ref [3] | 14.62 | 11.99 | 7.69 | 12.29 | 5.18 | 13.64 | 11.46 | 7.25 | |||||||||||
| 66 Mesh | Ref [6] | 17.36 | 23.29 | 7.71 | 22.02 | 6.99 | 14.11 | 12.95 | 11.13 | ||||||||||
| Prop | 3.59 | 4.08 | 3.81 | 4.87 | 0.44 | 7.48 | 3.67 | 1.10 | |||||||||||
| Ref [3] | 10.33 | 12.73 | 12.07 | 22.90 | 19.17 | 9.93 | 5.99 | 19.04 | |||||||||||
| 88 Mesh | Ref [6] | 12.15 | 29.99 | 10.00 | 19.65 | 5.44 | 10.78 | 14.74 | 7.94 |
VI Conclusion
We presented analytical models for priority-aware NoCs under bursty traffic. We model bursty traffic as generalized geometric distribution and applied the maximum entropy method to construct analytical models. Experimental evaluations show that the proposed technique has less 10% modeling error with respect to cycle-accurate NoC simulation for real applications.
Appendix A
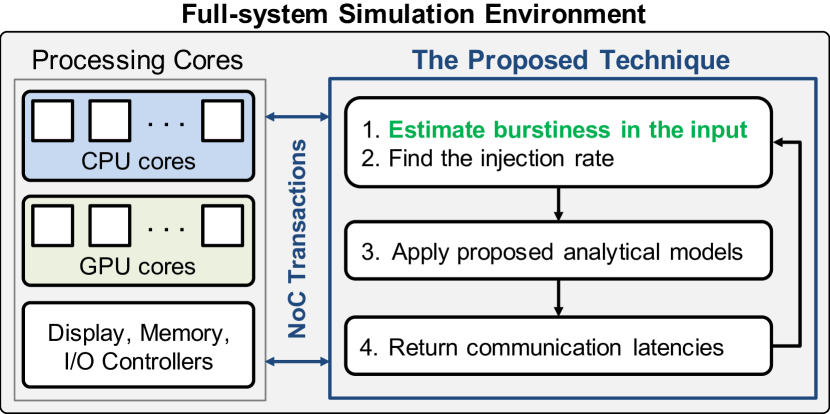
Usage of the proposed analytical models: In this work, we aim to replace the cycle accurate NoC simulators with analytical performance models. The full-system simulation environment keeps track of the traffic injected from processing cores (e.g. CPU, GPU, caches, memory etc.) to the NoC, as shown in Figure 6. The proposed technique obtains the traffic information of processing cores over a time window, which is in the order of 100-200K cycles in our experiments. The duration can be decreased if the workload characteristics change considerably within a window or increased if the workload is steady. Our simulator estimates the burstiness of the input and calculates the injection rate of each traffic class using this information (first two steps in Figure 6). Then, it applies the proposed analytical models to obtain end-to-end latency of each traffic class. Whenever a processing core issues a new transaction, the communication latency is computed using these models instead of cycle-accurate simulations. These steps are repeated for each time window.
Appendix B
Generalization of the proposed analytical models: We incorporate Y-X routing algorithm in the experimental evaluations presented following the actual reference commercial hardware design [1]. However, we note that the proposed approach is independent of the routing algorithm. In fact, the routing algorithm is one of the inputs to the proposed Iterative Decomposition Algorithm (Algorithm 1).
The analytical models are valid for any type of NoC including irregular topologies. The analytical models presented for the canonical queuing system are independent of the NoC topology. The canonical model constitutes the end-to-end latency model for a given NoC topology. In fact, NoC topology is an input to the algorithm which computes the end-to-end latency (Algorithm 1). Since this work targets general purpose NoCs used in manycore processors, we evaluate our proposed model only with Mesh and Ring NoC used in Intel Xeon server [1], Xeon Phi [17], and quad-core i7 (with integrated graphics) [18] processors.
| Apps |
|
mcf | gcc | bwaves |
|
|
|
|
||||||||||
|---|---|---|---|---|---|---|---|---|---|---|---|---|---|---|---|---|---|---|
| 0.37 | 0.43 | 0.26 | 0.53 | 0.26 | 0.18 | 0.26 | 0.27 |
Appendix C
Results with real application executed on 61 ring: Table IV shows the probability of burstiness of different applications used in our experiemntal evaluations. The levels of burstiness exhibited by these applications are between 0.18 and 0.53 re-emphasizing that the chosen levels of burstiness for evaluation with synthetic traffic in Section V-C are representative of real applications.
Table V shows the modeling error with respect to simulation for 61 ring for the proposed approach, the approach presented in [3] and [6]. The error with proposed analytical model is always less than 10%. However, the technique presented in [3] does not take care multiple traffic classes in single queue resulting up to 24% error with respect to cycle-accurate simulation. Moreover, the analytical model constructed in [6] does not incorporate burstiness of the input traffic which results in upto 28% modeling error.
References
- [1] James Jeffers et al. Intel Xeon Phi Processor High Performance Programming: Knights Landing Edition. Morgan Kaufmann, 2016.
- [2] Paul Bogdan et al. Workload Characterization and Its Impact on Multicore Platform Design. In Proc. of the Intl. Conf. on Hardware/Software Codesign and System Synthesis, pages 231–240, 2010.
- [3] Abbas Eslami Kiasari et al. An Analytical Latency Model for Networks-on-Chip. IEEE TVLSI, 21(1):113–123, 2013.
- [4] Zhi-Liang Qian et al. A Support Vector Regression (SVR)-based Latency Model for Network-on-Chip (NoC) Architectures. IEEE Trans. on Computer-Aided Design of Integrated Circuits and Systems, 35(3):471–484, 2015.
- [5] Simon M Tam et al. SkyLake-SP: A 14nm 28-Core Xeon® Processor. In 2018 IEEE ISSCC, pages 34–36, 2018.
- [6] Sumit K Mandal et al. Analytical Performance Models for NoCs with Multiple Priority Traffic Classes. ACM TECS, 18(5s), 2019.
- [7] Business Applications Performance Corporation (BAPCo). Benchmark, sysmark2014. http://bapco.com/products/sysmark-2014, accessed 27 May 2020.
- [8] John L Henning. SPEC CPU2006 Benchmark Descriptions. ACM SIGARCH Computer Architecture News, 34(4):1–17, 2006.
- [9] James Bucek, Klaus-Dieter Lange, and Jóakim v. Kistowski. SPEC CPU2017: Next-Generation Compute Benchmark. In Companion of the 2018 ACM/SPEC International Conference on Performance Engineering, pages 41–42, 2018.
- [10] Umit Y Ogras and Radu Marculescu. Modeling, Analysis and Optimization of Network-on-Chip Communication Architectures, volume 184. Springer Science & Business Media, 2013.
- [11] Gunter Bolch et al. Queueing Networks and Markov Chains: Modeling and Performance Evaluation with Computer Science Applications. John Wiley & Sons, 2006.
- [12] Joris Walraevens. Discrete-time Queueing Models with Priorities. PhD thesis, Ghent University, 2004.
- [13] Demetres D Kouvatsos. Entropy Maximisation and Queuing Network Models. Annals of Operations Research, 48(1):63–126, 1994.
- [14] Alexander Gotmanov et al. Verifying Deadlock-Freedom of Communication Fabrics. In Intl. Workshop on Verification, Model Checking, and Abstract Interpretation, pages 214–231. Springer, 2011.
- [15] Umit Y Ogras et al. Energy-Guided Exploration of On-Chip Network Design for Exa-Scale Computing. In Proc. of Intl. Workshop on System Level Interconnect Prediction, pages 24–31, 2012.
- [16] Nathan Binkert et al. The Gem5 Simulator. SIGARCH Comp. Arch. News, May. 2011.
- [17] Avinash Sodani, Roger Gramunt, Jesus Corbal, Ho-Seop Kim, Krishna Vinod, Sundaram Chinthamani, Steven Hutsell, Rajat Agarwal, and Yen-Chen Liu. Knights landing: Second-generation intel xeon phi product. Ieee micro, 36(2):34–46, 2016.
- [18] James Charles, Preet Jassi, Narayan S Ananth, Abbas Sadat, and Alexandra Fedorova. Evaluation of the intel® core™ i7 turbo boost feature. In 2009 IEEE International Symposium on Workload Characterization (IISWC), pages 188–197. IEEE, 2009.