Forecasting COVID-19 Pandemic in Mozambique and Estimating Possible Scenarios
Abstract
COVID-19 is now the largest pandemic crisis of this century, with over 16 million registered cases worldwide. African countries have now begun registering an increasing number of cases, yet, not many models developed focus in specific African countries. In our study we use a simple SEIR model to evaluate and predict future scenarios regarding the pandemic crisis in Mozambique. We compare the effect of different policies on the infection curve and estimate epidemiological parameters such as the current infection reproduction number and the growth rate . We have found a low value for , ranging from 1.11 to 1.48 and a positive growth rate, between = 0.22 to 0.27. Our simulations also suggest that a lockdown shows potential for reducing the infection peak height in 28%, on average, ranging from 20 to 36%.
Keywords SEIR Mozambique COVID-19 Forecast Coronavirus
1 Introduction
The ongoing Coronavirus disease 2019 (COVID-19) pandemic crisis has now over 16 million registered cases worldwide and more than 600 thousand deaths, according to the situation report 186 by the World Health Organization (https://www.who.int/emergencies/diseases/novel-coronavirus-2019/situation-reports). COVID-19 is a respiratory disease caused by the SARS-CoV-2 virus, novel species of the betacoronavirus genus, it shows high affinity with Angiotensin converting enzyme 2 (ACE2) receptor in human cells [1, 2, 3]. The most probable origin of the virus was traced back to bat populations by genetic studies [4, 5], with the Pangolin being a probable intermediate host [6].
Nowadays, the disease presents a growing behavior throughout the African continent. With no recent scientific studies concerning the projection of the pandemic dynamics for Mozambique, local authorities must rely on international measures in order to control the spreading rate of COVID-19. This study aims at accessing the problem in Mozambique, estimating important epidemiological factors such as the growth rate and the current value of the infection reproduction number . Using a simple SEIR model including the dead compartment, we rely on daily epidemiological information available by the government (https://covid19.ins.gov.mz/documentos/); concerning the cumulative number of infections until July 24, cumulative number of recoveries and deaths, to forecast the possible futures the pandemic might take on the country.
Mathematical models are now worldwide used for forecasting [7, 8, 9, 10], data analysis [11] and economic impact [12, 13] regarding the current pandemic crisis. SIR and SEIR models are the most simple and used ones for evaluation of the outbreak dynamics [14]. Although more complex models are frequently employed and might yield more specific results; such as models concerning quarantine, asymptomatic and hospitalizations, these models make use of many unknown parameters, presenting a challenge when trying to copy reality in simulations.
2 Model Description
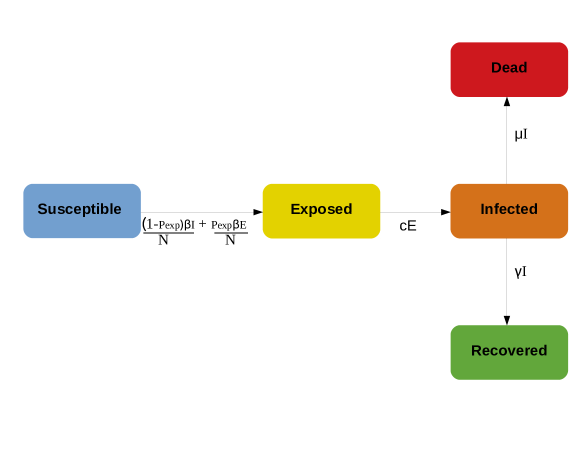
We apply a modified SEIR model to include deaths as a new compartment. The model relies on the following chain of events: A susceptible individual from a population of constant size is exposed to the virus, joining the exposed group, in which the person does not show symptoms of the disease yet, after some time (incubation period) this exposed person joins the infected group, where the symptoms onset. From this stage the patient either recovers or dies.
The model treats of populations, therefore these transitions between groups are given by rates of changes in a specific population. Susceptible individuals, denoted by , become infected through contact with infected () or exposed () individuals at a rate proportional to the density of infected and exposed , where is the percentage of infections caused by the exposed population and is the infection rate. The exposed population declines as patients become infected by a rate proportional to the inversion of the incubation period , with being the incubation period. Once inside the infected population, patients now transit to recovered () or dead () groups through constant rates and respectively. These rates are proportional to the infection fatality rate (IFR) and the average time taken from symptoms onset to recovery and the average time taken from symptoms onset to death (Figure 1).
The dynamics described by these populations is mathematically represented by the following set of differential equations
| (1) | ||||
| (2) | ||||
| (3) | ||||
| (4) | ||||
| (5) |
where and are given by
| (6) | ||||
These equations are subjected to a set of initial conditions at ; here we assume , , , and . An important consideration taken into account by the model is that the total population is constant, which can be noted by summing equations (1) - (5) and noticing that it equals to 0, therefore . From this type of model we retrieve the basic reproduction number, from which we calculate the current infection reproduction number using the current value for instead of the natural value without intervention policies, for the SEIRD model which was already derived in a previous work [15], where was made use of a method developed in [16], resulting in
| (7) |
Another important quantity derived from the model and widely used to access the growth of the outbreak in a particular region is the growth rate, given by
| (8) |
which states the difference between new infections and new outcomes from previous infections.
2.1 Non-Pharmaceutical Intervention
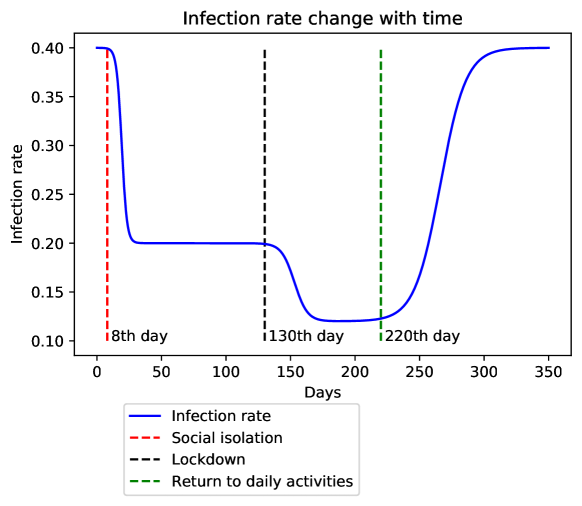
The next issue treated by our model is the description of non-pharmaceutical interventions such as social isolation and lockdown. We assume these actions alter the infection rate as time progresses; the core of the infection rate embeds the average daily contacts an individual has and the probability of being infected at each contact. Therefore, we consider a time-variant obeying a logistic behavior described by the following equation
| (9) |
where is the percentage of reduction suffered by as a result from the intervention, is the initial value , that is, the value would acquire without the intervention. Parameters , and are, respectively, the critical time when the intervention starts, the control on how fast decreases to the new value and a scale factor adjusted so the decrease of starts at the given date; here we choose and , with those parameters set the time taken for do decrease the desirable amount represented by would be approximately 10 days.
Considering this behavior we may represent the action of different non-pharmaceutical interventions based on their effectiveness and starting date. We might also add more logistic functions with different parameters and different sign for , in such a way to predict the ending of a given intervention policy.
3 Simulations
In order to simulate future scenarios and the actual tendency of Mozambique regarding the dynamics of the outbreak, we used a Python code freely available at https://github.com/PedroHPCintra/COVID-Mozambique. Using the non-linear least squares method, we fitted infected data constructed from the subtraction of the cumulative number by the recoveries and deaths (, where is the cumulative total), from the fit we acquired values of epidemiological parameter, allowing the acquisition of the growth rate and the infection reproduction number . After fitting the data, we used the fitted parameters to simulate the future tendency of behavior, as well as future scenarios developed in section 4.1.
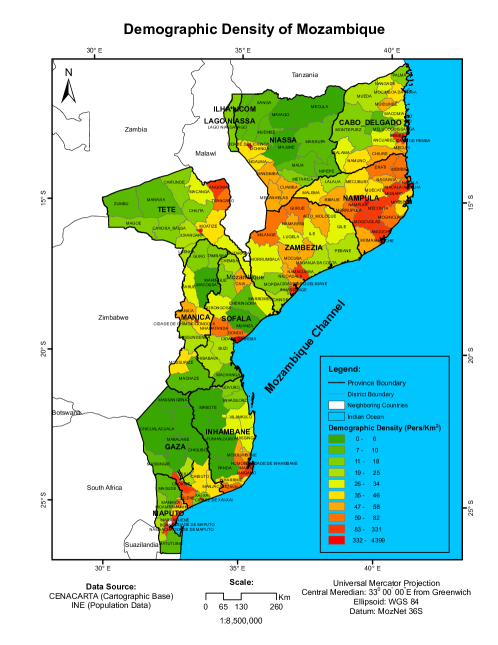
For the fitting we decided to leave the parameters , and free, while , , , , are given in table 1. The major problem with fitting data at initial stages of the pandemic is the computational estimation of , which in our case is approximated to the total population . The mathematical model presumes a homogeneously distributed population throughout the country, which is not a considerable reality, as shown in figure 2, thus, we cannot consider as being the total population of Mozambique; instead, plays the role of an effective population, which is the equivalent population of the country if the spatial distribution of people was indeed homogeneous.
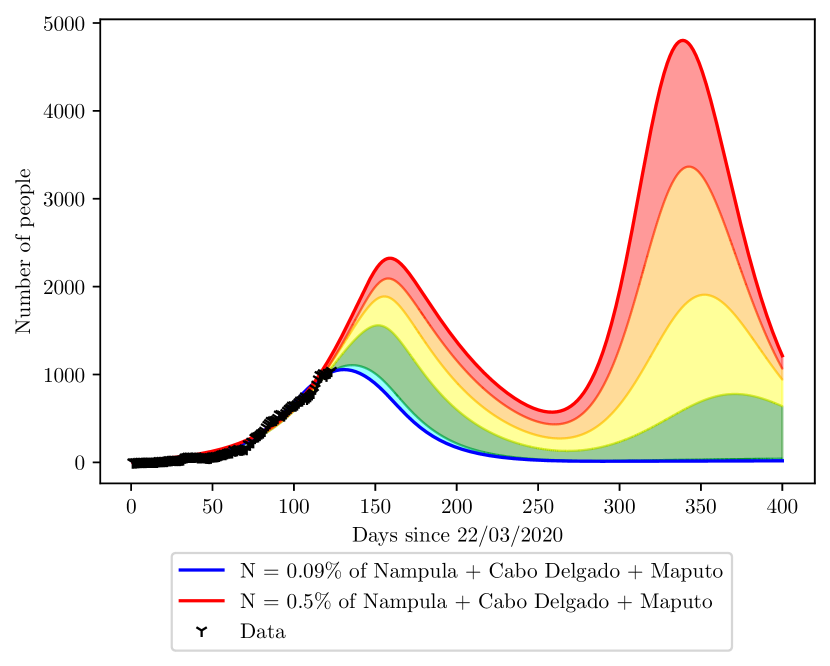
Aiming to solve this limitation, we ran several simulations using different fixed values of , ranging from of the population of Cabo Delgado + Maputo + Nampula to . The choice of these regions to represent the effective of Mozambique lies in the fact that they represent the vast majority of cases, that way, we approximate the population of Mozambique to be fractions of the populations of Nampula, Cabo Delgado and Maputo. At each stage, the of the fit was taken into account and, if it was lower than 0.98, the fit was discarded. In this way, we narrow the range of possible s that might describe this first pandemic wave. We discuss in more detail how changes during the pandemic in section 5.
| Parameter | Value | Reference |
|---|---|---|
| 0.5% | [17] | |
| 5.1 days-1 | [18, 19, 20, 21] | |
| 10 days | [22] | |
| 18 days | [23] | |
| 8 days | Local government decree | |
| 50% | [24] | |
| 44% | [25] |
Later, when simulating the possible scenarios in section 4.1, we added a second logistic drop to starting at the supposed date for a lockdown imposition, at the beginning of August. The drop decreased 20% more, that way the total decrease suffered by would be 70%, which is consistent with the efficacy of decrease lockdowns acquire, supposing that the decrease in 111 represents the change suffers due to intervention policies at the outbreak. While is specific for each disease and represents the spread without any intervention, changes with time due to intervention policies. or in the growth rate is due to a decrease in the infection rate [17]. Then, to simulate faster or slower re-openings, we considered the scenarios where the infection rate grows as fast as it decreased (fast re-opening) and the scenario where the infection rate grows 10 times slower than it decreased (slow re-opening); that is done by changing the parameter in a third logistic function with inverted sign at , representing a increase, instead of a drop.
4 Results
When performing the fitting, the minimum value of acceptable by the elimination was of the population, while the largest value was of the population. We then performed fittings considering , , , , and and , and as a initial guess; was chosen according to the observed value when fitting data from other countries with reliable data [26]. Our first adjustment of the current data yielded , and .
Having at hand, we calculated the range of and in Mozambique, using the known international values for , , and given by table 1.
| (10) | ||||
| (11) |
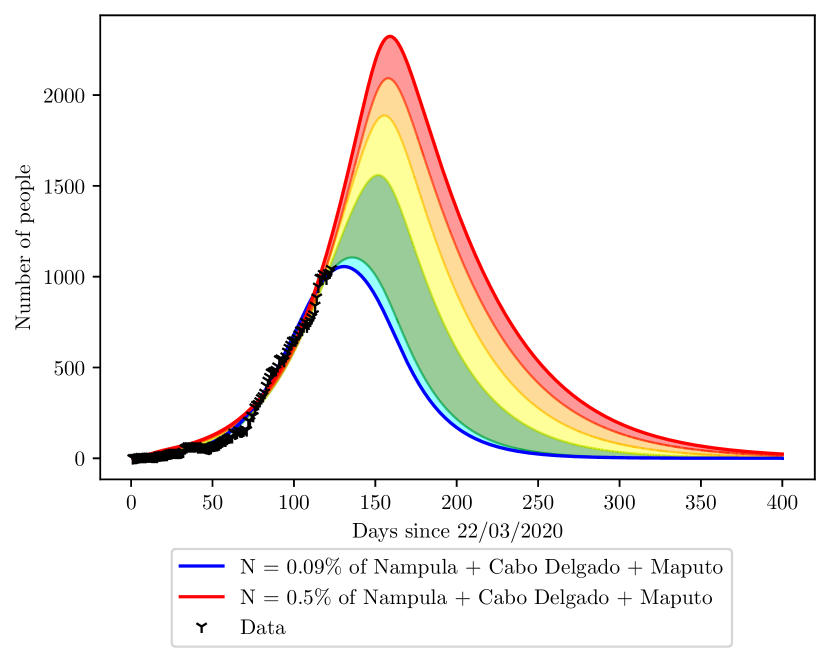
The results of the possible tendencies for the future behavior of the pandemic, according to the recent data, is shown at figure 4.
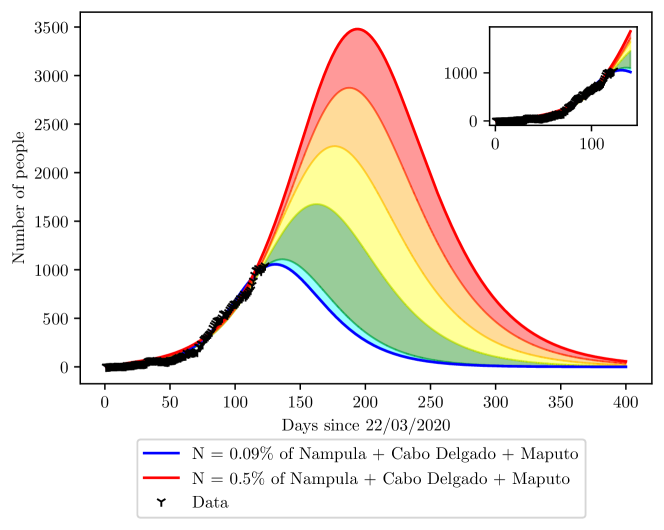
The current scenario predicted to Mozambique shows that the country might be close to an infection peak, given the current tendency; however it is also possible for the infection curve to increase at least for two more months and reach an infection peak close to 3500 cases, with a cumulative number of cases around 30000 after 400 days of pandemic.
4.1 Future Scenarios
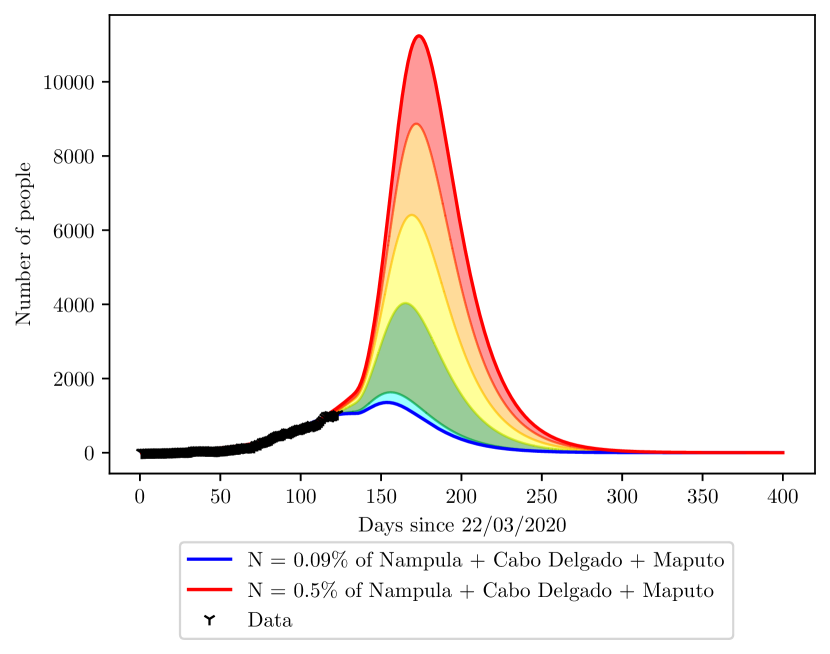
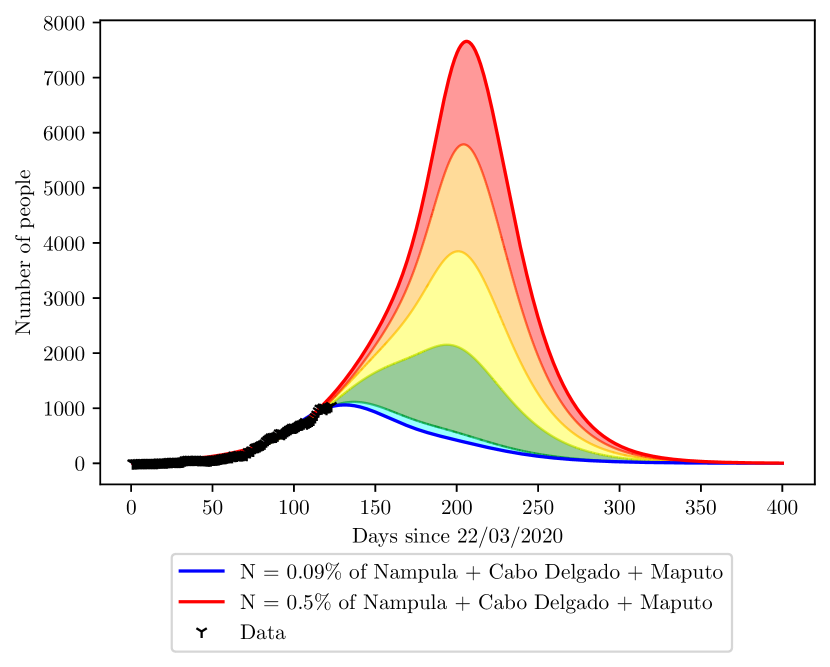
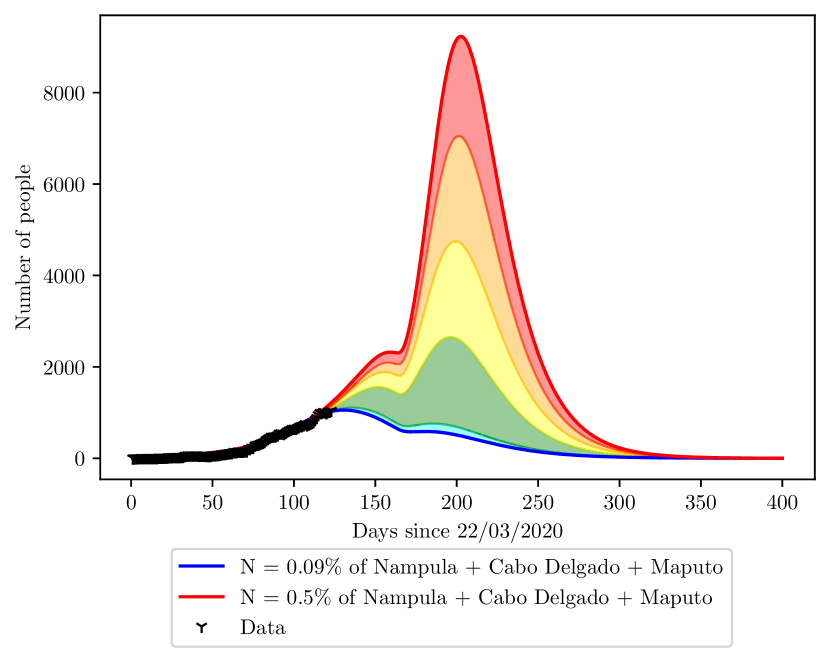
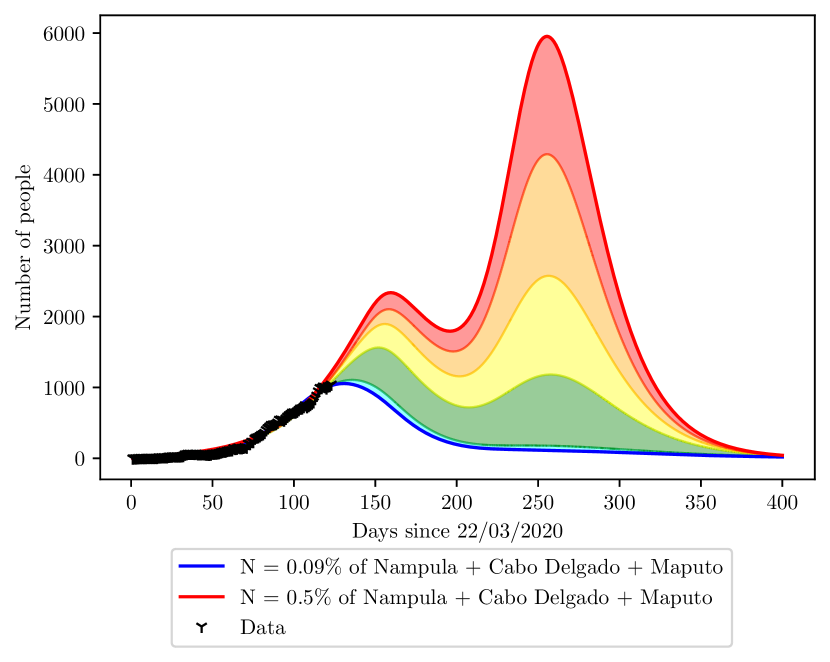
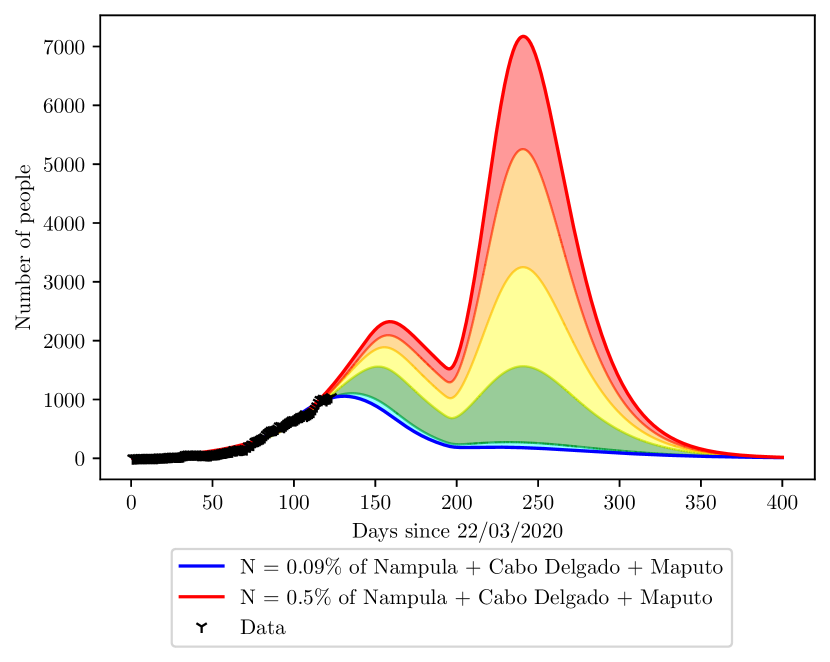
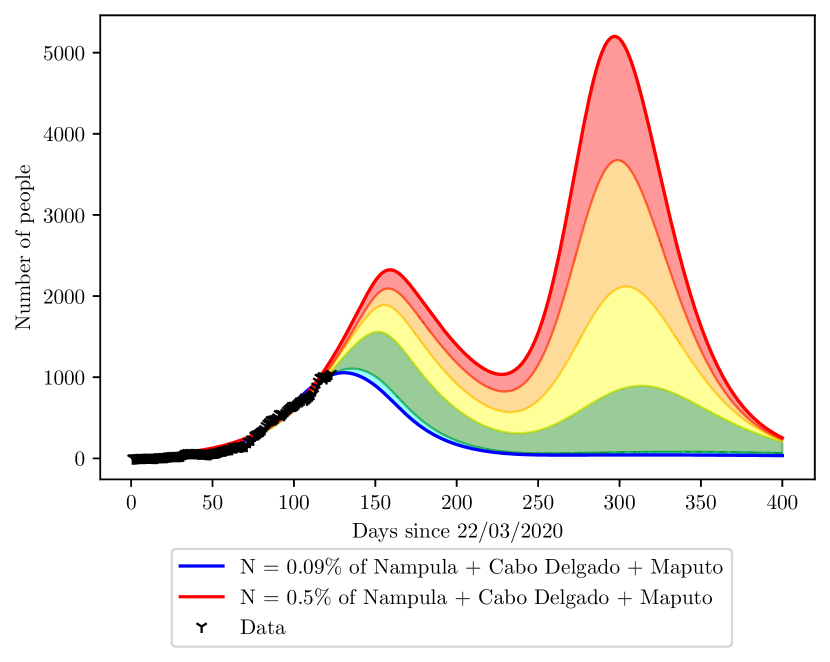
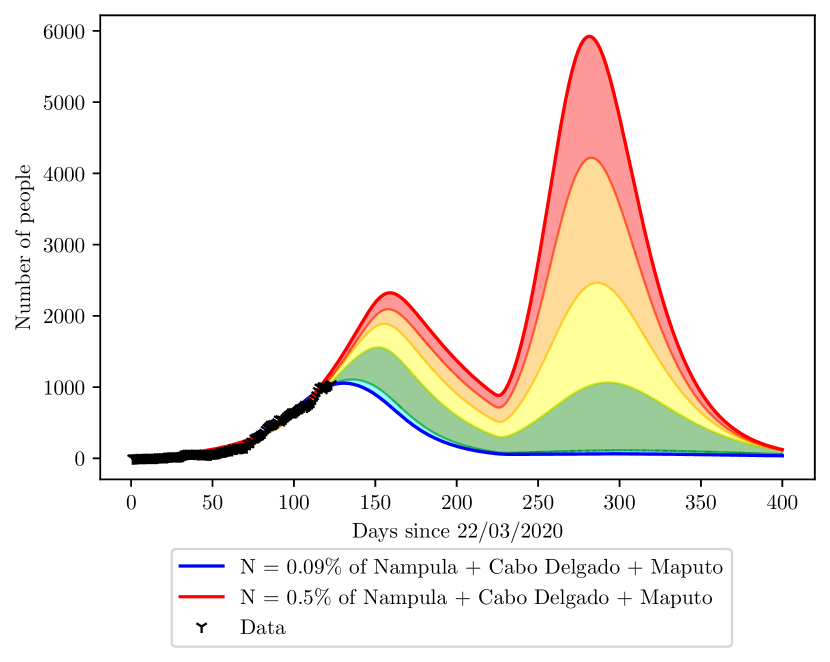
After the adjustment, we considered some other possible scenarios for the future behavior of the outbreak. The first was considering a national lockdown taking place at the beginning of August (Figure 7), the second was simulating a full re-opening of commerce, schools and daily life return in 10 days after the first day of August (Figure 7), the third scenario was a slower re-opening, 10 times slower than the previous case (Figure 7). The aim when considering these projections is to provide useful information for policy management when thinking about the future dynamics of the pandemic crisis.
According to these projections the return to daily activities on August could increase the total number of COVID-19 infections at the peak 3.4 times, depending on the effective , ranging from a 1.2 increase in peak height to 3.4. By the other hand, a slower return, according to the consideration in which the infection rate increases 10 times slower, could provoke an increase of the peak number from 0 to 2.3. Finally, the lockdown may decrease the infection peak to 60% of the current maximum tendency, which is represented by the red curve in figure 7. At the best scenario, represented by the blue and cyan curves in figure 7, we see that the lockdown would not affect the peak height, however it would result in a faster decrease of the infection curve after the peak.
As expected, a national lockdown cannot be held forever until the last infection registered due to economical costs. We then, estimated 6 scenarios for duration of a lockdown and re-opening; corresponding to a lockdown for 30, 60 and 90 days and the same situation considering 30, 60 and 90 days of lockdown with a slow return to daily activities (Figures 8(a) to 8(f)).
The projections show that a slower re-opening might decrease the second peak height by 36%, considering a lockdown that lasts 30 days, 29%, for 60 days duration, and 20% for a 90 days duration. On average, the gradual return to daily life shows the potential to decrease the second wave intensity by 28%.
Considering the duration of the lockdown, the longer the duration time for the intervention, the lower the second peak is after return.
5 Discussion
Our aim in this study is to evaluate the future dynamics of COVID-19 pandemic crisis in Mozambique. We have shown that simulations predict over 200% increase of peak intensity if commercial activities and daily life returns to normal in August, when compared to the tendency of cases. Moreover, lockdown policies and slower returns substantially decrease the peak intensity.
The main limitation of our study is the effective population susceptible to the disease. In the real situation, increases with time, as the disease progresses and the virus begging circulating in more interior regions. That behavior could provoke an increase in the susceptible population, causing more abrupt peaks and creating a bigger number of cumulative cases. Therefore, our estimations here should not be taken as a precise prediction regarding the numbers of infections, instead, we draw different scenarios and show how different policies might change the infection curve, given the recent data for Mozambique.
Another limitation lies on the data, which might be biased by a lower testing rate. However, to date, Mozambique performed 31.7 tests for each positive case, on average, which is close to Spanish numbers according to the online platform Ourworldindata (https://ourworldindata.org/coronavirus-testing). In countries known to have acquired a accurate tracking of cases, such as Germany, South Korea and Australia, these numbers jump to 191.9, 201.5 and 196.8, respectively. By the other hand, countries known to have a poor accuracy in tracking of cases such as Brazil and United States have 1.5 and 11.5 tests per confirmed case, respectively. We could estimated that Mozambique data is not perfect and might lose some cases, provoking changes on the future of the pandemic, however it is not poorly tracked.
The last limitation lies in the model and the algorithm itself; first, the model does not take into account infections caused by contact infected surfaces, which is known to be a viable source of infection due to viral persistence at inanimate surfaces [27]. Second, the algorithm used is simple and direct, but is susceptible to the nonidentifiability problem [28], which arises in non statistical fitting methods. However this is not expected to change drastically the shape of the curve.
Our study also found a positive growth rate, indication of a continuous growth of cases in Mozambique. The number is however low, suggesting a slow increase of infection curve. However, due to the lower number of infections, to date, Mozambique might still be on a stochastic limit of behavior, making the measurement of imprecise, but not very different from the value found here.
The infection curve might be close to the infection peak, considering the best scenario, however it is also possible to observe a prolonged increase, as the worse scenario curves have shown. It is not possible to say which curve the country will tend to follow, this mainly depends on the effective population in reach of the disease. Therefore, we highlight that our study represents simple views of the real scenario and should not represent the precise future of Mozambique, instead it should provide mere estimates for the possible behaviors.
Conflict of Interest
The authors declare no conflict of interest.
Funding
The study received no external funding or resources.
Acknowledgments
Our thanks to Francesse Mauro and Márcio Mathe, from the Department of Mathematics, course of Geographical Information System, in the Universidade Eduardo Mondlane, to providing us the map for the demographic density of Mozambique.
Cláudio Moisés Paulo thanks to the project Development in Africa with Radio Astronomy (DARA, https://www.dara-project.org/) and to the project Development of Palop Knowledge in Radioastronomy (DOPPLER222DOPPLER is funded by the Aga Khan Development Network and the Fundação para a Ciência e a Tecnologia (FCT), under grant number 333197717., http://doppler.av.it.pt/), for providing him equipment which was used for this study.
Additional Information
Our source code is freely available at https://github.com/PedroHPCintra/COVID-Mozambique.
References
- [1] Jun Lan, Jiwan Ge, Jinfang Yu, Sisi Shan, Huan Zhou, Shilong Fan, Qi Zhang, Xuanling Shi, Qisheng Wang, Linqi Zhang, et al. Structure of the sars-cov-2 spike receptor-binding domain bound to the ace2 receptor. Nature, 581(7807):215–220, 2020.
- [2] Qihui Wang, Yanfang Zhang, Lili Wu, Sheng Niu, Chunli Song, Zengyuan Zhang, Guangwen Lu, Chengpeng Qiao, Yu Hu, Kwok-Yung Yuen, et al. Structural and functional basis of sars-cov-2 entry by using human ace2. Cell, 2020.
- [3] Renhong Yan, Yuanyuan Zhang, Yaning Li, Lu Xia, Yingying Guo, and Qiang Zhou. Structural basis for the recognition of sars-cov-2 by full-length human ace2. Science, 367(6485):1444–1448, 2020.
- [4] Kristian G Andersen, Andrew Rambaut, W Ian Lipkin, Edward C Holmes, and Robert F Garry. The proximal origin of sars-cov-2. Nature medicine, 26(4):450–452, 2020.
- [5] Xiaolu Tang, Changcheng Wu, Xiang Li, Yuhe Song, Xinmin Yao, Xinkai Wu, Yuange Duan, Hong Zhang, Yirong Wang, Zhaohui Qian, et al. On the origin and continuing evolution of sars-cov-2. National Science Review, 2020.
- [6] Tommy Tsan-Yuk Lam, Na Jia, Ya-Wei Zhang, Marcus Ho-Hin Shum, Jia-Fu Jiang, Hua-Chen Zhu, Yi-Gang Tong, Yong-Xia Shi, Xue-Bing Ni, Yun-Shi Liao, et al. Identifying sars-cov-2-related coronaviruses in malayan pangolins. Nature, pages 1–4, 2020.
- [7] Jesús Fernández-Villaverde and Charles I Jones. Estimating and simulating a sird model of covid-19 for many countries, states, and cities. Technical report, National Bureau of Economic Research, 2020.
- [8] Kentaro Iwata and Chisato Miyakoshi. A simulation on potential secondary spread of novel coronavirus in an exported country using a stochastic epidemic seir model. Journal of Clinical Medicine, 9(4):944, 2020.
- [9] Affan Shoukat, Chad R Wells, Joanne M Langley, Burton H Singer, Alison P Galvani, and Seyed M Moghadas. Projecting demand for critical care beds during covid-19 outbreaks in canada. CMAJ, 192(19):E489–E496, 2020.
- [10] Patrick GT Walker, Charles Whittaker, Oliver Watson, M Baguelin, KEC Ainslie, S Bhatia, S Bhatt, A Boonyasiri, O Boyd, L Cattarino, et al. The global impact of covid-19 and strategies for mitigation and suppression. WHO Collaborating Centre for Infectious Disease Modelling, MRC Centre for Global Infectious Disease Analysis, Abdul Latif Jameel Institute for Disease and Emergency Analytics, Imperial College London, 2020.
- [11] Jonas Dehning, Johannes Zierenberg, F Paul Spitzner, Michael Wibral, Joao Pinheiro Neto, Michael Wilczek, and Viola Priesemann. Inferring change points in the spread of covid-19 reveals the effectiveness of interventions. Science, 2020.
- [12] Alexis Akira Toda. Susceptible-infected-recovered (sir) dynamics of covid-19 and economic impact. arXiv preprint arXiv:2003.11221, 2020.
- [13] Andrew Atkeson. What will be the economic impact of covid-19 in the us? rough estimates of disease scenarios. Technical report, National Bureau of Economic Research, 2020.
- [14] Cleo Anastassopoulou, Lucia Russo, Athanasios Tsakris, and Constantinos Siettos. Data-based analysis, modelling and forecasting of the covid-19 outbreak. PloS one, 15(3):e0230405, 2020.
- [15] PHP Cintra, MF Citeli, and FN Fontinele. Mathematical models for describing and predicting the covid-19 pandemic crisis. arXiv preprint arXiv:2006.02507, 2020.
- [16] Pauline Van den Driessche and James Watmough. Reproduction numbers and sub-threshold endemic equilibria for compartmental models of disease transmission. Mathematical biosciences, 180(1-2):29–48, 2002.
- [17] Henrik Salje, Cécile Tran Kiem, Noémie Lefrancq, Noémie Courtejoie, Paolo Bosetti, Juliette Paireau, Alessio Andronico, Nathanaël Hozé, Jehanne Richet, Claire-Lise Dubost, et al. Estimating the burden of sars-cov-2 in france. Science, 2020.
- [18] Qun Li, Xuhua Guan, Peng Wu, Xiaoye Wang, Lei Zhou, Yeqing Tong, Ruiqi Ren, Kathy SM Leung, Eric HY Lau, Jessica Y Wong, et al. Early transmission dynamics in wuhan, china, of novel coronavirus–infected pneumonia. New England Journal of Medicine, 2020.
- [19] Jantien A Backer, Don Klinkenberg, and Jacco Wallinga. Incubation period of 2019 novel coronavirus (2019-ncov) infections among travellers from wuhan, china, 20–28 january 2020. Eurosurveillance, 25(5), 2020.
- [20] Natalie M Linton, Tetsuro Kobayashi, Yichi Yang, Katsuma Hayashi, Andrei R Akhmetzhanov, Sung-mok Jung, Baoyin Yuan, Ryo Kinoshita, and Hiroshi Nishiura. Incubation period and other epidemiological characteristics of 2019 novel coronavirus infections with right truncation: a statistical analysis of publicly available case data. Journal of Clinical Medicine, 9(2):538, 2020.
- [21] Wei-jie Guan, Zheng-yi Ni, Yu Hu, Wen-hua Liang, Chun-quan Ou, Jian-xing He, Lei Liu, Hong Shan, Chun-liang Lei, David SC Hui, et al. Clinical characteristics of coronavirus disease 2019 in china. New England Journal of Medicine, 2020.
- [22] Adam Bernheim, Xueyan Mei, Mingqian Huang, Yang Yang, Zahi A Fayad, Ning Zhang, Kaiyue Diao, Bin Lin, Xiqi Zhu, Kunwei Li, et al. Chest ct findings in coronavirus disease-19 (covid-19): relationship to duration of infection. Radiology, page 200463, 2020.
- [23] Qiurong Ruan, Kun Yang, Wenxia Wang, Lingyu Jiang, and Jianxin Song. Clinical predictors of mortality due to covid-19 based on an analysis of data of 150 patients from wuhan, china. Intensive care medicine, pages 1–3, 2020.
- [24] Solomon Hsiang, Daniel Allen, Sébastien Annan-Phan, Kendon Bell, Ian Bolliger, Trinetta Chong, Hannah Druckenmiller, Luna Yue Huang, Andrew Hultgren, Emma Krasovich, et al. The effect of large-scale anti-contagion policies on the covid-19 pandemic. Nature, pages 1–9, 2020.
- [25] Xi He, Eric HY Lau, Peng Wu, Xilong Deng, Jian Wang, Xinxin Hao, Yiu Chung Lau, Jessica Y Wong, Yujuan Guan, Xinghua Tan, et al. Temporal dynamics in viral shedding and transmissibility of covid-19. Nature medicine, pages 1–4, 2020.
- [26] Pedro Henrique Pinheiro Cintra and Felipe Fontinele Nunes. Estimative of real number of infections by covid-19 on brazil and possible scenarios. medRxiv, 2020.
- [27] Günter Kampf, Daniel Todt, Stephanie Pfaender, and Eike Steinmann. Persistence of coronaviruses on inanimate surfaces and their inactivation with biocidal agents. Journal of Hospital Infection, 104(3):246–251, 2020.
- [28] Weston C Roda, Marie B Varughese, Donglin Han, and Michael Y Li. Why is it difficult to accurately predict the covid-19 epidemic? Infectious Disease Modelling, 2020.