Strong Calcium Emission Indicates that the Ultraviolet-Flashing Type Ia SN 2019yvq was the Result of a Sub-Chandrasekhar Mass Double-Detonation Explosion
Abstract
We present nebular spectra of the Type Ia supernova (SN Ia) SN 2019yvq, which had a bright flash of blue and ultraviolet light after exploding, followed by a rise similar to other SNe Ia. Although SN 2019yvq displayed several other rare characteristics such as persistent high ejecta velocity near peak brightness, it was not especially peculiar and if the early “excess” emission were not observed, it would likely be included in cosmological samples. The excess flux can be explained by several different physical models linked to the details of the progenitor system and explosion mechanism. Each has unique predictions for the optically thin emission at late times. In our nebular spectra, we detect strong [Ca II] 7291, 7324 and Ca NIR triplet emission, consistent with a double-detonation explosion. We do not detect H, He, or [O I] emission, predictions for some single-degenerate progenitor systems and violent white dwarf mergers. The amount of swept-up H or He is and M☉, respectively. Aside from strong Ca emission, the SN 2019yvq nebular spectrum is similar to those of typical SNe Ia with the same light-curve shape. Comparing to double-detonation models, we find that the Ca emission is consistent with a model with a total progenitor mass of 1.15 M☉. However, we note that a lower progenitor mass better explains the early light-curve and peak luminosity. The unique properties of SN 2019yvq suggest that thick He-shell double-detonations only account for of the total “normal” SN Ia rate. SN 2019yvq is one of the best examples yet that multiple progenitor channels appear necessary to reproduce the full diversity of “normal” SNe Ia.
1 Introduction
Type Ia supernovae (SNe Ia) are energetic thermonuclear explosions that have produced roughly half of the iron conent of the local Universe (e.g., Tinsley, 1980; Matteucci & Greggio, 1986), shape and heat the interstellar medium (e.g., Springel & Hernquist, 2003), and are excellent cosmological distance indicators from which we can constrain the nature of dark energy (e.g., Riess et al., 1998; Perlmutter et al., 1999; Scolnic et al., 2018; Jones et al., 2019). Major new facilities such as the Vera C. Rubin Observatory and the Nancy Grace Roman Space Telescope are being designed with SN Ia observations being a top priority (Spergel et al., 2015; Hounsell et al., 2018; Ivezić et al., 2019). Despite their critical importance in element creation, galaxy feedback, and cosmology, we still do not know the precise progenitor system and explosion mechanism for SNe Ia.
From both theory and observations, we know that SNe Ia come from C/O white dwarfs (WDs) in binary systems (Hoyle & Fowler, 1960; Colgate & McKee, 1969; Nomoto et al., 1984; Nugent et al., 2011; Bloom et al., 2012). The companion star may be another WD (i.e., the double-degenerate or DD scenario; Iben & Tutukov, 1984; Webbink, 1984) or a non-degenerate star (i.e., the single-degenerate or SD scenario; Whelan & Iben, 1973; Iben & Tutukov, 1996). There is strong observational evidence that DD progenitors are responsible for at least some individual SNe Ia (e.g., Li et al., 2011; Schaefer & Pagnotta, 2012; Kelly et al., 2014; Jacobson-Galán et al., 2018), while some SNe Ia almost certainly came from SD systems (e.g., Dilday et al., 2012; Graham et al., 2019; Kollmeier et al., 2019). Population studies also have somewhat conflicting results where SD and DD progenitor systems may produce SNe Ia at roughly similar rates (e.g., Maoz & Mannucci, 2008; Foley et al., 2012a).
An additional dimension is the explosion mechanism. While the explosion must be triggered through mass transfer, this can be done quickly or slowly, with hydrogen or helium, and the explosion can start near the center of the star or at the surface, and the primary WD can vary in mass from about 0.7–1.4 M☉.
Despite the mélange of progenitor systems and explosion mechanisms, the near-peak luminosity spectral-energy distributions from multi-dimensional radiative-hydrodynamical explosion simulations appear generally similar to each other and observations. These predicted observables diverge some for epochs only a few days after explosion. In particular, some models predict a smooth increase in flux from explosion to peak, while others have “excess” flux relative to the smooth models for the first few days after explosion. In particular, this excess flux can be generated by interaction with a non-degenerate companion (if viewed from a particular position; Kasen, 2010), interaction with circumstellar material (Raskin & Kasen, 2013; Piro & Morozova, 2016), a violent merger of two WDs (Kromer et al., 2016), radioactive 56Ni in the outer layers of the ejecta (Piro & Morozova, 2016; Noebauer et al., 2017), or a “double-detonation” where a surface He layer explosively burns, causing a second explosion in the interior of the WD (Woosley & Kasen, 2011; Nomoto & Leung, 2018; Polin et al., 2019a).
Wide-field, high-cadence surveys have recently discovered several examples of SNe Ia with this signature (Marion et al., 2016; Hosseinzadeh et al., 2017; Dimitriadis et al., 2019a; Shappee et al., 2019) and additional peculiar thermonuclear WD SNe with excess flux (Cao et al., 2015; Jiang et al., 2017). While the different scenarios described above predict different durations, luminosities, and colors, the differences are subtle enough that current data sets cannot adequately distinguish between the scenarios (or the predictions all diverge significantly from the observations). However, these models predict vastly different observables at late times (150 days after explosion). In particular, interaction models predict strong H or He emission lines (Mattila et al., 2005; Leonard, 2007; Botyánszki et al., 2018), the violent merger should have significant unburned material and thus strong [O I] lines (Maeda et al., 2008; Taubenberger et al., 2009), while a double-detonation can have incomplete core burning and produce a significant amount of Ca throughout the ejecta leading to strong [Ca II] lines (Polin et al., 2019b). Such analyses were performed for the normal SNe Ia 2017cbv and 2018oh that had early excess flux, but none of the signatures outlined above were seen (Sand et al., 2018; Dimitriadis et al., 2019b; Tucker et al., 2019).
While [O I] and H emission lines have been detected in nebular spectra of SNe 2010lp (Taubenberger et al., 2013a) and 2018fhw (Kollmeier et al., 2019; Vallely et al., 2019), respectively, there has not been an unambiguous detection of strong [Ca II] similar to predictions for models of double-detonations. The [Ca II] 7291, 7324 doublet overlaps with the 7300 Å emission complex which is often understood to be the blending of [Fe II] and [Ni II] emission lines in normal SNe Ia. This feature appears stronger in low-luminosity SNe Ia and is likely caused by the additional presence of a [Ca II] component (Mazzali et al., 1997; Blondin et al., 2018). The detection of [Ca II] is further complicated by diversity in morphologies observed in the 7300 Å feature. This feature often exhibits multiple peaks which are commonly attributed to different elemental species, however, in some cases studies have suggested that asymmetric ejecta distributions could be the cause of double-peaked nebular features (Dong et al., 2015; Mazzali et al., 2018; Vallely et al., 2020).
Radiative transfer calculations of bare low-mass C/O WD detonations and double-detonations of WDs with thin He shells reproduce many of the photospheric properties of typical and low-luminosity SNe Ia (Shen et al., 2018a; Townsley et al., 2019). Specifically, the light curves presented in Shen et al. (2018a) exhibit a relationship between peak luminosity and decline rate that is in general agreement with the Phillips (1993) relation. Their synthetic spectra of normal and low-luminosity SNe Ia also show similar line ratios and velocities to observed SNe Ia. However, Polin et al. (2019a) show that double-detonation explosions from progenitors with thin or thick He shells may produce a subclass of SNe Ia with distinct properties of velocity, color, and polarization (Cikota et al., 2019). They also show that massive He shells are needed in order to produce the early-time “flux excess” seen in several SNe Ia. These models also predict a strong component of [Ca II] emission in the nebular phase (Polin et al., 2019b).
SN 2019yvq, which had a flash of ultraviolet and blue light a few days after explosion (Miller et al., 2020), provides an excellent opportunity to test these theories through its nebular spectrum. SN 2019yvq is relatively normal, but has some remarkable features in addition to its early light curve. In particular, it has a relatively low peak luminosity of mag but high ejecta velocities (Miller et al., 2020). Nevertheless, SN 2019yvq is not so obviously distinct from typical SNe Ia as to be removed from cosmology samples. At a phase of days after peak luminosity, we obtained a Keck spectrum of SN 2019yvq, which has strong [Ca II] emission unlike typical SNe Ia.
We present observations of SN 2019yvq, including the late-time Keck spectrum in Section 2. We compare SN 2019yvq to other SNe Ia and models in Section 3, demonstrating that SN 2019yvq was likely casued by a double-detonation explosion. We discuss the implications of our observations and conclude in Section 4.
Throughout this paper, we adopt the AB magnitude system, unless where noted, and mag as the distance modulus to NGC 4441 (the host galaxy of SN 2019yvq; Miller et al. 2020).
2 Observations & Data Reduction
We obtained two optical spectra of SN 2019yvq on 2020 Jun 17 UT, with the Low Resolution Imaging Spectrometer (LRIS; Oke et al., 1995), mounted on the 10-meter Keck I telescope at the W. M. Keck Observatory. At that date, the SN was 153 rest-frame days past peak brightness (2020 Jan 15.25 UT; Miller et al., 2020). We observed SN 2019yvq with a low-resolution setting (1800 and 1430 s blue channel exposures with the B600/4000 grism and two 525 s red channel exposures with the R400/8500 grating, with pixel scales of 0.63 and 1.16 Å/pixel, respectively) and a high-resolution setting (two 825 s red channel exposures with the R1200/7500 grating, with a pixel scale of 0.4 Å/pixel). We used the 1.0′′-wide slit and the D560 dichroic for all observations, and oriented the slit to include the host-galaxy nucleus. The atmospheric dispersion corrector unit was deployed. The low-resolution spectrum covers 3,400 – 10,056 Å, while the high-resolution spectrum covers 6,200 – 7,800 Å, including H, He I 6678, [O I] 6300, 6364 and the 7300 Å line complex, the primary focus of our current analysis. All data were reduced using standard iraf111IRAF is distributed by the National Optical Astronomy Observatory, which is operated by the Association of Universities for Research in Astronomy (AURA) under a cooperative agreement with the National Science Foundation. and python routines for bias/overscan corrections, flat fielding, flux calibration and telluric lines removal, using spectro-photometric standard star spectra, obtained the same night (Silverman et al., 2012)
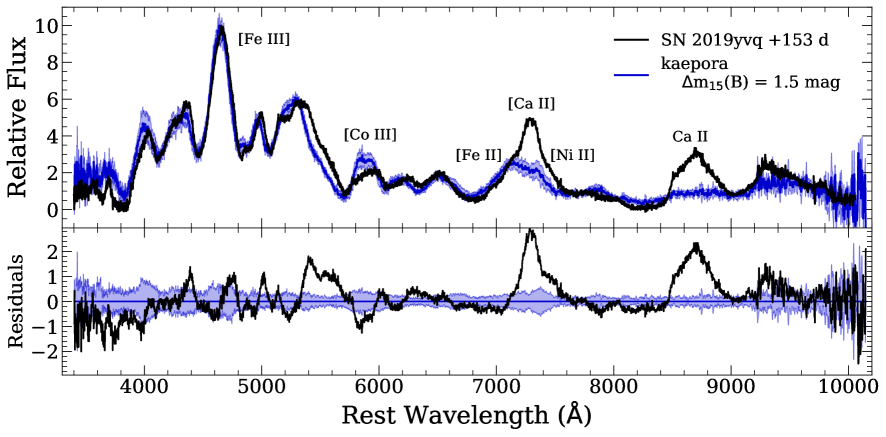
We present the low-resolution spectrum in Figure 1. The high-resolution spectrum is nearly identical other than its resolution and limited wavelength range.
The nebular spectrum of SN 2019yvq is generally similar to those of other SNe Ia at a similar epoch, including strong line emission from forbidden singly- and doubly-ionized Fe-group elements. At this epoch, the spectrum is likely still evolving, but the lack of obvious P-Cygni profiles indicates that the ejecta are mostly or completely optically thin.
Unlike other “normal” SNe Ia, SN 2019yvq has clear and strong [Ca II] 7291, 7324 and Ca II NIR triplet emission. We discuss these feature, the connection to a double-detonation explosion, and the lack of signatures from other progenitor channels in the following sections.
3 Analysis
3.1 Photometric comparisons
SN 2019yvq had a lower peak luminosity than typical SNe Ia ( mag; Miller et al., 2020). Miller et al. (2020) measured a corresponding, relatively fast -band ( mag). Most historical SNe Ia lack a measurement, and so it is difficult to make direct comparisons with other SNe Ia with similar light-curve shape. Miller et al. (2020) used the Yao et al. (2019) relationship between and to estimate mag for SN 2019yvq. This analysis was limited by the lack of fast-declining SNe Ia in the Yao et al. (2019) sample, preventing a precise measurement.
Using a sample of SNe Ia with both and light curves (Folatelli et al., 2013), we select a subset of five SNe Ia with similar -band light curves. These SNe Ia have an average mag with an RMS of mag, consistent with the Miller et al. (2020) estimate. We use our derived estimate as the -band decline rate for SN 2019yvq.
3.2 Spectroscopic comparisons
Using the methods of Siebert et al. (2019), we generate a composite spectrum using kaepora222https://msiebert1.github.io/kaepora/ to best match the phase and decline rate of SN 2019yvq and compare in Figure 1. Aside from the clear Ca emission, SN 2019yvq has remarkably similar line shifts, line widths, and relative feature strengths to those in the kaepora mag composite spectrum.
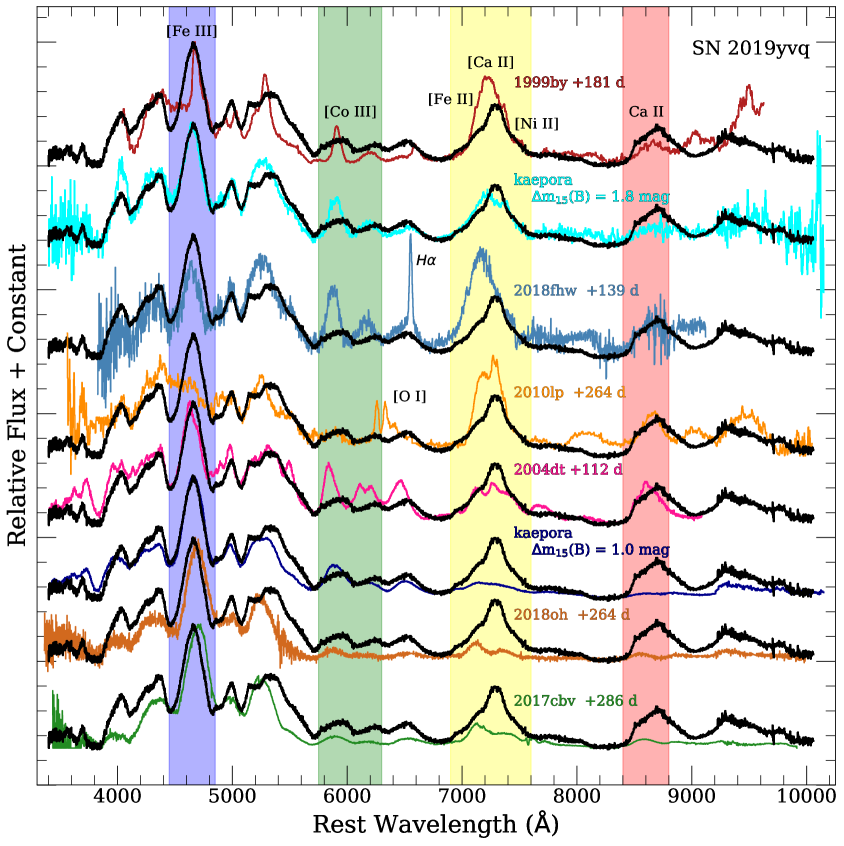
While the optical spectrum of SN 2019yvq at +153 days is generally similar to other SN Ia spectra at similar epochs, the morphology of the 7300 Å line complex is unique compared to all other known SN Ia nebular spectra. In Figure 2 we compare this spectrum to a diverse set of SN Ia nebular spectra. The SN 2019yvq spectrum is similar to those of typical SNe Ia and composite spectra in regions without Ca emission. While some peculiar SNe Ia appear more similar to SN 2019yvq in wavelength regions corresponding to Ca emission, their spectra are less similar at other wavelengths.
Examining the peculiar SNe Ia in more detail, we highlight similarities and differences with SN 2019yvq. Figure 2 displays spectra from SNe 1999by ( mag; Garnavich et al. 2004), a low-luminosity SN 1991bg-like SN Ia; 2010lp ( mag; Kromer et al. 2013; Pignata et al., in preparation), a peculiar SN 2002es-like (Ganeshalingam et al., 2012) SN Ia that had strong [O I] 6300, 6364 emission in its late-time spectrum (Taubenberger et al., 2013b) indicating significant unburned material; and 2018fhw ( mag; Kollmeier et al. 2019), which had strong H emission in its late-time spectrum indicating circumstellar interaction (Kollmeier et al., 2019; Vallely et al., 2019). The nebular spectra of SNe 1999by and 2018fhw are very similar overall, except for the strong H emission seen for SN 2018fhw. These spectra show the general trends seen in other SN 1991bg-like nebular spectra of narrower features, stronger [Co III] emission relative to [Fe III], and a stronger 7300 Å emission complex. SN 2010lp is somewhat different with very weak (perhaps absent) [Fe III] emission, but shares other characteristics. Other than the strong emission near 7300 Å, the SN 2019yvq spectrum does not have the distinct properties of low-luminosity SN Ia spectra, including the peculiar SNe 2010lp and 2018fhw. Of these comparison spectra, the kaepora composite spectrum with mag best reproduces the ratio of the 7300 Å line complex to the [Fe III] peak, and it is possible that the SNe contributing to the composite spectrum contain a similar contribution from [Ca II] as for SN 2019yvq.
Alternatively, Figure 2 also compares the spectrum of SN 2019yvq to higher-luminosity SNe Ia, including some relatively peculiar SNe. We compare to SNe 2004dt, a high-velocity and high-polarization SN Ia (Wang et al., 2006; Altavilla et al., 2007) that is an outlier when comparing its peak-light velocity gradient and nebular-line velocity shifts (Maeda et al., 2010b); 2017cbv, which had an early blue flux excess days after explosion (Hosseinzadeh et al., 2017); and 2018oh, which also had a distinct flux excess at early times (Dimitriadis et al., 2019a; Shappee et al., 2019). Except for the Ca features, the SN 2019yvq spectrum is similar to that of these comparison SNe (although SN 2004dt shows more differences, which may be caused by its relatively early phase). We also compare the SN 2019yvq spectrum to a kaepora composite spectrum with mag showing striking similarity except for the Ca emission. We note that the flux at Å appears to be strongly correlated with phase. SN 2019yvq shows the best agreement in this wavelength range with SNe 2018fhw and SN 2004dt, which have phases of 139 and 112 days, respectively, significantly earlier than many of the other comparison spectra.
The width and relative strength of [Fe III] in SN 2019yvq is most similar to SNe 2004dt, 2011fe, and 2017cbv. Both SN 2019yvq and SN 2017cbv exhibited early blue bumps in their light-curves, however, only SN 2019yvq shows prominent Ca II features. Of the SNe displayed, only SNe 2004dt, 2010lp, and 2019yvq show prominent Ca II near-infrared triplet emission.
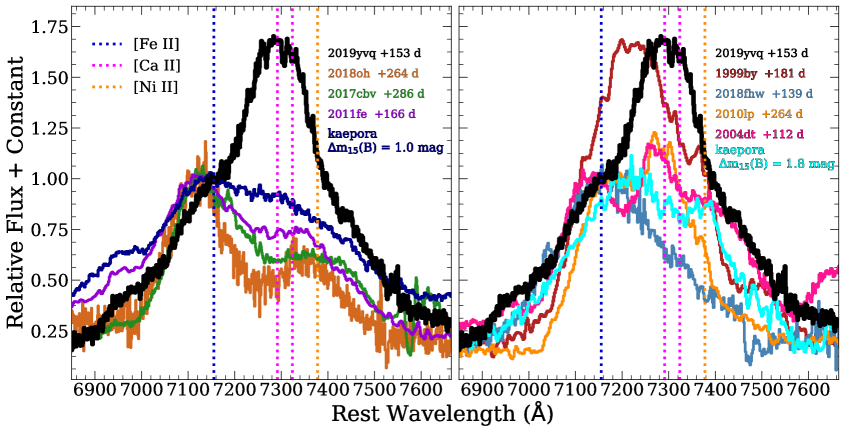
We examine the 7300 Å emission feature in detail in Figure 3. The spectra of the higher-luminosity comparison SNe (SNe 2011fe, 2017cbv, 2018oh, and the kaepora mag composite spectrum) are distinct from that of SN 2019yvq with the comparison spectra having obvious [Fe II] and [Ni II], but lacking significant [Ca II] emission. This is in contrast to SN 2019yvq, which has strong [Ca II] emission in addition to the [Fe II] and [Ni II] emission.
In Figure 3, we also display the 7300 Å emission feature, comparing SN 2019yvq to the lower-luminosity and peculiar SNe Ia from Figure 2. Each of these SNe has possible [Ca II] emission, but all comparison spectra are still distinct from the SN 2019yvq spectrum. In particular, SNe 1999by and 2018fhw have strong emission peaking around 7220 and 7160 Å, respectively, much bluer than SN 2019yvq, which peaks at 7287 Å. While it is possible SNe 1999by and 2018fhw have strong [Ca II] , 7324 emission, the emitting material would be blueshifted by and km s-1, respectively, which would be some of the highest velocity shifts seen for a SN Ia (Maeda et al., 2010a; Maguire et al., 2018), and is inconsistent with shifts from other spectral features. Instead, it is more likely that there is significant contribution from [Fe II] 7155.
SNe 2004dt and 2010lp have more obvious [Ca II] , 7324 emission with peaks at 7290 Å, corresponding to velocity shifts of and km s-1, respectively. However, SN 2019yvq has significantly stronger [Ca II] emission relative to [Fe II] and [Ni II] than SNe 2004dt and 2010lp. We also caution that SN 2004dt has significant velocity offsets and polarization, and it is possible that the emission peak for that particular spectrum is caused by an asymmetric and kinematically extreme ejecta distribution.
There is a general trend between peak luminosity and the 7300 Å profile shape with lower-luminosity SNe Ia having stronger emission at these wavelengths relative to other features (see Figure 2; Polin et al., 2019b). SN 2019yvq conforms to this trend. However, no other SN Ia is so sufficiently dominated by [Ca II] emission at these wavelengths.
SN 2019yvq has a similar [Ca II]/[Fe II] strength to some SNe Iax (Foley et al., 2016), albeit the lines have much larger velocity widths for SN 2019yvq. Other (presumably) white-dwarf SNe such as Ca-rich SNe (e.g., Perets et al., 2010) and SN 2016hnk (Jacobson-Galán et al., 2020) also have strong [Ca II] emission at late times, but are generally different from SN 2019yvq and SNe Ia in most regards (e.g., peak luminosity, light-curve behavior, He abundance).
The blue and red slopes of the Ca-deficient spectra in this wavelength range seem to agree well with the shoulders of the line complex of SN 2019yvq. Additionally, the spectrum of SN 2011fe and the kaepora composite spectrum with mag show some evidence for excess emission from 6900-7050 Å. These spectra have phases of +166 days and +140 days, respectively, which are very similar to the spectrum of SN 2019yvq at +153 days. Therefore, this could be a feature that is more likely to be observed at early times. All of the Ca-deficient spectra have [Fe II] emission components that appear blueshifted relative to SN 2019yvq.
3.3 Fitting the 7300 Å Line Complex
The complicated morphology of the 7300 Å line complex allows us to decompose it into emission from different species. Doing this, we can examine the contribution from [Ca II].
We fit this feature using the following methodology. First, we smooth the spectrum with a 15 Å scale and choose continuum points on the red and blue sides of the feature. We divide by this linear continuum and use Gaussian profiles to approximate the forbidden line emission from [Fe II], [Ca II], and [Ni II]. For this analysis we assume that the following lines dominate this fitting region: [Fe II] (7155, 7172, 7388, 7453 Å), [Ca II] (7291, 7324 Å), and [Ni II] (7378, 7412Å). We used the rest wavelengths and transition probabilities from the NIST Atomic Spectra Database333https://www.nist.gov/pml/atomic-spectra-database. The strengths of lines for each element are defined relative to the strongest line, which is a single free parameter for each species. We assume that lines produced by unique ionization states of each element are produced in the same regions of the ejecta, and we therefore require that the velocity offsets and widths relative to the rest-frame wavelength of each line be the same for lines coming from the same species. Since [Fe II] and [Ni II] emission are likely produced in the same region of the ejecta (Maeda et al., 2010a), we fit for a single [Fe II] and [Ni II] velocity offset. Thus, we fit for a total of 8 parameters: the emission strength, velocity offset ([Fe II] and [Ni II], and [Ca II]), and velocity width of each species. To estimate uncertainties for these parameters, we performed a simple Monte-Carlo algorithm to vary the blue and red continuum points randomly by up to 100 Å and repeating the analysis
Figure 4 displays the best-fit Gaussian component model to the 7300 Å line complex. The best-fit values of velocity offsets and widths are presented in subsection 3.3. This simple model matches the line profile extremely well.

| Species | Velocity Offset (km s-1) | Width (km s-1) |
|---|---|---|
| Fe II | ||
| Ni II | ||
| Ca II |
To match the data and in particular the peak of the emission, a strong [Ca II] component is necessary. Since Fe-group elements are expected to be produced in similar regions of the ejecta, it is reassuring that our fit produces similar velocity widths for [Fe II] and [Ni II] ( and km s-1, respectively). Additionally, the relative strength of [Fe II] to [Ni II] is consistent with other fits in the literature that use similar methods to fit this feature (Maguire et al., 2018). The sum of the the [Fe II] and [Ni II] components result in a profile that is qualitatively similar to 7300 Å line profiles of typical SNe Ia at similar epochs. In particular, the kaepora mag composite spectrum, and the nebular spectrum of SN 2011fe (Figure 3, left panel, blue curve and purple curve, respectively) have the most similar morphology to our [Fe II] + [Ni II] component. Similar to the nebular spectrum of SN 2019yvq at +153 days, the kaepora mag composite spectrum has a effective phase of +138 days, and the SN 2011fe spectrum is at +166 days.
All three species (Fe II, Ni II, and Ca II) are blueshifted relative to the rest frame. Maeda et al. (2010a) found that nebular line shifts are correlated with velocity gradient. Blondin et al. (2012), Silverman et al. (2013a), and Maguire et al. (2018) supported this result by showing that high-velocity SNe Ia are more likely to have redshifted nebular lines. Given that SN 2019yvq exhibited a high ejecta velocity at peak brightness of about km s-1 (Miller et al., 2020), a blueshifted nebular velocity is atypical — similar to how its red intrinsic color at peak is atypical for this high velocity (Foley & Kasen, 2011; Foley et al., 2011).
The full complex of SN 2019yvq cannot be fit without [Ca II] emission, unlike what is seen for most SNe Ia (e.g., Maguire et al., 2018; Flörs et al., 2020). Furthermore, the additional presence of strong Ca II near-infrared triplet emission provides more evidence that the strong component of the 7300 Å line profile is caused by [Ca II]. Other low-luminosity SNe Ia such as SNe 1991bg and 1999by have strong emission in this region reminiscent of SN 2019yvq and this is often attributed to [Ca II] (e.g., Filippenko et al., 1992; Turatto et al., 1996), it is not easily reproduced by (only) [Ca II] (Mazzali et al., 1997). However, Blondin et al. (2018) presented model spectra of SN 1999by where [Ca II] dominated this feature with an additional strong component from [Ar III] 7136. Currently there is no unambiguous, dominant [Ca II] emission in a SN 1991bg-like SN Ia. Moreover, [Ar III] 7136 is not a strong line in the SN 2019yvq spectrum.
Alternatively, [Ca II] has been clearly detected in several peculiar SNe Ia and SNe Iax (Taubenberger et al., 2013a; Foley et al., 2016; Galbany et al., 2019; Jacobson-Galán et al., 2020), indicating that this feature is detectable at the expected wavelength under the correct physical conditions. SN 2016hnk and SNe Iax are both connected to He burning (Foley et al., 2013, 2016; Jacobson-Galan et al., 2019; Jacobson-Galán et al., 2020), perhaps further indicating SN 2019yvq is the result of a double-detonation.
Wilk et al. (2020) argued that the presence of [Ca II] blended with the 7300 Å line complex allows for the constraint of the ionization ratio. They suggest that for , [Fe II] is expected to dominate this feature yet for prominent [Ca II] blending is expected. Thus, the unambiguous detection of both [Fe II] and [Ca II] in SN 2019yvq may allow us to constrain the number ratio of ionized Fe to Ca, , to between 50 and 100. Wilk et al. (2020) also found that significant clumping of the ejecta is a natural way to decrease ionization resulting in stronger Ca emission as [Ca II] becomes the dominant cooling for regions rich in IMEs.
3.4 Mass Limits For Swept-up Circumstellar Material
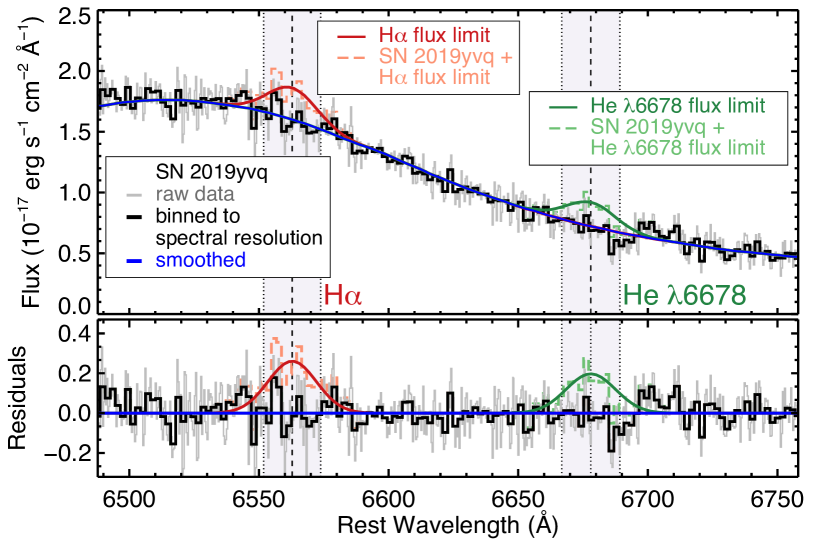
A visual inspection of the late-time SN 2019yvq spectra shows no obvious hydrogen or helium emission at the redshift of the SN. We can, alternatively, constrain the amount of swept-up material from a potential companion to the exploding WD, following the procedure described in several SNe-Ia nebular studies (Mattila et al., 2005; Leonard, 2007; Shappee et al., 2013; Maguire et al., 2016; Graham et al., 2017; Sand et al., 2018; Dimitriadis et al., 2019b; Tucker et al., 2020) as follows: Firstly, we estimate the brightness of SN 2019yvq at +200 days past explosion in order to compare our data with the models from Botyánszki et al. (2018). While our spectrum was taken at 170 days from explosion, the late-time spectral features of SNe Ia do not change significantly between these epochs, thus the general spectral shape of SN 2019yvq at +200 days should be similar. We use the public and photometry after +60 days from maximum, when the SN is in the radioactive cobalt decay regime, correct for MW and host extinction (using the values from Miller et al. 2020) and linearly fit, estimating mag and mag. Finally, we warp our late-time spectrum to match these estimated photometric colors.
To determine the mass limits, we follow the procedure outlined by Dimitriadis et al. (2019b). Briefly, using the flux-calibrated, extinction- and redshift-corrected spectrum, we bin to the spectral resolution. Our high-resolution spectrum has FWHM spectral resolution of 1.95 Å (as determined from isolated night-sky lines). The pixel scale is 0.4 Å, and thus not limiting the resolution. We determine the continuum by smoothing on a 195 Å scale. Comparing the smoothed spectrum to the unsmoothed version, we do not detect any significant emission features expected from the interaction scenario. Approximating possible emission features as Gaussians with FWHMs of 1000 km s-1, we determine the 3- flux limit. Using the luminosity distance from Miller et al. 2020, we estimate the H and He I luminosity limits (at 200 days) to be 1.33 and erg s-1, respectively. Using Equation 1 of Botyánszki et al. (2018), we convert these luminosity limits to mass limits, and we determine that SN 2019yvq had stripped hydrogen and helium mass of and M☉, respectively. These results are displayed in Figure 5.
3.5 Comparison to Double-Detonation Model
In this section we examine SN 2019yvq in the context of double-detonation explosions. The double-detonation scenario requires a WD to accrete a surface shell of helium from a binary companion. An ignition in this helium shell can send a shock front into the WD which ignites the C/O core when it converges (Woosley & Weaver, 1994; Nomoto, 1982). The double-detonation mechanism has been considered as a possible channel for some Type Ia SNe, and recently the presence of strong [Ca II] emission has been pointed to as an identifying signature of these explosions in the nebular phase (Polin et al., 2019b).
We compare the event to the explosion models of Polin et al. (2019a) who use the hydrodynamics code Castro (Almgren et al., 2010) to simulated double-detonation explosions for a large parameter space of WD and He shell masses. Polin et al. (2019b) examines these explosion models in the nebular phase using the radiation transport code Sedona (Kasen et al., 2006) paired with the NLTE nebular tool SedoNeb (Botyánszki & Kasen, 2017) to evolve the homologus ejecta to nebular times while calculating the gamma-ray transport of radioactive decay products. Then SedoNeb is used to calculate the emissivities of each atomic transition by solving for the temperature, ionization state, and NLTE level populations. The final step is to integrate this emission to determine the wavelength-dependent flux.
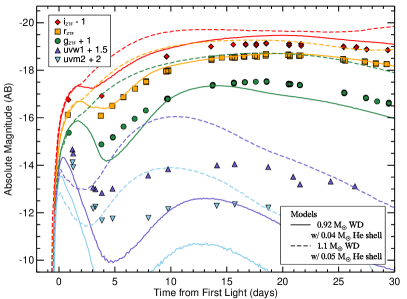
Miller et al. (2020) examined the Polin et al. (2019a) models to determine the consistency of SN 2019yvq with a double-detonation explosion given the observational properties in the photospheric phase. The best-fit model, a 0.92 M☉ WD with a 0.04 M☉ Helium shell (or a total mass of M☉), was able to explain most, though not all of the features of SN 2019yvq. Specifically the models showed that a double-detonation can produce the early UV flash exhibited by SN 2019yvq and the best 0.92+0.04 model reproduced the optical brightness during the early flux excess period and at peak brightness. The model, however, struggled to reproduce the velocity evolution of SN 2019yvq exhibiting significantly slower Si II absorption features than the observed event.
There is an inherent velocity-luminosity relationship in the 1D double-detonation models of Polin et al. (2019a). As a consequence of the WD exploding purely as a detonation the amount of 56Ni created during core burning is simply a function of the central density (or total mass) of the progenitor. The amount of 56Ni determines both the peak luminosity of the transient as well as the kinetic energy allowing for the velocity-luminosity relationship to result from a one-parameter function determined by the total mass of the progenitor.
Polin et al. (2019a) further points to a population of SNe Ia that follow this relationship and a separate group of SNe Ia that have mag and a peak-brightness Si II velocity around -11,000 km s-1. This cluster contains most normal SNe Ia, such as SN 2011fe, indicating these are likely not of double-detonation origin. This relationship is, however, based on a set of 1D simulations and has the potential to become more complicated when multi-dimensional effects are introduced. Furthermore, SN 2019yvq does not follow this relationship, having fast ejecta velocity at peak (,000 km s-1) that is associated with a high-mass WD, paired with a low luminosity ( mag) that is associated with a low-mass WD. This combination is not just peculiar in the context of a double detonation, but for all SNe Ia. SN 2019yvq does not lie in the cluster of normal SNe Ia but rather in a relatively un-populated regime in this parameter space (Miller et al., 2020).
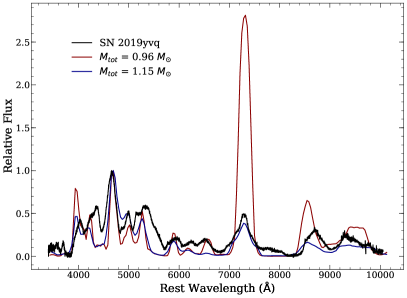
Because of the favored photospheric double-denotation model’s inability to explain the velocity evolution of SN 2019yvq, we chose to compare our nebular spectrum to the entire suite of Polin et al. (2019b) models as well as the best-fit model from Miller et al. (2020) to independently determine which model best matches the nebular features of SN 2019yvq. Figure 6 shows the result of this comparison. The best-matching photospheric model, M☉, has [Ca II] 7291, 7324 emission that is much stronger than that of SN 2019yvq, while the best-matched nebular model, M☉ (determined by the [Ca II]/[Fe III] ratio) is too luminous in the photospheric phase.
The [Ca II] emission feature is highly sensitive to both the precise amount of Ca produced in the explosion and the distribution of that Ca throughout the ejecta (Polin et al., 2019b). [Ca II] is a very efficient cooling line, and tends to dominate the emission features when Ca is co-existent with other coolants. The over production of [Ca II] in the M☉ model could indicate that the 1D double-detonation models distribute too much Ca in the innermost ejecta, allowing for some flux to cool through [Ca II] when it would otherwise cool through Fe-group elements. However, the M☉ model provides a better match to the velocity of SN 2019yvq, exhibiting a Si II 6355 of approximately ,500 km s-1 at peak brightness, favoring a higher-mass progenitor for SN 2019yvq.
It is also possible that this discrepancy is due to asymmetries in the explosion and line-of-sight differences not captured in our 1D models. Townsley et al. (2019) perform a 2D simulation of the double-detonation of a 1.0 M☉ WD with 0.02 M☉ He on its surface. They show that at the time of peak brightness the Si II velocity is fastest along the pole (in the direction of the initial helium ignition) and slower for viewing angles away from the pole. The bolometric luminosity behaves inversely, such that it is least luminous along the pole and most luminous when viewed from the opposite direction. It is possible that SN 2019yvq is viewed along a line of sight close to the pole, such that it exhibits the rare combination of high Si II velocity paired with lower luminosity. Future work is necessary to determine how such asymmetries would affect the nebular features of these events. We therefore suggest that while the presence of strong [Ca II] emission is enough to classify SN 2019yvq as a double-detonation explosion, the exact mass of the progenitor is less certain.
4 Discussion & Conclusions
We have gained significant insight about the SN 2019yvq progenitor system and explosion from its nebular spectrum. There are also broader implications for all SNe Ia. SN 2019yvq is another example of a “normal” SN Ia that exhibits an early blue flux excess, but the first with an atypical late-time spectrum.
In almost every case where there is an early flux excess for a SN Ia, and in all cases where the SN may be considered “normal,” the nebular spectra had no obvious peculiarity. Similarly, the SNe Ia with peculiar nebular spectra generally lacked evidence of an early flux excess (often because of a lack of data covering the relevant epochs). The previous exception was the the atypical SN 2002es-like iPTF14atg that had both an early blue flash (Cao et al., 2015) and [O I] nebular emission (Kromer et al., 2016) similar to SN 2010lp (Taubenberger et al., 2013b). SN 2019yvq is the first relatively normal SN Ia with both an early flux excess and a peculiar nebular spectrum.
Notably, none of the “flux excess” SNe show evidence for hydrogen or helium emission indicative of swept-up material. SN 2018fhw had strong H emission at late times, but lacked an early flux excess one might expect from companion interaction (Vallely et al., 2019). SN 2015cp also had strong H emission at very late times (650–800 days after peak), but lacks any pre-peak data (Graham et al., 2019). Neither SN 2015cp nor SN 2018fhw had any interaction signatures in their early spectra, unlike SNe Ia-CSM (Silverman et al., 2013b). Some SN Iax spectra have He emission lines consistent with swept-up material (Foley et al., 2009, 2016; Jacobson-Galán et al., 2019), but none have yet had a clear early flux excess.
The most popular progenitor/explosion models for producing excess flux at early times (companion/circumstellar material interaction, surface 56Ni mixing, double detonation, and violent mergers) have difficulty explaining the nebular spectra of SNe 2017cbv and 2018oh, two normal SNe Ia with well-observed early flux excess (Hosseinzadeh et al., 2017; Dimitriadis et al., 2019a; Shappee et al., 2019). In particular, neither SN had detectable [Ca II] emission, expected for double-detonation explosions (Polin et al., 2019b). Additionally, SN 2018oh had early blue colors that were inconsistent with double-detonation models (Dimitriadis et al., 2019a). Other SNe Ia that feature early blue colors (but no obvious excess flux) such as SN 2009ig (Foley et al., 2012b), SN 2013dy (Zheng et al., 2013), and ASASSN-14lp (Shappee et al., 2016) also lack evidence of companion interaction or Ca emission in their nebular spectra (Pan et al., 2015; Black et al., 2016; Maguire et al., 2018; Tucker et al., 2020).
In stark contrast to the other flux-excess SNe, the 7300 Å line complex of SN 2019yvq cannot be explained without strong [Ca II] emission, a signature of double-detonation explosions (and explicitly outlined by Miller et al. (2020) for SN 2019yvq). All observations of SN 2019yvq, and particularly the early-time flux excess and late-time [Ca II] emission, are consistent with a thick He shell double-detonation explosion of a sub-Chandrasekhar-mass WD in a binary system.
The double-detonation mechanism requires mass transfer of He onto the primary WD. Several theoretical studies have indicated that little to no He on the surface of exploding low-mass WDs is needed to reproduce the photospheric properties of normal SNe Ia (Shen & Moore, 2014; Townsley et al., 2019; Leung & Nomoto, 2020). Double detonations with minimal He can be initiated dynamically via an explosion in the accretion stream (Guillochon et al., 2010), however, these systems are expected to strip He from the companion WD with masses of to M☉ (Shen & Schwab, 2017; Tanikawa et al., 2019), inconsistent with what is seen for SN 2019yvq. Alternatively, the He can ignite after a large enough He shell is developed (Shen & Moore, 2014). Polin et al. (2019a) showed that minimal-mass shells do not produce early flux excesses like that seen for SN 2019yvq, further excluding a dynamically driven detonation.
SNe 2016hnk and 2018byg are two similar-to-each-other, yet peculiar overall, SNe Ia that are likely the result of He-shell detonations on the surface of relatively low-mass WDs (De et al., 2019; Jacobson-Galán et al., 2020). Combined, they had early-time excess flux, strong nebular [Ca II] emission, and early spectra that demonstrated strong line blanketing from iron-group elements. Jacobson-Galán et al. (2020) modeled the light curves and spectra of SN 2016hnk, finding that the SN was likely the result of a 0.02 M☉ He-shell explosion on the surface of a WD. De et al. (2019) estimated that SN 2018byg was produced by the detonation of a massive He shell (0.15) on a WD. These SNe share many features with SN 2019yvq, but the lack of enhanced iron-group elements in the early spectra of SN 2019yvq (Miller et al., 2020) indicates that SN 2019yvq likely had a significantly larger WD mass than SNe 2016hnk or 2018byg (i.e., 0.85 M☉).
Polin et al. (2019a) also provided evidence that double-detonation SNe originating with varying He-shell masses can be differentiated by their velocity and color. Given the high photospheric velocities, red optical colors, and qualitative similarity to the nebular model of a 1.1 M☉ WD with a 0.05 M☉ He shell (Figure 6), we argue that SN 2019yvq was in the distinct thick He shell subclass detailed in Polin et al. (2019a). This may also provide evidence that a subset of early “flux-excess” SNe Ia are produced by progenitors with thick He shells. There may exist a continuum of thick He shell double-detonation progenitors that ranges from lower-mass events (0.85 M☉) like SNe 2016hnk and 2018byg to higher-mass events (1.1 M☉) like SN 2019yvq. Furthermore, given the likely [Ca II] presence in some fast-declining SNe Ia (e.g., SN 1999by; Blondin et al., 2018), it is reasonable to expect that they may be produced by a double-detonation progenitor. However, since these SNe do not show prominent early excess flux, they are likely not produced through the thick He shell channel.
Assuming that the progenitor system of SN 2019yvq is unique compared to the population of normal SNe Ia with nebular spectra, and SN 2019yvq is consistent with a thick He shell double-detonation explosion, we can estimate the fraction of normal SNe Ia that arise from this progenitor channel. The nebular spectrum of SN 2019yvq was acquired +153 days after peak brightness and SN 2019yvq had mag at this time. Given a typical nebular spectroscopy survey limiting magnitude of 21.5 mag, the nebular phase spectrum of SN 2019yvq would have been detectable to 124 Mpc. The comprehensive nebular sample provided by Tucker et al. (2020) contains 94 normal SNe Ia within this volume. Using Poisson statistics, we determine that the fraction of normal SNe Ia that are SN 2019yvq-like double-detonation SNe is % (90th-percentile confidence range).
The simulations in Shen et al. (2018a) favor a 1.0 M☉ progenitor for typical SN 2011fe-like SNe Ia. Since SNe Ia typically do not show strong [Ca II] emission, they must either originate from a channel that does not have a double-detonation explosion or must come from WDs more massive than the progenitor of SN 2019yvq (i.e., 1.1 M☉). This presents a problem for minimal He mass double-detonation explosions as the dominant path to creating normal SNe Ia since 1.1 M☉ WDs are rare (Kilic et al., 2018). While the WDs may be born at a lower mass and accrete to a higher mass, reaching this higher mass can still be difficult, especially if the accretion is from a low-mass He WD. Furthermore, their synthetic spectra in the photospheric phase of massive WD explosions tend to generate higher velocities than observed in normal SNe Ia. Surviving WD companions of double-degenerate systems have been detected (Shen et al., 2018b), but it is still uncertain whether the implied rate of these progenitors can account for the majority of SNe Ia.
Shen et al. (2018b) used Gaia parallaxes and proper motions to search for hyper-velocity stars that could be the surviving companion star from a double-detonation progenitor system. They estimated that if all SNe in the Milky Way originated from the dynamically driven double-degenerate double-detonation (D6) channel, they would detect 22 runaway WDs within 1 kpc of the Sun in the Gaia DR2 sample. Shen et al. (2018b) found three likely runaway WDs, however, these ranged from a distance of 1.0 to 2.3 kpc from the Sun and were only detectable because of their higher luminosity than normal WDs. This was an incredible success of the theory, but the detection rate, when considering the higher luminosity, is consistent with only 1.1% of SNe Ia producing runaway WDs. Assuming Poisson statistics, we determine that 95% confidence interval of the observed-to-predicted rate is %. While there are several selection effects that we ignore for both measurements, we note that the rate of SN 2019yvq-like events is consistent with the rate of hyper-velocity white dwarfs in the Milky Way. Since the rates are similar, it is possible that all double-detonation explosions (those with stable and unstable mass transfer) account for only a fraction of normal SNe Ia, with an additional channel possibly necessary to produce the bulk of normal SNe Ia.
The diversity of SNe Ia in the nebular phase, and particularly the tell-tale signs of different progenitor/explosion scenarios for SNe 2010lp, 2018fhw, and 2019yvq, point to a variety of paths to have SNe Ia with similar near-peak observables. These SNe provide some of the strongest support for violent-merger, single-degenerate, and double-detonation models, respectively. Yet the rarity of these kinds of SNe and the divergence from the majority of SNe Ia suggests that these channels are either not the dominant channels producing most SNe Ia, or these examples are extrema of the most-common channel.
While some of these rare SNe Ia would likely be excluded from cosmological samples, SN 2019yvq is not clearly an outlier. Although its decline rate is faster than the average SN Ia (Miller et al., 2020), it is not large enough to be clearly rejected, especially for lower signal-to-noise ratio or more sparsely covered light curves. Additionally, its red color and low peak luminosity are consistent with its decline rate. Future detailed simulations will reveal if SN 2019yvq-like SNe impact cosmological measurements.
We summarize our analysis of the SN 2019yvq nebular spectrum below:
-
•
The +153-day nebular spectrum of SN 2019yvq exhibits strong [Ca II] 7291, 7324 and Ca NIR triplet emission features. The nebular spectra of some other fast-declining SNe Ia likely have contributions from [Ca II] 7291, 7324 emission, but the relative strengths of the [Ca II] to [Fe II] and [Ni II] in these SNe are more difficult to determine. In some more extreme SNe Ia such as SN 1999by, [Ca II] likely dominates in this region, but the narrow Fe and Co features in other region of the spectra are inconsistent with SN 2019yvq.
-
•
We fit a multiple-component Gaussian emission model to the 7300 Å line complex consisting of [Fe II], [Ni II], and [Ca II] emission, finding that all components are blueshifted relative to their rest-frame wavelengths. Blueshifted nebular lines are atypical for high-velocity SNe Ia such as SN 2019yvq.
-
•
We find no evidence for swept-up material in the nebular spectrum of SN 2019yvq. Our limits on the amount of hydrogen and helium mass are and M☉, respectively.
-
•
We also do not detect [O I] 6300, 6364 emission, an expected feature if there is significant unburned material in the ejecta.
-
•
A comparison to the double-detonation models from Polin et al. (2019b) reveals that SN 2019yvq was likely the result of double-detonation explosion. The strength of the Ca emission indicates a larger progenitor mass (), however, a lower progenitor mass still better reproduces the early light-curve and low peak luminosity.
-
•
The rarity of SN 2019yvq-like events suggests that thick He shell double-detonations make up of the normal SN Ia population.
Continued observations of SN 2019yvq will further enhance this picture with future observations potentially revealing additional insight into the progenitor system and explosion. Continued monitoring of the [Ca II] emission will allow models to better separate abundance, ionization, and asymmetry. Additional data such as spectropolarimetry of similar events will be especially valuable to untangle the early-time emission.
More photometric observations of SNe Ia in their infancy are needed to better understand the population with early excess flux. Several subclasses of SNe Ia have both early excess flux and spectral signatures in the nebular phase that indicate a variety of progenitor channels (Taubenberger et al., 2013b; Cao et al., 2015; Kromer et al., 2016; De et al., 2019; Jacobson-Galan et al., 2019). More typical SNe Ia with early excess flux lack clear late-time signatures (Hosseinzadeh et al., 2017; Sand et al., 2018; Dimitriadis et al., 2019a, b; Shappee et al., 2019; Tucker et al., 2019). And some SNe Ia with peculiar nebular spectra (Taubenberger et al., 2013a; Kollmeier et al., 2019) do not have detected early-time excess flux, often to deep limits. High-cadence surveys of the local volume where one can hope to obtain a nebular spectrum will be critical.
References
- Almgren et al. (2010) Almgren, A. S., Beckner, V. E., Bell, J. B., et al. 2010, ApJ, 715, 1221, doi: 10.1088/0004-637X/715/2/1221
- Altavilla et al. (2007) Altavilla, G., Stehle, M., Ruiz-Lapuente, P., et al. 2007, A&A, 475, 585, doi: 10.1051/0004-6361:20077487
- Astropy Collaboration et al. (2013) Astropy Collaboration, Robitaille, T. P., Tollerud, E. J., et al. 2013, A&A, 558, A33, doi: 10.1051/0004-6361/201322068
- Black et al. (2016) Black, C. S., Fesen, R. A., & Parrent, J. T. 2016, MNRAS, 462, 649, doi: 10.1093/mnras/stw1680
- Blondin et al. (2018) Blondin, S., Dessart, L., & Hillier, D. J. 2018, MNRAS, 474, 3931, doi: 10.1093/mnras/stx3058
- Blondin et al. (2012) Blondin, S., Matheson, T., Kirshner, R. P., et al. 2012, AJ, 143, 126, doi: 10.1088/0004-6256/143/5/126
- Bloom et al. (2012) Bloom, J. S., Kasen, D., Shen, K. J., et al. 2012, ApJ, 744, L17, doi: 10.1088/2041-8205/744/2/L17
- Botyánszki & Kasen (2017) Botyánszki, J., & Kasen, D. 2017, ApJ, 845, 176, doi: 10.3847/1538-4357/aa81d8
- Botyánszki et al. (2018) Botyánszki, J., Kasen, D., & Plewa, T. 2018, ApJ, 852, L6, doi: 10.3847/2041-8213/aaa07b
- Cao et al. (2015) Cao, Y., Kulkarni, S. R., Howell, D. A., et al. 2015, Nature, 521, 328, doi: 10.1038/nature14440
- Cikota et al. (2019) Cikota, A., Patat, F., Wang, L., et al. 2019, MNRAS, 490, 578, doi: 10.1093/mnras/stz2322
- Colgate & McKee (1969) Colgate, S. A., & McKee, C. 1969, ApJ, 157, 623
- De et al. (2019) De, K., Kasliwal, M. M., Polin, A., et al. 2019, ApJ, 873, L18, doi: 10.3847/2041-8213/ab0aec
- Dilday et al. (2012) Dilday, B., Howell, D. A., Cenko, S. B., et al. 2012, Science, 337, 942, doi: 10.1126/science.1219164
- Dimitriadis et al. (2019a) Dimitriadis, G., Foley, R. J., Rest, A., et al. 2019a, ApJ, 870, L1, doi: 10.3847/2041-8213/aaedb0
- Dimitriadis et al. (2019b) Dimitriadis, G., Rojas-Bravo, C., Kilpatrick, C. D., et al. 2019b, ApJ, 870, L14, doi: 10.3847/2041-8213/aaf9b1
- Dong et al. (2015) Dong, S., Katz, B., Kushnir, D., & Prieto, J. L. 2015, MNRAS, 454, L61, doi: 10.1093/mnrasl/slv129
- Filippenko et al. (1992) Filippenko, A. V., Richmond, M. W., Branch, D., et al. 1992, AJ, 104, 1543
- Flörs et al. (2020) Flörs, A., Spyromilio, J., Taubenberger, S., et al. 2020, MNRAS, 491, 2902, doi: 10.1093/mnras/stz3013
- Folatelli et al. (2013) Folatelli, G., Morrell, N., Phillips, M. M., et al. 2013, ApJ, 773, 53, doi: 10.1088/0004-637X/773/1/53
- Foley et al. (2016) Foley, R. J., Jha, S. W., Pan, Y.-C., et al. 2016, MNRAS, 461, 433, doi: 10.1093/mnras/stw1320
- Foley & Kasen (2011) Foley, R. J., & Kasen, D. 2011, ApJ, 729, 55, doi: 10.1088/0004-637X/729/1/55
- Foley et al. (2011) Foley, R. J., Sanders, N. E., & Kirshner, R. P. 2011, ApJ, 742, 89, doi: 10.1088/0004-637X/742/2/89
- Foley et al. (2009) Foley, R. J., Chornock, R., Filippenko, A. V., et al. 2009, AJ, 138, 376, doi: 10.1088/0004-6256/138/2/376
- Foley et al. (2012a) Foley, R. J., Simon, J. D., Burns, C. R., et al. 2012a, ApJ, 752, 101, doi: 10.1088/0004-637X/752/2/101
- Foley et al. (2012b) Foley, R. J., Challis, P. J., Filippenko, A. V., et al. 2012b, ApJ, 744, 38, doi: 10.1088/0004-637X/744/1/38
- Foley et al. (2013) Foley, R. J., Challis, P. J., Chornock, R., et al. 2013, ApJ, 767, 57, doi: 10.1088/0004-637X/767/1/57
- Galbany et al. (2019) Galbany, L., Ashall, C., Höflich, P., et al. 2019, A&A, 630, A76, doi: 10.1051/0004-6361/201935537
- Ganeshalingam et al. (2012) Ganeshalingam, M., Li, W., Filippenko, A. V., et al. 2012, ApJ, 751, 142, doi: 10.1088/0004-637X/751/2/142
- Garnavich et al. (2004) Garnavich, P. M., Bonanos, A. Z., Krisciunas, K., et al. 2004, ApJ, 613, 1120, doi: 10.1086/422986
- Graham et al. (2017) Graham, M. L., Kumar, S., Hosseinzadeh, G., et al. 2017, MNRAS, 472, 3437, doi: 10.1093/mnras/stx2224
- Graham et al. (2019) Graham, M. L., Harris, C. E., Nugent, P. E., et al. 2019, ApJ, 871, 62, doi: 10.3847/1538-4357/aaf41e
- Guillochon et al. (2010) Guillochon, J., Dan, M., Ramirez-Ruiz, E., & Rosswog, S. 2010, ApJ, 709, L64, doi: 10.1088/2041-8205/709/1/L64
- Hosseinzadeh et al. (2017) Hosseinzadeh, G., Sand, D. J., Valenti, S., et al. 2017, ApJ, 845, L11, doi: 10.3847/2041-8213/aa8402
- Hounsell et al. (2018) Hounsell, R., Scolnic, D., Foley, R. J., et al. 2018, ApJ, 867, 23, doi: 10.3847/1538-4357/aac08b
- Hoyle & Fowler (1960) Hoyle, F., & Fowler, W. A. 1960, ApJ, 132, 565
- Iben & Tutukov (1984) Iben, Jr., I., & Tutukov, A. V. 1984, ApJS, 54, 335, doi: 10.1086/190932
- Iben & Tutukov (1996) —. 1996, ApJS, 105, 145, doi: 10.1086/192310
- Ivezić et al. (2019) Ivezić, Ž., Kahn, S. M., Tyson, J. A., et al. 2019, ApJ, 873, 111, doi: 10.3847/1538-4357/ab042c
- Jacobson-Galán et al. (2018) Jacobson-Galán, W. V., Dimitriadis, G., Foley, R. J., & Kilpatrick, C. D. 2018, ApJ, 857, 88, doi: 10.3847/1538-4357/aab716
- Jacobson-Galan et al. (2019) Jacobson-Galan, W. V., Polin, A., Foley, R. J., et al. 2019, arXiv e-prints, arXiv:1910.05436. https://arxiv.org/abs/1910.05436
- Jacobson-Galán et al. (2019) Jacobson-Galán, W. V., Foley, R. J., Schwab, J., et al. 2019, MNRAS, 487, 2538, doi: 10.1093/mnras/stz1305
- Jacobson-Galán et al. (2020) Jacobson-Galán, W. V., Polin, A., Foley, R. J., et al. 2020, ApJ, 896, 165, doi: 10.3847/1538-4357/ab94b8
- Jiang et al. (2017) Jiang, J.-A., Doi, M., Maeda, K., et al. 2017, Nature, 550, 80, doi: 10.1038/nature23908
- Jones et al. (2019) Jones, D. O., Scolnic, D. M., Foley, R. J., et al. 2019, ApJ, 881, 19, doi: 10.3847/1538-4357/ab2bec
- Kasen (2010) Kasen, D. 2010, ApJ, 708, 1025, doi: 10.1088/0004-637X/708/2/1025
- Kasen et al. (2006) Kasen, D., Thomas, R. C., & Nugent, P. 2006, ApJ, 651, 366, doi: 10.1086/506190
- Kelly et al. (2014) Kelly, P. L., Fox, O. D., Filippenko, A. V., et al. 2014, ApJ, 790, 3, doi: 10.1088/0004-637X/790/1/3
- Kilic et al. (2018) Kilic, M., Hambly, N. C., Bergeron, P., Genest-Beaulieu, C., & Rowell, N. 2018, Monthly Notices of the Royal Astronomical Society: Letters, 479, L113, doi: 10.1093/mnrasl/sly110
- Kollmeier et al. (2019) Kollmeier, J. A., Chen, P., Dong, S., et al. 2019, MNRAS, 486, 3041, doi: 10.1093/mnras/stz953
- Kromer et al. (2013) Kromer, M., Fink, M., Stanishev, V., et al. 2013, MNRAS, 429, 2287, doi: 10.1093/mnras/sts498
- Kromer et al. (2016) Kromer, M., Fremling, C., Pakmor, R., et al. 2016, MNRAS, 459, 4428, doi: 10.1093/mnras/stw962
- Leonard (2007) Leonard, D. C. 2007, ApJ, 670, 1275, doi: 10.1086/522367
- Leung & Nomoto (2020) Leung, S.-C., & Nomoto, K. 2020, ApJ, 888, 80, doi: 10.3847/1538-4357/ab5c1f
- Li et al. (2011) Li, W., Bloom, J. S., Podsiadlowski, P., et al. 2011, Nature, 480, 348, doi: 10.1038/nature10646
- Maeda et al. (2010a) Maeda, K., Taubenberger, S., Sollerman, J., et al. 2010a, ApJ, 708, 1703, doi: 10.1088/0004-637X/708/2/1703
- Maeda et al. (2008) Maeda, K., Kawabata, K., Mazzali, P. A., et al. 2008, Science, 319, 1220, doi: 10.1126/science.1149437
- Maeda et al. (2010b) Maeda, K., Benetti, S., Stritzinger, M., et al. 2010b, Nature, 466, 82, doi: 10.1038/nature09122
- Maguire et al. (2016) Maguire, K., Taubenberger, S., Sullivan, M., & Mazzali, P. A. 2016, MNRAS, 457, 3254, doi: 10.1093/mnras/stv2991
- Maguire et al. (2018) Maguire, K., Sim, S. A., Shingles, L., et al. 2018, MNRAS, 477, 3567, doi: 10.1093/mnras/sty820
- Maoz & Mannucci (2008) Maoz, D., & Mannucci, F. 2008, MNRAS, 388, 421, doi: 10.1111/j.1365-2966.2008.13403.x
- Marion et al. (2016) Marion, G. H., Brown, P. J., Vinkó, J., et al. 2016, ApJ, 820, 92, doi: 10.3847/0004-637X/820/2/92
- Matteucci & Greggio (1986) Matteucci, F., & Greggio, L. 1986, A&A, 154, 279
- Mattila et al. (2005) Mattila, S., Lundqvist, P., Sollerman, J., et al. 2005, A&A, 443, 649, doi: 10.1051/0004-6361:20052731
- Mazzali et al. (2018) Mazzali, P. A., Ashall, C., Pian, E., et al. 2018, MNRAS, 476, 2905, doi: 10.1093/mnras/sty434
- Mazzali et al. (1997) Mazzali, P. A., Chugai, N., Turatto, M., et al. 1997, MNRAS, 284, 151, doi: 10.1093/mnras/284.1.151
- Miller et al. (2020) Miller, A. A., Magee, M. R., Polin, A., et al. 2020, The Astrophysical Journal, 898, 56, doi: 10.3847/1538-4357/ab9e05
- Noebauer et al. (2017) Noebauer, U. M., Kromer, M., Taubenberger, S., et al. 2017, MNRAS, 472, 2787, doi: 10.1093/mnras/stx2093
- Nomoto (1982) Nomoto, K. 1982, ApJ, 257, 780, doi: 10.1086/160031
- Nomoto & Leung (2018) Nomoto, K., & Leung, S.-C. 2018, Space Sci. Rev., 214, 67, doi: 10.1007/s11214-018-0499-0
- Nomoto et al. (1984) Nomoto, K., Thielemann, F.-K., & Yokoi, K. 1984, ApJ, 286, 644, doi: 10.1086/162639
- Nugent et al. (2011) Nugent, P. E., Sullivan, M., Cenko, S. B., et al. 2011, Nature, 480, 344, doi: 10.1038/nature10644
- Oke et al. (1995) Oke, J. B., Cohen, J. G., Carr, M., et al. 1995, PASP, 107, 375
- Pan et al. (2015) Pan, Y.-C., Foley, R. J., Kromer, M., et al. 2015, MNRAS, 452, 4307, doi: 10.1093/mnras/stv1605
- Perets et al. (2010) Perets, H. B., Gal-Yam, A., Mazzali, P. A., et al. 2010, Nature, 465, 322, doi: 10.1038/nature09056
- Perlmutter et al. (1999) Perlmutter, S., Aldering, G., Goldhaber, G., et al. 1999, ApJ, 517, 565, doi: 10.1086/307221
- Phillips (1993) Phillips, M. M. 1993, ApJ, 413, L105, doi: 10.1086/186970
- Piro & Morozova (2016) Piro, A. L., & Morozova, V. S. 2016, ApJ, 826, 96, doi: 10.3847/0004-637X/826/1/96
- Polin et al. (2019a) Polin, A., Nugent, P., & Kasen, D. 2019a, ApJ, 873, 84, doi: 10.3847/1538-4357/aafb6a
- Polin et al. (2019b) —. 2019b, arXiv e-prints, arXiv:1910.12434. https://arxiv.org/abs/1910.12434
- Raskin & Kasen (2013) Raskin, C., & Kasen, D. 2013, ApJ, 772, 1, doi: 10.1088/0004-637X/772/1/1
- Riess et al. (1998) Riess, A. G., Filippenko, A. V., Challis, P., et al. 1998, AJ, 116, 1009
- Sand et al. (2018) Sand, D. J., Graham, M. L., Botyánszki, J., et al. 2018, ApJ, 863, 24, doi: 10.3847/1538-4357/aacde8
- Schaefer & Pagnotta (2012) Schaefer, B. E., & Pagnotta, A. 2012, Nature, 481, 164, doi: 10.1038/nature10692
- Scolnic et al. (2018) Scolnic, D. M., Jones, D. O., Rest, A., et al. 2018, ApJ, 859, 101, doi: 10.3847/1538-4357/aab9bb
- Shappee et al. (2013) Shappee, B. J., Stanek, K. Z., Pogge, R. W., & Garnavich, P. M. 2013, ApJ, 762, L5, doi: 10.1088/2041-8205/762/1/L5
- Shappee et al. (2016) Shappee, B. J., Piro, A. L., Holoien, T. W.-S., et al. 2016, ApJ, 826, 144, doi: 10.3847/0004-637X/826/2/144
- Shappee et al. (2019) Shappee, B. J., Holoien, T. W.-S., Drout, M. R., et al. 2019, ApJ, 870, 13, doi: 10.3847/1538-4357/aaec79
- Shen et al. (2018a) Shen, K. J., Kasen, D., Miles, B. J., & Townsley, D. M. 2018a, ApJ, 854, 52, doi: 10.3847/1538-4357/aaa8de
- Shen & Moore (2014) Shen, K. J., & Moore, K. 2014, ApJ, 797, 46, doi: 10.1088/0004-637X/797/1/46
- Shen & Schwab (2017) Shen, K. J., & Schwab, J. 2017, ApJ, 834, 180, doi: 10.3847/1538-4357/834/2/180
- Shen et al. (2018b) Shen, K. J., Boubert, D., Gänsicke, B. T., et al. 2018b, ApJ, 865, 15, doi: 10.3847/1538-4357/aad55b
- Siebert et al. (2019) Siebert, M. R., Foley, R. J., Jones, D. O., et al. 2019, MNRAS, 486, 5785, doi: 10.1093/mnras/stz1209
- Silverman et al. (2013a) Silverman, J. M., Ganeshalingam, M., & Filippenko, A. V. 2013a, MNRAS, 430, 1030, doi: 10.1093/mnras/sts674
- Silverman et al. (2012) Silverman, J. M., Foley, R. J., Filippenko, A. V., et al. 2012, MNRAS, 425, 1789, doi: 10.1111/j.1365-2966.2012.21270.x
- Silverman et al. (2013b) Silverman, J. M., Nugent, P. E., Gal-Yam, A., et al. 2013b, ApJS, 207, 3, doi: 10.1088/0067-0049/207/1/3
- Spergel et al. (2015) Spergel, D., Gehrels, N., Baltay, C., et al. 2015, ArXiv e-prints. https://arxiv.org/abs/1503.03757
- Springel & Hernquist (2003) Springel, V., & Hernquist, L. 2003, MNRAS, 339, 289, doi: 10.1046/j.1365-8711.2003.06206.x
- Tanikawa et al. (2019) Tanikawa, A., Nomoto, K., Nakasato, N., & Maeda, K. 2019, ApJ, 885, 103, doi: 10.3847/1538-4357/ab46b6
- Taubenberger et al. (2013a) Taubenberger, S., Kromer, M., Pakmor, R., et al. 2013a, ApJ, 775, L43, doi: 10.1088/2041-8205/775/2/L43
- Taubenberger et al. (2009) Taubenberger, S., Valenti, S., Benetti, S., et al. 2009, MNRAS, 397, 677, doi: 10.1111/j.1365-2966.2009.15003.x
- Taubenberger et al. (2013b) Taubenberger, S., Kromer, M., Hachinger, S., et al. 2013b, MNRAS, 432, 3117, doi: 10.1093/mnras/stt668
- Tinsley (1980) Tinsley, B. M. 1980, Fund. Cosmic Phys., 5, 287
- Townsley et al. (2019) Townsley, D. M., Miles, B. J., Shen, K. J., & Kasen, D. 2019, ApJ, 878, L38, doi: 10.3847/2041-8213/ab27cd
- Tucker et al. (2019) Tucker, M. A., Shappee, B. J., & Wisniewski, J. P. 2019, ApJ, 872, L22, doi: 10.3847/2041-8213/ab0286
- Tucker et al. (2020) Tucker, M. A., Shappee, B. J., Vallely, P. J., et al. 2020, MNRAS, 493, 1044, doi: 10.1093/mnras/stz3390
- Turatto et al. (1996) Turatto, M., Benetti, S., Cappellaro, E., et al. 1996, MNRAS, 283, 1
- Vallely et al. (2020) Vallely, P. J., Tucker, M. A., Shappee, B. J., et al. 2020, MNRAS, 492, 3553, doi: 10.1093/mnras/staa003
- Vallely et al. (2019) Vallely, P. J., Fausnaugh, M., Jha, S. W., et al. 2019, arXiv e-prints. https://arxiv.org/abs/1903.08665
- Wang et al. (2006) Wang, L., Baade, D., Höflich, P., et al. 2006, ApJ, 653, 490, doi: 10.1086/508250
- Webbink (1984) Webbink, R. F. 1984, ApJ, 277, 355, doi: 10.1086/161701
- Whelan & Iben (1973) Whelan, J., & Iben, I. J. 1973, ApJ, 186, 1007, doi: 10.1086/152565
- Wilk et al. (2020) Wilk, K. D., Hillier, D. J., & Dessart, L. 2020, MNRAS, 494, 2221, doi: 10.1093/mnras/staa640
- Woosley & Kasen (2011) Woosley, S. E., & Kasen, D. 2011, ApJ, 734, 38, doi: 10.1088/0004-637X/734/1/38
- Woosley & Weaver (1994) Woosley, S. E., & Weaver, T. A. 1994, ApJ, 423, 371, doi: 10.1086/173813
- Yao et al. (2019) Yao, Y., Miller, A. A., Kulkarni, S. R., et al. 2019, ApJ, 886, 152, doi: 10.3847/1538-4357/ab4cf5
- Zheng et al. (2013) Zheng, W., Silverman, J. M., Filippenko, A. V., et al. 2013, ApJ, 778, L15, doi: 10.1088/2041-8205/778/1/L15