Large scale analysis of violent death count in daily newspapers to quantify bias and censorship.
Abstract
In this work we develop a series of techniques and tools to determine and quantify the presence of bias and censorship in newspapers. These algorithms are tested analyzing the occurrence of keywords ‘killed’ and ‘suicide’ (‘morti’, ‘suicidio’ in Italian) and their changes over time, gender and reported location on the complete online archives (42 million records) of the major US newspaper (The New York Times) and the three major Italian ones (Il Corriere della Sera, La Repubblica, La Stampa).
Using these tools, since the Italian language distinguishes between the female and male cases, we find the presence of gender bias in all Italian newspapers, with reported single female deaths to be about one-third of those involving single men.
Analyzing the historical trends, we show evidence of censorship in Italian newspapers both during World War 1 and during the Italian Fascist regime. Censorship in all countries during World Wars and in Italy during the Fascist period is a historically ascertained fact, but so far there was no estimate on the amount on censorship in newspaper reporting: in this work we estimate that about of domestic deaths and suicides were not reported. This is also confirmed by statistical analysis of the distribution of the least significant digit of the number of reported deaths.
We also find that the distribution function of the number of articles vs. the number of deaths reported in articles follows a power law, which is broken (with fewer articles being written) when reporting on few deaths occurring in foreign countries. The lack of articles is found to grow with geographical distance from the nation where the newspaper is being printed.
Whereas the assessment of the truth of a single article or the debunking of what are now called ‘fake news’ requires specific fact-checking and becomes more difficult as time goes by, these methods can be be used in historical analysis and to evaluate quantitatively the amount of bias and censorship present in other printed or online publication and can thus contribute to quantitatively assess the freedom of the press in a given country. Furthermore, they can be applied in wider contexts such as the evaluation of bias toward specific ethnic groups or specific accidents.
Index terms— News, Death, Suicide, Scaling laws, Censorship, Gender bias, Newspaper
1 Introduction
Violent death is a dramatic event that can be objectively quantified in terms of the number of lives lost. Words such as ‘killed’, ‘dead’, ‘casualty’, ‘suicide’ etc… can thus be used to assess the presence of bias or censorship in reporting incidents involving specific locations, groups of people, or time.
Coverage of death in the mass media has been studied for the insight it offers on how societies perceive this dramatic event[1]; at the same time, selective death reporting can be used to shape and distort public opinion. A 6-months period study[2] of 1975 issues of the Register Guard and the Standard Times showed that newspapers tend to over-report more news-worthy death causes and overlook others that are considered less interesting by the public. The work considered the number of occurrences, the number of deaths reported, and the text surface area of the articles dealing with death and compared them with the statistical occurrences, finding that all forms of disease were under-reported whereas violent or catastrophic events were overrepresented. An even more biased selection along these lines was found analyzing the news selection by television and radio[3]. Studies on the presence of geographical bias in reporting accidental deaths have been conducted manually on small data sets: a 51-issues study (two months) of two German (Frankfurter Allgemeine Zeitung and S ) and two Australian newspapers (The Australian and The Sydney Morning Herald) [4] have shown a weak relationship with social proximity in the number of articles reporting deaths. Similarly, a 6-months study of the German tabloid Die Abendzeitung[5] reported evidence of a correlation between the number of accidental deaths and the length of the article as well as a negative correlation of the distance between the town where the newspaper was printed and the event reported. In this case, the analysis involved the study of the amount of printed space occupied by an article reporting of a fatal event. The authors did not find any significant correlation between the area taken by the article and the number of deaths reported[6] but showed an inverse relationship (linear in logarithmic scale) of the area of printed text normalized to the number of victims and the distance (in km) of the event from Munich, the town where the Die Abendzeitung was printed. They also found a minimum threshold of victims - increasing with distance - needed to elicit a report in the newspaper. They thus likened the response of the paper to the logarithmic response between stimulus strength and response intensity in human perception[7].
On the opposite, [8] analyzed the occurrence of pictures in Time and Newsweek magazines. The study involved ten issues in three years for each magazine, for a total of 60 issues. The work involved measuring the area occupied by the picture, determine the country of origin of the picture, and classifying its violent or non-violent nature. The study found that - although domestic pictures were more common than foreign ones (Time=66.4, Newsweek=71.2%) - images depicting death were printed more often when the event took place abroad (Timeforeign: ; Newsweekforeign:) compared to when it occurred in domestic USA (Timedomestic: ; Newsweekdomestic: ).
A more recent study[9] showed that direct pictographic representations of death are very rare in western newspapers, amounting only to of the articles (997 stories in a two-month time frame, 357 with pictures).
Most of these studies have been performed by manual scanning of the newspapers or magazines, therefore restricting the scope of the possible analysis. With the digitization of printed literature, it is possible to perform systematic analysis on the entire archives of newspapers, magazines, and books. A large-scale analysis of the number of occurrences of notable personalities in books has shown evidence of censorship of various individuals during the Nazi regime[10]. The books have been digitally converted via OCR (Optical Character Recognition)[11] as part of the Google effort to digitize books and the occurrence of individual names has been compared with the lexicon of the various languages[12].
In this work, we have developed several algorithms that allow a systematic study of the occurrence of the articles involving fatal accidents and their gender/location. This allows to assess the distribution laws and determine the presence of bias and censorship in reporting. We have used daily newspapers since they have the advantage of addressing wider audiences with higher frequency and a longer temporal consistency, often covering events usually ignored by books.
We have applied these algorithms on the full historical archives of the three major Italian newspapers: Il Corriere della Sera (Milan, CDS, 1876-2017), La Repubblica (Rome, REP, 1985-2017), and La Stampa (Turin, STA, 1867-2005) and the major US newspaper: The New York Times (NYT, 1955-2017), searching for the articles containing selected keywords: ‘killed’ (‘morti’ in the Italian language, the mixed-gender plural term, as well as the singular female and male gender, ‘morta’ and ‘morto’ respectively), ‘suicide’ (‘suicidio’). These words have been chosen for their high rate of occurrence (3.1 million articles out of 42 million comprising the newspaper archives) in respect to similar lemmas (dead, casualties…) and correspondence of usage since both are used to indicate violent deaths. Most importantly, in the case of the plural form they contain the number of people involved. Therefore, in addition to a simple word count, it is also possible to study the distribution of the number of people killed, the location, and the category of victims.
The rest of the paper is organized as follows: in the Methods section is present the description of the archives, the retrieval and data processing steps, and the various algorithms. In the Results/Discussion section are shown the results on the time behaviour, gender, censorship, the scaling law, and the last digit analysis. Perspectives and future work are discussed in the Conclusion section.
2 Methods
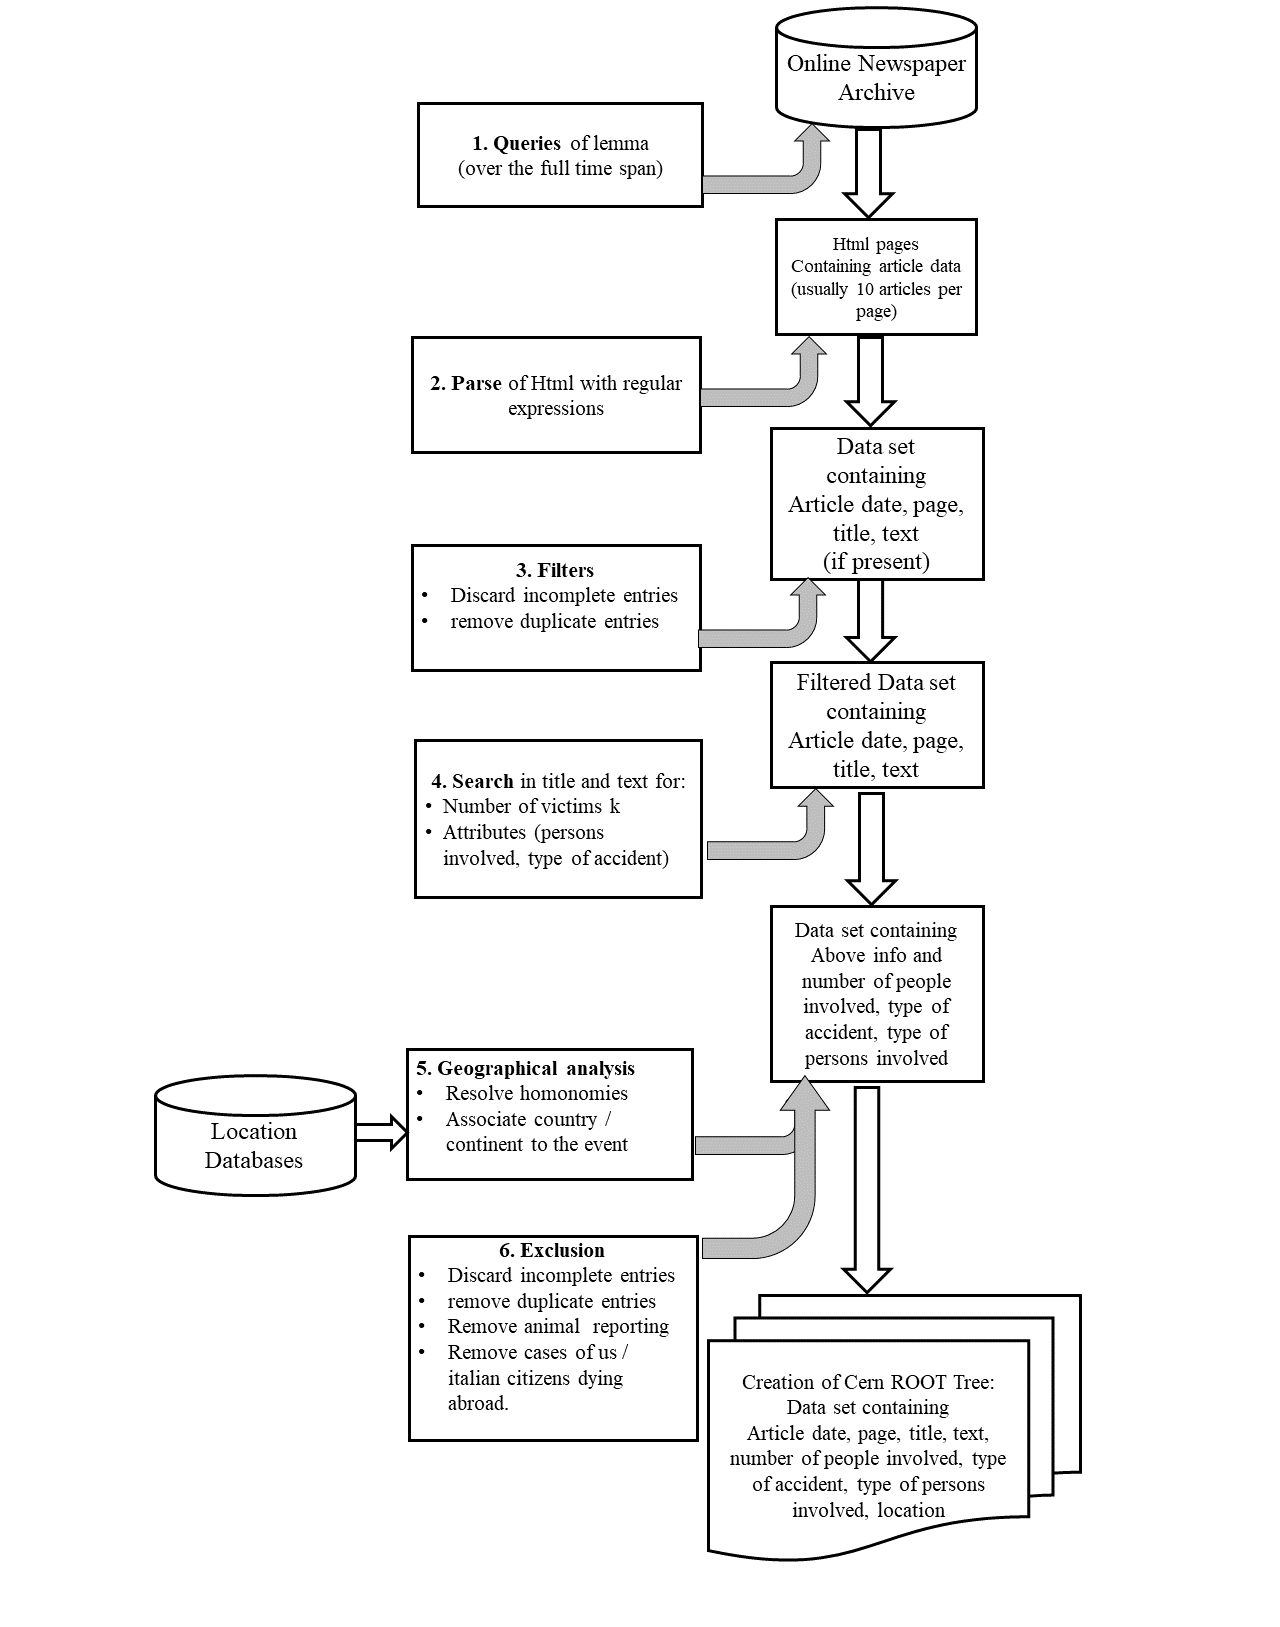
Figure 1 shows the steps taken to access, parse, and identify the articles, from the access of the online archives to the creation of the various data sets, one for each newspaper and lemma considered. All these tasks are accomplished using Python scripts. The access to the online archive of each newspaper takes a few days to complete over the full time span, since this is mediated by a web-based interface that usually returns ten articles at a time. The storage and handling of the data sets are performed using the Root[13] framework and require a few minutes to complete. This C++ based environment was developed at CERN to deal efficiently with high volumes ( Pbyte) of data produced from accelerator- space- and ground/underground-based detectors. As such, it is especially suited to create the ntuples (Ttrees in Root nomenclature) containing the data extracted from the newspaper articles. All the selections, histogramming, and fitting have also been performed in this environment.
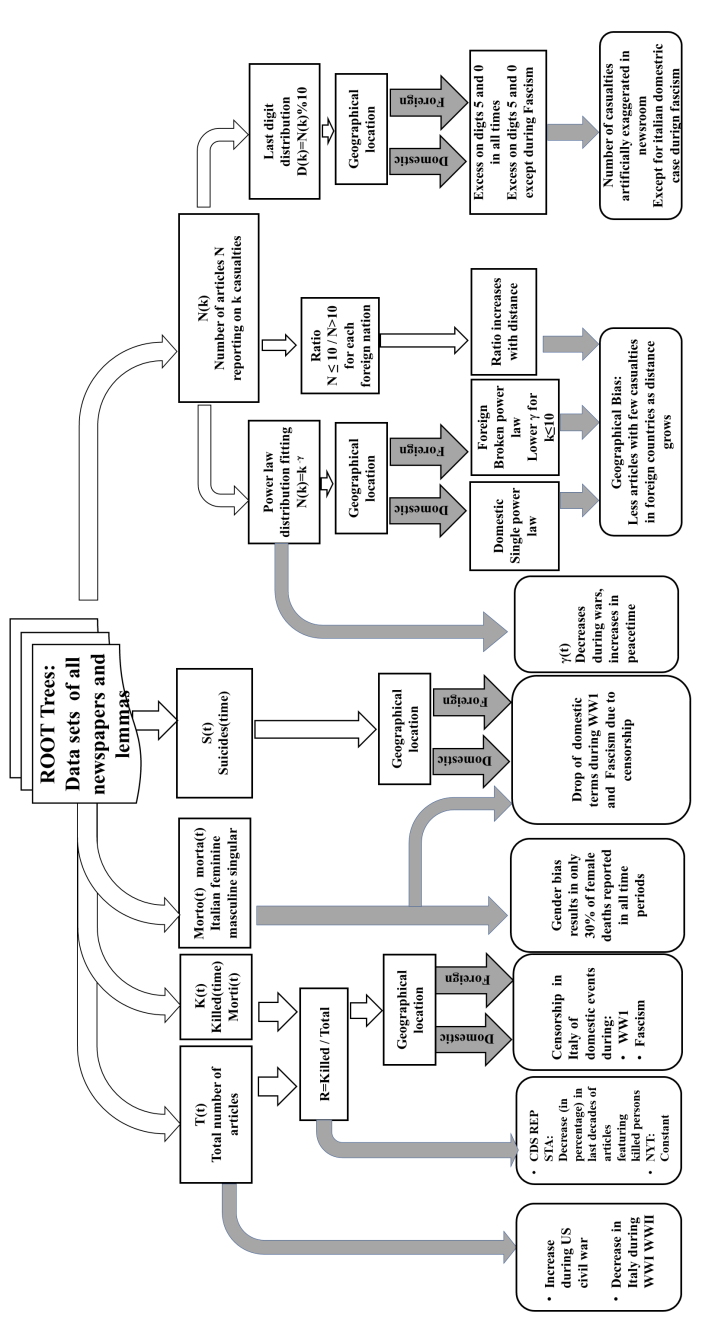
A scheme of the various types of algorithms used to analyze the data sets and the main information they provide is shown in Figure 2.
2.1 Newspaper Archives
| Newspaper | Date | Archive | |||||||
| all entries | Suicide | Morta | killed | number | location | number and | |||
| Suicidio | Morto | morti | present | present | location | ||||
| NYT | 1852 | 1.51e7 | 1.43e5 | 4.74e5 | 3.10e4 | 2.58e5 | 1.82e4 | https://www.nytimes.com/search/ | |
| 2016 | |||||||||
| CDS | 1876 | 8.04e6 | 7.72e4 | 3.33e5 | 2.77e5 | 2.53e4 | 7.44e4 | 1.10e4 | http://archivio.corriere.it/ |
| 2017 | 6.5e5 | ||||||||
| REP | 1985 | 6.36e6 | 3.68e4 | 6.52e4 | 1.68e5 | 3.70e4 | 8.36e4 | 2.20e4 | https://ricerca.repubblica.it/ |
| 2017 | 1.5e5 | ||||||||
| STA | 1867 | 1.28e7 | 7.33e4 | 1.31e5 | 1.79e5 | 1.86e4 | 1.39e5 | 1.63e4 | http://www.archiviolastampa.it/ |
| 2005 | 3.68e5 | ||||||||
| Total | 4.23e7 | 3.3e5 | 1.7e6 | 1.10e6 | 1.12e5 | 5.55e5 | 6.75e4 |
Only printed editions have been considered and online articles have been excluded for consistency with pre-internet years. The newspapers have freely accessible online archives that cover a major part of their printing time. Out of the million articles comprising the four newspaper online archives, all the articles which matched the considered lemmas (‘killed’, ‘morti’, ‘morta’ ‘morto’ ‘suicide’ (‘suicidio’ million ) have been extracted. See Table 1 for details on the data size of each newspaper. Details of the newspapers and archives are as follow:
-
1.
The New York Times (NYT) was founded in September 1851, with the online archive (https://www.nytimes.com/search/ ) starting in January 1952. Due to strikes, it was not printed between: December 9, 1962 - March 31, 1963 (a western edition is present in the archive); September 17, 1965, - October 10, 1965 (an international edition was printed and is present in the archives); August 10, 1978 - November 5, 1978 (no editions present in the archives). In 2017, print circulation of the newspaper was 571,500 copies111New York Times Company form 10-K, 2017.. The newspaper began its publications with about 20,000 articles/year growing gradually to reach 130,000 articles in 2016.
-
2.
Il Corriere della Sera (CDS). The first issue dates back to March 5th 1876 and is available in the online archive (http://archivio.corriere.it/). Originally an evening newspaper, it became a morning paper in 1888 and was issued twice a day since 1892 and up two to three times a day in the first part of the XXth Century, but it has been printed as a daily newspaper for several decades. Its offices were bombed on 14/2/1943. Following the liberation of Italy from Nazi occupation, the Committee of National Liberation (Comitato di Liberazione Nazionale) suspended its publications between 27/4 - 21/5 1945. It resumed publications under the name ‘Corriere d’Informazione’ and, from 1946, as Il Nuovo Corriere della Sera, with a one-page edition[14, 15]. CDS passes from 7,000 articles/year of the first years to 125,000 articles/year in 2017. The FAQ of the archive reports that it contains about 2.5 million of pages scanned. In December 2017 it printed 310,275 copies222 Data on number of printed copies retrieved from http://www.adsnotizie.it .
-
3.
La Repubblica (REP) begun publications in January 1976, but the online archive
(https://ricerca.repubblica.it/ ) starts on January 4th, 1984, with the first entry of “morti” occurring on March 4th, 1984. In December 2017 it printed 274,745 copies. REP starts with 24,000/year in 1985 to reach 377,000 articles in 2017. -
4.
La Stampa (STA). The digitalization of this archive (http://www.archiviolastampa.it/) was performed by the Committee for the Journalistic Information Library (Comitato per la Biblioteca dell’Informazione Giornalistica CBDIG). The archive is released under a Creative Commons license and covers the period from the first issue, February 9th, 1967, when it was called Gazzetta Piemontese (Piedmont Gazette) to December 31st, 2005. Except for a few entries in 1882, all articles up to and included 1909 are referenced in image form with the title ‘Notizia’ (‘News’) and no further information on the contents of the article. Several entries after 1909 are stored in this way, thus reducing the overall time range of the dataset. The Fascist government halted publications of La Stampa in the month of October 1925 as a warning to all publishers. A few days after resuming publications (November 3rd 1925), Alfredo Frassati, Director of the newspaper for 25 years, resigned to be replaced by directors gradually more aligned with the government. Following the liberation of Italy from Nazi occupation, the Committee of National Liberation (Comitato di Liberazione Nazionale) suspended its publications between 28 April - 17 July 1945 (no entries in the database)[16, 17]. In December 2017 it printed 208,615 copies. STA increases from 10,000 articles/year to a maximum of 500,000 articles/year in 2001, decreasing at 200,000 in 2005, the last year present in the archive.
2.2 Lemmas considered
This work concerns the study of the occurrence of the following terms:
-
•
‘Killed’ (in English) and ‘morti’ (plural for Italian). Note that the literal translation of killed in Italian language is uccisi, but this word is less frequent than morti and usually (but not always) employed in association with murder. Morti is more often associated with violent accidental death and thus has a wider correspondence in usage with killed. Articles with the keywords casualties/vittime, occur with a lower frequency than killed/morti (10 to 30 less). The English term is more strongly associated with dead or wounded during armed conflicts and has peaks during major US wars (Civil, WW1, WW2, Korea, Vietnam etc…). In case of the Italian newspapers, the correlation is lower, since vittime is more often used for people killed in accidents, natural disasters, and so on.
-
•
‘Suicide’ (in English) and ‘suicidio’ (in Italian).
-
•
‘morta’ and ‘morto’ (in Italian), respectively feminine and masculine singular form of ‘morti’.
Some methods discussed below can be applied to any lemma, although the distribution law and last digit analysis is usable in other ‘quantitative’ keywords such as ‘dead’, ‘victims’, and the already mentioned casualties, will be the subject of future work.
2.3 Construction of the Data sets
1. Query and pre-processing. Each data set has been constructed by querying the web servers of the four newspapers with Python scripts that emulated manual user input (Figure 1). The input had to be configured for each archive in order to enter the desired keyword and iterate the requests over the time interval of the newspaper archive. The html pages received in reply to the query were then saved locally. Their overall number depends from the number of articles present in each page: we range from the of NYT to the of CDS. As mentioned, this data acquisition / preprocessing phase over the newspaper archives takes 5 to 7 days to complete, depending on the newspaper considered333We used the selenium (https://www.selenium.dev/) package with python bindings to automatize the interaction with the archives..
We could not access the full articles since they are often present only in image form (especially in the years 1850-1910) and the necessary work and resources would have been almost equivalent to those required for the digitization of the newspaper itself. Furthermore, the work would only have resulted in a marginally higher efficiency in event detection and would not have changed the results.
We define an ‘event’ as a newspaper article retrieved upon the query of the keyword killed/morti. In our data sets, each event contains the newspaper name, the date, and the page (not present in NYT) of the article, the text of the title, and - if present - a part of the text of the article.
2. Parse. The html pages are then subsequently parsed with Python regular expressions that extract the relevant article information (title, snippet, page number, date, etc…). This phase takes a few minutes to complete.
3. Filter. Sometimes the query only returns a link with no usable text: for instance a title can be empty (especially for issues of the XIX century), incomplete, or does not contain the requested word. These events have been discarded (in the case of STA, this restricts the database to the period 1910-2005 for most purposes).
4. Text Analysis. The events are then analyzed to find the number of people killed. This is searched in numeric, text, and hybrid form. To reduce classification errors, the value of is searched close to the keyword in the forms: ‘ killed’, ‘killed ’, ‘ attribute killed’, ‘killed attribute ’. Title and text are also parsed to search for the type of event (e.g. car, airplane crash, war, illness), and the people involved (e.g. children, women, ethnicity), that will be the subject of a following paper.
5. Geographical analysis. Several databases of world places have been used to associate the location event to its country of origin. Cases of homonymy (Florence, Paris, Cairo…) have been resolved assigning the location of the more famous ones at that time. For instance, ‘Cairo’ entries in the years 1861-1865 have been assigned to the US since the location appeared often during the American Civil War.
6. Exclusions. Duplicate entries, that is articles identical in title, text, and date are then removed, but different reports on the same event are considered as separate since it means that they have been considered worthy of more than one article. See Table 1 for the size of the datasets according to the various selections.
All events reporting deaths of animals (fish, herd, cows, etc.), usually associated with high have been discarded.
From foreign events we also excluded all articles where the words ‘Italian’ or ‘US’/‘American’ appear associated with foreign countries, thus removing foreign events where citizens from the corresponding newspaper-printing country were involved. This amounted to less than in peacetime.
Once the parsing of the archives is completed, the remaining processing steps in this phase take a few minutes to execute and produce the database / root files for the subsequent analysis. This represents an increase of several orders of magnitute in speed in respect to any traditional, manual-scanning method which had to be necessarily constrained to a limited amount of time and newspaper issues.
2.4 Errors
Statistical errors are due to fluctuations in the number of events present in a given bin of a given selection. Fitting algorithms take into account the errors associated with each bin to calculate the errors of the fitted parameters.
Sources of systematic errors can be due to OCR (Optical Character Recognition) misidentification. This is more frequent for old issues where the quality of the scanned pages is lower and can result in a lower efficiency for the first years of the newspapers.
This can be assumed to be independent of the number, type, or location of people killed so that the temporal behaviour and distribution laws should not be affected. See the Supplementary Information for a discussion on systematic errors.
3 Results and Discussion
The analysis of the data sets created above can yield information on how the newspapers consider the various events depending on geographic location, historical period, or gender. In this section, we describe the main algorithms employed and the results they provide. The various algorithms, the processing steps, and the key results derived, are also schematized in Figure 2.
3.1 Historical events
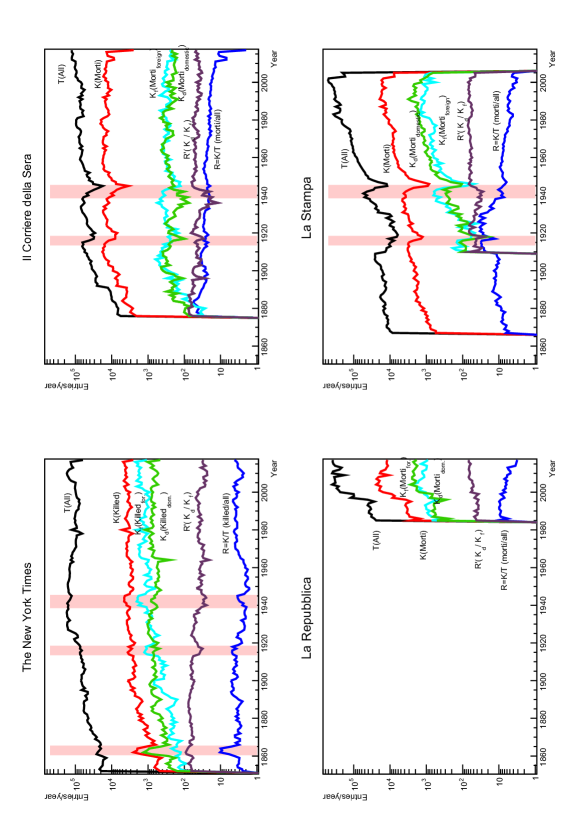
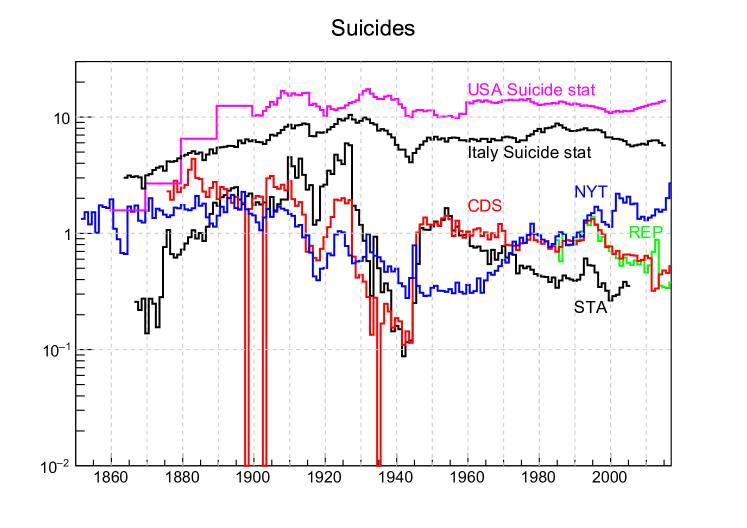
Figure 3 shows the yearly total number of articles, . Major historical events can also affect this value: for instance, it increases in NYT during the US Civil War due to more articles being published and decreases in CDS and STA during the two World Wars due to due to shortage of materials resulting in fewer pages being published.
In the same Figure the number of articles with the keyword ‘killed’, , is also shown. From it, we can derive the normalized fraction of ‘killed’ events in respect to the total: (shown in the same Figure), a value more affected by historical events.
For the events with a determined location, it is possible to separate domestic () from foreign () occurrences and assess how their relative importance evolved with time (Figure 3). NYT reporting on foreign deaths grows over time to become more frequent than domestic at the onset of WW1 and permanently from WW2 on. The Italian newspapers divide the reporting between domestic and foreign cases roughly equally, with CDS covering more foreign events in the more recent years and STA and REP the domestic cases. The other relevant features are the foreign peaks during the World Wars and the drop in the domestic deaths between 1923 and 1945 for STA and CDS, due to censorship from the Fascist government (see below).
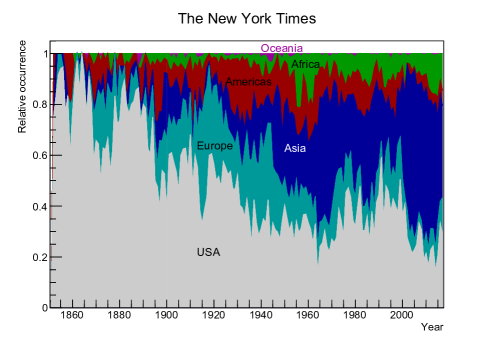
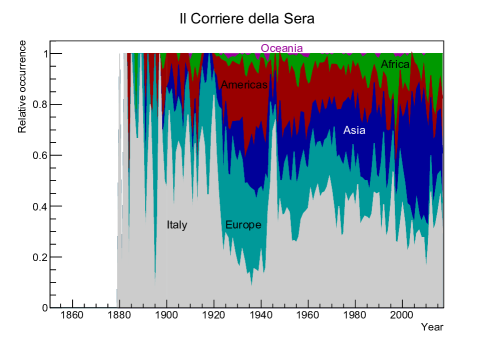
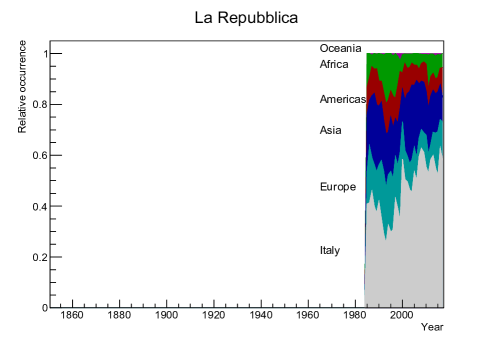
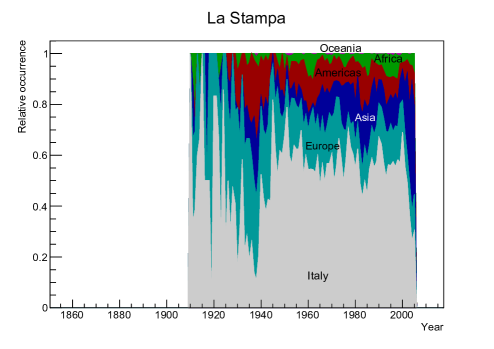
In Figure 4 are shown the relative contributions of the various continents and their evolution over time, showing a gradual reduction of the coverage of European events and a growing importance of Asia after WW2. Some major occurrences are:
3.1.1 American Civil war (12/4/1861-13/5/1865)
During the American Civil war, the total number of NYT articles increases by in respect to the interpolated values of between 1861 and 1865. increases to a maximum of the pre-conflict value (the keyword ‘casualties’ has an increase of ). Conversely, the number of suicides drops to a minimum of .
3.1.2 World War 1 (28/7/1914-11/11/1918, Italy from 23/5/1915, US from 6/4/1917)
Censorship was very strong in all countries involved in both World Wars, with the removal of all information who could be beneficial to the enemy: letters, reporting of battles and defeats, casualties etc.[18].
In NYT the value of increases from to . The domestic event ratio drops from to , reaching a minimum of , when the US declared war to Germany.
In Italy, the shortage of resources resulted in a reduction of the number of pages of CDS and STA from 8 (two double sheets) to 4 (one double sheet of paper). Consequently, decreased to and . The effect of censorship is evident in STA: its value of drops from to a minimum of (for CDS is more constant). In both newspapers, there is an even higher drop in domestic events (not necessarily only due to censorship but also to a lack of interest): from to . For CDS, R drops from to .
During wars the rate of suicides is known to decrease: this phenomenon is usually explained by the higher sense of purpose during the bellic effort[19, 20, 21] and is found to occur both when one’s country or other countries are at war. However, the decrease of suicides reporting by newspapers is more prompt and intense (dropping to 1/3 of the pre-war value) than that recorded by statistics. Since in both countries this occurred in 1914, before either country was at war we can conclude that this was not directly related to censorship. In Italy, the number of articles on suicides passes from to and reaches a minimum of before returning to . A similar behaviour is found for CDS (and NYT): from () to ( ) at the beginning of WW1 to a minimum (). The drop before the US or Italy entered the war suggests to attribute the lack of suicide reporting to a reduced interest by the editorial rooms rather than to censorship.
3.1.3 Fascist government in Italy (31/10/1922 - 25/7/1943)
Different is the case during the Fascist government in Italy. The Italian government of the time exercised a strong censorship on printed press and radio. On 14/7/1924 a circolare (note) from the then Minister of Interior Federzoni allows the sequestering of copies of newspapers to ’prevent stirring up public opinion’. On 31/12/1924 all newspapers are sequestered and the directors replaced with ones affiliated with the regime. In October 1926, several daily newspapers were closed until the end of WW2. Among them L’Unità, L’Avanti! and L’Ora[15, 14].
Government censorship aimed to present an efficient state and thus had to remove all negative news. Censorship involved all media of the time: radio, theater, movies, books, and newspapers. Authors, especially those of Hebraic origin but also those who were against the regime for political reasons, fell in disfavour. This ‘targeted’ censorship was similar to what occurred in Germany and reported in[10], where prominent individuals were mentioned to a greater or lesser extent according to their race or standing in respect to the Nazi government.
On a wider scale, government guidelines[16, 17] to newspapers required that crime reporting had to be compressed in a few lines, and suicides had to be ignored, with the result that articles involving domestic deaths and accidents almost disappeared from newspapers. With the datasets of CDS and STA it is possible to quantify the overall effect of Fascist censorship in the reporting of violent deaths [22, 23].
As a result, even though the value of remains more or less constant, in 1923 drops from () to () reaching a minimum of () (Figure 3). These values come back to pre-dictatorship values of () immediately after the war when both newspapers had their publications halted and their directors were replaced between April and May (July for STA) 1945.
We estimated the amount of censorship for articles with morti interpolating the value of between 1922 and 1946: between 1923 and 1943 there were 2,800 domestic articles with at least two casualties missing for CDS and 2,900 for STA. In both cases, they amount to of the articles featuring domestic deaths printed in the same period.
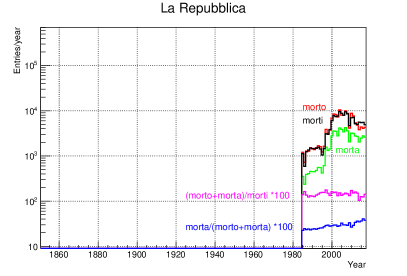
A similar analysis on the events (morto, morta, see Figure 5) yields about articles censored by STA ( of those printed in the period considered) and by CDS ( of those printed in the period considered).
In the case of suicides (another forbidden topic during the regime[15]), Figure 6 gives () for CDS and 4,100 () for STA, in contrast with the growing rate of suicides at the time[20, 24].
Overall we estimate that CDS censored articles and STA during this period, with an average of for CDS and for STA.
3.1.4 World War 2 (1/9/1939 - 2/9/1945, Italy from 10/6/1940 as part of the Axis and from 8/9/1943 as part of the Allies, USA from 7/12/1941)
Censorship in US during WW2 relied mostly upon the self-censorship of news outlets: forbidden topics included weather and crop reports, correspondence, travel schedules and naturally troop movements[25]. The Office of Censorship released on January 15, 1942, the Code of Wartime Practices for American Broadcasters and the Code of Wartime Practices for the American Press. The publication of any pictures depicting US soldiers killed in combat was forbidden until September 1943, when the capitulation of Italy might have induced in the general public the idea that the war was to end soon[18].
The total number of articles of NYT remains essentially unchanged, with increasing only in 1940, from to . This is due to an increased amount of reporting of casualties prior to the entrance in the conflict. This is confirmed by the value of , from to a maximum of , again before Pearl Harbor. Afterward, since US soil was not attacked, the amount of reporting of domestic events was not affected so we can conclude it was not affected by censorship.
The effect of WW2 in Italy is mostly evident in the sharp drop in and in the later years of the war. This was both due to paper shortage and the bombings on Milano and Torino, where the newspapers were printed. After the armistice with the Allied forces (8/9/1943), Italy was split between the South, controlled by the Allies and La Repubblica di Salò in the North. After a short period free from Fascist government, CDS and STA are then aligned to the Nazi-controlled government of the North so the definition of ‘domestic’ and ‘foreign’ becomes fuzzier and the ratio increases.
3.1.5 Recent decades
If we consider the reporting of deadly accidents in the last decades we see that it is constant or decreasing: in the NYT, after doubling between 1960 and 1969, remains - with fluctuations - constant up to 2017.
The Ratio for STA decreases gradually after 1954, with .
Also CDS exhibits a similar but stronger decrease: .
For REP, the amount of articles reporting violent death increases with time but its percentage after 1995 decreases by . We note that this trend of decreasing coverage given to violent events in all three Italian newspapers is opposite to the growth of the perceived threat of violence in Italy[26], so this phenomenon cannot be ascribed directly to press coverage.
3.2 Gender Bias
In Italian newspapers, where the language allows to distinguish gender, we have also queried the databases for the term ‘morto’/‘morta’ (), respectively the singular () masculine, and feminine form in the Italian language. ‘Morte’, the feminine plural could not be used since it also means ‘death’ in Italian and it would be difficult to semantically separate the two meanings. Besides, if both males and females are involved the term ’morti’ is used in Italian language, making the lemma ’morte’ of little use.
From Figure 5 we see that the amount of reporting of female deaths (morta) is only of all deaths. This has to be compared with the fatal accident standardized death rate (in 2005) in Italy of 36.1 (male) and 19.2 (female) per 100,000 deaths [27], and the probability for a 15-year old individual to die within 45 years, before reaching the age of 60 (45q15)[28] in 2010 of for men and for women.
Therefore, even accounting for the fact that male violent deaths are more frequent than female ones444For instance, in US the number of fatal occupational injuries for US in 2016 involved women in and men in of cases, for an almost equal number of worked hours ( for women and for men)[29]. and that these events would be more likely to be reported in the news, this still hints to some amount of gender bias in reporting. The female/male ratio of is present in all newspapers and roughly constant over the years, with only REP showing an increase of reporting of female deaths of about , from in 1985 to of 2007.
3.3 Scaling laws
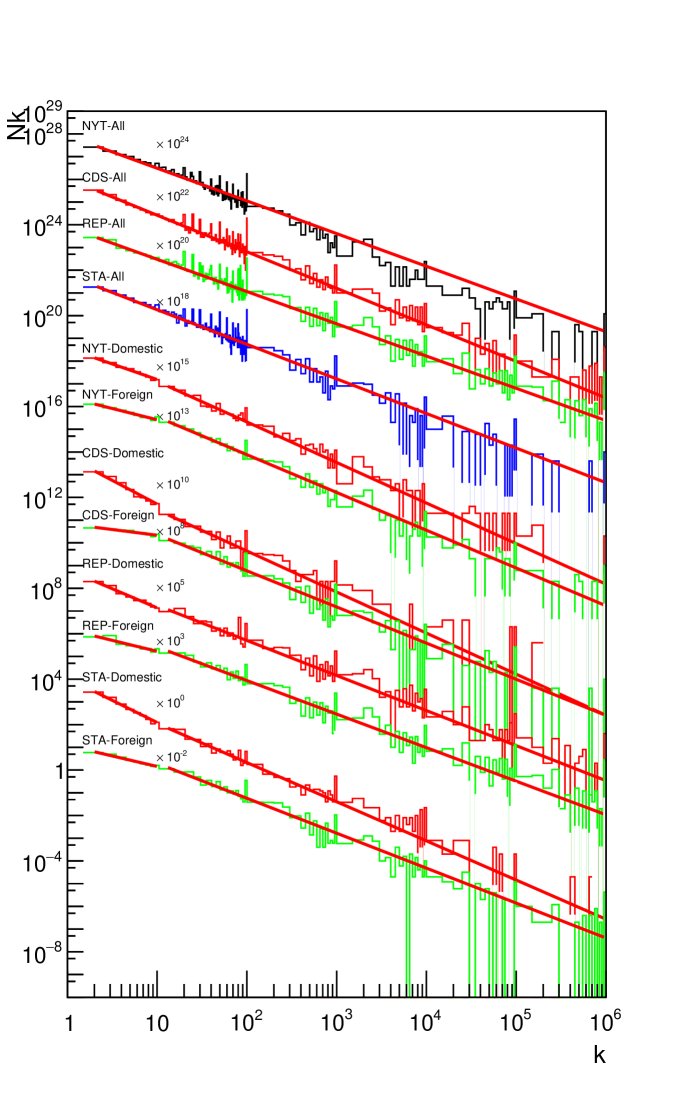
The analysis of keywords associated with the number of persons involved allows to build the distribution function of the number of articles, , reporting people killed. As shown in Figure 7, the distributions for all four newspapers considered can be described by a single power-law:
| (1) |
in the range . The sharp peaks in for values of that are multiples of 10, 100, 1000… are due to the rounding in excess to the nearest multiple of a power of 10 of the number of people reported (see below).
The Minuit[30] package (now in its second release, Minuit2) has been used to perform the fits.
Fitting of the power laws has been analogous to the methods that we used in the fitting of cosmic ray spectra of the PAMELA space-borne detector[31], [32], [33] (see also ext. data therein). Tests with varying bin sizes have shown no significant change in the fitting results and values of .
See Section 7 for the mathematical details; a discussion of the fitting methods and error systematic can be found in the Supplementary Information.
Power-law statistics has been found to describe the distribution of various natural phenomena, e.g. earthquakes[34], forest fires[35], [36], the cluster size of tropical trees[37], and is usually thought to arise through positive growth feedback [38], [39].
Galactic cosmic ray spectra also follow a power law, as a result of the statistical process of acceleration. Changes in the spectral indexes show the presence of additional sources or production phenomena[32], [33].
Power law distributions are also encountered in many human-related activities[40], from language distribution (Zipf law[41], [42]), the number of casualties in wars[43], [44], and ethnic violence [45]. Also in these cases, they have been shown to arise through a ‘winner takes all’ type of a competitive network where a few elements grow to acquire a very large size [46], [47].
In newspapers, the distribution can be explained as the result of two main phenomena:
-
•
The convolution of various violent events and accidents. Road, train, air accidents, natural disasters and catastrophes have each their frequency and probability distribution, usually unknown but decreasing as increases.
Articles with often do not describe a specific accident, but rather summarize global phenomena such as war, illness deaths (cancer, heart attack…) or automobile accidents per year, etc… .
-
•
The selection by the newsroom. The publishing criteria can change with time, location or censoring: events with higher will have a higher probability of being selected for their importance. Conversely, foreign events, occurring in countries physically or socially far from the country where the newspaper is printed, will be more likely to be ignored, especially for low .
Both phenomena can be approximated by a power law, with probability for an event to involve casualties, and a probability (or efficiency) for the event to be picked by the newsroom. The overall probability is then with .
The values of of the four newspapers (, , , , Table 2) show that the editorial processes are similar in Italy/US and converge to a narrow range of values, although the differences among them reflect the different emphasis to high/low events in the newspapers. A ‘steep’ spectrum, with a high , results in a higher number of articles with low and vice-versa. Defining we see (Table 2) that it ranges between (more articles with low k) and (fewer articles with low k) with and having intermediate values (see Section 7 and Figure 12 for a calculation of the value of as a function of ).
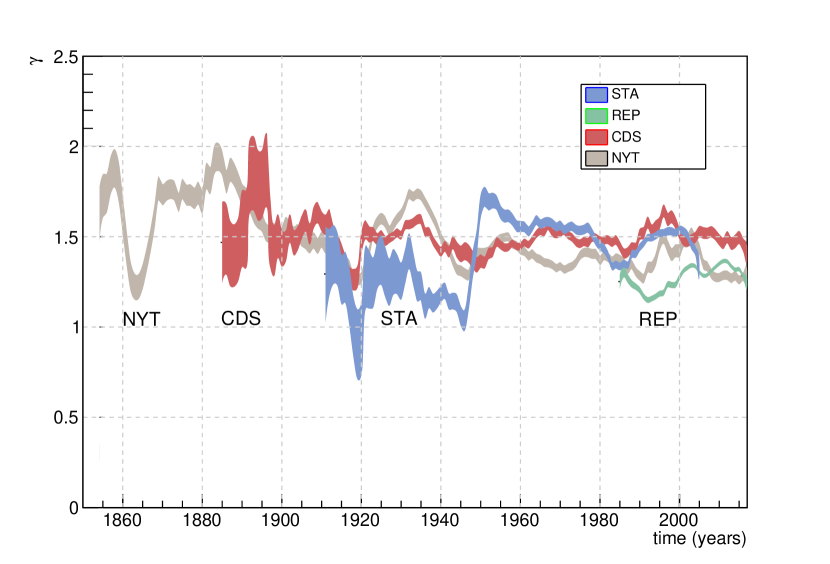
The trend of the spectral index can be used to estimate the state of belligerence reported by the newspapers: the running average (current and four preceding years) of (Figure 8) decreases in wartime due to the higher abundance of high events results in a flatter distribution. Vice-versa in peacetime, when the distributions are dominated by low events, increases due to a steeper distribution. Thus, local minima in are present in NYT during the US Civil War (), the two World Wars (, ) and the Vietnam War (). Also, CDS and STA show similar local minima during WW1 ( and ) and WW2 (, ), followed by a sharp increase in STA (and more gradual in CDS) after 1945. It is also interesting to note that - notwithstanding the differences in - the trends of the spectral indexes of the newspapers are in good agreement among each other. This suggests that they all tend to react similarly to the conflicts occurring in the world (and vice-versa a discrepancy in the trend would indicate the presence of censorship).
| Newspaper | Loc. | |||
|---|---|---|---|---|
| NYT | All | 1.44 0.01 | 9 | 0.93 0.01 |
| CDS | All | 1.61 0.01 | 7 | 0.57 0.01 |
| REP | All | 1.42e 0.01 | 16 | 1.00 0.01 |
| STA | All | 1.52 0.01 | 9 | 0.72 0.01 |
| Newspaper | Loc. | M | ||||
|---|---|---|---|---|---|---|
| (Excess/Defect ) | ||||||
| NYT | Dom. | 1.37e+00 3e-03 | 1.78 1e-02 | -0.417 1e-02 | 3e+01 | 4 |
| NYT | For. | 9.90e-01 3e-03 | 1.66 5e-03 | -0.672 5e-03 | 6e+01 | -98 |
| CDS | Dom. | 2.08e+00 3e-03 | 1.81 2e-02 | 0.277 2e-02 | 2e+01 | 71 |
| CDS | For. | 5.02e-01 3e-03 | 1.59 5e-03 | -1.09 6e-03 | 1e+02 | -122 |
| REP | Dom. | 1.69e+00 3e-03 | 1.54 6e-03 | 0.143 7e-03 | 2e+02 | 16 |
| REP | For. | 9.66e-01 3e-03 | 1.48 4e-03 | -0.511 5e-03 | 1e+02 | -91 |
| STA | Dom. | 1.95e+00 2e-03 | 1.72 1e-02 | 0.2311 1e-02 | 4e+01 | 47 |
| STA | For. | 9.23e-01 3e-03 | 1.54 5e-03 | -0.615 6e-03 | 9e+01 | -94 |
3.4 Geographical bias
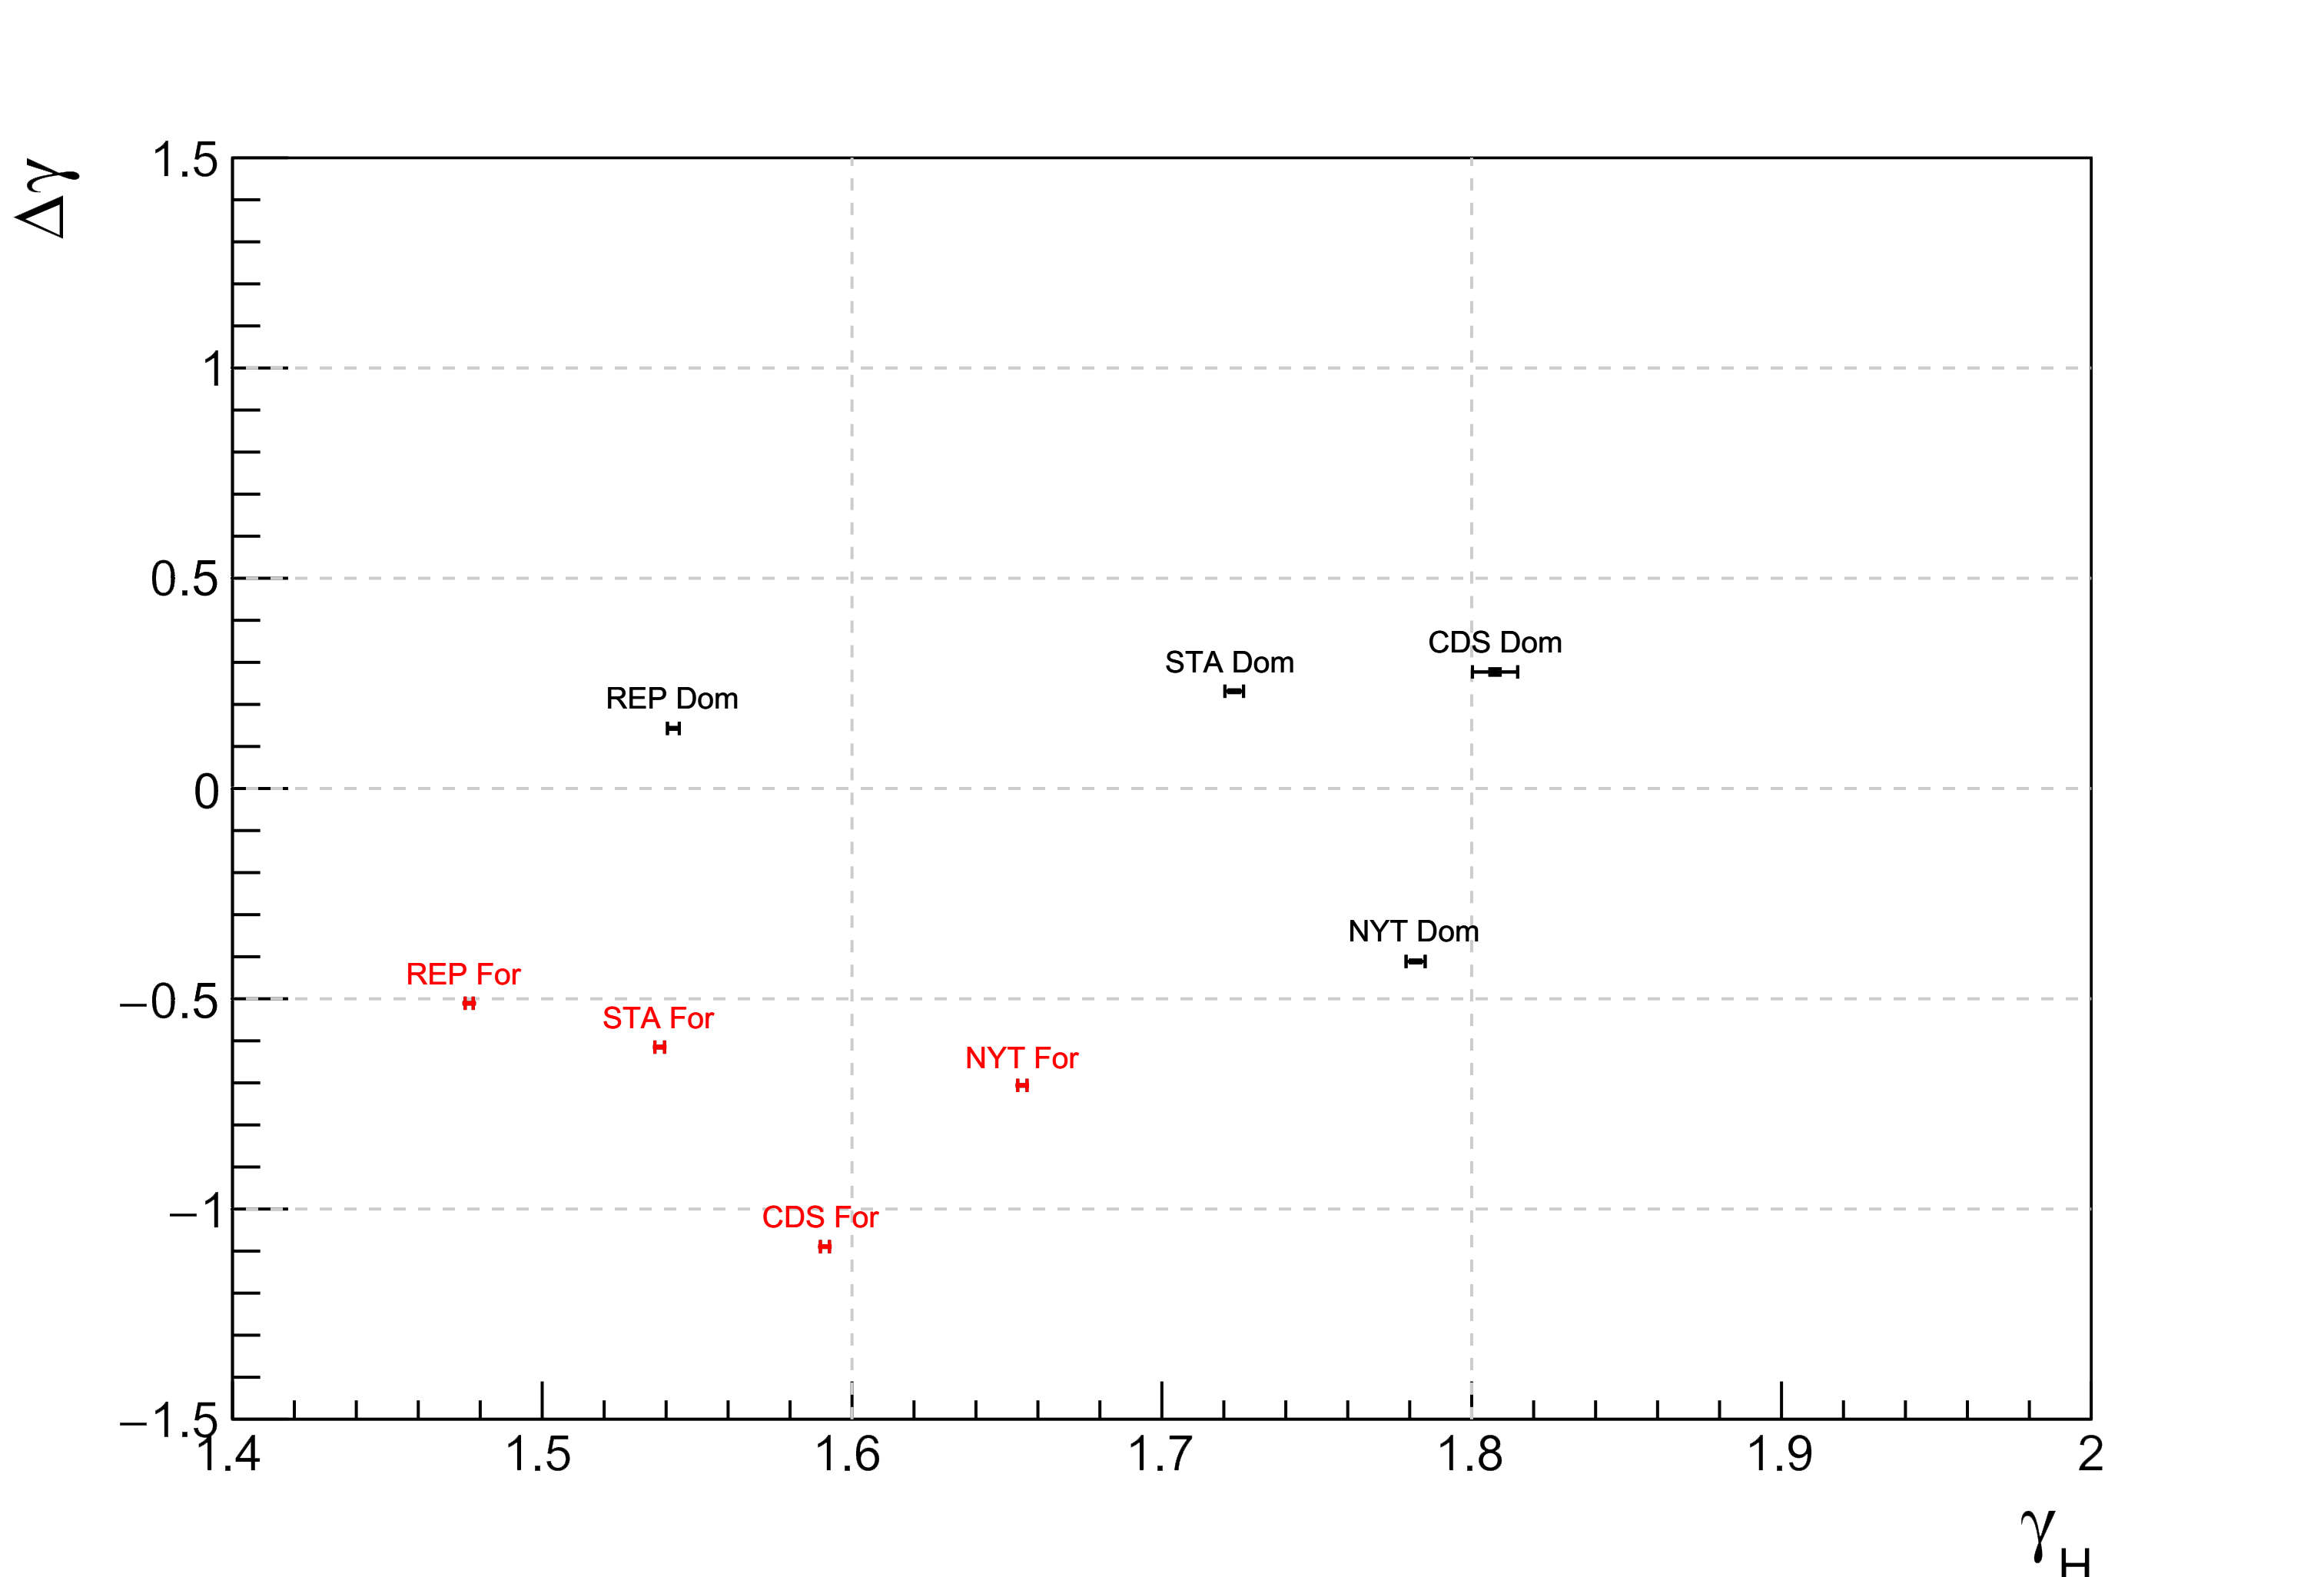
In our case, using the articles where a location could be determined, we built distribution laws for domestic and foreign events. In Figure 7 it is possible to see that the latter have a strong spectral break for (absent or less prominent in the former). Fitting the distribution function with two power laws and we see that is always negative for foreign events, ranging from to . For Italian newspapers featuring domestic events, the distributions are closer to a pure power law (highest for CDS). In all cases is positive, implying that a higher emphasis is given to low events. NYT has a smaller discrepancy between foreign () and domestic events (). A plot of the value of (Figure 9) shows that the foreign and domestic categories are clearly separated in all four newspapers (Table 3). This suggests a difference in the editorial behaviour due to a lack of press coverage of accidents involving a small number of persons in foreign countries, considered to be not interesting enough to be reported in the press.
An estimation of the under- or over-reporting of low events can be provided by the extrapolation of to :
| (2) |
with and coming from the power law fit of . Thus, M is the fraction of events with missing () or exceeding () the value expected from a pure power law distribution (). All four newspapers have in the foreign case, meaning that the editorial room decides to print only one event out of two if it involves ten or fewer casualties in a foreign country. We also note that Italian newspapers tend to print more news of domestic events (from of REP to of CDS) than what expected from a pure power-law distribution. This can be attributed in part to a large domestic and local news section. Overall CDS has the largest difference in dealing with foreign and domestic events ( - ) and the NYT the smallest ( - ). See Section 7 and Figure 13 for a calculation of the value of as a function of and .
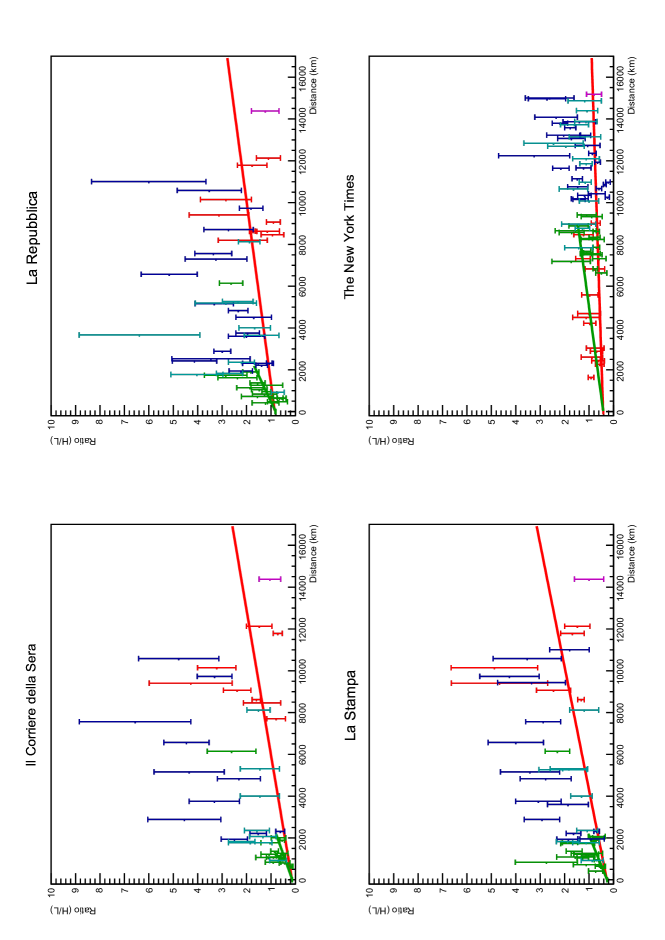
In many nations, there are too few events reported to perform an acceptable fit with a power law, therefore - for countries having at least 30 entries in a given newspaper - we used the ratio the as an indicator of the intrinsic importance assigned to a given country.
In Figure 10, is plotted as a function of the distance between the capital of the country and Rome/Washington, according to the newspaper. It is possible to see how the value of tends to increase with the distance (fewer events with low and more with high ). The geographical bias appears to be stronger in Italian newspapers: a linear fit (Table 4) shows that the slopes are similar in Italian newspapers and higher by a factor compared to NYT, a sign of an higher internationalization of the US paper: ; and , .
Social proximity effects also play a role in defining the values of the various countries: as also visible in Figure 10, American countries have lower than equally distant Asian and African ones.
If we limit the fit to countries in Europe (for Italian newspapers) and in America (for NYT) we find that the slopes are higher by a factor 2 to 4 than for those considering all world nations (Table 4) a sign that geographical distance plays a stronger role for countries that are socially closed to either Italy or US (although the different geography of the American continent plays a role in the different behaviour).
| Newspaper | All World | Europe / America |
|---|---|---|
| NYT | 2.700.3 | 122 |
| CDS | 14.40.9 | 303 |
| REP | 11.51 | 409 |
| STA | 171 | 354 |
3.5 Editorial rounding by excess of casualties as an additional tool to detect censorship
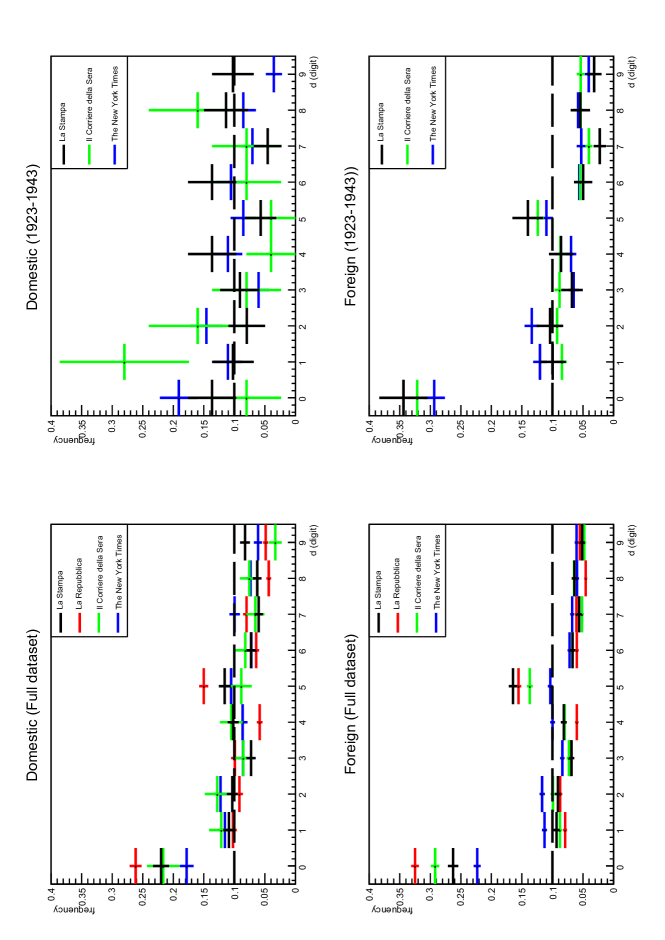
Newspapers often round up the number of casualties reported: this can be due to lack of knowledge, to simplify the headline, or to purposely increase emphasis to attract the attention of the reader. In the absence of tampering, we would expect the least significant digit of , to follow a uniform distribution (). However, in Figure 11, which shows the distribution for , it is possible to see how the values ‘0’ and ‘5’ are overabundant (‘5’ only in the Italian papers) and the others under-abundant in respect to the flat distribution expectation. The number of defects in the digits ‘6’ to ‘9’ are close to the excess of ‘0’ (and similarly for ‘1’ to ‘4’ with ‘5’), confirming the artificial nature of the reported number of casualties. Overall, Italian newspapers have a value of and NYT has a value of 32 (with respect to the 20 expected for the sum of the bins). All distributions (see Table T1 in the suppl. mat.) are incompatible with the null hypothesis of the flat distribution with .
This distribution is found in all newspapers and historical periods with one notable exception: during the Fascist government, the domestic distributions of STA and CDS do not exhibit the peaks for and , still present in the corresponding foreign distributions of the same period. A test allows us to reject the hypothesis that foreign and domestic histograms of Italian newspapers follow the same distributions with . Furthermore, the domestic distributions of STA and CDS are the only ones that are not incompatible with the equiprobable one (Figure S3 and Table T1 in the Supplementary Information). This implies that during the Fascist regime the editorial practice was to report more faithfully the number of domestic casualties as an additional way of suppressing these events and at the same time exaggerating the number of foreign casualties.
This phenomenon is similar but specular to Benford’s law[48, 49], which describes the statistical distribution of the most significant digit in several natural and man-made datasets[50]. Benford’s law has been used to determine the presence of accounting[51] or election fraud[52], since values that are artificially altered do not follow it.
4 Conclusions
In this work we have developed a series of techniques to automatically scan the complete historical databases of daily newspapers for the occurrence of specific keywords related to accidents and death. We also devised various algorithms to analyze the dependence of these keywords from the geographical location and historical period. Over traditional analysis, consisting of manual scanning of the newspaper articles, these tools offer the advantage of being automatic and thus being applicable on larger datasets spanning longer time periods. Indeed, these tools are suited for historical analysis to evaluate quantitatively the presence of bias or censorship in a given publication and its variation over time and political environment. This paper considered printed daily newspapers, but these techniques can be used also on online publications, news outlets, etc… Although the usage is limited only to articles with quantitative keywords, where to the event (accident, casualty, death…) is associated the number of persons involved (The simpler word occurrence methods can be used on a wider word set), this type of analysis is complementary to the assessment of ’fake news’ since has the advantage of being automatic and operating on large data sets. These tools can also contribute to the assessment of the freedom of the press in a given country.
Future work will extend the application of these tools to other lemmas such as casualties, wounded, victims. The analysis will be applied to differences in reporting between the type of accidents, both of man-made origin (e.g. train/airplane/ship) and natural calamities. Also the structure of reporting as a function of the day of the week and the page location will be considered. On a larger scope. also other newspapers, magazines, online publications will be considered, extending the analysis to look for the presence and evolution of ethnic or national bias. A more long-term goal can also be the use of speech recognition methods to study the occurrence of these lemmas on radio and TV.
5 Abbreviations
-
•
CDS - Il Corriere della Sera
-
•
NYT - The New York Times
-
•
OCR - Optical Character Recognition
-
•
REP - La Repubblica
-
•
STA - La Stampa
-
•
WW1 - World War 1
-
•
WW2 - World War 2
6 Declarations
6.1 Availability of data and material
The newspaper archives are accessible at these locations:
New York Times: https://www.nytimes.com/search/
Il Corriere della Sera http://archivio.corriere.it/
La Repubblica: https://ricerca.repubblica.it/
La Stampa: http://www.archiviolastampa.it/
6.2 Acknowledgments
The author is grateful to Dr. A. Truzzi for the useful and stimulating discussions during the preparation of this work and Drs U. T. Casolino, W. Husein, O. Larsson, L. Marcelli, L. Sorge and M. Piersanti for reviewing the manuscript.
The author also wishes to thank the four newspapers considered (The New York Times, Il Corriere della Sera, La Repubblica, La Stampa) for having their historical archives freely available for consultation: without these resources the paper could not have been written.
7 Appendix. Estimation of the missing events
For a power-law distribution of the number of articles reporting that people have been killed:
| (3) |
the total number of articles with two or more people killed is:
| (4) |
for a given we have therefore that:
| (5) |
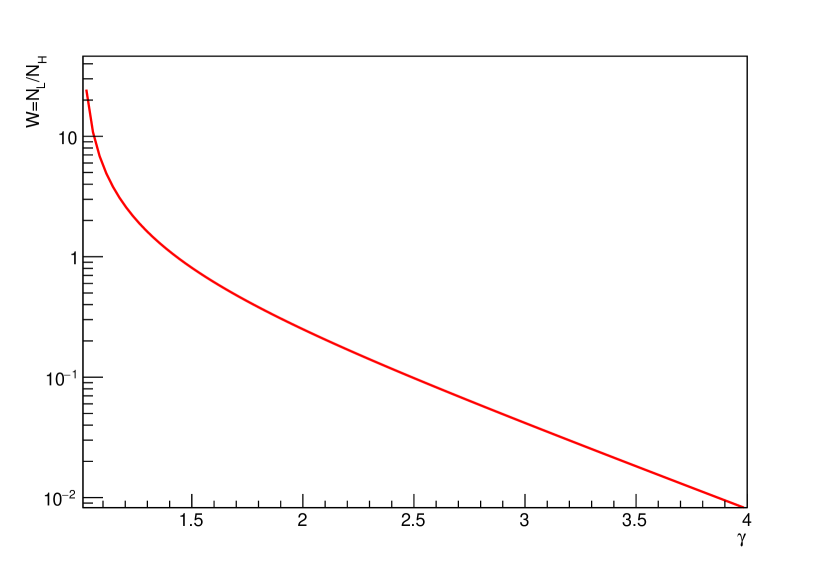
In a single power law, the ratio of articles with less () and more () than 10 people dead, is:
| (6) |
A high value of implies an emphasis on articles with low and vice-versa. For we have an equal number of articles with and (Figure 12).
For a broken power law distribution:
| (7) |
so
| (8) |
| (9) |
| (10) |
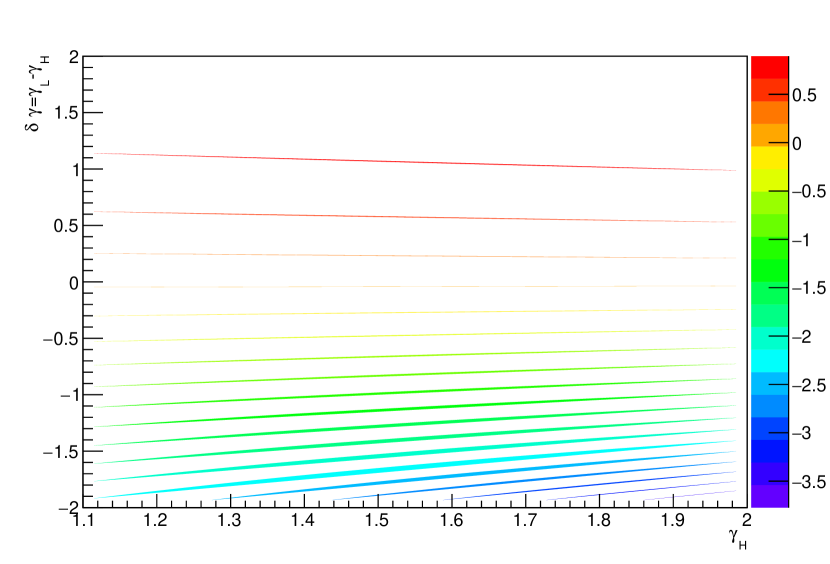
The excess () or defect () in respect to a pure power law () thus depends on the two values and . They are shown in Figure 13.
References
- [1] Ariès P, Ranum P. Western Attitudes toward Death: From the Middle Ages to the Present. Western Attitudes toward Death. Johns Hopkins University Press; 1975. Available from: https://books.google.it/books?id=3sZJN3wojesC.
- [2] Combs B, P S. Newspaper coverage of causes of death. Journalism Quarterly’s. 1979;61:837–843,849.
- [3] Altheide DL. Creating Reality: How TV News Distorts Events. A SageMark edition. Sage Publications; 1977. Available from: https://books.google.it/books?id=ml21yAEACAAJ.
- [4] Hanusch F. VALUING THOSE CLOSE TO US. Journalism Studies. 2008;9(3):341–356. Available from: https://doi.org/10.1080/14616700801997281.
- [5] Burdach KJ. Reporting on Deaths: The Perspective Coverage of Accident News in a German Tabloid. European Journal of Communication. 1988;3(1):81–89. Available from: https://doi.org/10.1177/0267323188003001005.
- [6] Stigler SM. Francis Galton’s Account of the Invention of Correlation. Statist Sci. 1989 05;4(2):73–79. Available from: https://doi.org/10.1214/ss/1177012580.
- [7] Dember WN, Warm JS. Psycology of Perception. New York: Holt, Rinehart and Winston; 1979.
- [8] jen Tsang K. News Photos in Time and Newsweek. Journalism Quarterly’s. 1984;56(723):578–584.
- [9] Hanusch F. Graphic death in the news media: present or absent? Mortality. 2008;13(4):301–317. Available from: https://doi.org/10.1080/13576270802383840.
- [10] Michel JB, Shen YK, Aiden AP, Veres A, Gray MK, , et al. Quantitative Analysis of Culture Using Millions of Digitized Books. Science. 2011;331(6014):176–182. Available from: http://science.sciencemag.org/content/331/6014/176.
- [11] Smith R, Antonova D, Lee DS. Adapting the Tesseract Open Source OCR Engine for Multilingual OCR. In: Proceedings of the International Workshop on Multilingual OCR. MOCR ’09. New York, NY, USA: Association for Computing Machinery; 2009. Available from: https://doi.org/10.1145/1577802.1577804.
- [12] Niyogi P. The Informational Complexity of Learning: Perspectives on Neural Networks and Generative Grammar. Springer US; 1998.
- [13] Brun R, Rademakers F. ROOT — An object oriented data analysis framework. Nuclear Instruments and Methods in Physics Research Section A: Accelerators, Spectrometers, Detectors and Associated Equipment. 1997;389(1):81 – 86. New Computing Techniques in Physics Research V. Available from: http://www.sciencedirect.com/science/article/pii/S016890029700048X.
- [14] Smith DM. Storia di cento anni di vita italiana visti attraverso il Corriere della sera. Rizzoli; 1978.
- [15] Melograni P. Il Corriere della sera (1919-1943). Cappelli Editore; 1965.
- [16] Nicola Tranfaglia ML Paolo Murialdi. La stampa italiana nell’età fascista. Editori Laterza; 1980.
- [17] Murialdi P. Storia del giornalismo italiano. Il Mulino; 2014.
- [18] James D Ciment TR. The Home Front Encyclopedia: United States, Britain, and Canada in World Wars I and II. vol. vol 1-3. 1st ed. ABC-CLIO; 2006.
- [19] Rojcewicz SJ. War and Suicide. Suicide and Life-Threatening Behavior;1(1):46–54. Available from: https://onlinelibrary.wiley.com/doi/abs/10.1111/j.1943-278X.1971.tb00598.x.
- [20] Somogyi S. Il suicidio in Italia 1864-1962. Analisi statistica. Milano: Giuffrè edit; 1967.
- [21] O’Malley P. SUICIDE AND WAR: A Case Study and Theoretical Appraisal. The British Journal of Criminology. 1975;15(4):348–359. Available from: http://www.jstor.org/stable/23636204.
- [22] Felice RD. Mussolini e il fascismo. Mussolini il duce. Lo stato totalitario 1936-1940. vol. Vol. 5. Einaudi; 1996.
- [23] Aquarone A. L’organizzazione dello Stato totalitario. Einaudi; 1995.
- [24] Alessandri G. Il suicidio in Italia. Aggiornamenti sociali. 1971;1(22):45–56.
- [25] Sweeney MS. Secrets of Victory: The Office of Censorship and the American Press and Radio in World War II. 1st ed. The University of North Carolina Press; 2001.
- [26] ISTAT. La percezione della sicurezza. Statistical Report. 2018;Available from: https://www.istat.it/it/archivio/217502.
- [27] Eurostat;. [Online; accessed September 2018]. https://ec.europa.eu/eurostat/web/health/causes-death.
- [28] Rajaratnam JK, Marcus JR, Levin-Rector A, Chalupka AN, Wang H, Dwyer L, et al. Worldwide mortality in men and women aged 15–59 years from 1970 to 2010: a systematic analysis. The Lancet. 2010 May;375(9727):1704–1720. Available from: https://doi.org/10.1016/S0140-6736(10)60517-X.
- [29] of labor statistics USB;. [Online; accessed September 2018]. https://www.bls.gov/iif/oshwc/cfoi/cfch0015.pdf.
- [30] James F. MINUIT Function Minimization and Error Analysis: Reference Manual Version 94.1. CERN-D-506. 1994;.
- [31] Adriani O, Barbarino GC, Bazilevskaya GA, Bellotti R, Boezio M, Bogomolov EA, et al. The PAMELA Mission: Heralding a new era in precision cosmic ray physics. Physics Reports. 2014;544(4):323 – 370. The PAMELA Mission: Heralding a new era in precision cosmic ray physics.
- [32] Adriani O, Barbarino GC, Bazilevskaya GA, Bellotti R, Boezio M, Bogomolov EA, et al. PAMELA Measurements of Cosmic-Ray Proton and Helium Spectra. Science. 2011 Apr;332:69–.
- [33] Adriani O, Barbarino GC, Bazilevskaya GA, Bellotti R, Boezio M, Bogomolov EA, et al. An anomalous positron abundance in cosmic rays with energies 1.5-100GeV. Nature. 2009 Apr;458:607–609.
- [34] Bak P, Tang C. Earthquakes as a self-organized critical phenomenon. Journal of Geophysical Research: Solid Earth;94(B11):15635–15637. Available from: https://agupubs.onlinelibrary.wiley.com/doi/abs/10.1029/JB094iB11p15635.
- [35] Malamud BD, Morein G, Turcotte DL. Forest Fires: An Example of Self-Organized Critical Behavior. Science. 1998;281(5384):1840–1842. Available from: http://science.sciencemag.org/content/281/5384/1840.
- [36] Telesca L, Amatucci G, Lasaponara R, Lovallo M, Rodrigues MJ. Space time fractal properties of the forest-fire series in central Italy. Communications in Nonlinear Science and Numerical Simulations. 2007 Oct;12:1326–1333.
- [37] Condit R, Ashton PS, Baker P, Bunyavejchewin S, Gunatilleke S, Gunatilleke N, et al. Spatial Patterns in the Distribution of Tropical Tree Species. Science. 2000;288(5470):1414–1418. Available from: http://science.sciencemag.org/content/288/5470/1414.
- [38] Scanlon TM, Caylor KK, Levin SA, Rodriguez-Iturbe I. Positive feedbacks promote power-law clustering of Kalahari vegetation. Nature. 2007 Sep;449:209 EP –. Available from: http://dx.doi.org/10.1038/nature06060.
- [39] Yakovlev G, Newman WI, Turcotte DL, Gabrielov A. An inverse cascade model for self-organized complexity and natural hazards. Geophysical Journal International. 2005 Nov;163:433–442.
- [40] Clauset A, Shalizi CR, Newman MEJ. Power-Law Distributions in Empirical Data. SIAM Review. 2009;51(4):661–703. Available from: https://doi.org/10.1137/070710111.
- [41] Newman M. Power laws, Pareto distributions and Zipf’s law. Contemporary Physics. 2005;46(5):323–351. Available from: https://doi.org/10.1080/00107510500052444.
- [42] Moreno-Sanchez I, Font-Clos F, Corral A. Large-Scale Analysis of Zipf’s Law in English Texts. PLOS ONE. 2016 01;11(1):1–19. Available from: https://doi.org/10.1371/journal.pone.0147073.
- [43] Richardson LF. Variation of the Frequency of Fatal Quarrels with Magnitude. Journal of the American Statistical Association. 1948;43(244):523–546. Available from: https://www.tandfonline.com/doi/abs/10.1080/01621459.1948.10483278.
- [44] Cederman LE. Modeling the Size of Wars: From Billiard Balls to Sandpiles. American Political Science Review. 2003;97(1):135–150.
- [45] Lim M, Metzler R, Bar-Yam Y. Global Pattern Formation and Ethnic/Cultural Violence. Science. 2007;317(5844):1540–1544. Available from: http://science.sciencemag.org/content/317/5844/1540.
- [46] Barabási AL. The origin of bursts and heavy tails in human dynamics. Nature. 2005 May;435:207 EP –. Available from: http://dx.doi.org/10.1038/nature03459.
- [47] Bohorquez JC, Gourley S, Dixon AR, Spagat M, Johnson NF. Common ecology quantifies human insurgency. Nature. 2009 Dec;462:911 EP –. Available from: http://dx.doi.org/10.1038/nature08631.
- [48] Newcomb S. Note on the frequency of use of the different digits in natural numbers. American Journal of Mathematics. 1881;4:39–40.
- [49] Benford F. The Law of Anomalous Numbers. Proceedings of the American Philosophical Society. 1938;78(4):551–572. Available from: http://www.jstor.org/stable/984802.
- [50] Morzy M, Kajdanowicz T, Szymanski BK. Benford’s Distribution in Complex Networks. Scientific Reports. 2016 Oct;6:34917 EP –. Available from: http://dx.doi.org/10.1038/srep34917.
- [51] Durtschi C, Hillison W, Pacini C. The Effective Use of Benford’s Law to Assist in Detecting Fraud in Accounting Data. J Forensic Account. 2004 01;5.
- [52] Jimenez R, Hidalgo M, Klimek P. Testing for voter rigging in small polling stations. Science Advances. 2017;3(6). Available from: http://advances.sciencemag.org/content/3/6/e1602363.
- [53] Dunn HL. Vital Statistics of the United states. Government of the United States of America; 1945.
- [54] OECD2018. Suicide rates (indicator), 10.1787/a82f3459-en;. Available from: https://www.oecd-ilibrary.org/social-issues-migration-health/suicide-rates/indicator/english_a82f3459-en.


8 Supplementary online material
8.1 Systematic error associated to finite sample of newspapers
To asses the systematic error arising from the finite sample of the events for a given selection we have performed the power law fitting on different subsets, each obtained removing a percentage of random events from those passing the cut. Fitting has been performed on each of these distributions and the resulting values of histogrammed. The sigma resulting from a Gaussian fit of each histogram of values of at a given can be used as an estimation of the systematic error associated to the spectral index .
Values of have been removed to test the robustness of the algorithm to the finite data set. As expected, the error grows more slowly with the increase of for larger samples. For instance, for the overall spectral index of the newspapers (see Figure 14) this goes from 0.002 for to 0.02 for . If we assume a very conservative value of as incompleteness of the data set, we can estimate the systematic error due fitting to be 0.07 for the full dataset. Unless otherwise noted, this value has been added to the statistical errors in the plots.
8.2 Distributions of least significant digit
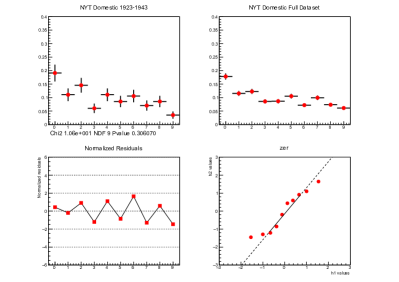
For NYT (Figure 15 shows the test comparing various distributions of the least significant digit for NYT: domestic - foreign, domestic - flat, foreign - flat, all - flat (full dataset). From the resulting Chi2 and p value it is possible to see how none of the distributions are compatible with a flat hypothesis. The analysis of the residuals and the QQ plot show how the highest deviations occur in the digits corresponding to ‘0’ and ‘5’).
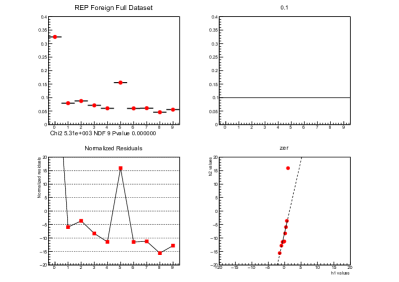
Figure 17 shows the test for STA comparing various distributions of the least significant digit: domestic 1923-1943 - foreign, domestic 1923-1943 - domestic full dataset, domestic 1923-1943 - flat, domestic full dataset - flat. From the resulting Chi2 and p value it is possible to see how the distributions of the domestic 1923-1943 are not incompatible with the flat distributions whereas the foreign one in the same period or the domestic full dataset are incompatible with the flat distribution. Also 1923-1943 domestic and foreign distributions are incompatible. A similar behaviour is found for CDS (Figure 16). Figure 18 shows the for REP.
See also Table 5 for the P test values.


![[Uncaptioned image]](/html/2007.13735/assets/x34.png)