Heavy Elements Nucleosynthesis On Accreting White Dwarfs: building seeds for the -process
Abstract
The origin of the proton-rich trans-iron isotopes in the solar system is still uncertain. Single-degenerate thermonuclear supernovae (SNIa) with n-capture nucleosynthesis seeds assembled in the external layers of the progenitor’s rapidly accreting white dwarf phase may produce these isotopes. We calculate the stellar structure of the accretion phase of five white dwarf models with initial masses 0.85 using the stellar code MESA. The near-surface layers of the 1, 1.26, 1.32 and 1.38 models are most representative of the regions in which the bulk of the nuclei are produced during SNIa explosions, and for these models we also calculate the neutron-capture nucleosynthesis in the external layers. Contrary to previous rapidly-accreting white dwarf models at lower mass, we find that the H-shell flashes are the main site of n-capture nucleosynthesis. We find high neutron densities up to several 1015cm-3 in the most massive WDs. Through the recurrence of the H-shell flashes these intermediate neutron densities can be sustained effectively for a long time leading to high neutron exposures with a strong production up to Pb. Both the neutron density and the neutron exposure increase with increasing the mass of the accreting WD. Finally, the SNIa nucleosynthesis is calculated using the obtained abundances as seeds. We obtain solar to super-solar abundances for -nuclei with A96. Our models show that SNIa are a viable -process production site.
1 Introduction
At the end of the Asymptotic Giant Branch (AGB) evolution, low mass and massive AGB stars (M 8 ) loose all their envelope, and cool down as carbon-oxygen (CO) white dwarfs (WD) (e.g., Herwig, 2005; Karakas & Lattanzio, 2014). However, a fraction of those CO WDs that are part of a binary system can evolve differently, and explode as thermonuclear supernovae (SNIa, e.g., Hillebrandt et al., 2013), if the CO mass can reach the Chandrasekhar limit (1.39 M⊙). Since the mid-twentieth century, accreting WDs have been the subject of a large number of studies (e.g., Mestel, 1952). In this section, we focus on those studies most relevant to this work. Neglecting any possible effect of rotation of the stellar progenitor, a new born CO WD cannot be more massive than 1.1 (Herwig, 2005). Therefore a successful accretion of at least 0.3 from a companion is required in order to reach the Chandrasekhar limit. This can mainly happen in two ways: 1) The WD accretes material from a main-sequence or evolved companion (single-degenerate scenario, hereafter SD, e.g. Whelan & Iben, 1973; Nomoto et al., 1984); 2) The WD merges with another CO WD being its companion in the binary system (double-degenerate scenario, hereafter DD, e.g. Iben & Tutukov, 1984; Webbink, 1984). Observational evidence has been found for both channels. Mazzali et al. (2007) reported a spectral analysis of a large sample of SNIa, indicating that all the supernovae considered here burned similar masses and suggesting that their progenitors had the same mass, thus favoring a SD channel. On the other hand, Pakmor et al. (2012) showed how synthetic spectra from violent mergers of massive white dwarfs can closely resemble spectra of the bulk of SNIa (see also Maoz et al., 2014; Seitenzahl et al., 2019).
Sion et al. (1979) and Paczynski (1983) modelled the long-term evolution in close binary systems of accreting WDs, focusing on H-shell flash occurrence on the WD surface during the accretion and on their dependence on the accretion rate. Paczynski (1983) introduced a one-zone formalism that has been adopted later by e.g., Shen & Bildsten (2007). In these and similar studies (e.g. Nomoto et al., 2007; Ma et al., 2013; Starrfield et al., 2012), the evolution of the deeper He-burning layers, which are ignited when enough Helium is accumulated from the above H-burning layers, is not followed in detail, and only the feedback to the He luminosity is considered (see also Nomoto et al. (2007), Ma et al. (2013) and Starrfield et al. (2012)). In this work, stable H-burning conditions on accreting WDs are considered, and the dependence of various H-burning regimes (unstable, nova-recurrent, stable burning and super-Eddington limit) on the accretion rate, on the accreted material metallicity and on the WD mass is defined. In particular, at the same time we follow the evolution of the He-burning layers, simultaneously simulating H and He flashes. One of the first works to model both H and He flashes was that presented by Jose et al. (1993), performing a numerical two-zone study. Later, Tornambé et al. (2000) highlighted that, during the accretion phase, He-flash thermal pulses (hereafter TPs) strongly reduce the capability of the star to retain the accreted mass, making it more difficult for the SNIa SD scenario to reach the Chandrasekhar mass.
Langer et al. (2000) studied the evolution of close binary systems consisting of a main sequence star and a white dwarf, resolving both components of the binary system, but treating the WD as a material point, i.e. without resolving its structure. With this setup, they investigated the properties of the systems as a function of the initial donor star mass, initial WD mass, initial revolution period, and chemical composition. They obtained that, in order to reach the Chandrasekhar limit, the initial mass of the WD when the accretion starts should be at least 0.7 M⊙. However, the authors did not consider the mass-retention limiting effect given by He-flashes.
Denissenkov et al. (2017) modelled rapidly accreting white dwarfs (RAWDs) that follow He-shell flashes. This study indicated that the He retention efficiency after a flash is less than 10% for solar metallicity, thereby suggesting that the SD channel for SNIa is unlikely. This result is consistent with observations by Woods & Gilfanov (2013), who showed how the measured emission by the He II recombination is much lower than expected if the SD scenario was the dominant SNIa channel. In particular, for photospheric temperatures between 105 and 106 K, characteristic of 1.1 CO WDs, accreting above the steady nuclear-burning limit, they showed how the SD channel would imply a substantial contribution to the HeII-ionizing continuum. Consistent with Woods & Gilfanov (2013), Johansson et al. (2016) found that the SD channel should contribute to about 3%-6% of the total SNIa rate, based on spectroscopic observations of a large sample of early-type galaxies. On the other hand, Kobayashi et al. (2019) looked at the galactic chemical evolution (GCE) of Mn with respect to Fe. Indeed, a single-degenerate channel is needed to reach the observed [Mn/Fe] in the Sun, since the high densities (2108 g cm-3 ), essential for Mn production (see Thielemann et al., 1986), are only found in near-Chandrasekhar-mass WD explosions, which are naturally formed in the SD scenario. They concluded that up to 75% of all SNIa must be near-Chandrasekhar-mass in order to explain the present Mn content in the Sun. This is in disagreement with a similar study recently presented by Eitner et al. (2020), who suggested that only 25% of SNIa comes from near-Chandrasekhar-mass exploding WDs. Despite the disagreement between these GCE studies, even the lower SD contribution obtained by Eitner et al. (2020) is about a factor of five larger than what obtained by Johansson et al. (2016).
In conclusion, studies using different observables predict highly discrepant estimations on the fraction of SNIa originating from the SD or the DD channels. While this issue must be addressed by future studies, the results presented in this work have been obtained assuming a successful SD channel scenario in reaching the Chandrasekhar limit.
SNIa are fundamental sources for galactical chemical evolution. They produce iron group elements in the ejecta exposed to the most extreme SN conditions (e.g., Iwamoto et al., 1999; Brachwitz et al., 2000). In the ejecta exposed to less extreme conditions, intermediate mass elements like Si and Ca are made, as also confirmed from optical spectra of recent SNIa remnants (e.g., Filippenko, 1997; Hillebrandt et al., 2013, and references therein). Moreover, SNIa are considered potential sources for the so called -process, the nucleosynthesis process responsible for the production of a small fraction of the total abundances beyond iron in the Solar System, made up of proton-rich isotopes called the -nuclei. Howard et al. (1991), for the first time, considered Carbon-Oxygen WD explosions as able to provide the right conditions for -nuclei production, provided a fundamental assumption is made: heavy element (56A209) rich material is present, at the onset of the explosion, in the outer accreted layers of the SNIa progenitor. In this way, a chain of photo-induced reactions (the -process Audouze & Truran, 1975; Arnould, 1976) synthesises the -nuclei during the explosion, starting from the initial heavy element seed distribution. This assumption was tested also by Kusakabe et al. (2011), who analyzed the effects of different seed distributions on -production using the one-dimensional W7 model (Nomoto, 1984). They found that, in all cases of seed distribution considered, about 50% of -nuclides had an abundance ratio /56Fe consistent with the observed solar value (where the in the ratio is the abundance of a given -isotope, produced during the SNIa explosion). On the other hand, they were not able to produce, at the same level as 56Fe, the Mo and Ru -nuclei. Previous studies (e.g. Woosley & Howard, 1978; Rauscher et al., 2002) found the same underproduction of 92Mo, 94Mo, 96Ru and 98Ru, even when considering different explosive scenarios, like Type II Supernovae.
Travaglio et al. (2011) (hereafter TRV11) and more recently Travaglio et al. (2015) calculated high-resolution 2D hydrodynamic models of SNIa. Differently from Kusakabe et al. (2011), they adopted a multi-dimensional approach and highly resolved the most external layers, as a good resolution of the outer zones of the SNIa, where -process takes place, is fundamental for -nuclei production. TRV11 obtained that almost all the -process nuclei could be produced with similar enhancement factors relative to 56Fe, including the puzzling 96Ru and 98Ru and a much higher production of 92Mo, 94Mo compared to previous studies. On the other hand, they confirmed the crucial role of Howard et al. (1991) assumption about the initial -process seed distribution, which is meant to be produced as a consequence of the recurrent He-flashes during the accretion phase considering a SD scenario. Indeed, the -process in SNIa can be efficient only if there is a previous heavy-elements enrichment during the accretion stage, which will act as seed for the -process during the SNIa explosion. Furthermore, this enrichment should be located in the most external layers of the SNIa progenitor, which will experience the right temperature range (1.5 T 3.8 GK)to effectively produce -nuclei via photo-disintegration reactions. If they are located too deep, the temperature conditions are too extreme and the SN shock will completely photo-disintegrate all abundances heavier than the Fe group, including any -process isotope.
Possible sources of heavy element seed abundances in the SNIa progenitor are the -process abundances accumulated during the previous AGB phase. However, these abundances will be buried inside the progenitor during the accretion phase, at mass coordinate 0.6-0.7 M⊙. In the SD case, this region will be first convectively mixed during the simmering phase before exploding as SNIa, where a convective region grows at the WD center over a timescale of 1000 yr (Piro & Bildsten, 2008), including up to about 1 . The -process enrichment built in the AGB He intershell is mixed over the WD structure, with a strong dilution of heavy element enrichment. Therefore, in this scenario there will be no -process material ejected from this stellar region.
TRV11 assumed that, during the accretion phase, the -process material was formed and accumulated in the external 0.2-0.3 M⊙ of the SNIa progenitor, with a distribution typical of the main -process component. Iben (1981) proposed that heavy elements could actually be made in these conditions, where helium accumulates below the accreting H-burning layers until a He-flash occurs. They suggested the (,n) as the main neutron-source during these flashes. That work was a first attempt to access and discuss this possibility, without simulating the accretion phase.
Denissenkov et al. (2017) demonstrated for the first time in multi-cycle He-shell flash simulations that RAWDs can be prodigious producers of neutron-capture elements. The mechanism is a continued H-ingestion during the He-shell flash that does not lead to the dramatice H-ingestion flash observed in single-star post-AGB He-shell flash models Herwig et al. (e.g. 1999); Miller Bertolami et al. (e.g. 2006). In the post-AGB situation the H-ingestion into He-shell flashes leads to an immediate and violent convective feedback of the H ingested into the He-convection zone. In 1D models this leads to a split of the convection zone preventing 13N from the H + 12C reaction to reach the bottom of the He-convection zone where it is hot enough to release neutrons. However, observations of post-AGB star Sakurai’s object (Asplund et al., 1999) demonstrated first-peak heavy-element enhancements of . These observed n-capture elements can be reproduced in models of the H-ingestion into the He-shell flash convection zone if it is assumed that the split of the convection zone due to energetic feedback of the H + 12C reaction is delayed by approximately 60 convective turn-over times or (Herwig et al., 2011). Initial attempts to simulate the H-ingestion flash have shown a complex dynamic interaction between nuclear energy release and a convective response via the Global Oscillation of Shell H-ingestion (Herwig et al., 2014). In the RAWD models on the other hand, the degeneracy of the older WD is much higher and the He-shell flashes are much stronger than in the single post-AGB case. Therefore the H ingestion in the relatively low-mass WDs simulated by Denissenkov et al (2017) do not show the split of the convection zone and can maintain the H-ingestion conditions and the associated high neutron density for many month, thereby creating the conditions for heavy-element production in RAWDs. Denissenkov et al. (2019) presented i-process yields for seven metallicities from solar to [Fe/H] = -2.6 and showed that low-metallicity RAWD models can naturally explain the observed abundance of most CEMP-r/s stars. Côté et al. (2018) showed that RAWDs can have significant contributions to several first-peak neutron-capture species. These models show that RAWDs are efficient producers of trans-iron elements. However, the processes in high-mass accreting WDs have not yet been investigated.
Other -process sites were also considered in addition to SNIa from H-accreting WDs. Goriely et al. (2002) found that He-detonation in He-accreting CO WD is accompanied with an efficient -process. Most of the -nuclei, including the puzzling cases of Mo and Ru isotopes, were found to be co-produced in these conditions in relative quantities close to solar. Unfortunately they were underproduced (except 78Kr) compared to the Ca to Fe species. He-accretor progenitors were considered by Piersanti et al. (2014). They explored the impact of different He accretion-rates on the WD structure, without investigating the nucleosynthesis coming from a SNIa event with this kind of progenitor. On the other hand, they extensively explored the parameter space given by different combinations of WD mass and Helium accretion rates, determining the mass retention efficiency as a function of the accretor total mass and accretion rate. Additionally, they derived interpolation formulae, which could be directly used in population synthesis codes, in order to describe the evolution of WDs accreting He-rich matter. Finally, we must mention the potential role of Type II Supernovae in explaining Solar System abundances of -nuclei: Travaglio et al. (2018) considered the -process in Type II Supernovae, which is very efficient for a wide range of progenitor masses at solar metallicity. Since it is a secondary process, its contribution is strongly reduced below solar metallicity. In particular, Travaglio et al. (2018) found that the contribution from Type II Supernovae to the Solar System content of the -nuclei is less than 10 % , with the only exception of light -nuclei up to 92Mo. Another very interesting feature has been found by Ritter et al. (2018) in O-C shell mergers during the pre-SN of massive stars, with a -process production increased by more than an order of magnitude compared to the explosive -process component. So far this effect has been found at metallicities equal or larger than Z=0.01, while a contribution from lower metallicities, essential to boost the Galactic -process contribution of massive stars, is currently under investigation. For this reason, is essential to consider a complementary -process source that could be represented by SNIa.
In this work we will present our simulations of WDs accreting solar-composition matter. We will investigate the neutron-capture nucleosynthesis of heavy elements during the accretion phase, testing the assumption of TRV11. This work is organized as follow. In Section 2 we describe stellar code and post-processing nucleosynthesis tools. In Section 3 the stellar models are presented, and in Section 4 we describe the nucleosynthesis results of the seeds for the -process. In the same section, we use the seeds we obtained as initial abundances to calculate the explosive nucleosynthesis using our multi-D SNIa model (described in Travaglio et al., 2011), focusing on p-nuclei formation. Our conclusions are given in Section 5.
2 Accreting WD models: main stellar model properties and computational tools
The stellar models presented in this section are computed using the 1D stellar code MESA (MESA revision 4219, Paxton et al., 2010). The accretion itself as well as the mass loss process and the shell burning and mixing process are all subject to important non-spherically symmetric effects. The accretion process is thought to proceed through a disk. In order to justify the spherical approximation, the assumption is that the disk accretion quickly spreads across the white dwarf. MacDonald (1983) showed that shear effects, acting on the surface of WDs accreting material from a viscous disk, can drive dynamical instabilities. Accreted material rapidly spread over the whole stellar surface. This is aided by the fact that the thermal time scale of the outermost layers, where the accretion happens, is shorter than the nuclear time scale on which enough material is accumulated to launch a He-shell flash. In that regard spherically-symmetric simulations are likely well justifies. Another 3D aspect of the problem is the reverse common-envelope evolution that drives the mass loss when the accreting white dwarf expands into the orbit of the companion. This process is usually modeled with a simple Roche-lobe prescription. The uncertainty introduced by this assumption is larger in lower-mass accreting WDs because of the high-mass WDs considered here the super-Eddington wind is dominating the mass loss. Finally, 3D effects are important for the treatment of convective boundaries and the energetic feedback of the H-ingestion process itself as discussed in the introduction. The example of Sakurai’s object shows (Herwig et al., 2011) that observations can be explained if the split of the convection zone is delayed. Such a delay would always enhance the heavy-element production. In our models we do not apply any delay to the convection split induced by H ingestion. In this way the contribution of H ingestion into He-shell flash convection to the overall heavy-element abundance enrichment in our models is underestimated when H ingestion takes place. However, in our models the main contribution to heavy element enrichment in high-mass RAWDs comes from H-shell flashes.
The solar distribution used as a reference is given by Grevesse & Noels (1993). The CO-enhanced opacities are used throughout the calculations, using OPAL tables (Iglesias & Rogers, 1996). For lower temperatures, the corresponding opacities from Ferguson et al. (2005) are used. Mass loss is only considered when Super-Eddington wind conditions are met, which is triggered when the luminosity of the accreting WD exceeds the Eddington luminosity, defined as
| (1) |
where is the WD mass and is the opacity (Nomoto, 1982; Shen & Bildsten, 2007; Ma et al., 2013). Considering a pure ionized H plasma, a simple derivation of the Eddington limit is obtained by setting the force of the outward radiation pressure equal to the inward gravitational force, thus giving:
| (2) |
Once LEdd is defined, if the stellar luminosity L exceeds LEdd mass-loss is calculated according to Paczynski & Proszynski (1986), who determined an analytical relation between the stellar luminosity and the mass outflow rate:
| (3) |
Convective mixing follows the standard mixing length theory (Cox & Giuli, 1968). For MESA simulations the convective boundary mixing (CBM) is computed using the exponential overshooting of (Herwig, 2000):
| (4) |
where dr is the geometric distance to the convective boundary. The term f1Hp0 identifies the scale height of the overshoot regime. The values D0 and Hp0 are respectively the diffusion coefficient and the pressure scale height at the convective boundary.
For the simulations the following nuclear networks are adopted:
1) wd-accr.net, including 33 isotopes from protons to 26Mg linked by nuclear-reactions including the pp chains, the CNO tri-cycle, the triple- and the -induced reactions \isotope[12]C (, )\isotope[16]O , (, ) (e+) , (, ) , \isotope[13]C (, n)\isotope[16]O and (, p) . We use the NACRE (Angulo et al., 1999) reaction rate compilation for most reactions. For the \isotope[12]C (,)\isotope[16]O we adopt the rate by (Kunz et al., 2002), whose values at He-burning temperatures are consistent with deBoer et al. (2017) (see their figure 29). (p, ) by (Imbriani et al., 2004) and the triple- by (Fynbo et al., 2005). This network is used for the main calculations in this work, presented in section 3.2;
2) , which includes 48 isotopes from H to \isotope[30]Si coupled by 120 reactions. The same network was used by e.g., Denissenkov et al. (2013), and, compared to wd-accr.net, it differs by including He-burning reactions. This network is used for the tests presented in section 3.1;
3) , including 13 isotopes from H to \isotope[24]Mg coupled by 56 reactions. This network is used for the tests presented in section 3.1.
We tested an extended version of wd-accr.net, including and linking nuclear species up to \isotope[56]Fe. No significant impact on stellar structure and nucleosynthesis was observed, confirming wd-accr.net to be a suitable network to be adopted for this study.
The initial WD models used to start the simulations are included in the MESA revision 4219, in the folder. For the models presented in section 3.1, we use the MESA WDs models 0.639from3.0z2m2.mod, 0.856from5.0z2m2.mod, 1.025from7.0z2m2.mod and 1.316from8.5z2m2.mod. For the models in section 3.2, we use 0.639from3.0z2m2.mod (initial WD mass Mini = 0.639 ) and 0.856from5.0z2m2.mod (Mini = 0.856 ). In the center they are made of about 30, 68 and 2 on C, O, Ne respectively. They are characterized by an He-rich cap over the CO core, which is a relic of the He-burning layers on top of the CO core, with typical mass fractions 55 He 65, 35 C 45 and 2 O 10.
We also use the following ONeMg WDs: , with 60% O, 30% Ne, 7% C and 3 Mg, and , with 60% O, 37% Ne, and 3 Mg.
Notice that we use ONeMg WDs, that are not SNIa progenitors. This does not impact our results since the physics of interest is in the accreted envelope and independent of interior (Wolf et al., 2013). On the other hand, it is plausible to use these WD models as progenitors assuming that they reached that mass by previous accretion, or by forming recently as hybrid WDs (Denissenkov et al., 2015).
3 Description of the stellar models
3.1 Identification of different burning regimes
In accreting WDs, different burning regimes are possible, mainly depending on the accretion rate, the metallicity and composition of the accreted material. Five main accretion regimes are identified: strong H-shell flashes, mild H-shell flashes, steady H-burning, red-giant and super-Eddington wind.
We modelled accretion adopting an accretion-mass rate within the steady H-burning regime, as this ensures the most favorable conditions to efficiently accrete material, and hence reach the Chandrasekhar-mass limit, are met. Given a specific composition of the accreted material and assuming constant accretion rate, stable burning of H requires accretion rates within a narrow range. Below this range unstable H burning occurs, and above this range the accreted material piles-up building a red giant size envelope, or eventually a strong overflow is set if the nuclear Eddington limit is reached for higher rates. Super-soft X-ray sources have been proposed to be astrophysical sites where steady burning of H accreted onto WDs is taking place (van den Heuvel et al., 1992). For such systems, theoretical stellar calculations found H-rich matter transfer rates ranging around 10-7 yr-1 (e.g., Shen & Bildsten, 2007; Nomoto et al., 2007).
In this section, we present a preliminary study done to identify steady H-burning conditions with the MESA code. The first set of stellar models, focused specifically on the H-burning phase (i.e. they experience no He-flash instabilities), and their basic properties are presented in Table 1. All the models are computed starting from WDs with different masses, described in section 2.
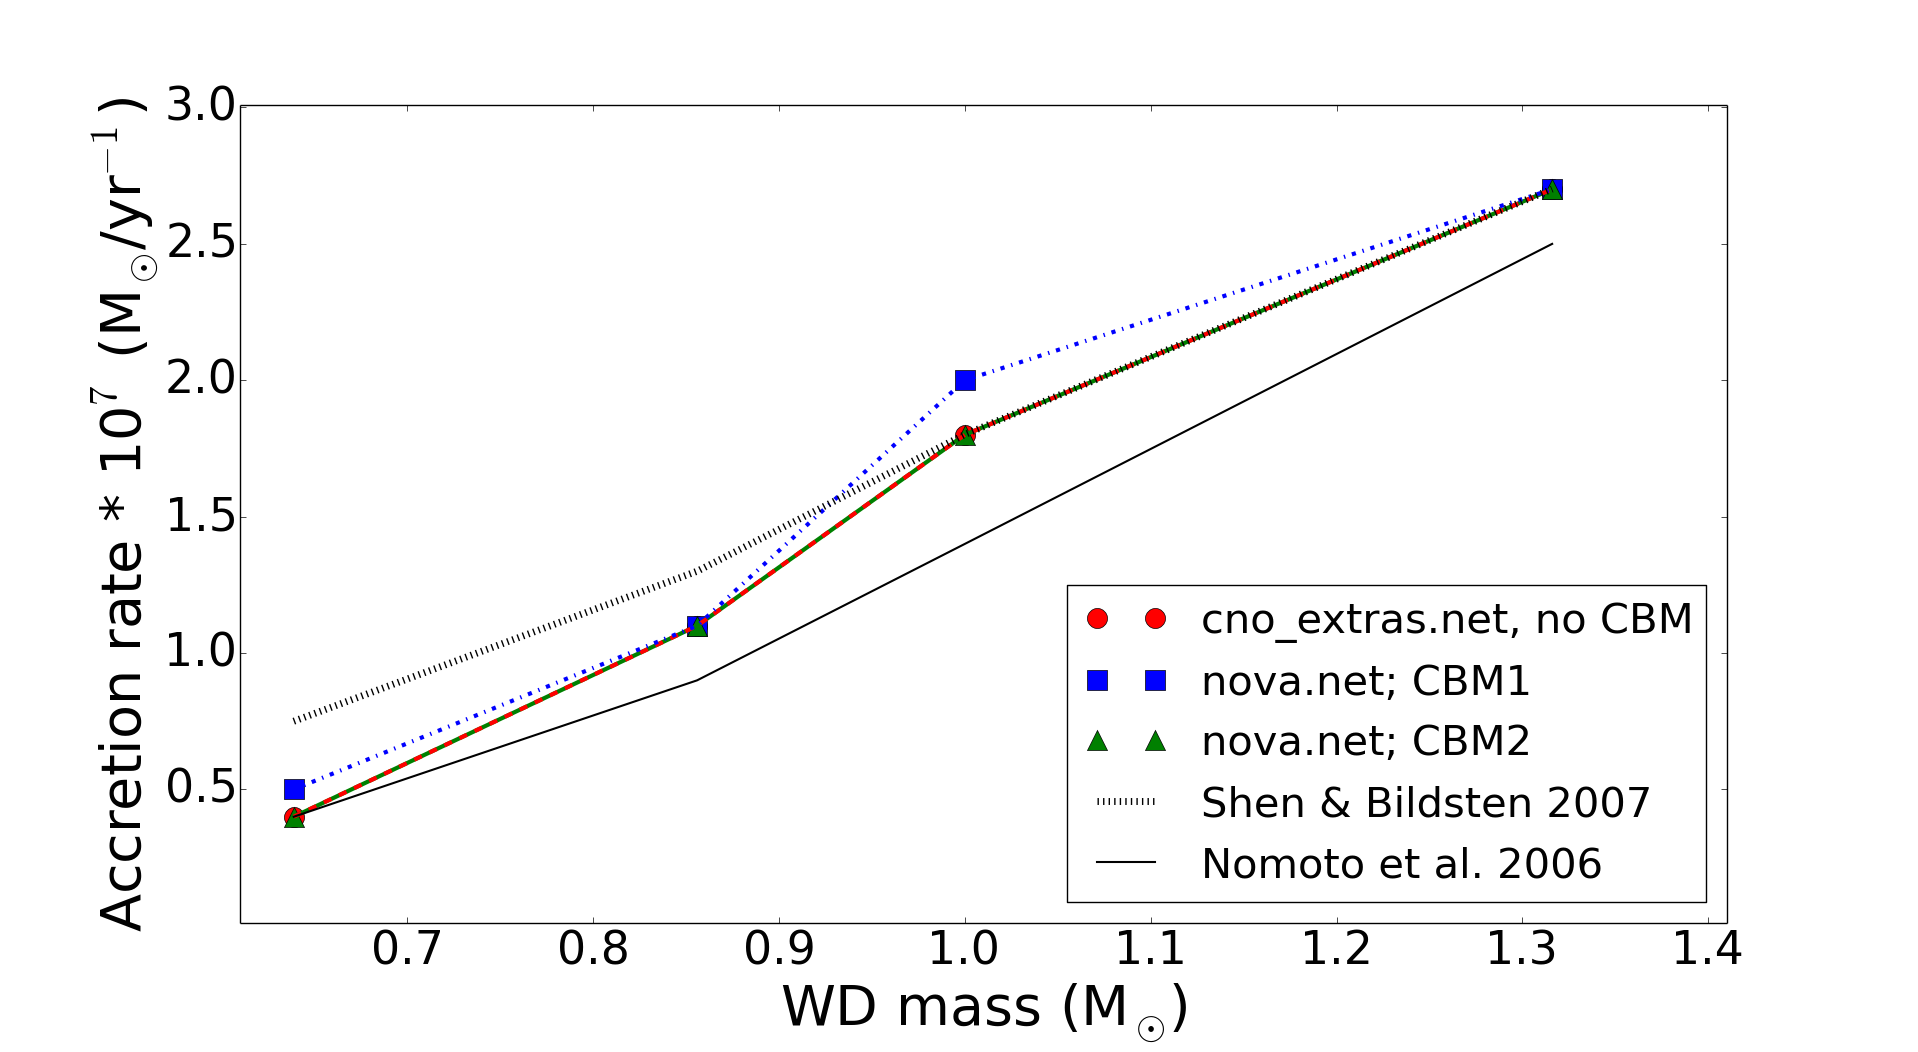
The main goal is to verify the value of the critical mass-accretion rate, which is the transition point from unstable to stable H-burning, as a function of the accreting WD mass. This information will then be implemented in our second set of stellar models, described in the next section and in table LABEL:tab:WDmodel_name, where the stellar structure is computed over a longer timescale, including during the onset of He-flash instabilities. In both tables 1 and LABEL:tab:WDmodel_name, models’ name are given consistently to the fundamental initial models conditions: the initial mass of the accreting WD in units is given after the initial ’M’, while the metallicity of the accreted material is given after the ‘Z‘. For example, M0p856.Z1m2 in table LABEL:tab:WDmodel_name simulates the accretion of Z=0.01 material onto a WD with initial mass M=0.856 M . In table 1, models denoted by were calculated using the MESA CNO-cycle network and no CBM applied. Models denoted by and were calculated using , with the models using the CBM prescription of Denissenkov et al. (2013), i.e. a single-exponential decay overshooting scheme with f=0.004 applied to every convective boundary, and the ones using f=0.014.
These calculations allow to explore the impact of different nuclear networks and CBM schemes. A summary of the results is given in figure 1. For comparison, the results from Nomoto et al. (2007) and Shen & Bildsten (2007) are also included. The results show that: 1) the details of the stable-burning accretion are only marginally affected by the CBM, or 2) by using different networks; 3) a good agreement is obtained between these calculations and Nomoto et al. (2007) and Shen & Bildsten (2007), despite using different stellar codes and simulation setup.
As indicated in the previous section, the accreted material has Z=0.01 metallicity. The results obtained above depend on the metallicity of the accreted material (Shen & Bildsten, 2007). In the next section, we will use the fixed accretion rates indicated in table LABEL:tab:WDmodel_name consistently with the WD initial mass. From the table and from figure 1, the accretion rate needed to burn H steady increases with increasing WD mass as expected (Shen & Bildsten, 2007; Ma et al., 2013). This will also imply a decrease of the interpulse period, between two He-flash episodes, with the WD mass. Paczynski (1974) found the same result in AGB stars, where in that case the relation is between the interpulse period and the CO core mass.
3.2 Accretion models
During the accretion phase, H is efficiently burned via the CNO cycle, accumulating He on stellar layers just below the surface. Eventually, in this way the He shell is compressed and heated in thin-shell conditions, until a thermonuclear run-away occurs, developing a pulse-driven convection zone (hereafter PDCZ, e.g., Tornambé et al., 2000). The accretion phase appears to have similarities with the convective TPs occurrence during the evolution of AGB stars. But the main qualitative difference is that during the AGB phase there is a large H-rich envelope on top of the He-burning region, while in this case there is no envelope. As also indicated by previous works (e.g., Kato & Hachisu, 1999), during the accretion regular convective TPs occur in the He-burning layers. The duration of the accretion phase to reach the Chandrasekhar-mass implies thousands of TPs. However, here we simulate only a limited number of TPs for each initial WD mass, to study the different conditions obtained along the accretion phase.
In table LABEL:tab:WDmodel_name the list of models analyzed in this work together with their main parameters setup, is presented. All the models were calculated using the reaction network and the CBM prescription described by equation 4. Each model is characterized by a fixed accretion rate value, which ensures a stable H-burning. Initial mass, metallicity, CBM parameters and number of TPs simulated are also given in the table. In table LABEL:tab:WDm3z2m2_TPprop, for each model the main stellar properties after each TP event are given. In addition to the mass coordinate at the top and bottom of the He-flash convective zone, for every TP the largest temperature (in logarithm) at the bottom of the flash-convective zone is presented. This is one of the most crucial stellar properties from a nucleosynthetic point of view, since it directly determines the efficiency of the (,n) and the resulting neutron density. Finally, the stellar mass at and after the TP is given, allowing to estimate the mass retention efficiency for each model.
As we mentioned, only a limited number of TPs is simulated for each model. The only exception is model M1p025.Z1m2, where 137 TPs are calculated to explore relevant changes of the TPs properties in a longer sequence, and to study if the accreting WD is actually increasing in mass.
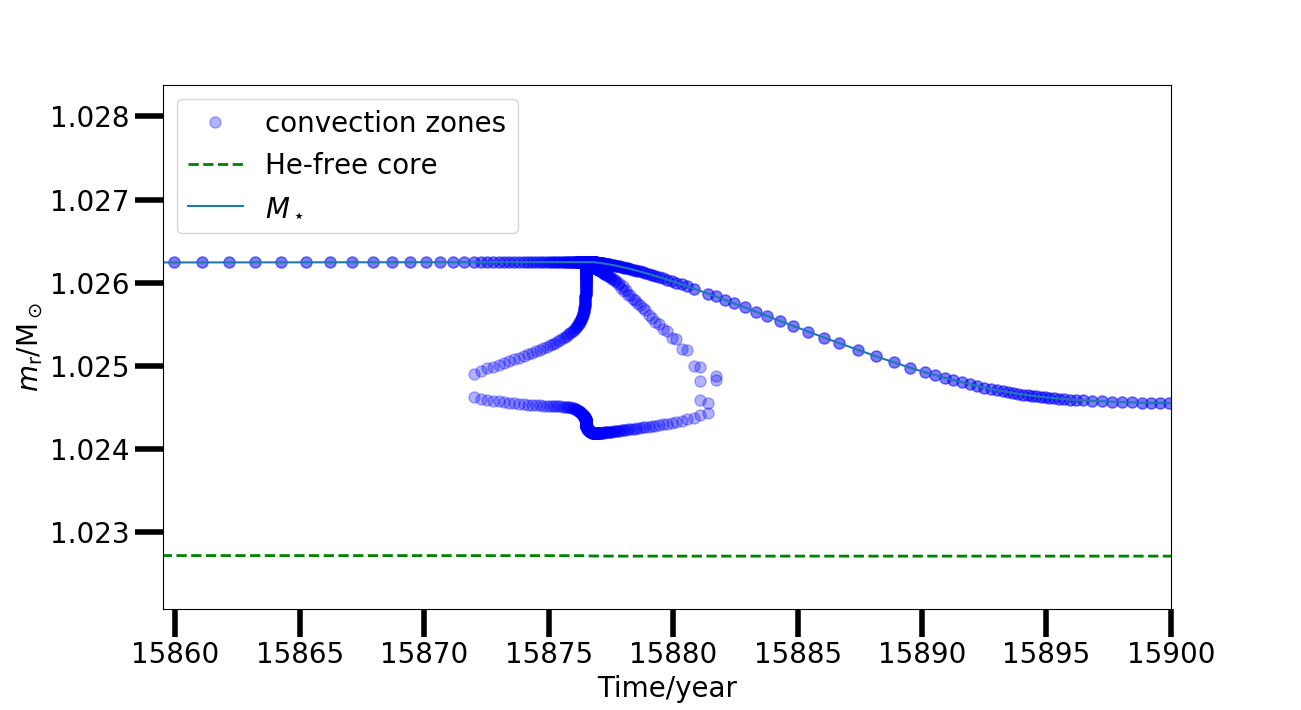
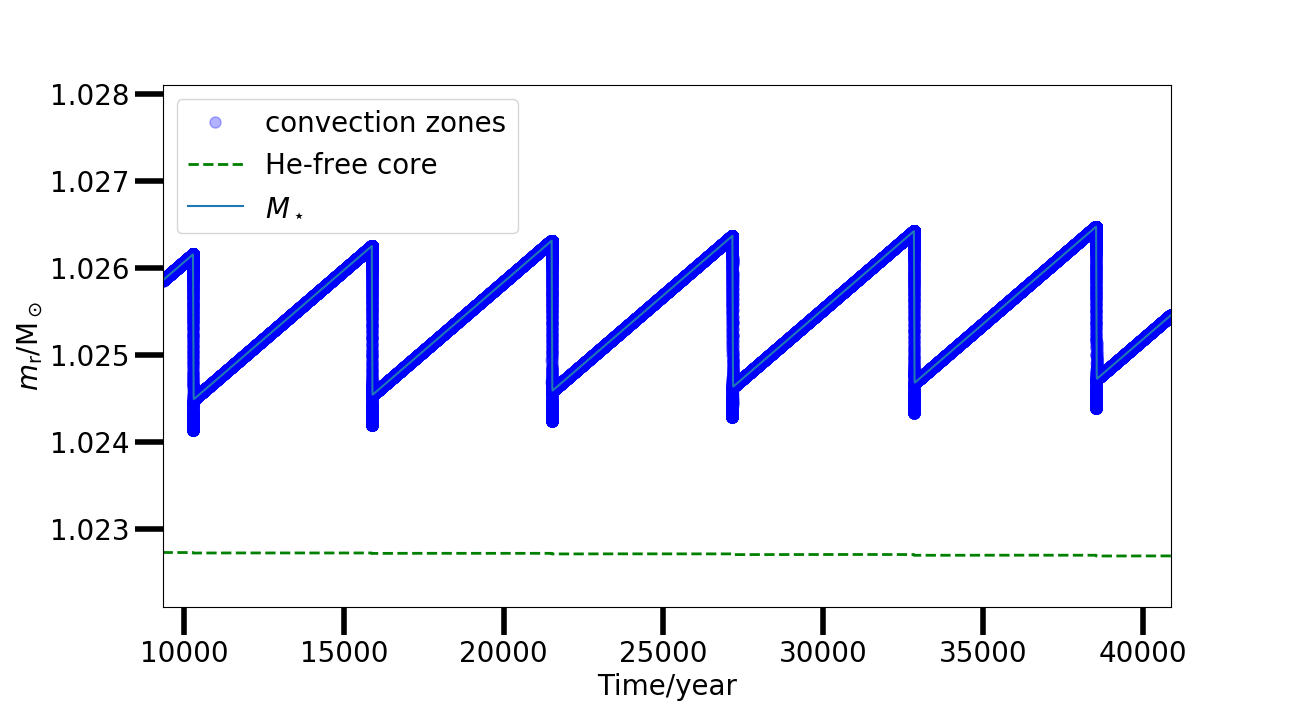
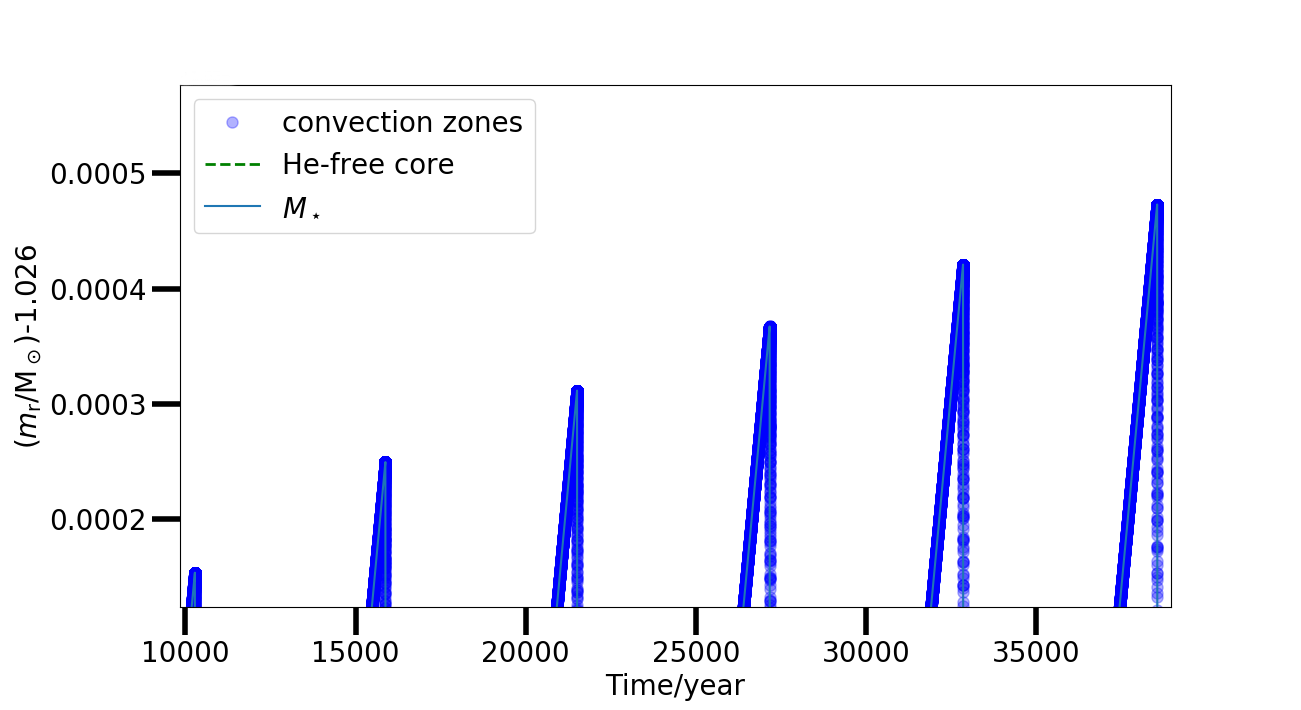
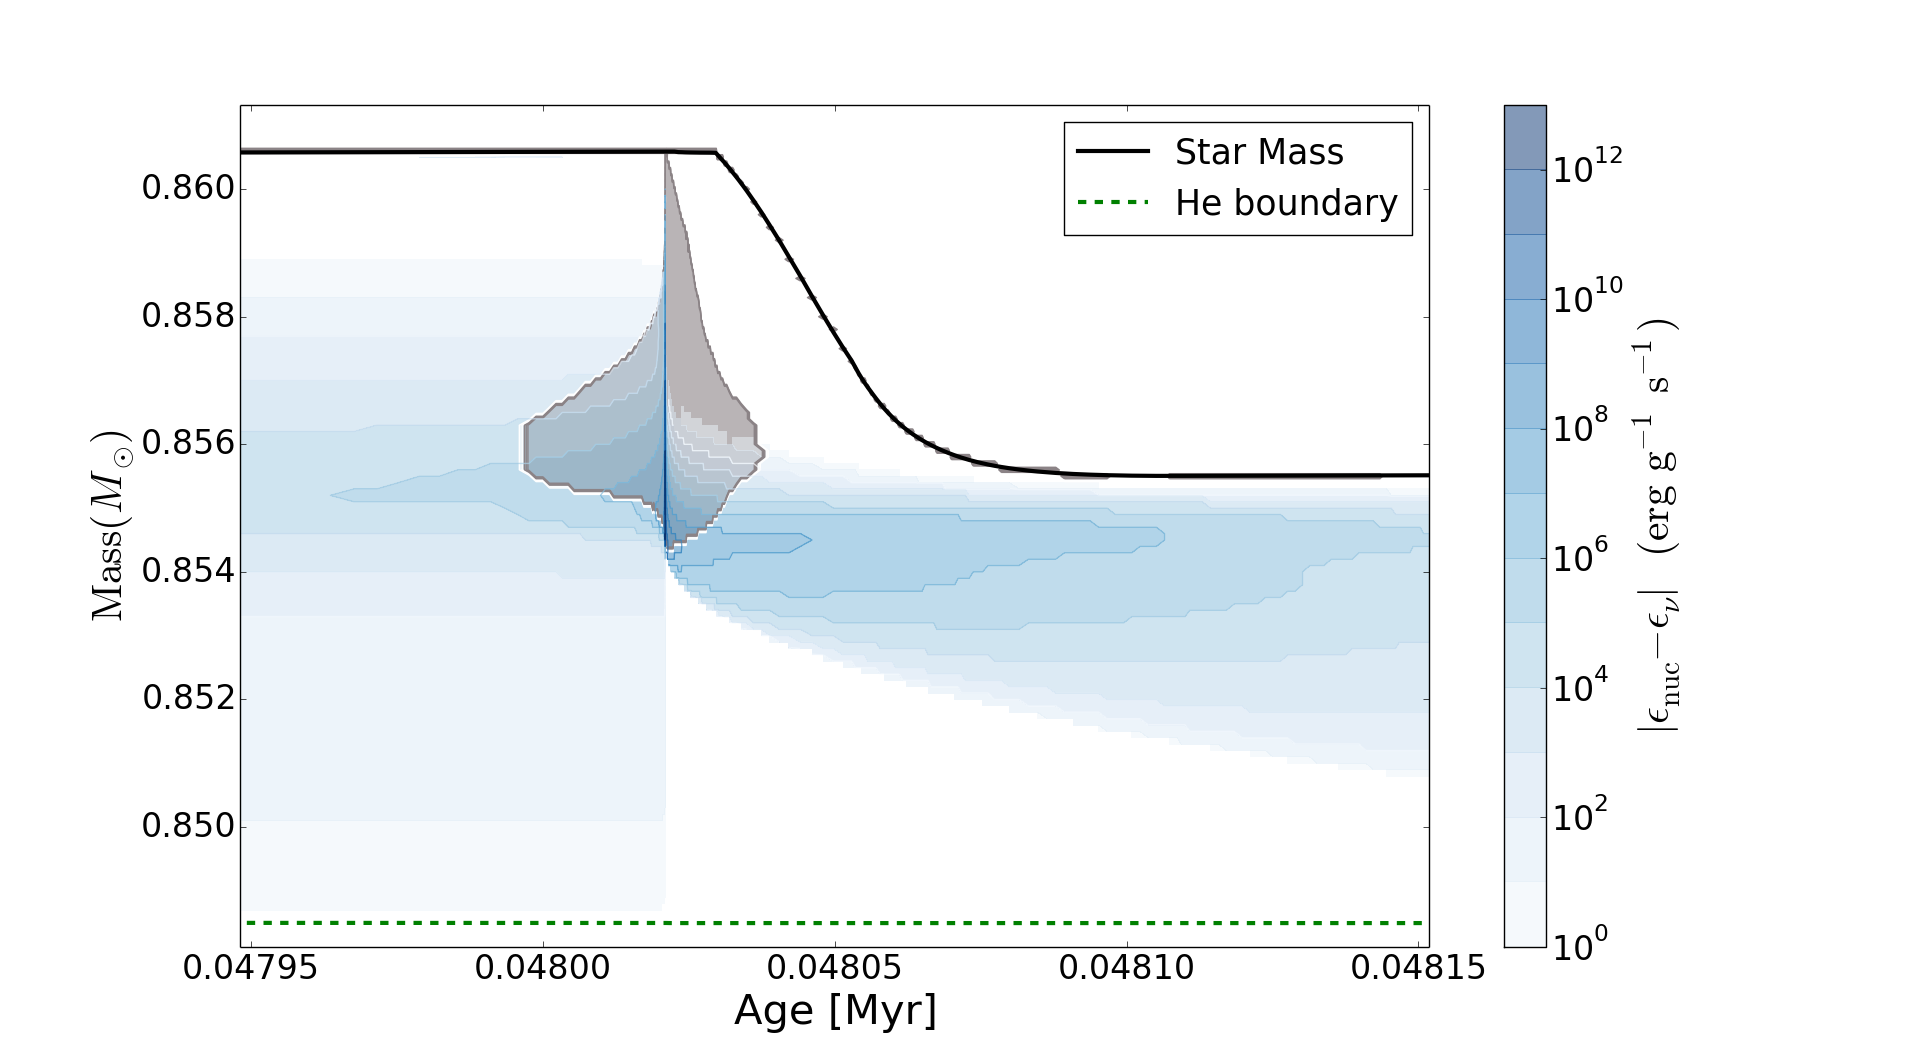
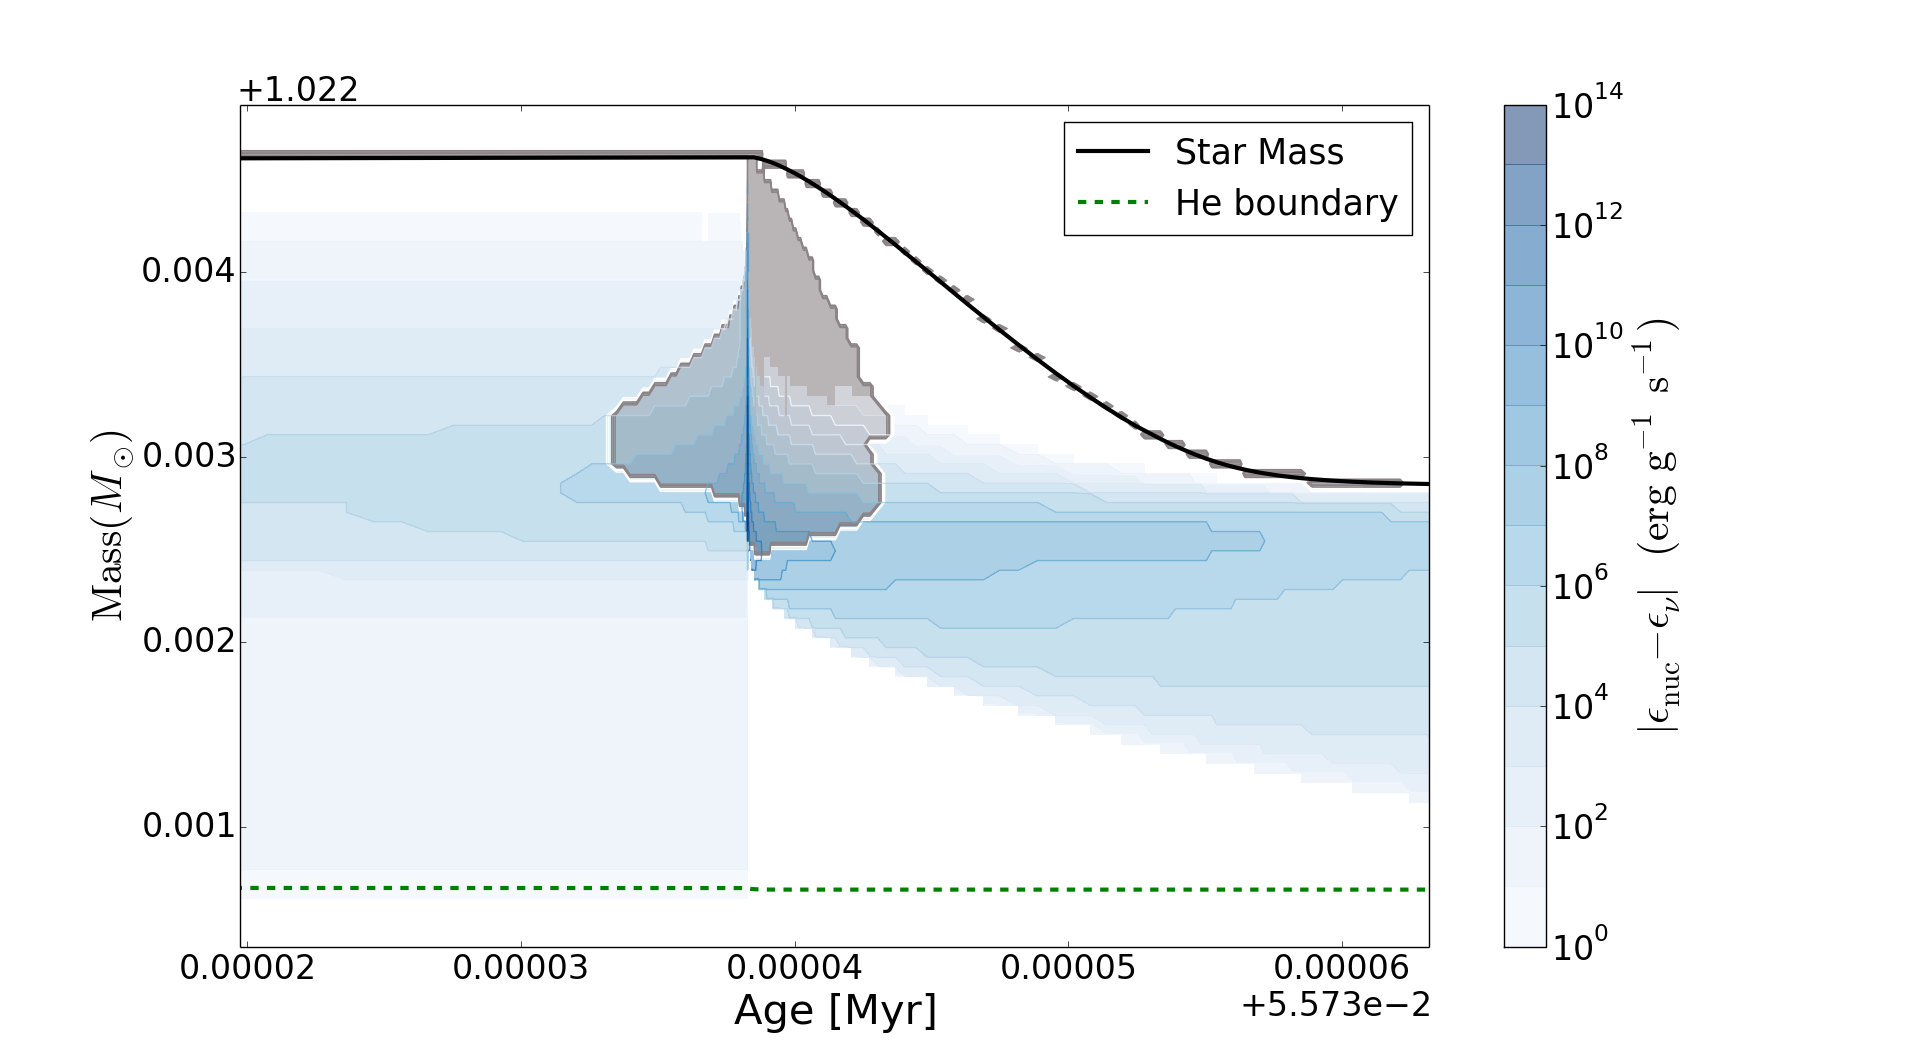
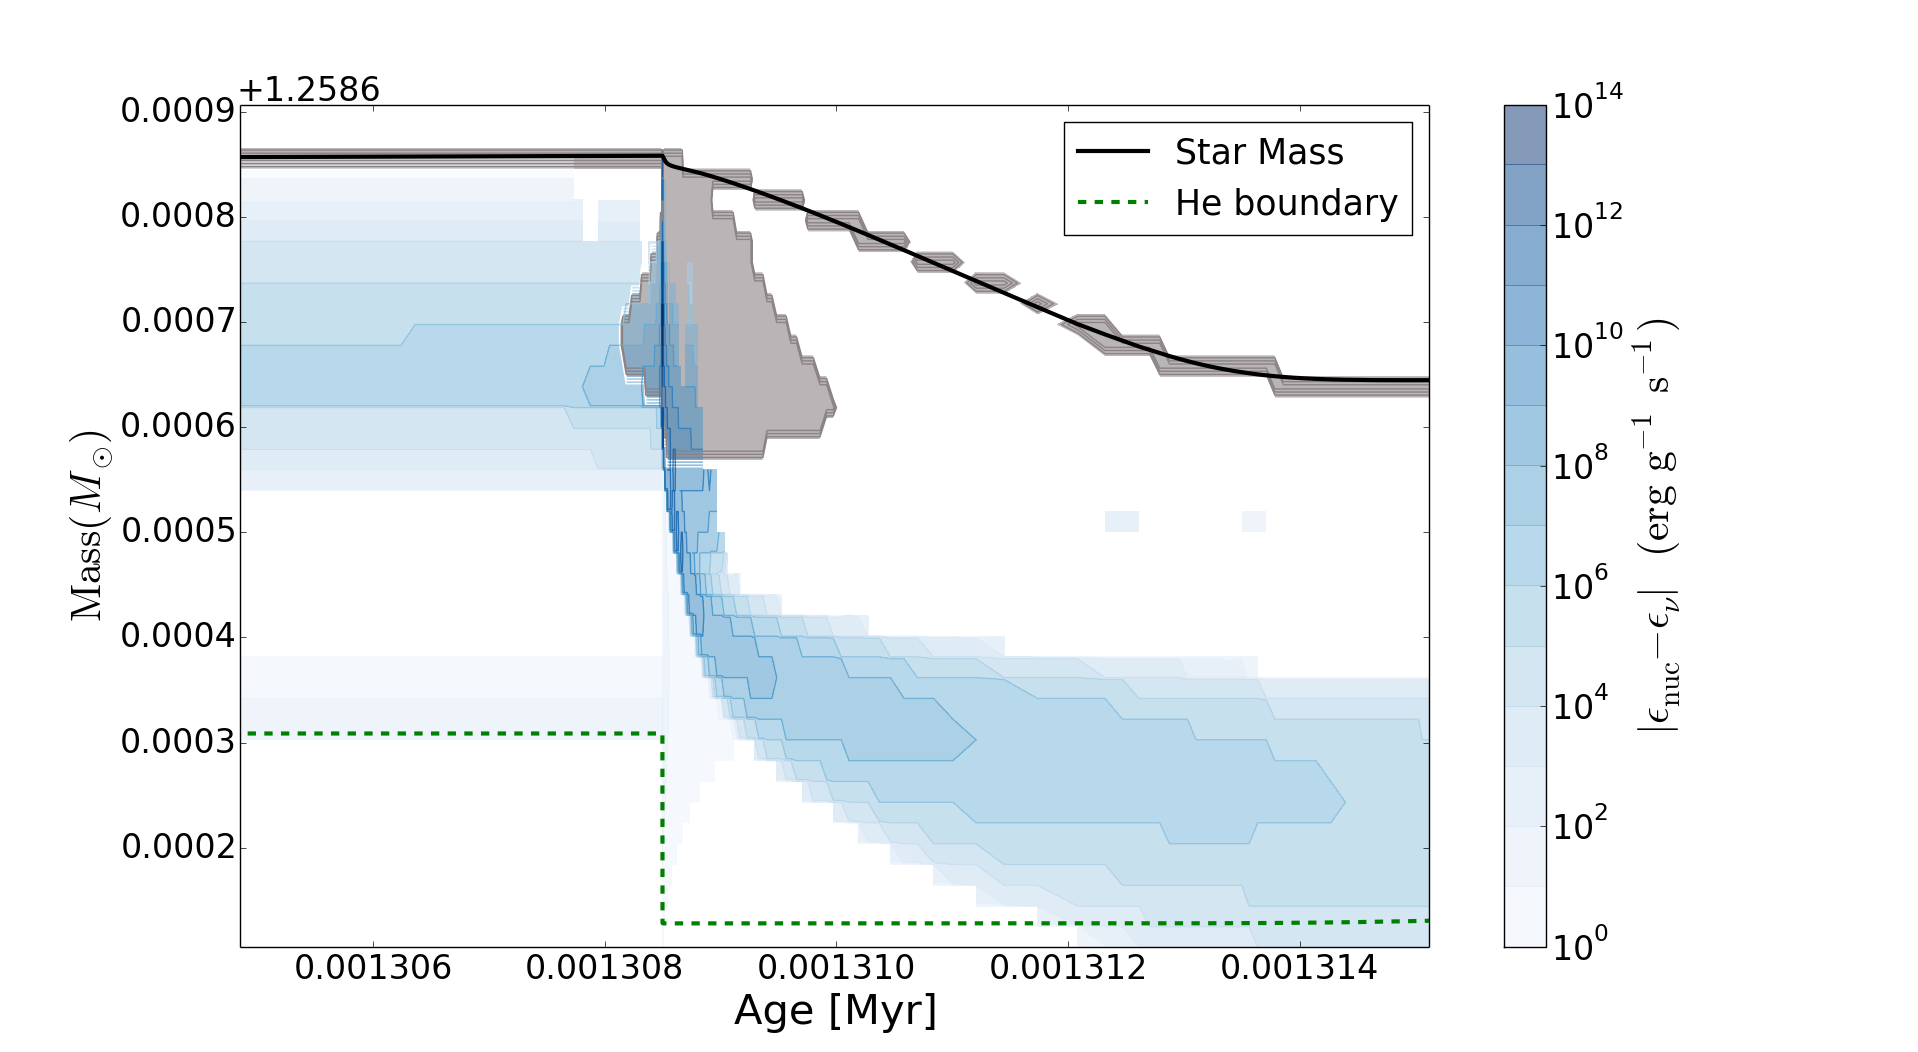
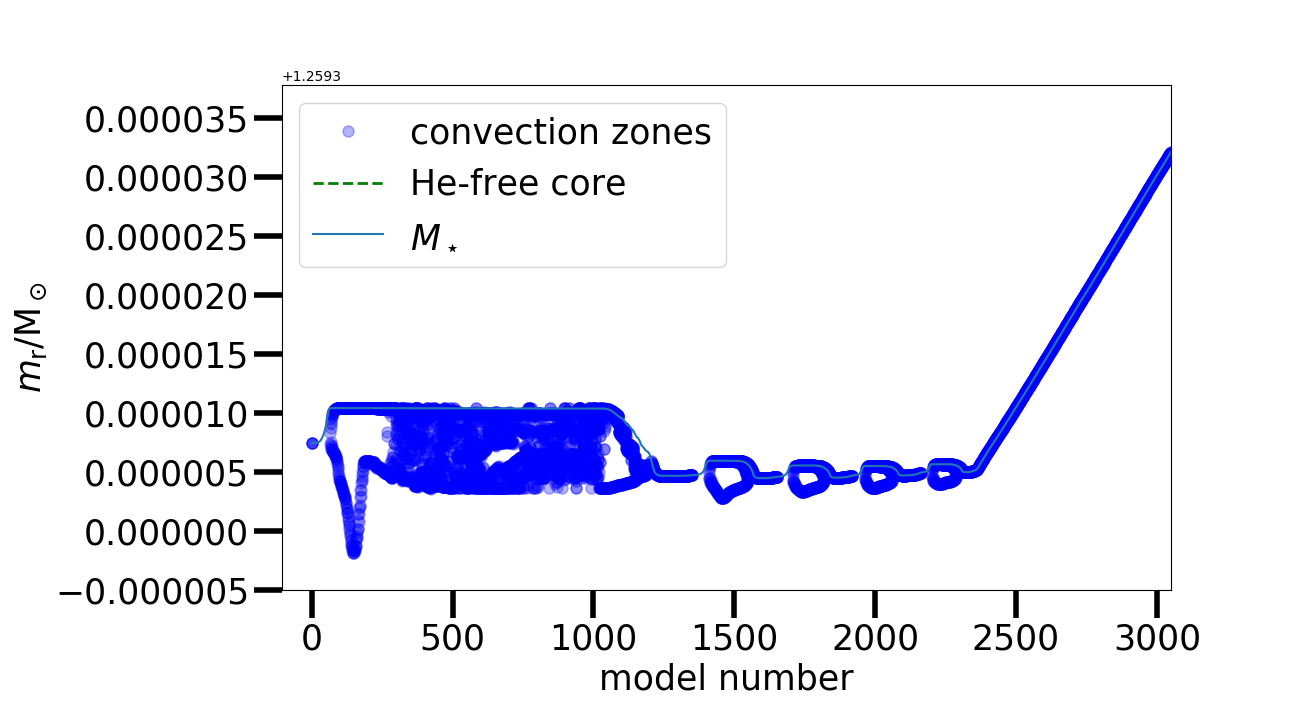
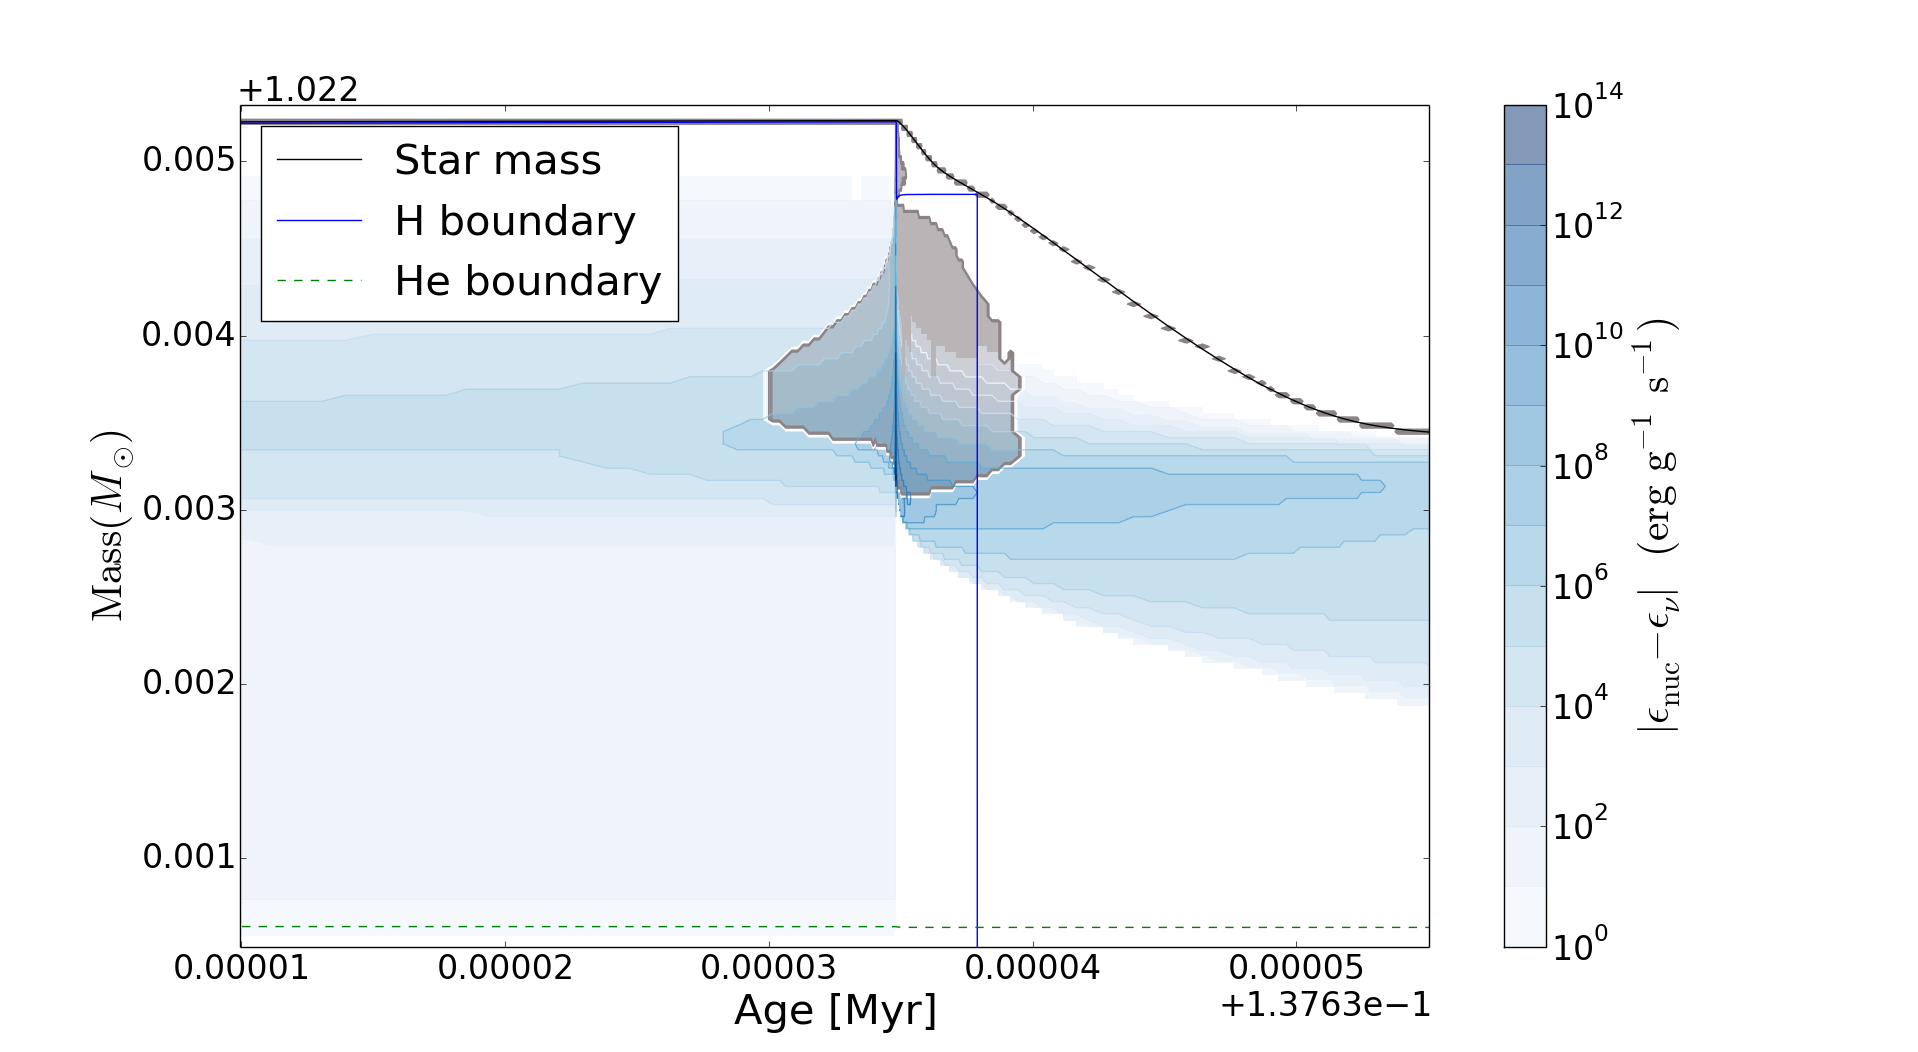
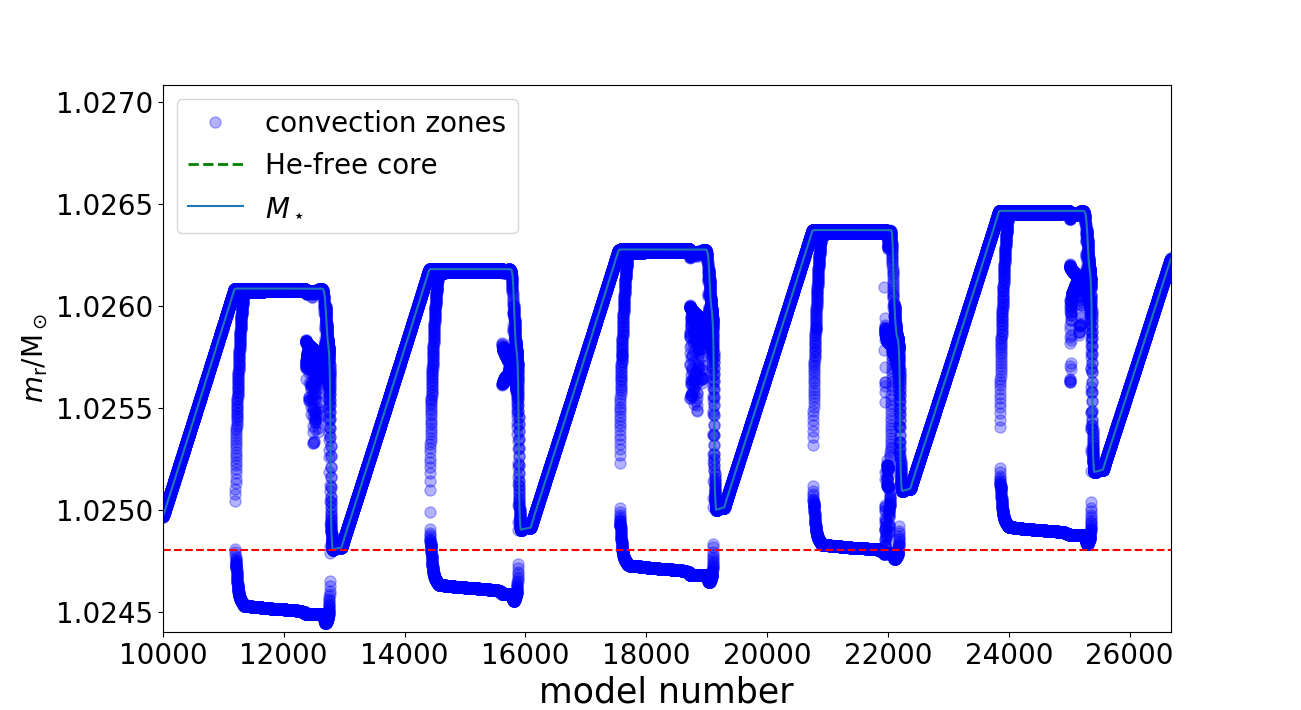
Figure 2 shows the Kippenhahn diagram for a TP and a sequence of TPs of the model M1p025.Z1m2. The results of this model (and of all the models in table LABEL:tab:WDmodel_name) confirm the calculations of Tornambé et al. (2000) and Denissenkov et al. (2017) : the Eddington limit (Rybicki & Lightman, 1979) is easily exceeded immediately after each He flash, ejecting almost all the matter accumulated during the previous interpulse phase. This reduces the efficiency of the accretion process toward Chandrasekhar mass. Despite these powerful winds, in figure 2 it is highlighted that the star is still growing in mass. Higher WD mass will finally result in higher surface gravity, thus reducing the net amount of mass loss after the super-Eddington wind phase which follows every TP. It is important to notice how one of the main differences, between the WD models presented in Denissenkov et al. (2017) and in this work, is the different WD mass range considered. Specifically, the WD initial mass range is extended in this study, including up to near-Chandrasekhar WDs. According to the models presented here, the average net amount of mass loss after every TP in M0p856.Z1m2 is around 0.006 , while it is around 0.001 in M1p025.Z1m2 model (figure 2), 210-4 in M1p256.Z1m2, 1.510-5 for M1p316.Z1m2 and 10-5 for M1p376.Z1m2.
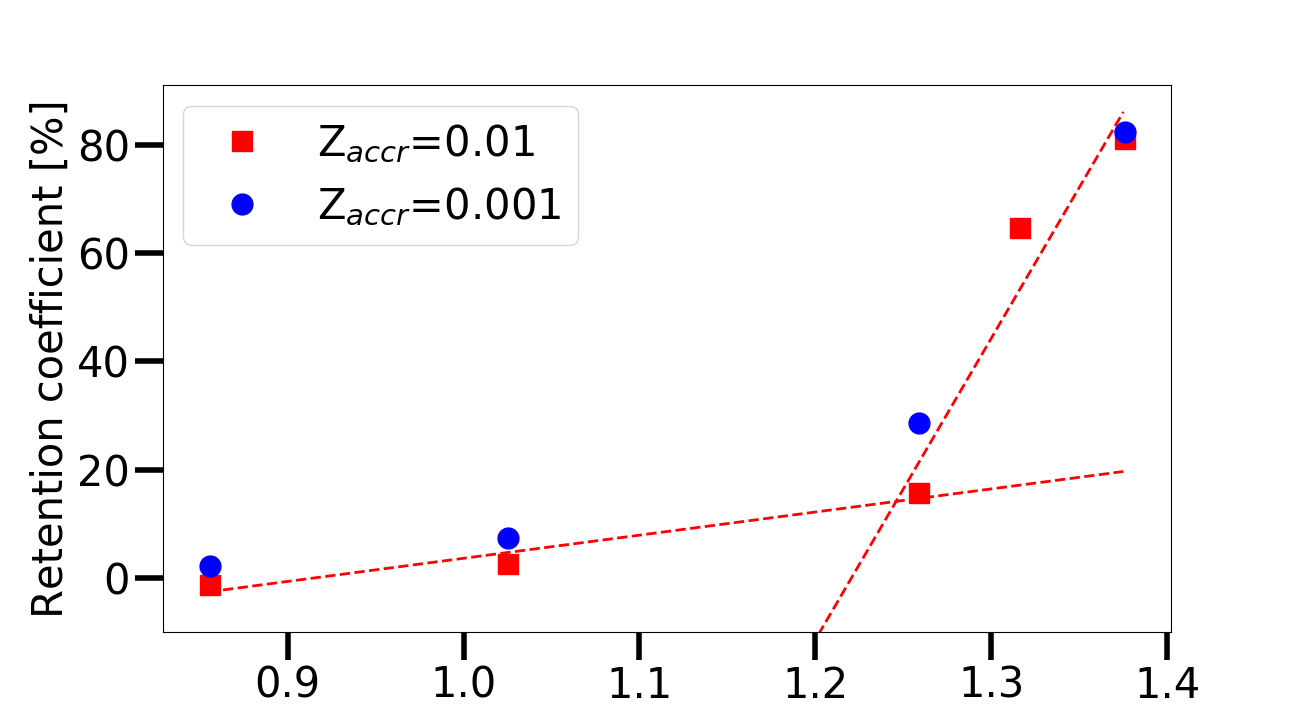
Looking at figure 3, we can estimate the minimum initial mass a WD must have in order to be able to reach the Chandrasekhar limit (hereafter Minimin). The plot shows the retention efficiency, defined as the ratio between the mass gained before and the mass lost after each TP, as a function of initial WD mass. Current stellar evolution theory predicts that a newly formed CO core cannot exceed about 1.1 without igniting carbon, that would convert the star into Oxygen and Neon, which are not SNIa progenitors (Becker & Iben, 1979; Dominguez et al., 1993, 1996). Furthermore, since stellar lifetimes exponentially decrease with increasing initial mass, the stellar donor must be less massive than the WD progenitor star. This ensures to have a less-evolved companion (i.e. not yet a WD), still with a H-rich envelope able to provide the accreted matter. The direct consequence of this constrain, is that the amount of mass that can be accreted is not infinite, as it must be lower than the companion’s envelope mass. Adopting these conditions, we estimate Minimin integrating the double-linear fit shown in figure 3. For 0.85 MWD 1.25 , mass retention efficiency () is fitted by
| (5) |
While for 1.25 MWD 1.40 the linear fit becomes much steeper:
| (6) |
The total accreted material (Macc) will be given by the following mass integration:
| (7) |
where Mch is the Chandrasekhar mass, Mini is the WD mass at the beginning of the mass transfer, Mcom is the companion mass and Mc the companion’s core mass once it evolves past the main-sequence, when it fills its Roche lobe and mass transfer starts. Hence, (Mcom - Mc) gives the mass from the H-rich envelope that can be accreted onto the WD. From equation 7, Macc is just enough to reach the Chandrasekhar mass when Mini = Minimin = 0.91 . This kind of WD would need to accrete 0.34 to become at least as massive as 1.25 . At that point, the retention efficiency will grow much faster as the WD increases, making the evolutionary path to SNIa much easier. On the other hand, Woods & Gilfanov (2013) showed how WD with photospheric temperature T 2 105 K (typical of accreting WD with masses around 0.9 ) could only accrete up to 0.1 to be compatible with the lack of detection of He II recombination lines. We anyway notice how our M1p256.Z1m2 model has a photospheric temperature T 9 105 K, which would allow it to reach the Chandrasekhar limit without contradicting the null detection of the He II line (see figure 8 in Woods & Gilfanov (2013)). This means that accreting 0.1 may be enough for an accreting WD with MWD 1.1 to reach a mass comparable to M1p256.Z1m2, hence being consistent with the observational constraints of Woods & Gilfanov (2013). We therefore set Minimin 1.1 , compatible with the highest mass a newly formed CO WD can have.
Moreover, two more aspects with opposite potential impact must be mentioned: 1) lowering the metallicity of the accreted material leads to a global increase of the retention efficiency(see Denissenkov et al., 2019): in this case, by setting Z=0.001 the retention efficiency increases by around a factor of two in the initial mass range between 1 and 1.25 ; 2) Roche-Lobe overflow may lower the retention efficiency, but it’s not considered here, both for computational time requirements and for the small impact on heavy-elements nucleosynthesis on top layers of the WD, which is the main target of the present study. It is important to consider that in our simulations we resolve the accreting WD structure but we do not simulate the evolution of the donor, using instead a constant accretion rate on the WD surface.
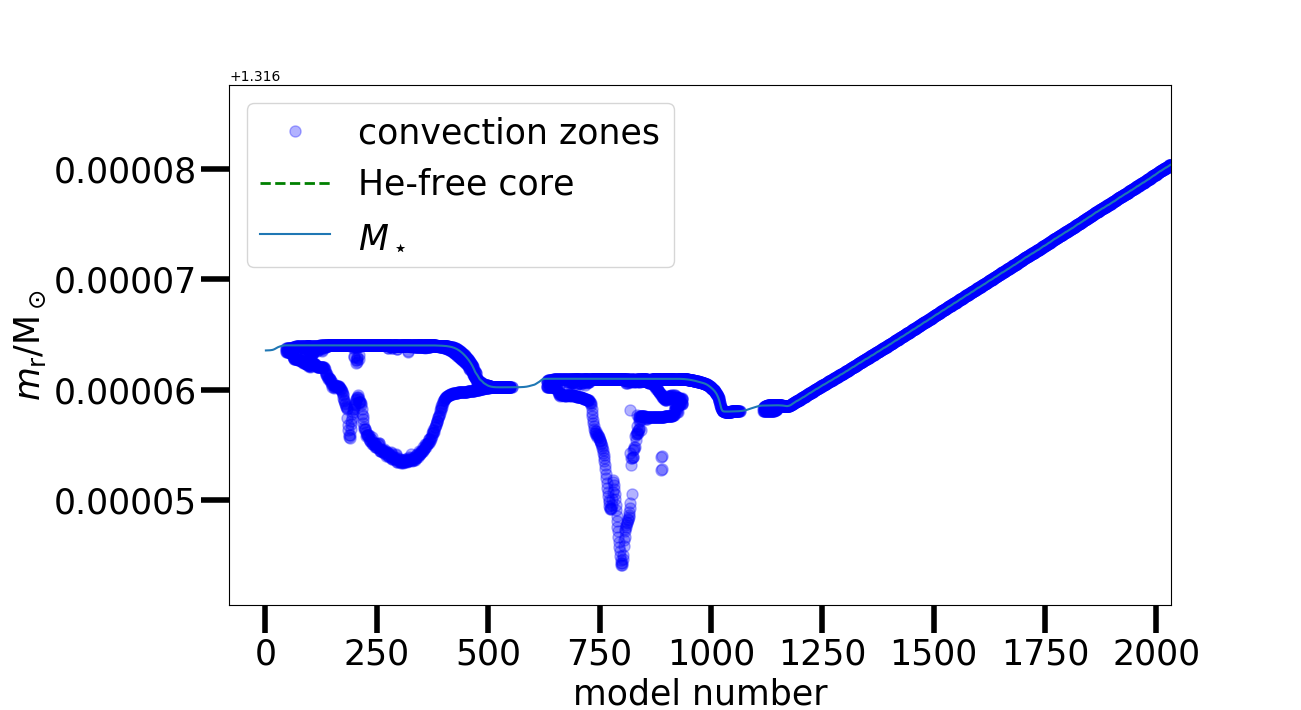
In figure 4 the Kippenhahn diagram for three convective TPs of different models are shown. As in figure 2, the strong mass loss is clearly visible, forcing the structure to loose most of the mass accreted in the last interpulse phase. The highest energy generation coincides with the highest downward extension of the PDCZ. It is also interesting to observe that the energy generation from He burning continues to be significant also when the H-burning has already started.
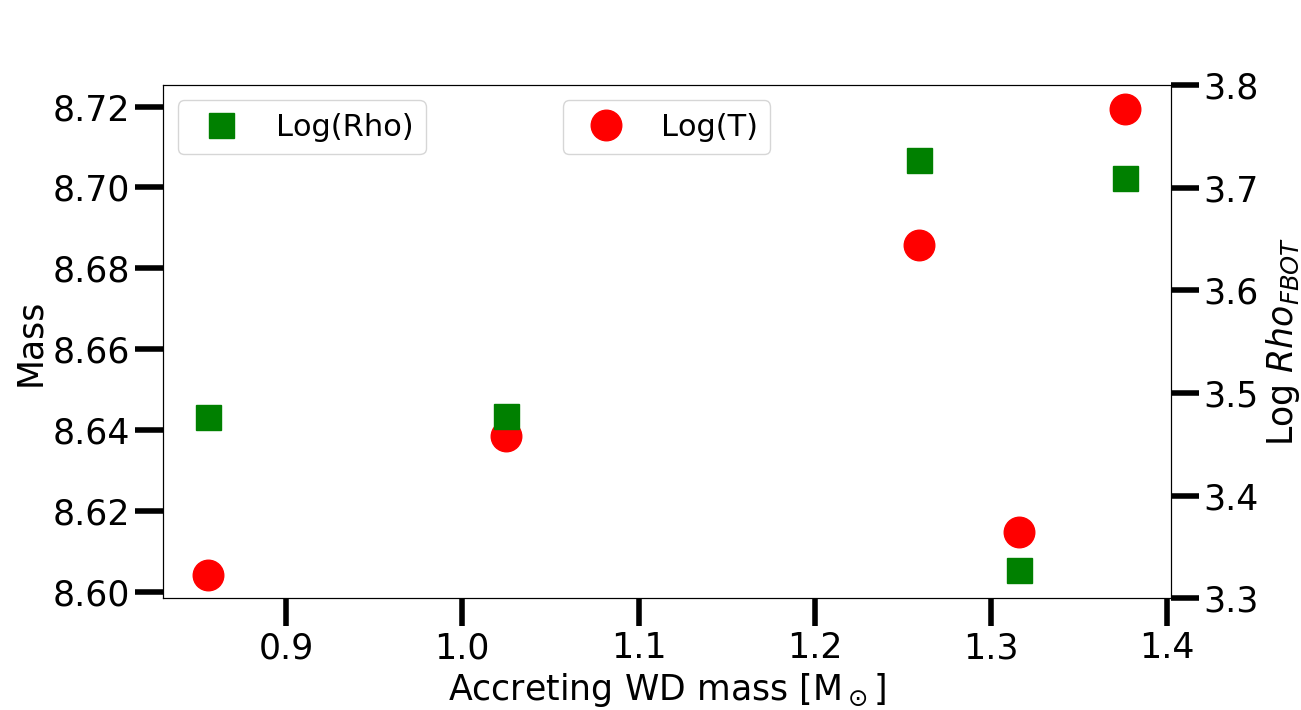
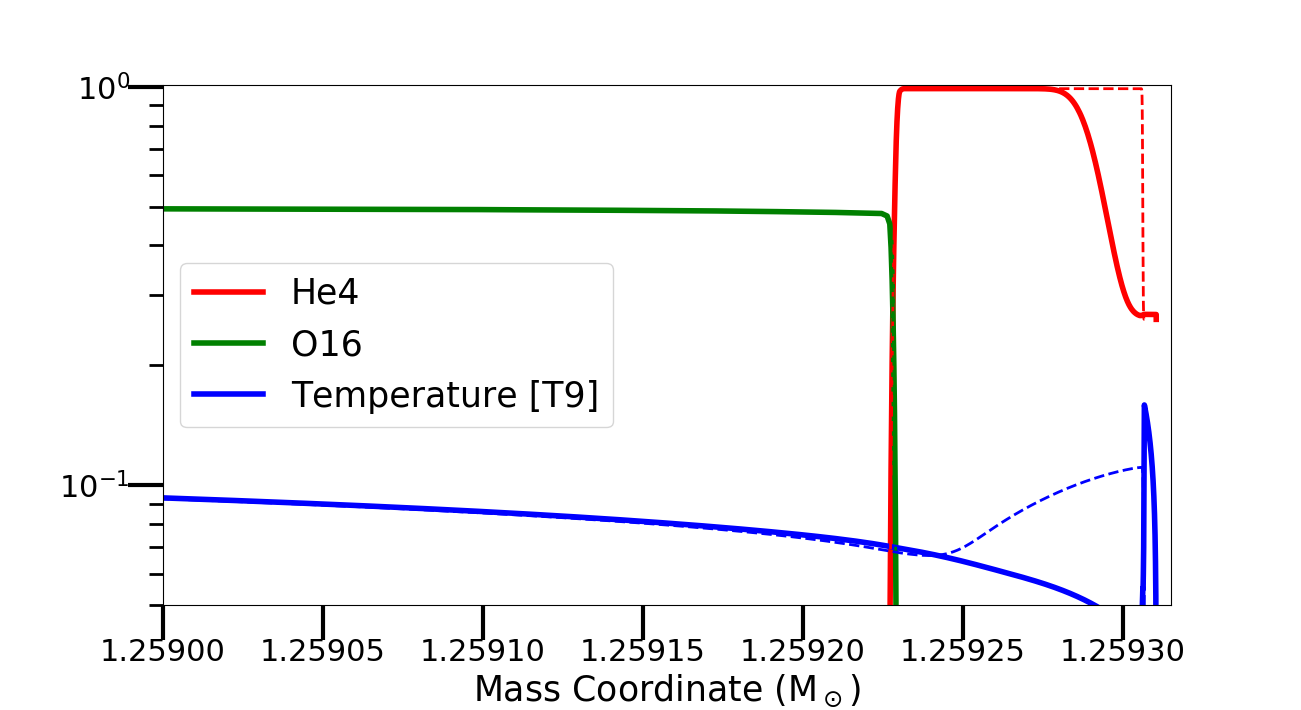
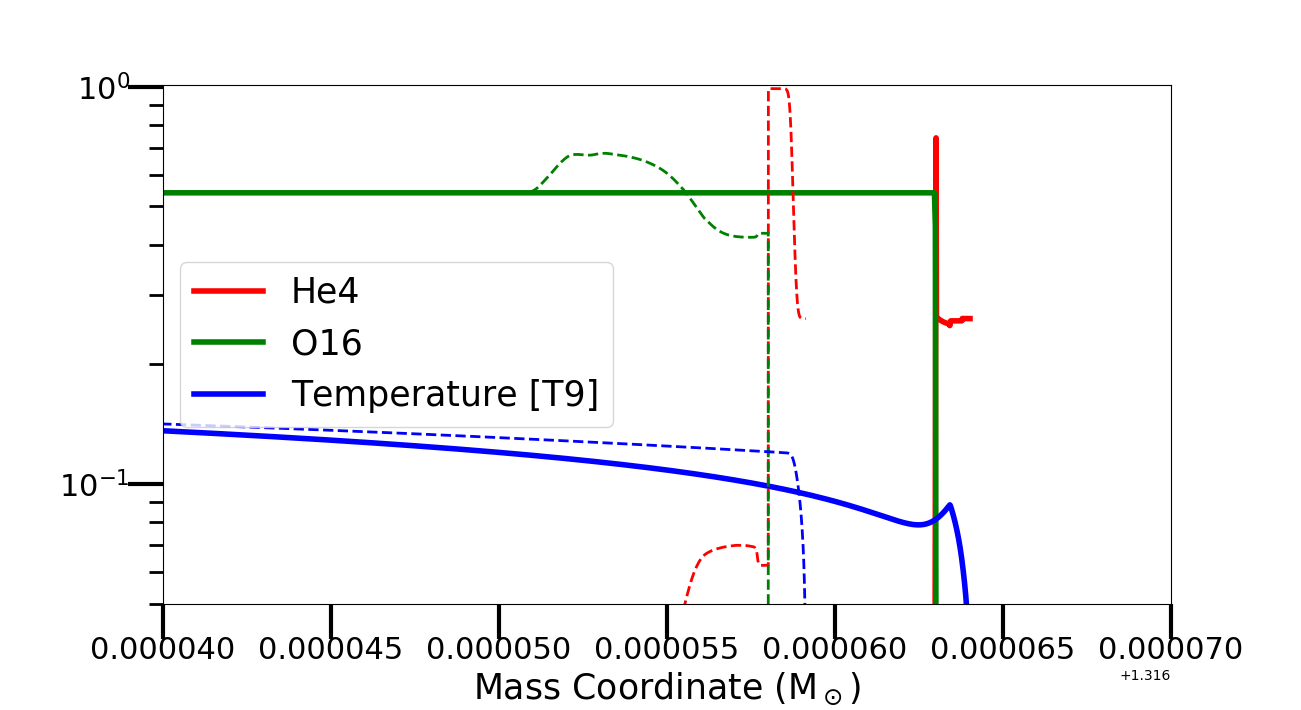
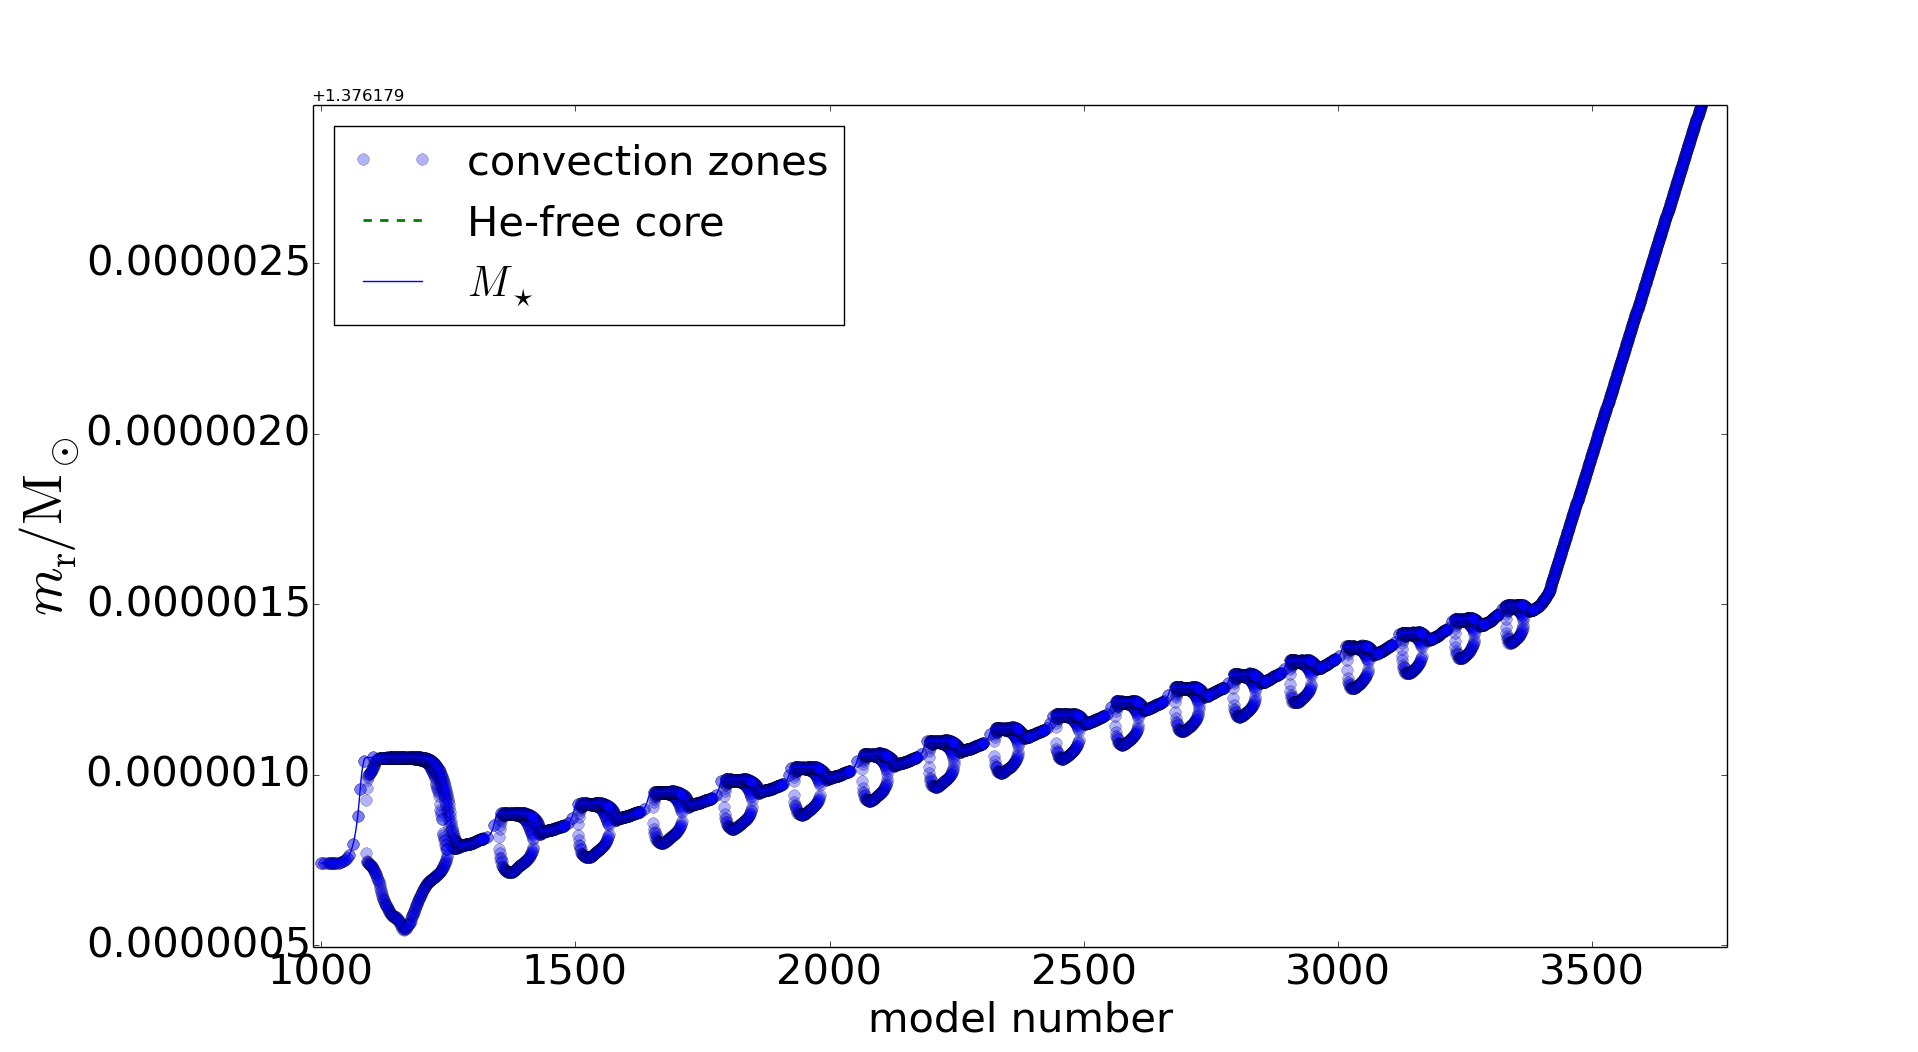
In figure 5, the evolution of temperature and density at the bottom of the PDCZ (TFBOT, see table LABEL:tab:WDm3z2m2_TPprop) with respect to the WD mass is shown. The temperatures TFBOT are taken from one TP, but they are representative of others TPs calculated with the same WD mass. Indeed, according to table LABEL:tab:WDm3z2m2_TPprop, the TFBOT variation between following TPs is marginal. Even for the more extended M1p025.Z1m2 model with more than a hundred simulated TPs, TFBOT variation is less than 3%. Generally, the logarithm of the temperature increases linearly with the WD mass (see figure 5). The main reason of the temperature increase with the progenitor mass is the thin shell instability and partial degeneracy (Kippenhahn & Weigert, 1990; Herwig, 2005): the higher the accreting WD mass, the lower the shell thickness will be, making thin shell instability more efficient, as the expanding shell pushed by triple will need more time to reach a thickness large enough to restore hydrostatic equilibrium, causing a longer temperature rise. A similar variation with the WD mass is also visible for the density. This trend is consistent for all the mass range explored, with the important exception of model M1p316.Z1m2, where both temperature and density at the bottom of the PDCZ are significantly lower than what expected from the general trend. The reason behind this apparent strange behavior, is shown in Figure 6: in the top two panels, the Kippenhahn diagram of models M1p259.Z1m2 and M1p316.Z1m2 are given, showing some initial Hydrogen-flashes, anticipating the steady-accretion before the onset of the TP takes place: the much higher temperature of the flashes experienced by M1p316.Z1m2 (0.27 GK), compared to those taking place in M1p259.Z1m2 (0.17 GK), has an impact on the temperature right at the top boundary of the He-free core (see bottom panels), where the He-flash will ignite, increasing it by 20%. On the other hand, this fingerprint is not left by the weaker Hydrogen-flashes of M1p259.Z1m2, with the net result of a lower degeneracy state of the He-intershell in the M1p316.Z1m2 model, which causes both weaker He-flashes and the faster increase of the mass retention efficiency visible in figure 3.
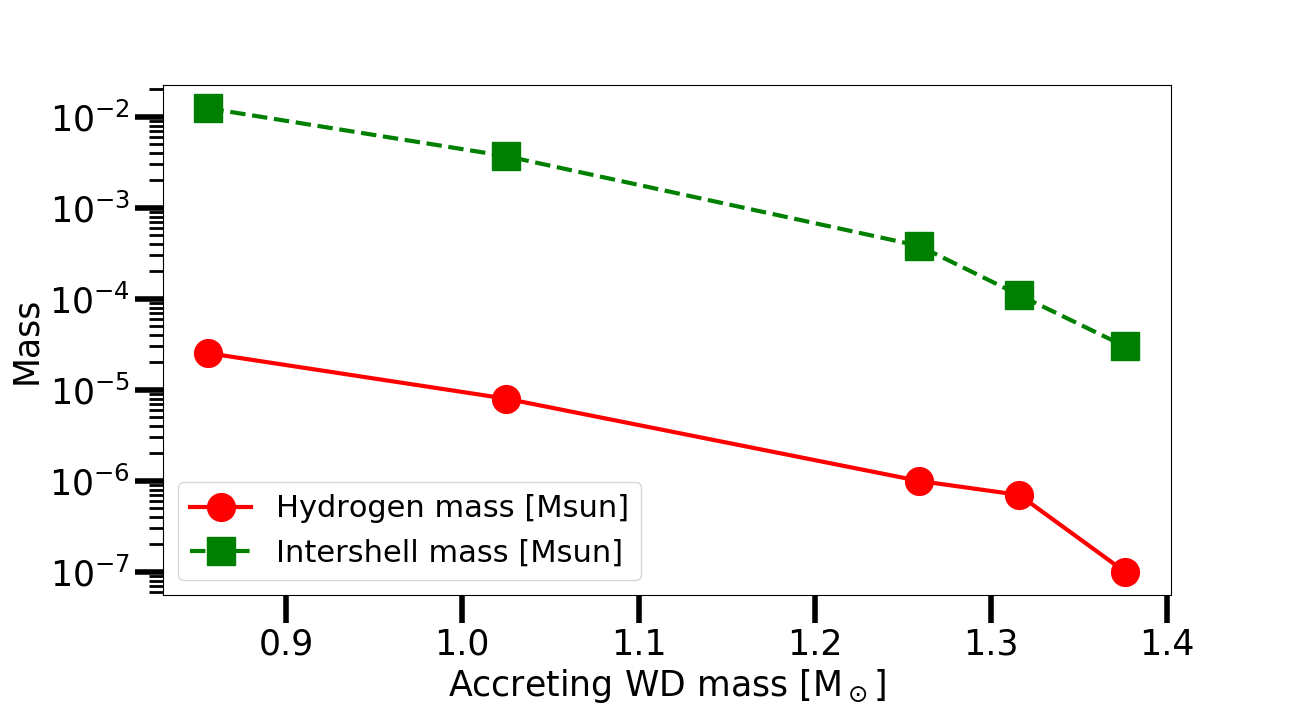
We have mentioned that the thickness of the He intershell decreases with the increase of the WD mass. This is shown in figure 13. Between models M0p639.Z1m2 and M1p376.Z1m2, the mass of the He intershell decreases by almost three orders of magnitude, from few 10-2 down to a few 10-5. Figure 13 shows the amount of H-rich mass which is not processed by H-burning, before the next convective TP occurs. Its mass is reduced from M 10-4 for model M0p639.Z1m2 to M 10-7 for model M1p376.Z1m2. These last numbers need to be compared to the mass accreted during the same interpulse phase, that is comparable to the He-intershell mass. This means that at the onset of the convective TP, only a few per cent of the H-rich material accreted still has to burn. In general, for the mass range explored in our simulations and for all the convective TPs, the size of the He intershell mass is about two orders of magnitude larger than the unburned H-rich material. Similar relative proportions between He-rich layers and H-rich material at the surface are found in the very late thermal pulse (VLTP) or late thermal pulse (LTP) events in post-AGB stars. In these stars, the H is ingested in the He-burning regions causing important effects on the nucleosynthesis of these objects (e.g., Herwig et al., 1999; Miller Bertolami & Althaus, 2007). We will discuss this effect in more detail in the next sections.
3.3 M1p025.Z1m2: extended stellar calculations
As reported in table LABEL:tab:WDmodel_name, model M1p025.Z1m2 includes 137 convective TPs. This is the longest accreting WD model in the set presented in this work. For higher WD masses, convergence criteria for stellar calculations become more and more difficult to achieve, and require more computing time. For example, with the simulations setup adopted in this work, a typical TP of the M1p025.Z1m2 model is calculated in about 7000 timesteps. More than 25000 timesteps are needed to complete a TP of the M1p376.Z1m2 model. The larger number of timesteps needed can be explained by the higher temperatures at the bottom of the PDCZ. For all the simulations presented in this work, the accretion interpulse phase is the most difficult to resolve, with up to 104 mass zones needed. The largest resolution, down to 10-12 , is required to have convergence in the top layers where accretion and H burning is taking place. These limitations are more severe for larger WD masses and larger accretion rates.
The simulations details for different TPs of M1p025.Z1m2 are given in table LABEL:tab:WDm3z2m2_TPprop. Here only the numbers for the first seven TPs and the last three are reported. Their variation during the evolution is extremely slow, and local variations between TPs are not relevant. In general, the thermodynamics conditions at the bottom of the TP, as well as the amount of mass lost after each TP event, are not changing significantly during the evolution of the M1p025.Z1m2 model.
3.4 H-ingestion events in WD-accretion models
In 7, we compare the Kippenhahn diagrams obtained for the 6th and the 34th convective TPs of the model M1p025.Z1m2, where the last TP was affected by ingestion of H. The behavior of the convective region is affected in the upper part of the TP, where the H burning activated by the ingestion of H-rich material, splits the He intershell in two parts: about 90% of the He intershell region is affected by the convection driven by the He burning at the bottom of the TP, while the remaining upper part undergoes a short convective episode, triggered by H burning (see horizontal blue segment in 7). This result is qualitatively consistent with theoretical predictions of H-ingestion episodes in post-AGB stars (e.g., Herwig, 2001).
In this specific case, both the two convective regions below and above the split end before the H ingested is exhausted and the super-Eddington winds start to eject material. After about three-four months from when the split is formed, the star becomes H-free by losing a large fraction of the He intershell (the vertical blue segment in 7 indicates when the stellar surface becomes H-free). This behavior may change for different TPs, but at least for model M1p025.Z1m2 it seems to become quite regular. For a given WD mass, similar thermodynamic conditions at the bottom of the PDCZ, He-intershell size and the amount of H-rich material accreted are the main causes of such a regular behavior. However, H-ingestion events for different WD masses may look quite different because of the differences seen in the previous sections.
It is important to keep in mind that multi-dimensional hydrodynamic calculations are needed to better simulate H ingestion episodes (Herwig et al., 2011, 2014). Nevertheless, one-dimensional stellar models can be adapted and constrained by gathering information from hydrodynamics simulations and observations. For instance, this was the approach followed to study the H-ingestion event in the post-AGB star Sakurai’s object by Herwig et al. (2011).
Unfortunately, there are no observations or specific hydrodynamics simulations available yet to do the same with massive accreting-WD models. It would be plausible to assume that H-ingestion events for WD masses of are similar to the VLTP observed in post-AGB stars, since the conditions of the VLTP and of the TP are in the two cases quite similar, including the amount of H available at the surface of the star (see 13 and e.g., Miller Bertolami & Althaus, 2007). However, for this work we are interested in WD masses of , where the main physics properties of the TPs are different.
In the next sections we will discuss the neutron capture nucleosynthesis in these models, also discussing the relevance of H-ingestion flashes for the conclusions of this work: in general, the occurrence of H-ingestion events is a crucial source of uncertainty. This needs to be considered to provide a comprehensive picture of neutron-capture nucleosynthesis in accreting WDs.
4 Post-processing nucleosynthesis calculations
4.1 Building the seeds for the p-process
The nucleosynthesis during the accretion is calculated for up to 7 TPs and their interpulse phase for each model (see table LABEL:tab:WDmodel_name). The post-processing code mppnp was used, which is described in detail in Pignatari et al. (2016). The stellar structure evolution data were computed and saved with MESA for all zones at all time steps, as described in section 3, and then used as input and processed with mppnp. Therefore the full nucleosynthesis and the stellar structure are computed separately, hence requiring less computing time and resources. The network we adopted for our full nucleosynthesis simulations includes up to about 5000 isotopes between H and Bi, and more than 50000 nuclear reactions. A self-controlled dynamical network defines the number of species and reactions considered in calculations, based on the strength of nucleosynthesis flows producing and destroying each isotope. Rates are collected from different data sources: NACRE compilation (Angulo et al., 1999) and Iliadis et al. (2001), and more recent experimental information, if available (e.g., Fynbo et al., 2005; Kunz et al., 2002; Imbriani et al., 2005). In particular, for the \isotope[13]C(,n)\isotope[16]O and \isotope[22]Ne(,n)\isotope[25]Mg rates we use Heil et al. (2008) and Jaeger et al. (2001), respectively. For experimental neutron capture rates of stable isotopes and available rates for unstable isotopes we use mostly the Kadonis compilation version 0.3 (see Dillmann et al., 2014). Exceptions relevant for this work are the neutron-capture cross sections of \isotope[90,91,92,93,94,95,96]Zr: we used instead the rates recommended by Lugaro et al. (2014), which are based on recent experimental measurements (Tagliente et al., 2008a, b, 2010, 2011a, 2011b, 2013). For stellar -decay and electron-capture weak rates we use Fuller et al. (1985), Oda et al. (1994), Langanke & Martínez-Pinedo (2000) and Goriely (1999), depending on the mass region. If not available from one the resources mentioned above, rates recommended in the JINA reaclib library were adopted (Cyburt et al., 2010).
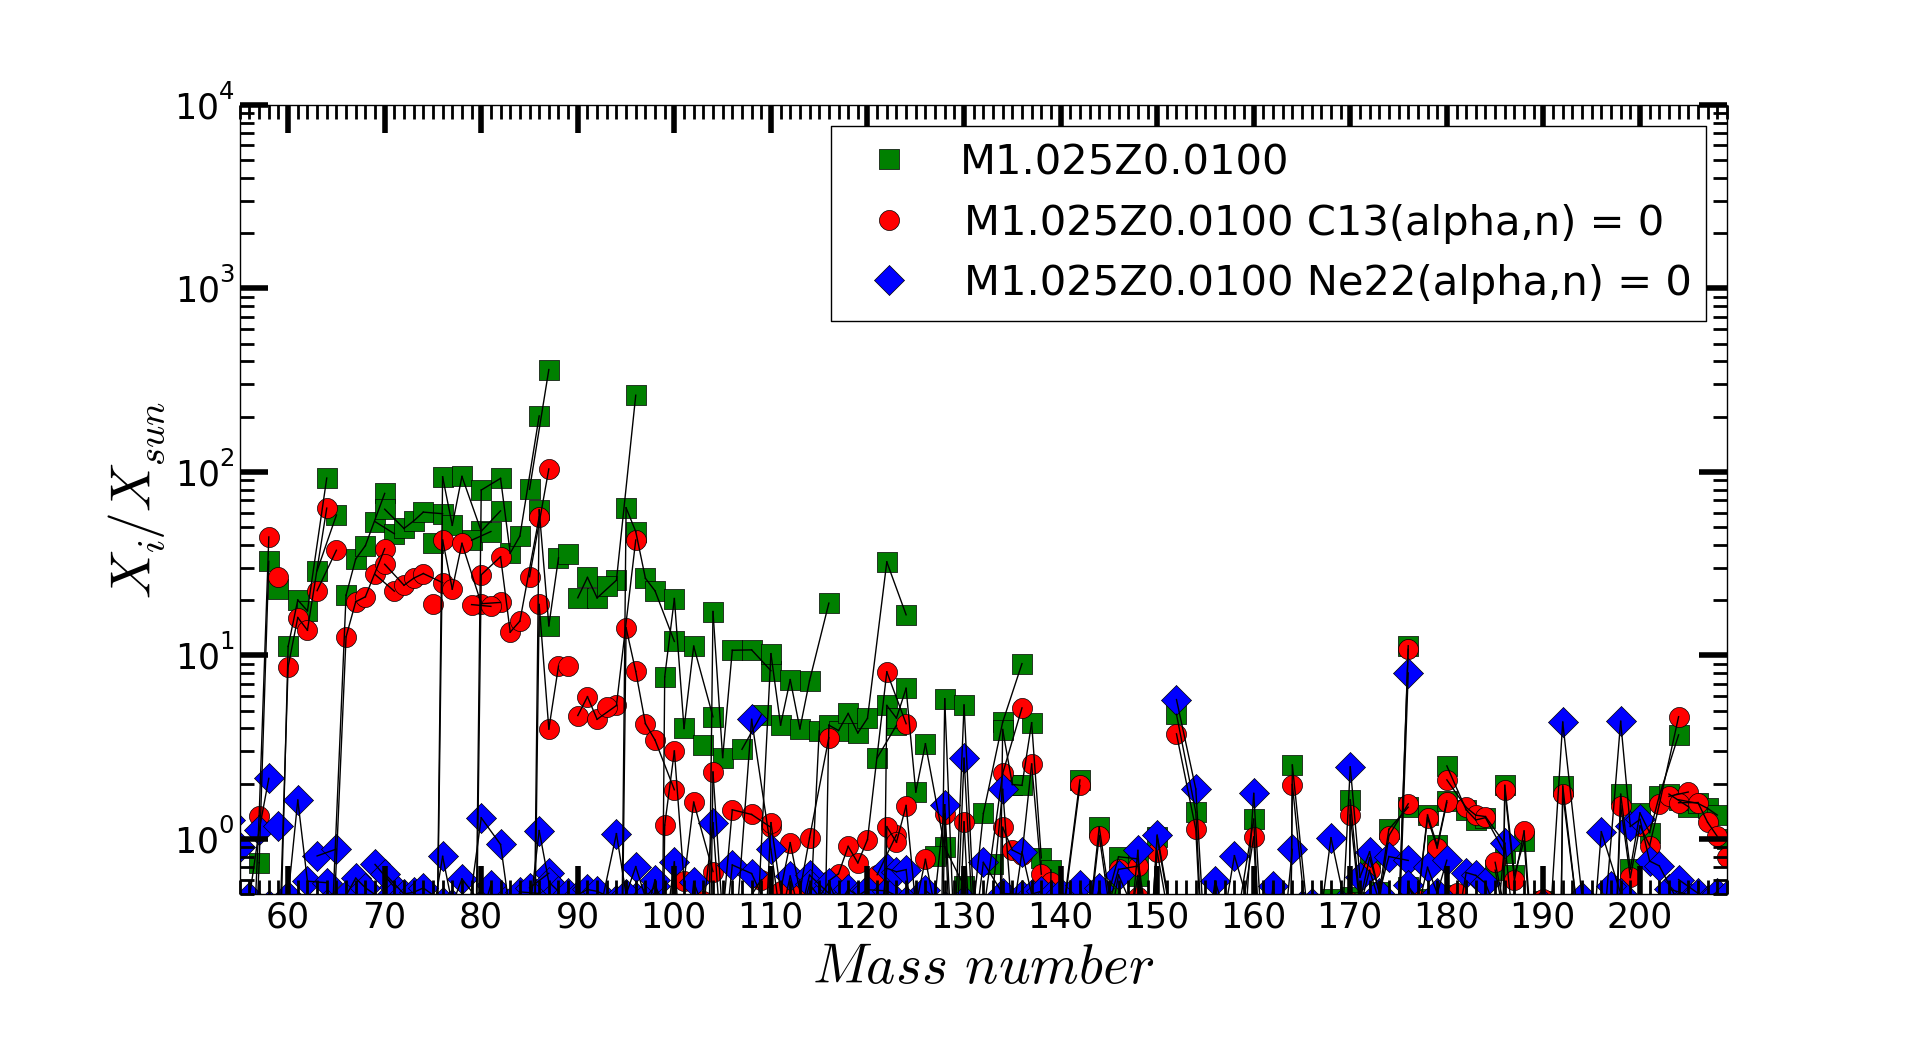
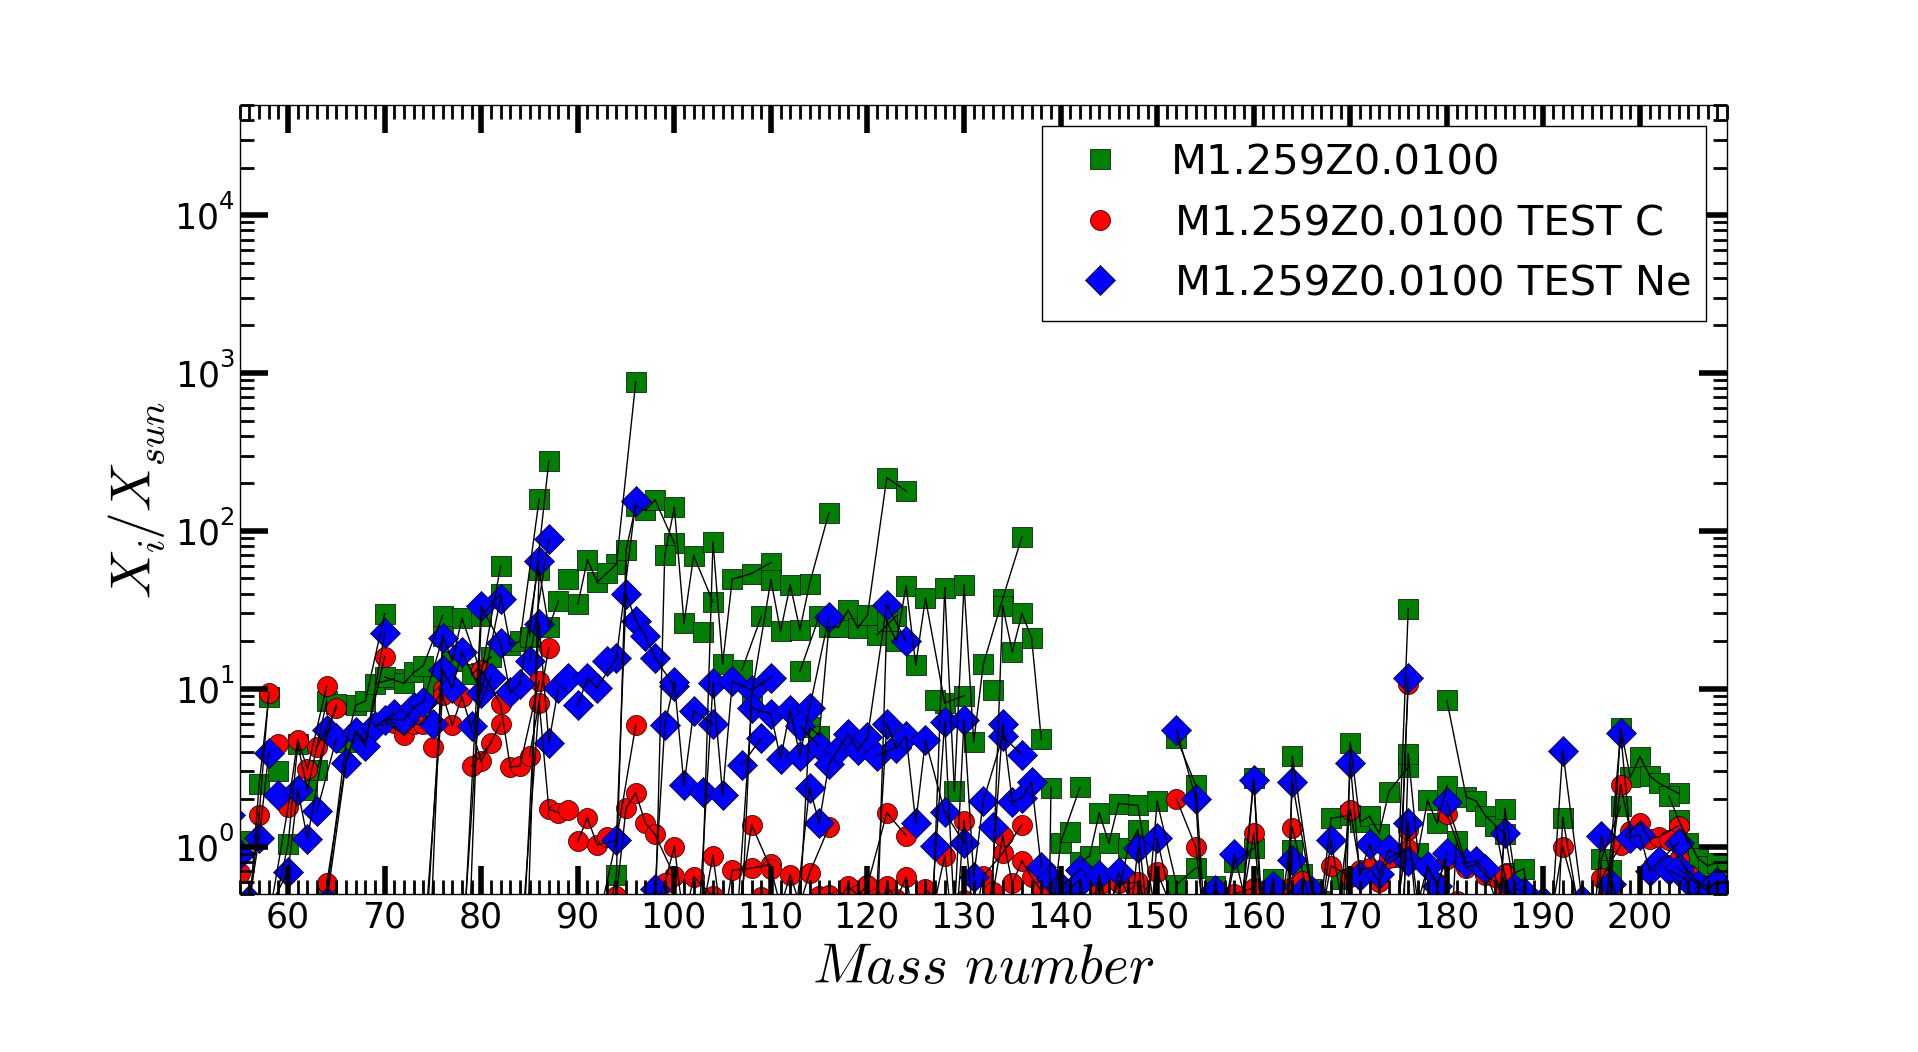
One of the main assumptions made by TRV11 was a starting seed distribution for the -process similar to the -process main component. As predicted by Iben (1981), in our simulations with WD masses up to 1.26 the (,n) reaction is the main neutron source, activated at the bottom of the intershell during the convective TP. For higher masses, \isotope[13]C(,n)16O plays the main role due to H-ingestion events that lead to \isotope[13]C formation and burning at high temperature during the TP, causing a considerably high neutron-density peak. This is demonstrated in 8, where we show the final isotopic distribution obtained in models M1p025.Z1m2 and M1p259.Z1m2 switching separately off the \isotope[13]C(,n)16O and the (,n) neutron sources: the heavy element distribution in M1p025.Z1m2 drops almost completely when the (,n) rate is set to zero, indicating that this reaction is the main responsible of the final neutron-capture elements production, while the same happens in M1p259.Z1m2 when the \isotope[13]C(,n)16O is switched off.
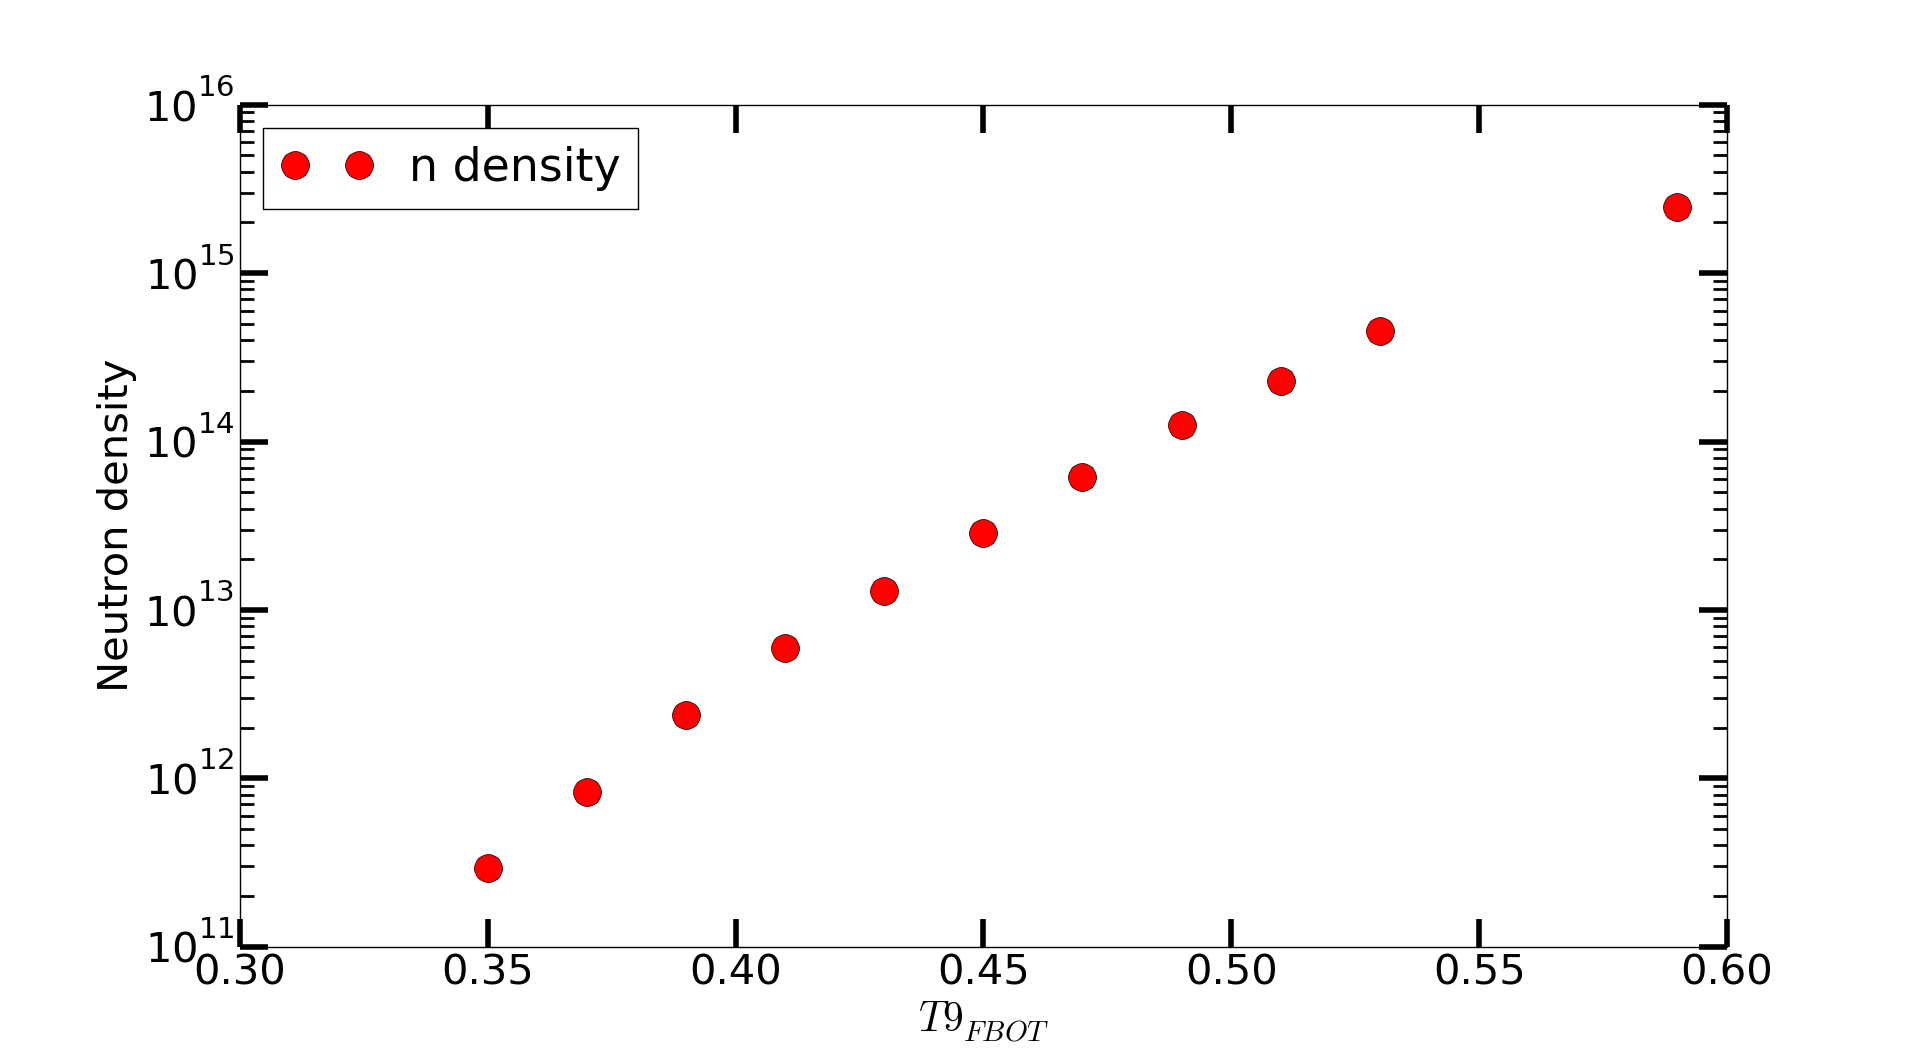
The temperature at the bottom of the PDCZ increases with the increase of the WD mass. This is why larger neutron densities are obtained. According to table LABEL:tab:WDm3z2m2_TPprop and 5, typical TFBOT ranges from 3.2108 K (model M0p639.Z1m2) up to 5.9108 K (model M1p376.Z1m2). The higher temperatures obtained cause an efficient and \isotope[13]C depletion by capture, producing neutron densities up to four orders of magnitude higher than typical TPs in low mass AGB stars. In 9, we show the neutron density calculated in the temperature range of interest, by using realistic abundances from the He intershell abundances of model M1p025.Z1m2 at the onset of the TP, which is similar to the other models presented here. The initial 22Ne abundance in mass fraction is X(22Ne) = 0.00393. The neutron density peak obtained ranges from few 1011 cm-3 up to few 1015 cm-3, which is well beyond the typical -process conditions. Combining 5 with the results shown in 9, TPs for WD masses of or larger are characterized by temperatures of about 5108 K or higher, which means the neutron density peaks will be few 1014 cm-3 or higher.
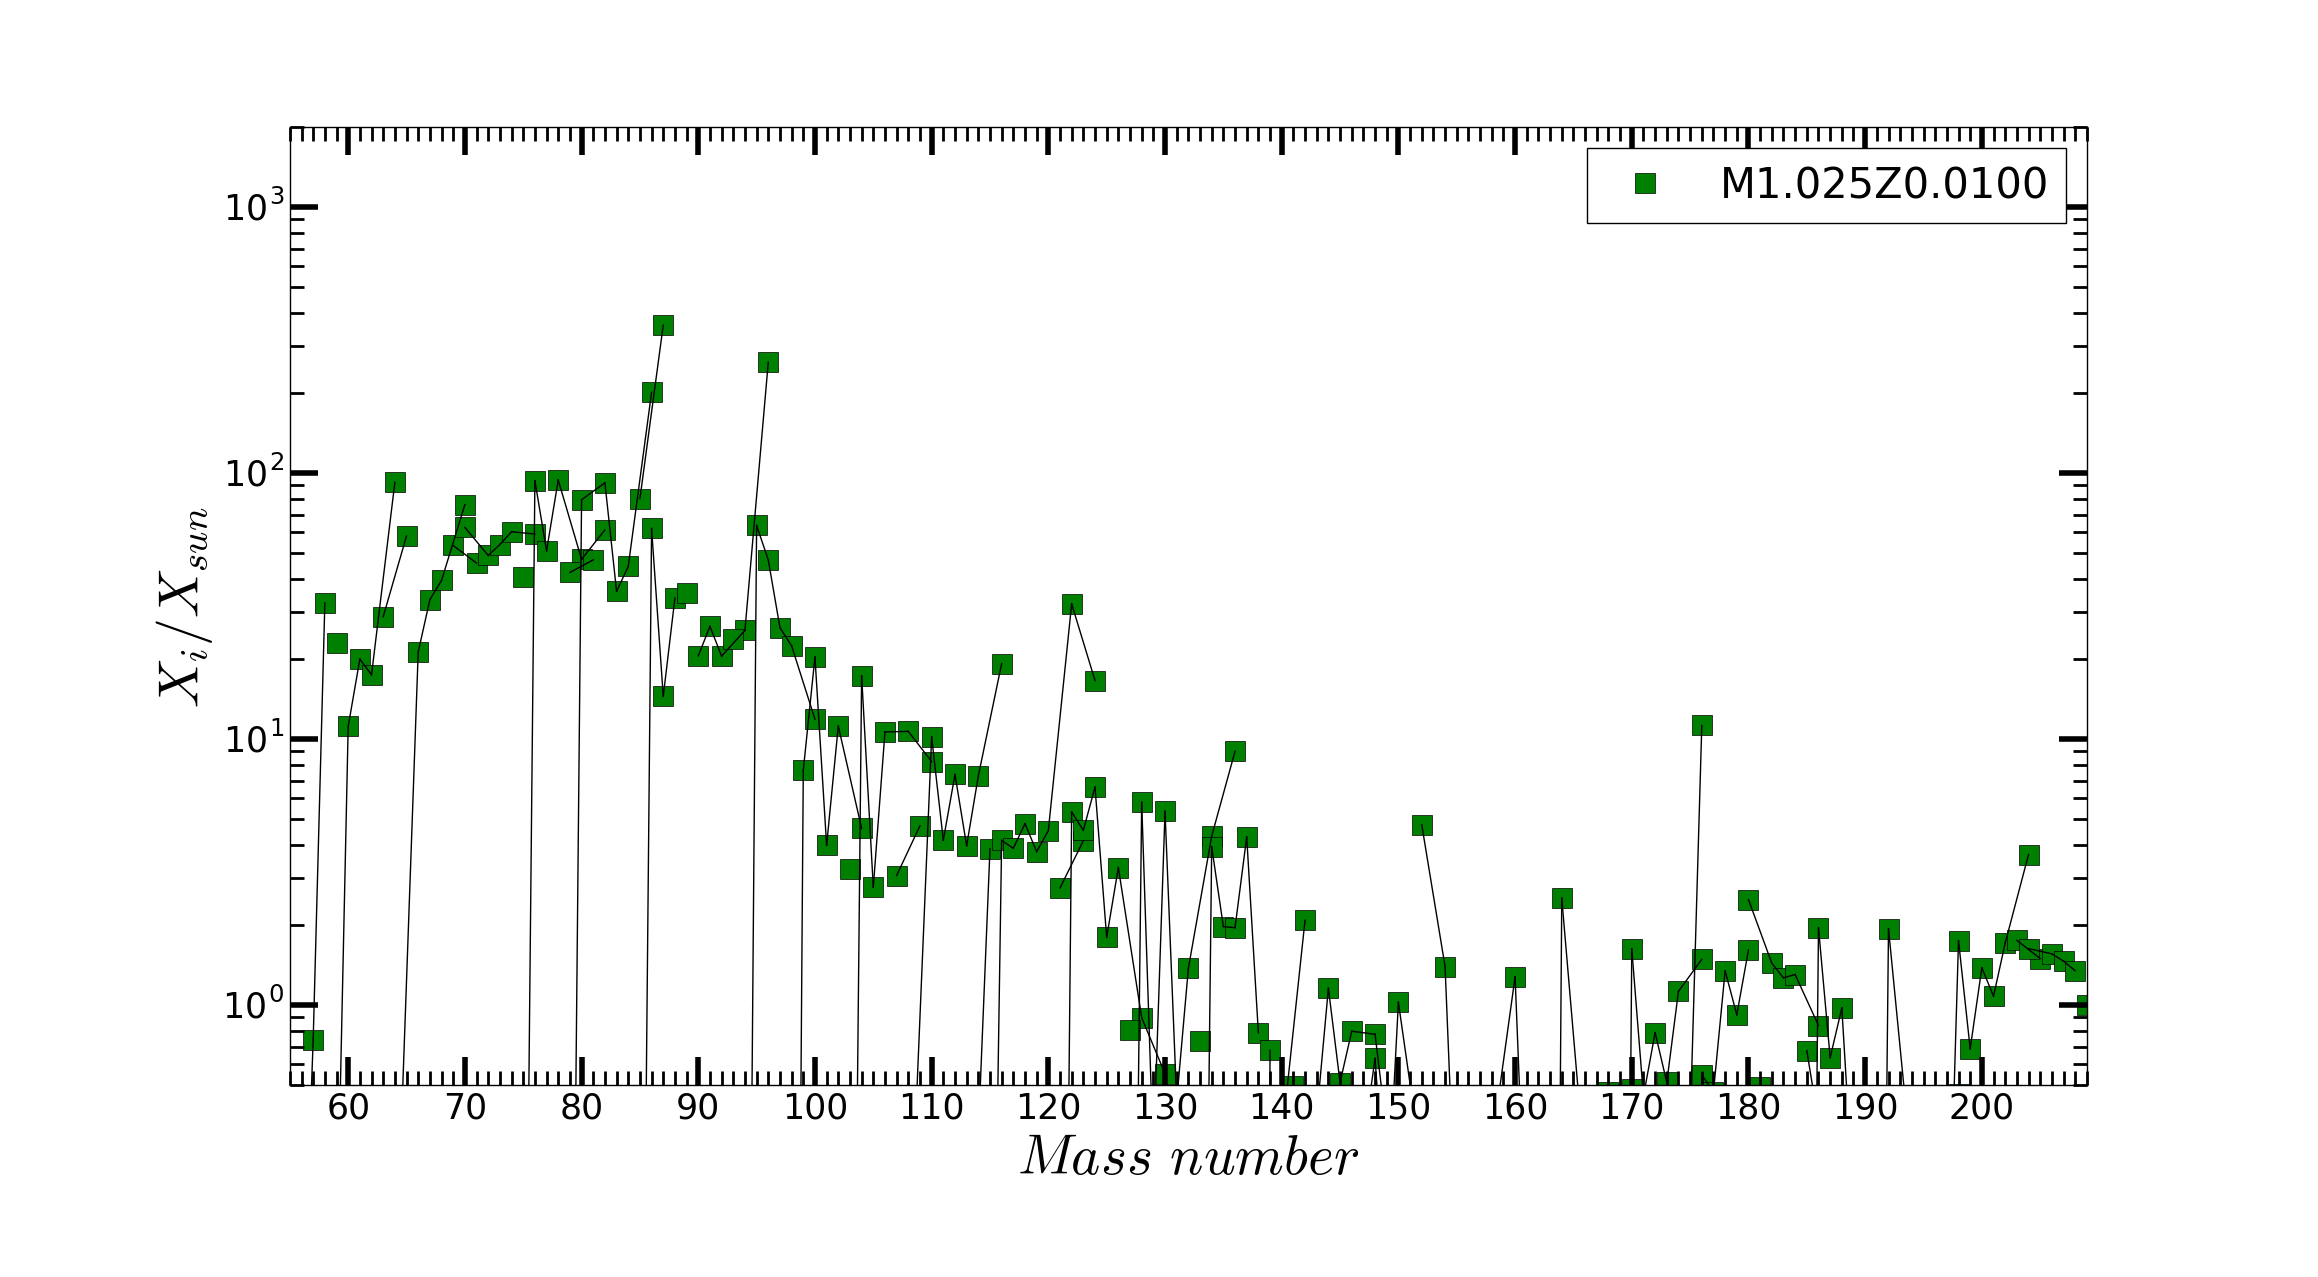
In 10, the abundance distribution beyond Fe in the He intershell is shown at the end of the 4th TP of M1p025.Z1m2. The largest production is obtained for elements between Fe and Zr, in the mass region typical of the weak -process (e.g., The et al., 2007; Pignatari et al., 2010; Käppeler et al., 2011). On the other hand, neutrons are mostly released at neutron densities larger than in massive stars. The isotopes produced the most are 86Kr, 87Rb and 96Zr. Also 70Zn, 76Ge and 82Se, that are classically considered as -process isotopes, are efficiently synthesized at similar abundances with other isotopes nearby that are less neutron-rich. The heaviest isotope showing a production factor in the order of 100 is 123Sb, but overall the production efficiency decreases beyond Zr.
The larger production of the elements at the neutron magic peak N=50 (Sr, Y and Zr), compared to heavier elements at the neutron magic peak N=82 (e.g., Ba and La), is not surprising. Even the complete depletion of 22Ne by -captures in massive stars, during core He-burning and C-shell burning, does not efficiently produce Ba-peak elements (e.g., Käppeler et al., 2011). The main reason is that 22Ne is also efficiently capturing neutrons via (n,), and as it releases neutrons via (,n) reactions, it also produces , which is a strong neutron poison (e.g., Pignatari et al., 2010),
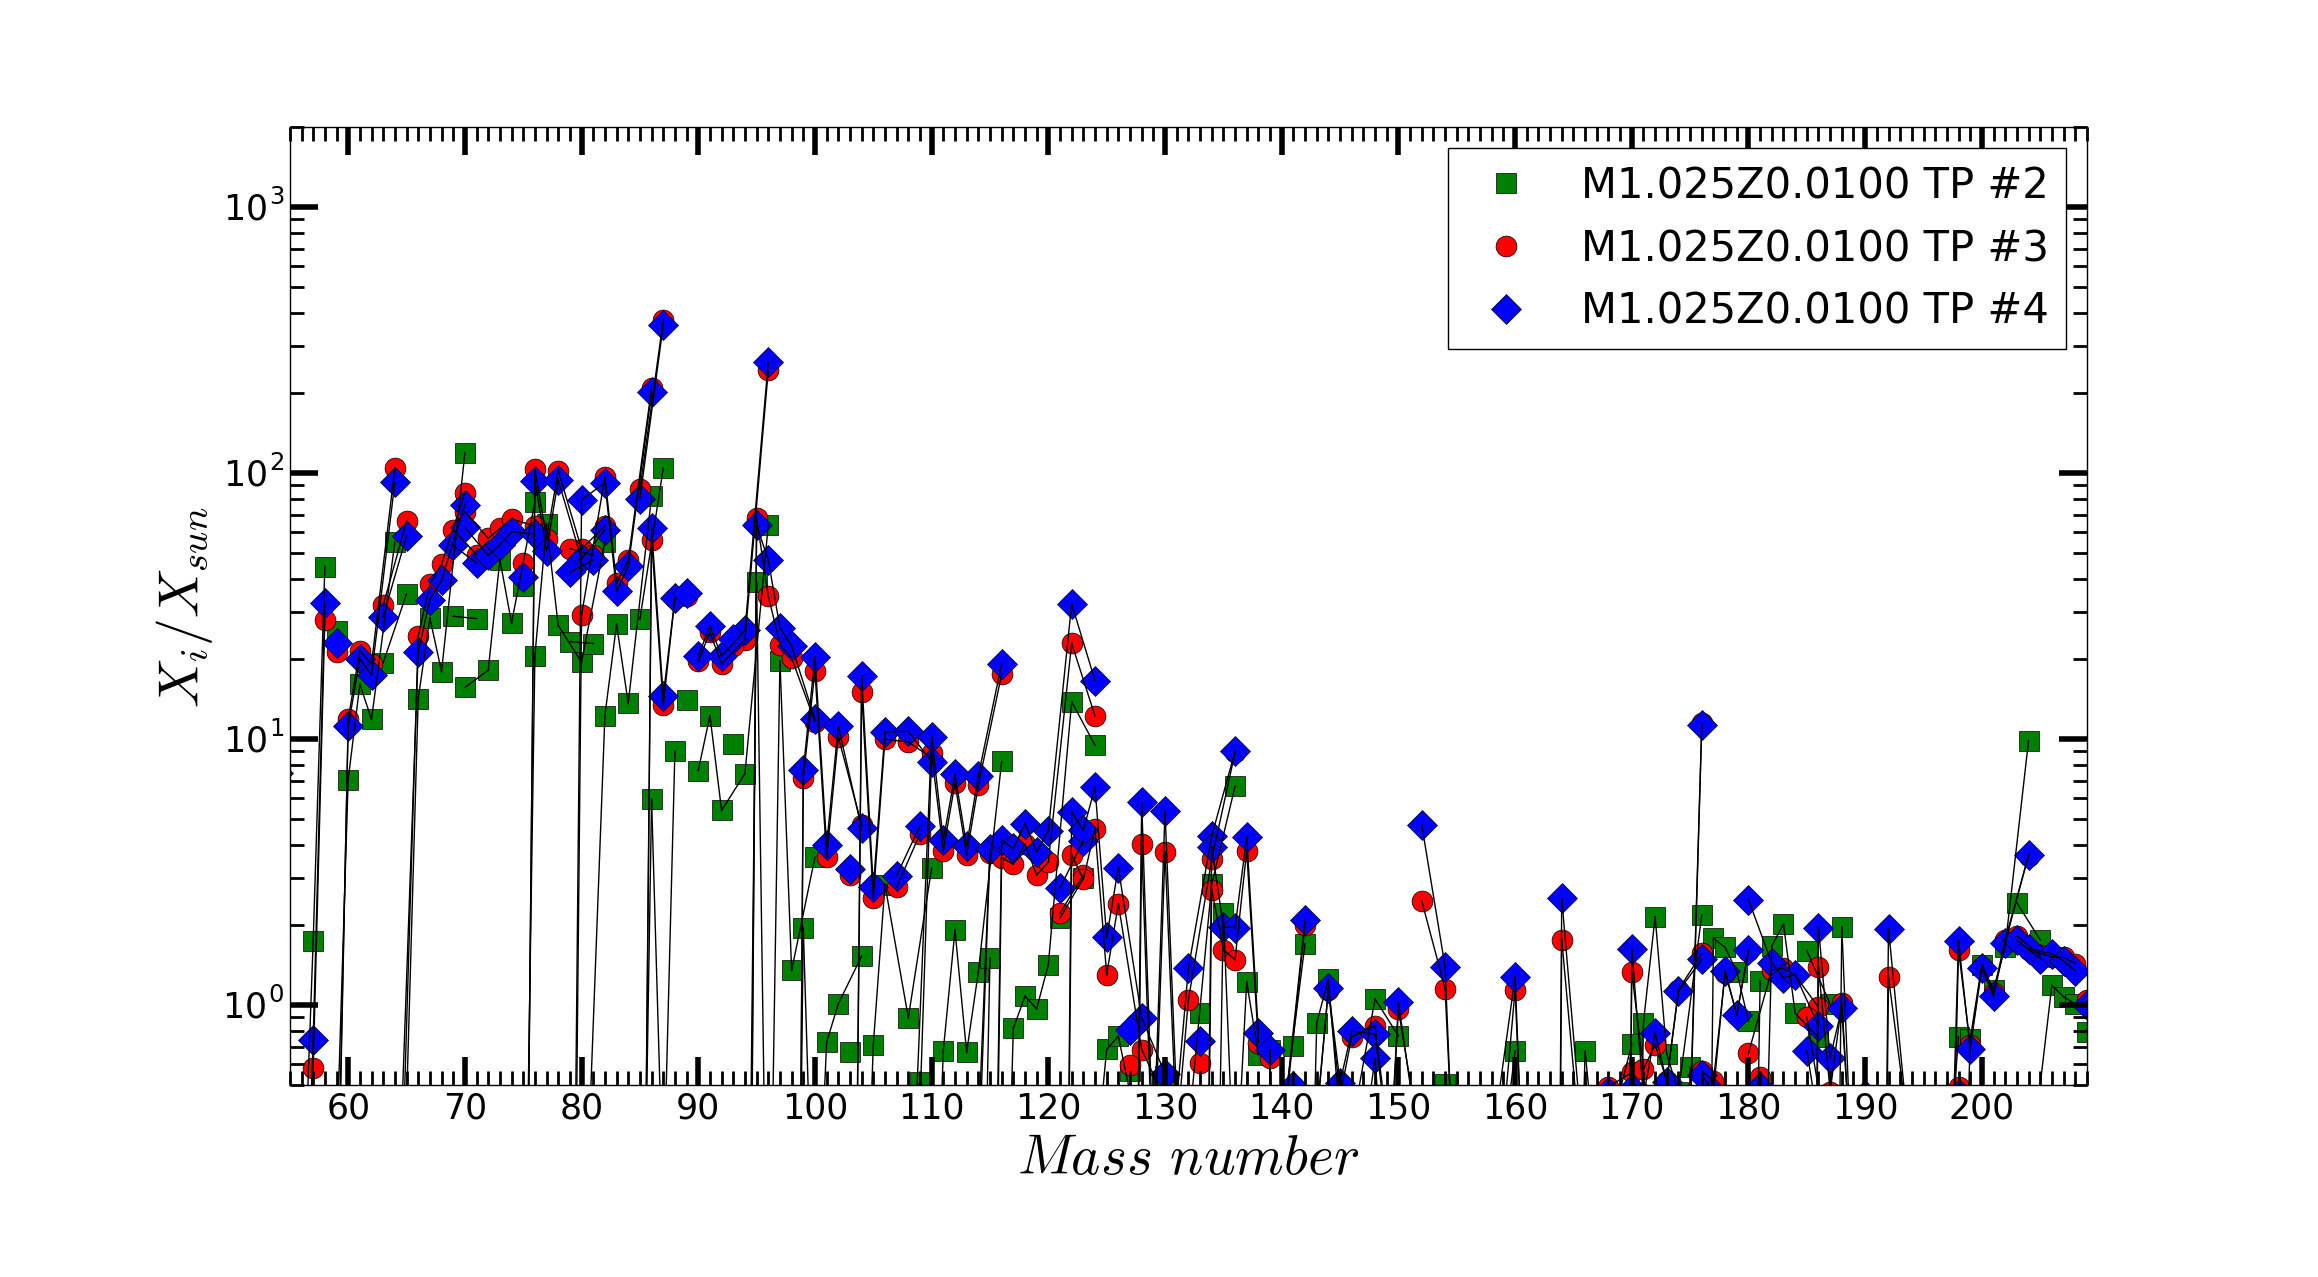
In 11, upper panel, the abundance distribution of M1p025.Z1m2 is shown again. but this time after the 2nd, 3rd and 4th TP. Interestingly, the abundances increase up to about the 3rd TP, and then they saturate to a constant overabundance in the following TPs. This feature is explained in 12, where five consecutive TPs are shown in a Kippenhahn diagram of M1p025.Z1m2. The red-dashed line shows the mass coordinate of the most external zone which has been enriched in heavy elements by the first TP, without being ejected by the super-Eddington wind. It is visible how this mass coordinate is enriched by the the second and third TP as well, while is barely touched by the fourth and does not see any contribution by the fifth TP, whose flash-driven convective zone is located above the dashed line. This is why the heavy element abundance distribution of M1p025.Z1m2 grows up to the 4th TP and then stops. Therefore, there is no need to simulate all the 137 TPs of model M1p025.Z1m2 with the post-processing code, to compute the typical abundance distribution at mass coordinate 1 .
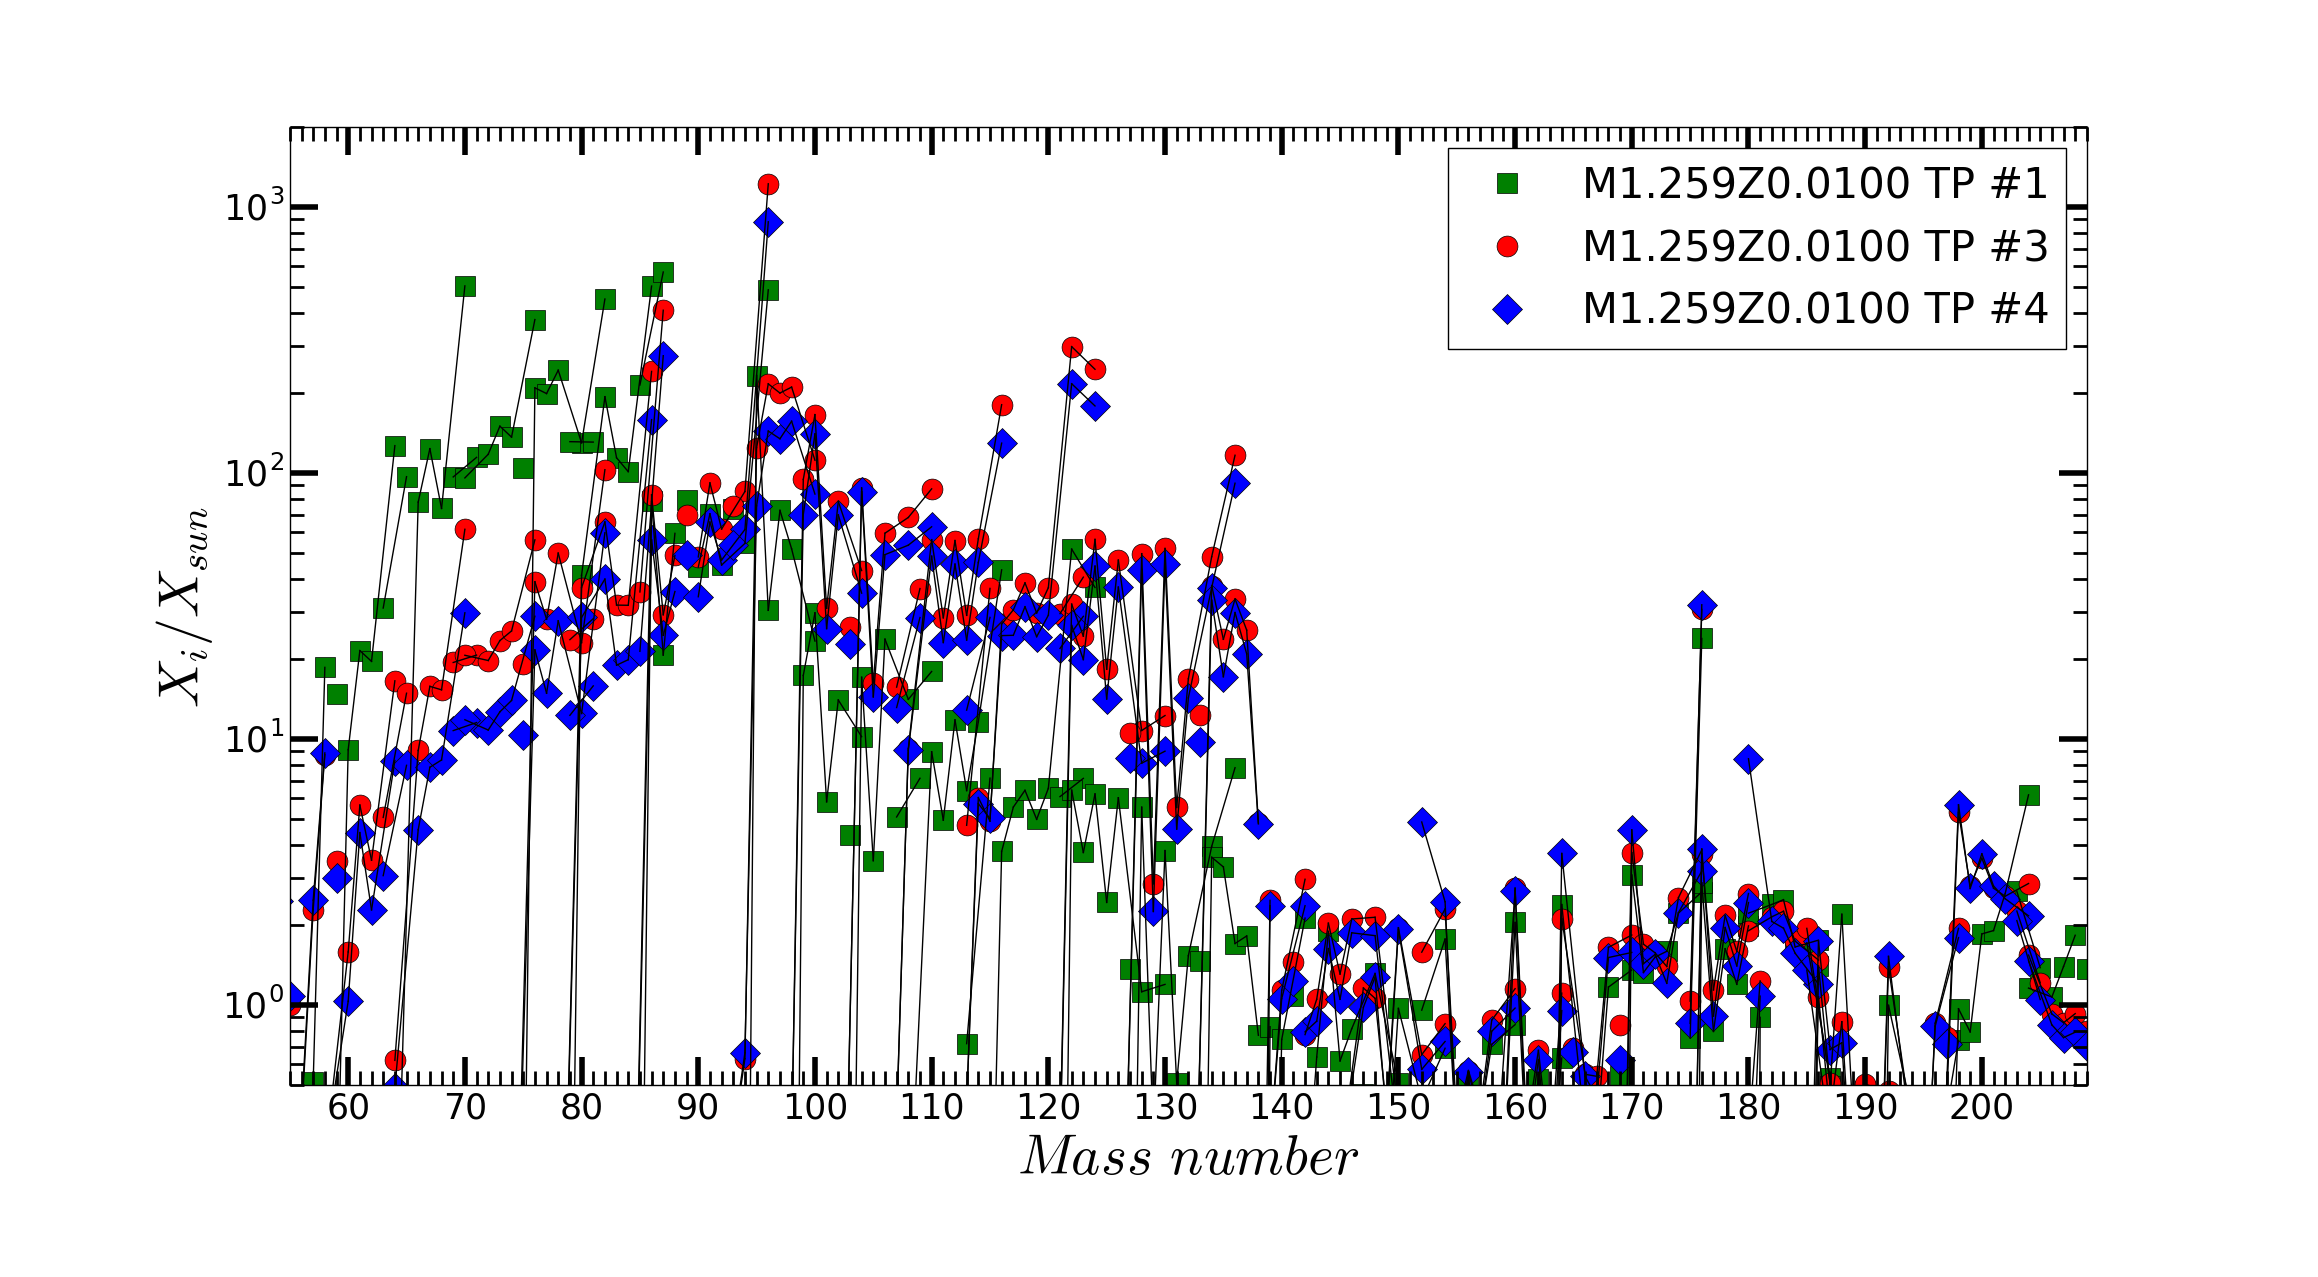
In the lower panel, we show the same kind of comparison for the M1p259.Z1m2 model. Also in this case the saturation of the production is obtained after reaching a maximum after the 3rd TP, when the distribution stabilizes. Therefore, for a given WD mass it is possible to obtain a good estimate of the heavy isotope abundances in the He intershell, by only simulating few convective TPs. As we have shown in the previous sections, the He intershell conditions mainly depend on the WD mass, evolving at the same rate of the net mass increase. For example, the WD mass in M1p025.Z1m2 increases by just 0.5 over 137 TPs, so the thermodynamic conditions and nucleosynthesis stay the same in the short-term evolution of the star (i.e. as long as the WD mass will not increase significantly), and the heavy elements production after few TPs can be considered representative of WD mass 1 . The same applies to the other models discussed in this work. Since the -process seeds are synthesized only close to the WD surface, once the WD mass changes significantly over long enough timescales, they will be buried under the newly accreted mass and will not change anymore.
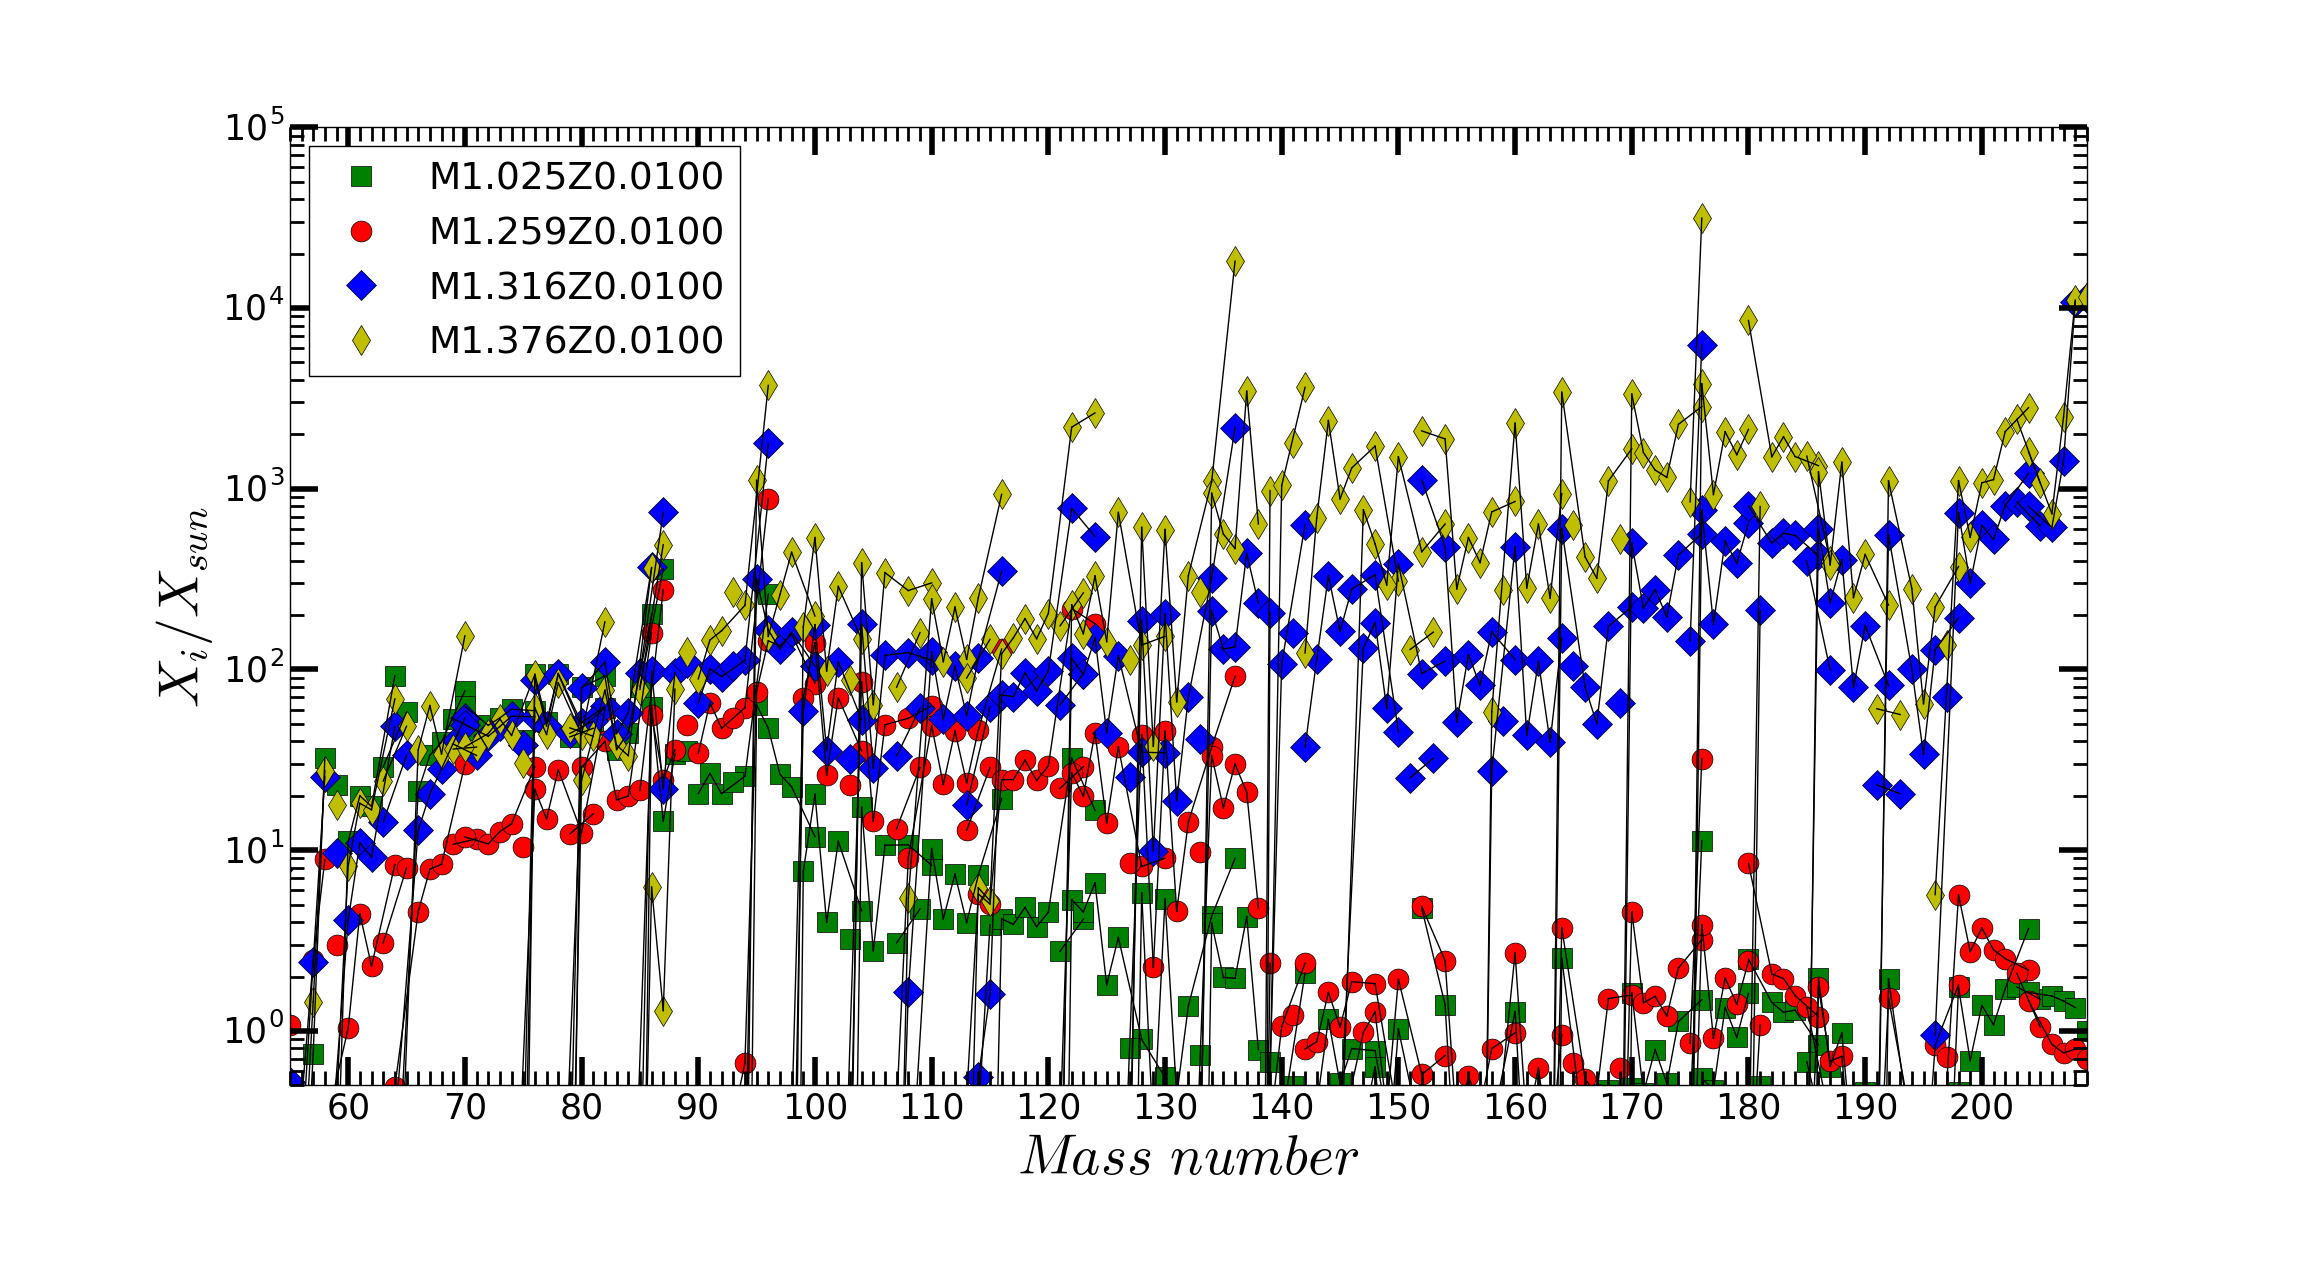
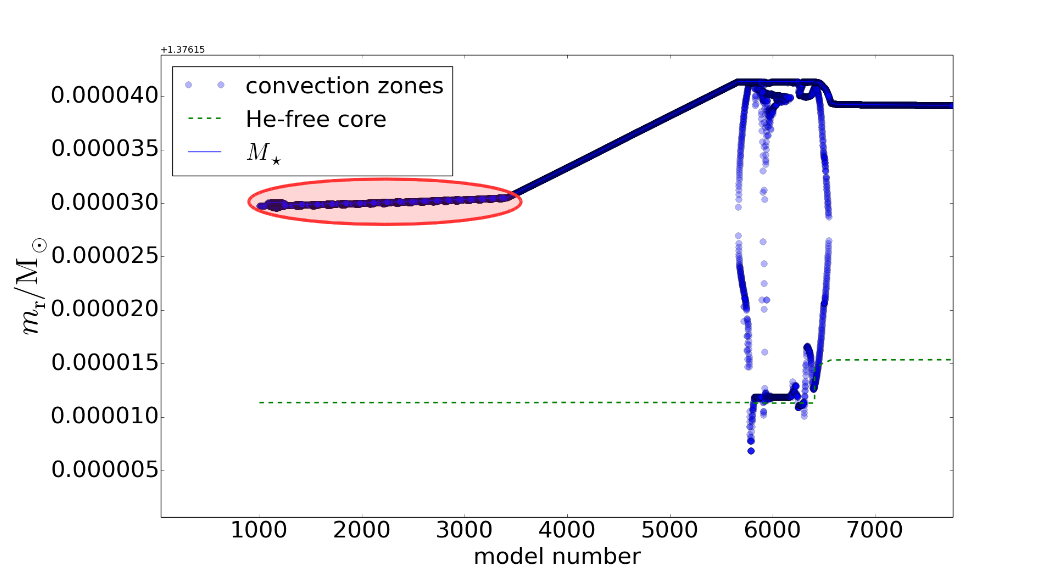
During the entire accretion phase up to the Chandrasekhar mass, thermodynamic conditions close to the surface are evolving significantly. The neutron density peak changes by four orders of magnitude, also indicating a more and more efficient depletion of the available and, for more massive WDs, \isotope[13]C. The production factors shown in 11 calculated for the M1p259.Z1m2 model are larger than the ones calculated for the M1p025.Z1m2 model. This can be better seen in 14, where the abundance distribution calculated for different WD masses is shown. The complete abundance distributions are also given in Tab. LABEL:tab:pf. The production factors tend to increase with the increase of the WD mass, due to the more efficient production of neutrons. The abundance distribution for the M0p856.Z1m2 and M1p025.Z1m2 models is quite similar, with the largest efficiency in the mass region between Fe and Zr. On the other hand, the distributions obtained for the M1p259.Z1m2 model show a significant production up to 136Xe, while the one obtained in M1.376.Z1m2 and M1.316.Z1m2 continues with large efficiency up to the Pb region. This is due to larger neutron exposures obtained for those models, caused by numerous H-flashes, as shown in 15. These flashes trigger proton captures onto the abundant \isotope[12]C producing \isotope[13]C, which is then completely burned via \isotope[13]C(,n)16O in a region of the order of 10-7 at very high temperature (T0.3 GK), with a resulting neutron density around 21015 n cm-3 and a very high neutron exposure. We find that these H-shell flashes are the main site of n-capture nucleosynthesis in our most massive accreting WD models. Notice that this happens during the time interval before the onset of the TP. The most produced isotopes in the Pb region are 204Hg and 209Bi.
Therefore, these calculations show that, in the SNIa progenitor, the heavy seeds of the -process are changing between in mass-coordinate and the surface: the abundance distribution will be enriched between Fe and Zr in the deepest (and hottest) layers; instead, the abundance distribution will be enriched up to and over the Ba mass region approaching the surface (where the bulk of the -process nuclei are made, see TRV11). Moving from outward, the production factors are also increasing up to more than one order of magnitude between Fe and Zr, and even two orders of magnitude between Zr and Xe. Elements heavier than Ba can increase up to three order of magnitude, while over the mass-coordinate range between 0.85 and 1.26 , they are always less abundant compared to the lighter neutron capture products.
4.2 SNIa nucleosynthesis calculation
In this Section we discuss the nucleosynthesis results obtained from post processing the SNIa hydrodynamic model described in details in TRV11. The scenario is based on the explosion triggered once the CO-WD approaches the Chandrasekhar mass. Thermonuclear burning starts out as a subsonic deflagration and later turns into a supersonic detonation. We refer to the SD scenario in which the white dwarf accretes material from a main-sequence or evolved companion star. The explosion is modelled using a two-dimensional hydrodynamic simulations following the delayed detonation model (hereafter DDT-a). This model was tested and compared with early spectra, near-maximum spectra and light-curve of SN 2011fe by Röpke et al. (2012).
It is important to stress that the multi-dimensional simulations reach a qualitatively different level of predictive power than 1D models. In particular, the amount of material burned at a given density cannot longer be fine-tuned but is determined by the fluid motions on the resolved scales. Therefore, once the flame model has been fixed, numerical simulations of the thermonuclear explosion of a given white dwarf can be done by just choosing the ignition conditions, including the chemical composition of the WD, the only remaining (physical) parameter. In addition the 1D thermonuclear supernovae models are commonly not well resolved in the outermost layers of the WD, where -process nucleosynthesis occurs.
Since only a crude description of the thermonuclear burning is applied in the hydrodynamic explosion simulation, details on the nucleosynthesis are recovered in a post-processing step. A Lagrangian component in the form of tracer particles is introduced over the Eulerian grid in order to follow and store the temperature and density evolution of the fluid. Nevertheless it is impossible (due to limited computational resources) to consider mixing processes between tracers, which anyway are not expected to significantly impact our results given the small mass of each tracer of about 3.0 10-5M⊙. In particular for the slower tracers in the outermost part of the star (responsible for the -process nucleosynthesis) this is certainly a very good approximation. For the DDT-a model we used 51,200 tracer particles, uniformly distributed over the star. The distribution of the tracer particles for our model is shown in Figure 16 in two snapshots illustrating the evolution. Different colors are used for different ranges of peak temperature of the tracers. The tracers marked in black have a maximum temperature above 7 GK. Hence, they attain nuclear statistic equilibrium (NSE) conditions and most of the nucleosynthesis goes to 56Ni or Fe-group nuclei. The gray tracers are instead the main producers of the lighter -isotopes. Tracers marked in blue (1.5 GK T 2.4 GK), green (2.4 GK T 3.0 GK), and red (3.0 T 3.7) have peak temperatures in ranges where the -process nucleosynthesis is possible. These three ranges are connected to three different behaviors identified by TRV11 for the production of -nuclei (see their Section 5).
During the hydrodynamic simulation for each tracer particle, T and histories are recorded along their paths. The nuclear post-processing calculations are then performed separately for each particle. The -process nucleosynthesis is calculated using a nuclear network with 1024 species from neutrons and protons up to 209Bi combined with -decays, neutron, proton, and -induced reactions and their inverse. The set of thermonuclear reaction rates we adopted is based on the theoretical values and the Hauser–Feshbach statistical model NON-SMOKER (Rauscher et al., 1997, 2002). The -process nucleosynthesis occurs in SNIa starting on a pre-explosive heavy-element enrichment; therefore, it is essential to determine this enrichment in the exploding WD. As described in Section 3.2, we found recurrent He-flashes occurring in the He-shell during the accretion phase, providing the right conditions to synthesize an heavy-element seeds distribution.
In order to include properly the seeds as a function of the WD mass we use the calculated mass fraction applying them to specific mass ranges, i.e.: M 1.1 M⊙ uses mass fractions from our 1.03 Msun model; 1.1 M⊙ M 1.29 mass fractions from our 1.26 M⊙ model; 1.29 M 1.35 M⊙ uses mass fraction from our 1.32 M⊙ model and anything at higher masses uses 1.38 M⊙ WD. Only the outermost 0.08 M⊙ contribute consistently to the -nuclei, while masses between 1.1 and 1.3 M⊙ do give a contribution but definitely much less important.
Differently to TRV11 where the recurrent He-flashes occurring in the He-shell during the accretion phase were assumed as an hypothesis, in this work they were naturally obtained along the WD evolution. TRV11 tested different metallicities Z, but they inferred that the (/56Fe)/(/56Fe)⊙ ratio is not so much dependent on metallicity. This suggests a primary nature of -process. For this work we therefore consider one metallicity Z=0.01 as representative of a general trend. In Figure 17 we show our results using the heavy-element seeds described in Section 4.1, abundances are normalized to their solar values and to 56Fe and plotted versus their mass number. The solid horizontal line indicates the Solar-System production level relative to 56Fe. As discussed by Nishimura et al. (2018), the impact of nuclear uncertainties on -process abundances is generally within a factor of two. We then show four dashed lines, located a factor of two and four above and below the Solar System level. This allows to see if the -only isotopes are consistent with the observed Solar System level within the typical nuclear uncertainties. Additionally, in table LABEL:tab:prepost we provide pre- and post-explosion abundances of the -nuclei normalized to solar. Globally, -nuclei are heavily depleted by neutron captures during the accretion phase. There are anyway three exceptions (108Cd, 114Sn and 180W), whose abundance ratios compared to solar slightly exceeds unity. This is the fingerprint of proton capture reactions, triggered by the H-ingestion events discussed in the previous chapters. As previously discussed by TRV11 and Travaglio et al. (2015), few nuclei originally ascribed to the -only group (113In, 115Sn, 138La, 152Gd, and 180Ta) are far below the average of the other -nuclei production also in this work. This is a further indication for a different nucleosynthetic origin for them. Concerning 113In and 115Sn, as discussed by Dillmann et al. (2008) and Nemeth et al. (1994), they can get important contributions from -delayed -process decay chains. As for 138La, Woosley et al. (1990) demonstrated that the -nucleus interaction can contribute appreciably to the synthesis of 138La in the neon shell of core collapse supernovae. 152Gd instead is predominantly of -process origin, as it was demonstrated by Kaeppeler et al. (2011). Like 152Gd, also 164Er is of predominant -process origin, driven by the -decay channel at 163Dy, which becomes unstable at stellar temperature Takahashi & Yokoi (1987). Finally, 180Ta, as discussed by TRV11 and Mohr et al. (2007), receives an important contribution from the -process due to the branching at 179Hf. Concerning the other 30 -nuclei, Travaglio et al. (2018) showed how type II SNe and SNIa could be seen as complementary sites to explain the -process Solar System content, contributing to A 92 and A 92 atomic-mass ranges respectively. Looking at our -process distribution, we get an efficient production for A 92. We obtain solar to super-solar abundances, with about two thirds of -nuclei produced consistently with the observed Solar System level, confirming SNIa as a -process production site. It should be noted that 92Mo, 94Mo and 96Ru are not efficiently produced, but multi-D models suggest ejection of high abundances of all these three isotopes in faint type-II supernovae (see Eichler et al., 2018). In particular, according to Eichler et al. (2018) 92,94Mo may be produced by proton and neutron captures under neutron-rich conditions, whereas another source is required for the Ru isotopes, such as a p-process as introduced by Fröhlich et al. (2006). Its relevance for the production of Mo and Ru isotopes has recently been studied by, e.g., by (Nishimura et al., 2019) and (Rauscher et al., 2020). Finally, the -nuclides below Mo may also have been produced by other stellar core-collapse supernova components, such as -rich freeze-out of hot matter (e.g., Pignatari et al. 2016; Lugaro et al. 2016; Travaglio et al. 2018). Therefore, there seems to remain a possibility to explain the full range of -process content in the Solar System by combining production in SNIa and in core-collapse SNe.
5 Summary and conclusions
In this work we have analyzed the neutron capture nucleosynthesis in accreting WD models. We presented for the first time a heavy-element distribution calculated from realistic simulations of WD-accretion phase in the single degenerate scenario channel to SNIa. Such distribution arises from recurrent He- and H-flashes on the WD surface as H-rich material is accreted onto the WD from a companion. Contrary to previous rapidly-accreting white dwarf models at lower mass, we find that the H-shell flashes are the main site of n-capture nucleosynthesis. We mostly focused on WDs with masses of the order or larger than 1.1, since these initial masses are most likely to reach the Chandrasekhar mass, and only the external 0.2-0.3of the SNIa progenitor are relevant for the -process production (Travaglio et al., 2011). The main neutron sources are the (,n) and the \isotope[13]C(,n)\isotope[16]O reactions for WD masses lower and larger than 1.26 respectively. In our simulations, those reactions are activated during convective TPs in the He intershell and during hot (T0.3 GK) H-flashes WDs larger than 1.3, with neutron densities between few 1012 cm-3 and few 1015 cm-3, much higher than typical -process conditions. The final abundance distribution includes large quantities of Rb,Kr, Zr, Ba-peak isotopes, including Pb for our M1p316.Z1m2 and M1p376.Z1m2 models . This is therefore globally very similar to the one adopted in Travaglio et al. (2011). When used as a starting abundance distribution, heavily affected by earlier neutron processing, p-nuclei are significantly produced in the mass range 96A196.
It should be noted that Roche-Lobe over flow may lower the retention efficiency of accreting WDs. This has not been considered here both for computational time requirements and for the small impact on heavy-elements nucleosynthesis on top layers of the WD, which is the main target of the present study.
A source of uncertainty for our results arises due to the occurrence of H ingestion into He-burning layers during the accretion phase, discussed in section 3.4. The capture of ingested protons on the abundant 12C (direct product of He-burning) produces the unstable isotope 13N that decays to 13C, which acts as neutron source via 13C(,n)16O reactions. In these environments, neutron densities are a few 1015 cm-3, typical for so-called -process environments. In these conditions, the impact of uncertainties coming from nuclear-physics on these results could be high, in particular concerning neutron-capture reaction rates on unstable nuclei. Secondly, as mentioned in section 3.4, in order to account for the H-ingestion events and their nucleosynthesis products, one-dimensional stellar models need to be guided by full 3D-hydrodynamic simulations (e.g., Herwig et al., 2014). As pointed out by Herwig et al. (2011), one-dimensional stellar models under-estimate the production of heavy element by at least a factor of 2 in these conditions. This impacts the production of the -seeds during the accretion phase, and as a consequence also the explosive -process nucleosynthesis, which directly depends on the seeds abundance at the onset of the ignition.
Similar, yet slightly different, conditions are found in the hot H-flashes before the onset of He-flashes of our M 1.3 models, where the 13C(,n)16O is strongly activated and nuclei up to the Pb region are synthetised: these features appear to happen systematically once WD masses larger than 1.3 are considered, and are a natural consequence of the high temperature at which H-flash instabilities take place. Given their crucial role in the production of heavy-elements seeds for the subsequent -process nucleosynthesis during the SNIa event, and the potential impact of modelling uncertainties very similar to the ones affecting the previously mentioned H-ingestion events, both kind of events should be considered as important candidates to be studied in future multi-dimensional simulations.
Finally, we computed the explosive nucleosynthesis using our seed distributions as initial abundances. We obtained that the -process production in SNIa is confirmed for -nuclei above A=96, at a level between solar and super-solar relative to iron, confirming results by Travaglio et al. (2011).
5.1 Acknowledgements
We thank the anonymous referee, whose suggestions improved the quality of this paper. This article is based upon work from the “ChETEC” COST Action (CA16117), supported by COST (European Cooperation in Science and Technology). This research was enabled in part by support provided by WestGrid (www.westgrid.ca), Compute Canada Calcul Canada (www.computecanada.ca), and the University of British Columbia computer cluster “Orcinus”. NuGrid data is served by Canfar CADC. CLW acknowledge support from the Science and Technology Facilities Council UK (ST/M006085/1). UB and CLW acknowledge support from the European Research Council ERC-2015-STG Nr. 677497. UB deeply thanks Sergio Cristallo for fruitful discussions which largely improved this paper. UB acknowledges the mentoring of Roberto Gallino, and is particularly grateful for his inspiration and support, since the very early days of his Master’s thesis on the origin of -nuclei. This study was also supported by the Swiss National Science Foundation and the EU-FP7-ERC Advanced Grant 321263 FISH. MP acknowledges significant support to NuGrid from STFC (through the University of Hull’s Consolidated Grant ST/R000840/1), and access to viper, the University of Hull High Performance Computing Facility. MP acknowledges the support from the ”Lendulet-2014” Program of the Hungarian Academy of Sciences (Hungary), and the ERC Consolidator Grant funding scheme (Project RADIOSTAR, G.A. n. 724560, Hungary). PD’s research was supported by the National Science Foundation (USA) under Grant No. PHY-1430152 (JINA Center for the Evolution of the Elements)
References
- Angulo et al. (1999) Angulo, C., Arnould, M., & Rayet, M. et al. 1999, Nucl. Phys., A 656, 3, NACRE compilation
- Arnould (1976) Arnould, M. 1976, A&A, 46, 117
- Asplund et al. (1999) Asplund, M., Lambert, D. L., Kipper, T., Pollacco, D., & Shetrone, M. D. 1999, A&A, 343, 507
- Audouze & Truran (1975) Audouze, J., & Truran, J. W. 1975, ApJ, 202, 204
- Becker & Iben (1979) Becker, S. A., & Iben, Jr., I. 1979, ApJ, 232, 831
- Brachwitz et al. (2000) Brachwitz, F., et al. 2000, ApJ, 536, 934
- Côté et al. (2018) Côté, B., Denissenkov, P., Herwig, F., Ruiter, A. J., Ritter, C., Pignatari, M., & Belczynski, K. 2018, ApJ, 854, 105
- Cox & Giuli (1968) Cox, J. P., & Giuli, R. T. 1968, Principles of stellar structure (New York, Gordon and Breach [1968])
- Cyburt et al. (2010) Cyburt, R. H., et al. 2010, ApJS, 189, 240
- deBoer et al. (2017) deBoer, R. J., et al. 2017, Reviews of Modern Physics, 89, 035007
- Denissenkov et al. (2017) Denissenkov, P. A., Herwig, F., Battino, U., Ritter, C., Pignatari, M., Jones, S., & Paxton, B. 2017, ApJ, 834, L10
- Denissenkov et al. (2019) Denissenkov, P. A., Herwig, F., Woodward, P., Andrassy, R., Pignatari, M., & Jones, S. 2019, MNRAS, 488, 4258
- Denissenkov et al. (2019) Denissenkov, P. A., Herwig, F., Woodward, P., Andrassy, R., Pignatari, M., & Jones, S. 2019, MNRAS, 488, 4258
- Denissenkov et al. (2015) Denissenkov, P. A., Truran, J. W., Herwig, F., Jones, S., Paxton, B., Nomoto, K., Suzuki, T., & Toki, H. 2015, MNRAS, 447, 2696
- Denissenkov et al. (2013) Denissenkov, P. A., Truran, J. W., Pignatari, M., Trappitsch, R., Ritter, C., Herwig, F., Battino, U., & Setoodehnia, K. 2013, ArXiv e-prints
- Dillmann et al. (2008) Dillmann, I., Plag, R., Heil, M., Käppeler, F., & Rauscher, T. 2008, ArXiv e-prints
- Dillmann et al. (2014) Dillmann, I., Szücs, T., Plag, R., Fülöp, Z., Käppeler, F., Mengoni, A., & Rauscher, T. 2014, Nuclear Data Sheets, 120, 171
- Dominguez et al. (1996) Dominguez, I., Straniero, O., Tornambe, A., & Isern, J. 1996, ApJ, 472, 783
- Dominguez et al. (1993) Dominguez, I., Tornambe, A., & Isern, J. 1993, ApJ, 419, 268
- Eichler et al. (2018) Eichler, M., et al. 2018, Journal of Physics G Nuclear Physics, 45, 014001
- Eitner et al. (2020) Eitner, P., Bergemann, M., Hansen, C. J., Cescutti, G., Seitenzahl, I. R., Larsen, S., & Plez, B. 2020, A&A, 635, A38
- Ferguson et al. (2005) Ferguson, J. W., Alexander, D. R., Allard, F., Barman, T., Bodnarik, J. G., Hauschildt, P. H., Heffner-Wong, A., & Tamanai, A. 2005, Astrophysical Journal, 623, 585
- Filippenko (1997) Filippenko, A. V. 1997, ARA&A, 35, 309
- Fröhlich et al. (2006) Fröhlich, C., Martínez-Pinedo, G., Liebendörfer, M., Thielemann, F. K., Bravo, E., Hix, W. R., Langanke, K., & Zinner, N. T. 2006, Phys. Rev. Lett., 96, 142502
- Fuller et al. (1985) Fuller, G. M., Fowler, W. A., & Newman, M. J. 1985, ApJ, 293, 1
- Fynbo et al. (2005) Fynbo, H. O. U., et al. 2005, Nature, 433, 136
- Goriely (1999) Goriely, S. 1999, A&A, 342, 881
- Goriely et al. (2002) Goriely, S., José, J., Hernanz, M., Rayet, M., & Arnould, M. 2002, A&A, 383, L27
- Grevesse & Noels (1993) Grevesse, N., & Noels, A. 1993, in Origin and Evolution of the Elements, ed. N. Prantzos, E. Vangioni-Flam, & M. Casse, 15–25
- Heil et al. (2008) Heil, M., et al. 2008, ApJ, 673, 434
- Herwig (2000) Herwig, F. 2000, A&A, 360, 952
- Herwig (2001) —. 2001, APSS, 275, 15
- Herwig (2005) —. 2005, ARA&A, 43, 435
- Herwig et al. (1999) Herwig, F., Blocker, T., Langer, N., & Driebe, T. 1999, A&A, 349, L5
- Herwig et al. (1999) Herwig, F., Blöcker, T., Langer, N., & Driebe, T. 1999, A&A, 349, L5
- Herwig et al. (2011) Herwig, F., Pignatari, M., Woodward, P. R., Porter, D. H., Rockefeller, G., Fryer, C. L., Bennett, M., & Hirschi, R. 2011, ApJ, 727, 89
- Herwig et al. (2011) Herwig, F., Pignatari, M., Woodward, P. R., Porter, D. H., Rockefeller, G., Fryer, C. L., Bennett, M., & Hirschi, R. 2011, ApJ, 727, 89
- Herwig et al. (2014) Herwig, F., Woodward, P. R., Lin, P.-H., Knox, M., & Fryer, C. 2014, ApJ, 792, L3
- Herwig et al. (2014) Herwig, F., Woodward, P. R., Lin, P.-H., Knox, M., & Fryer, C. 2014, ApJ, 792, L3
- Hillebrandt et al. (2013) Hillebrandt, W., Kromer, M., Röpke, F. K., & Ruiter, A. J. 2013, Frontiers of Physics, 8, 116
- Howard et al. (1991) Howard, W. M., Meyer, B. S., & Woosley, S. E. 1991, ApJ, 373, L5
- Iben (1981) Iben, Jr., I. 1981, ApJ, 243, 987
- Iben & Tutukov (1984) Iben, I., J., & Tutukov, A. V. 1984, ApJS, 54, 335
- Iglesias & Rogers (1996) Iglesias, C. A., & Rogers, F. J. 1996, ApJ, 464, 943
- Iliadis et al. (2001) Iliadis, C., D’Auria, J. M., Starrfield, S., Thompson, W. J., & Wiescher, M. 2001, ApJS, 134, 151
- Imbriani et al. (2004) Imbriani, G., et al. 2004, A&A, 420, 625
- Imbriani et al. (2005) —. 2005, European Physical Journal A, 25, 455
- Iwamoto et al. (1999) Iwamoto, K., Brachwitz, F., Nomoto, K., Kishimoto, N., Umeda, H., Hix, W. R., & Thielemann, F.-K. 1999, ApJS, 125, 439
- Jaeger et al. (2001) Jaeger, M., Kunz, R., Mayer, A., Hammer, J. W., Staudt, G., Kratz, K. L., & Pfeiffer, B. 2001, Physical Review Letters, 87, 202501
- Johansson et al. (2016) Johansson, J., Woods, T. E., Gilfanov, M., Sarzi, M., Chen, Y.-M., & Oh, K. 2016, MNRAS, 461, 4505
- Jose et al. (1993) Jose, J., Hernanz, M., & Isern, J. 1993, A&A, 269, 291
- Käppeler et al. (2011) Käppeler, F., Gallino, R., Bisterzo, S., & Aoki, W. 2011, Reviews of Modern Physics, 83, 157
- Karakas & Lattanzio (2014) Karakas, A. I., & Lattanzio, J. C. 2014, Publ. Astronom. Soc. Aus., 31, 30
- Kato & Hachisu (1999) Kato, M., & Hachisu, I. 1999, ApJ, 513, L41
- Kippenhahn & Weigert (1990) Kippenhahn, R., & Weigert, A. 1990, Stellar structure and evolution (Berlin: Springer)
- Kobayashi et al. (2019) Kobayashi, C., Leung, S.-C., & Nomoto, K. 2019, arXiv e-prints, arXiv:1906.09980
- Kunz et al. (2002) Kunz, R., Fey, M., Jaeger, M., Mayer, A., Hammer, J. W., Staudt, G., Harissopulos, S., & Paradellis, T. 2002, ApJ, 567, 643
- Kusakabe et al. (2011) Kusakabe, M., Iwamoto, N., & Nomoto, K. 2011, ApJ, 726, 25
- Langanke & Martínez-Pinedo (2000) Langanke, K., & Martínez-Pinedo, G. 2000, Nuclear Physics A, 673, 481
- Langer et al. (2000) Langer, N., Deutschmann, A., Wellstein, S., & Höflich, P. 2000, A&A, 362, 1046
- Lugaro et al. (2014) Lugaro, M., Tagliente, G., Karakas, A. I., Milazzo, P. M., Käppeler, F., Davis, A. M., & Savina, M. R. 2014, ApJ, 780, 95
- Ma et al. (2013) Ma, X., Chen, X., Chen, H.-l., Denissenkov, P. A., & Han, Z. 2013, ApJ, 778, L32
- MacDonald (1983) MacDonald, J. 1983, ApJ, 273, 289
- Maoz et al. (2014) Maoz, D., Mannucci, F., & Nelemans, G. 2014, ARA&A, 52, 107
- Mazzali et al. (2007) Mazzali, P., Röpke, F.K.. Benetti, S., & Hillebrandt. 2007, 315, 825
- Mestel (1952) Mestel, L. 1952, MNRAS, 112, 598
- Miller Bertolami & Althaus (2007) Miller Bertolami, M. M., & Althaus, L. G. 2007, MNRAS, 380, 763
- Miller Bertolami et al. (2006) Miller Bertolami, M. M., Althaus, L. G., Serenelli, A. M., & Panei, J. A. 2006, A&A, 449, 313
- Mohr et al. (2007) Mohr, P., Käppeler, F., & Gallino, R. 2007, Phys. Rev. C., 75, 012802
- Nemeth et al. (1994) Nemeth, Z., Kaeppeler, F., Theis, C., Belgya, T., & Yates, S. W. 1994, ApJ, 426, 357
- Nishimura et al. (2019) Nishimura, N., Rauscher, T., Hirschi, R., Cescutti, G., Murphy, A. S. J., & Fröhlich, C. 2019, MNRAS, 489, 1379
- Nishimura et al. (2018) Nishimura, N., Rauscher, T., Hirschi, R., Murphy, A. S. J., Cescutti, G., & Travaglio, C. 2018, MNRAS, 474, 3133
- Nomoto (1982) Nomoto, K. 1982, ApJ, 253, 798
- Nomoto (1984) —. 1984, ApJ, 277, 791
- Nomoto et al. (2007) Nomoto, K., Saio, H., Kato, M., & Hachisu, I. 2007, ApJ, 663, 1269
- Nomoto et al. (1984) Nomoto, K., Thielemann, F. K., & Yokoi, K. 1984, ApJ, 286, 644
- Oda et al. (1994) Oda, T., Hino, M., Muto, K., Takahara, M., & Sato, K. 1994, Atomic Data and Nuclear Data Tables, 56, 231
- Paczynski (1974) Paczynski, B. 1974, ApJ, 192, 483
- Paczynski (1983) —. 1983, ApJ, 264, 282
- Paczynski & Proszynski (1986) Paczynski, B., & Proszynski, M. 1986, ApJ, 302, 519
- Pakmor et al. (2012) Pakmor, R., Kromer, M., Taubenberger, S., Sim, S. A., Röpke, F. K., & Hillebrandt, W. 2012, ApJ, 747, L10
- Paxton et al. (2010) Paxton, P., et al. 2010, MESA: modules for experiments in stellar astrophysics, http://mesa.sourceforge.net
- Piersanti et al. (2014) Piersanti, L., Tornambé, A., & Yungelson, L. R. 2014, MNRAS, 445, 3239
- Pignatari et al. (2010) Pignatari, M., Gallino, R., Heil, M., Wiescher, M., Käppeler, F., Herwig, F., & Bisterzo, S. 2010, ApJ, 710, 1557
- Pignatari et al. (2016) Pignatari, M., et al. 2016, ApJS, 225, 24
- Piro & Bildsten (2008) Piro, A. L., & Bildsten, L. 2008, ApJ, 673, 1009
- Rauscher et al. (2002) Rauscher, T., Heger, A., Hoffman, R. D., & Woosley, S. E. 2002, ApJ, 576, 323
- Rauscher et al. (2020) Rauscher, T., Nishimura, N., Cescutti, G., Hirschi, R., Murphy, A. S. J., & Fröhlich, C. 2020, Impact of Uncertainties in Astrophysical Reaction Rates on Nucleosynthesis in the ¡italic¿νp¡/italic¿ Process
- Rauscher et al. (1997) Rauscher, T., Thielemann, F.-K., & Kratz, K.-L. 1997, Phys. Rev. C, 56, 1613
- Ritter et al. (2018) Ritter, C., Andrassy, R., Côté, B., Herwig, F., Woodward, P. R., Pignatari, M., & Jones, S. 2018, MNRAS, 474, L1
- Röpke et al. (2012) Röpke, F. K., et al. 2012, ApJ, 750, L19
- Rybicki & Lightman (1979) Rybicki, G. B., & Lightman, A. P. 1979, Radiative processes in astrophysics
- Seitenzahl et al. (2019) Seitenzahl, I. R., Ghavamian, P., Laming, J. M., & Vogt, F. P. A. 2019, Phys. Rev. Lett., 123, 041101
- Shen & Bildsten (2007) Shen, K. J., & Bildsten, L. 2007, ApJ, 660, 1444
- Sion et al. (1979) Sion, E. M., Acierno, M. J., & Tomczyk, S. 1979, ApJ, 230, 832
- Starrfield et al. (2012) Starrfield, S., Iliadis, C., Timmes, F. X., Hix, W. R., Arnett, W. D., Meakin, C., & Sparks, W. M. 2012, Bulletin of the Astronomical Society of India, 40, 419
- Tagliente et al. (2008a) Tagliente, G., et al. 2008a, Phys. Rev. C, 77, 035802
- Tagliente et al. (2010) —. 2010, Phys. Rev. C, 81, 055801
- Tagliente et al. (2011a) —. 2011a, Phys. Rev. C, 84, 015801
- Tagliente et al. (2011b) —. 2011b, Phys. Rev. C, 84, 055802
- Tagliente et al. (2013) —. 2013, Phys. Rev. C, 87, 014622
- Tagliente et al. (2008b) —. 2008b, Phys. Rev. C, 78, 045804
- Takahashi & Yokoi (1987) Takahashi, K., & Yokoi, K. 1987, ADNDT, 36, 375
- The et al. (2007) The, L., El Eid, M. F., & Meyer, B. S. 2007, ApJ, 655, 1058
- Thielemann et al. (1986) Thielemann, F.-K., Nomoto, K., & Yokoi, K. 1986, A&A, 158, 17
- Tornambé et al. (2000) Tornambé, A., Iben, Jr., I., Piersanti, L., & Cassisi, S. 2000, Mem. Soc. Astron. Italiana, 71, 471
- Travaglio et al. (2015) Travaglio, C., Gallino, R., Rauscher, T., Röpke, F. K., & Hillebrandt, W. 2015, ApJ, 799, 54
- Travaglio et al. (2018) Travaglio, C., Rauscher, T., Heger, A., Pignatari, M., & West, C. 2018, ArXiv e-prints
- Travaglio et al. (2011) Travaglio, C., Röpke, F. K., Gallino, R., & Hillebrandt, W. 2011, ApJ, 739, 93
- van den Heuvel et al. (1992) van den Heuvel, E. P. J., Bhattacharya, D., Nomoto, K., & Rappaport, S. A. 1992, A&A, 262, 97
- Webbink (1984) Webbink, R. F. 1984, ApJ, 277, 355
- Whelan & Iben (1973) Whelan, J., & Iben, Jr., I. 1973, ApJ, 186, 1007
- Wolf et al. (2013) Wolf, W. M., Bildsten, L., Brooks, J., & Paxton, B. 2013, ApJ, 777, 136
- Woods & Gilfanov (2013) Woods, T. E., & Gilfanov, M. 2013, MNRAS, 432, 1640
- Woosley et al. (1990) Woosley, S. E., Hartmann, D. H., Hoffman, R. D., & Haxton, W. C. 1990, ApJ, 356, 272
- Woosley & Howard (1978) Woosley, S. E., & Howard, W. M. 1978, ApJS, 36, 285
| name | mass [M⊙] | metallicity | f | network |
|---|---|---|---|---|
| M0p6.Z1m2.Hburn.bare | 0.639 | 0.01 | - | cno |
| M0p8.Z1m2.Hburn.bare | 0.856 | 0.01 | - | cno |
| M1p0.Z1m2.Hburn.bare | 1.025 | 0.01 | - | cno |
| M1p3.Z1m2.Hburn.bare | 1.316 | 0.01 | - | cno |
| M0p6.Z1m2.Hburn.cbm1 | 0.639 | 0.01 | 0.004 | nova |
| M0p8.Z1m2.Hburn.cbm1 | 0.856 | 0.01 | 0.004 | nova |
| M1p0.Z1m2.Hburn.cbm1 | 1.025 | 0.01 | 0.004 | nova |
| M1p3.Z1m2.Hburn.cbm1 | 1.316 | 0.01 | 0.004 | nova |
| M0p6.Z1m2.Hburn.cbm2 | 0.639 | 0.01 | 0.014 | nova |
| M0p8.Z1m2.Hburn.cbm2 | 0.856 | 0.01 | 0.014 | nova |
| M1p0.Z1m2.Hburn.cbm2 | 1.025 | 0.01 | 0.014 | nova |
| M1p3.Z1m2.Hburn.cbm2 | 1.316 | 0.01 | 0.014 | nova |
| name | mass [M⊙] | metallicity | f1 | TP MESA | TP MPPNP | Accretion rate (10-7 ) |
| M0p856.Z1m2 | 0.856 | 0.01 | 0.011 | 4 | 4 | 2.08 |
| M1p025.Z1m2 | 1.025 | 0.01 | 0.011 | 137 | 7 | 3.16 |
| M1p259.Z1m2 | 1.259 | 0.01 | 0.011 | 4 | 4 | 3.70 |
| M1p316.Z1m2 | 1.316 | 0.01 | 0.011 | 8 | 5 | 6.00 |
| M1p376.Z1m2 | 1.376 | 0.01 | 0.011 | 2 | 2 | 6.00 |
| TP | ||||||
| [] | [] | [] | [] | [] | [] | |
| M0p856.Z1m2 | ||||||
| 1 | 0.00E+00 | 8.58 | 0.8380 | 0.8608 | 0.861 | 0.855 |
| 2 | 2.60E+04 | 8.58 | 0.8368 | 0.8606 | 0.861 | 0.856 |
| 3 | 5.21E+04 | 8.59 | 0.8354 | 0.8609 | 0.861 | 0.855 |
| 4 | 8.02E+04 | 8.59 | 0.8351 | 0.8609 | 0.861 | 0.855 |
| M1p025.Z1m2 | ||||||
| 1 | 0.00E+00 | 8.65 | 1.0144 | 1.0265 | 1.026 | 1.024 |
| 2 | 5.53E+03 | 8.64 | 1.0149 | 1.0261 | 1.026 | 1.025 |
| 3 | 1.11E+04 | 8.64 | 1.0148 | 1.0262 | 1.026 | 1.025 |
| 4 | 1.68E+04 | 8.64 | 1.0145 | 1.0263 | 1.026 | 1.025 |
| 5 | 2.24E+04 | 8.64 | 1.0145 | 1.0264 | 1.026 | 1.025 |
| 6 | 2.81E+04 | 8.64 | 1.0144 | 1.0264 | 1.026 | 1.025 |
| 7 | 3.38E+04 | 8.64 | 1.0141 | 1.0265 | 1.026 | 1.025 |
| 136 | 7.88E+05 | 8.66 | 1.0155 | 1.0308 | 1.031 | 1.029 |
| 137 | 7.94E+05 | 8.66 | 1.0155 | 1.0309 | 1.031 | 1.029 |
| M1p259.Z1m2 | ||||||
| 1 | 0.00E+00 | 8.72 | 1.25914 | 1.25950 | 1.25951 | 1.25926 |
| 2 | 3.80E+02 | 8.69 | 1.25918 | 1.25941 | 1.25943 | 1.25928 |
| 3 | 7.40E+02 | 8.68 | 1.25921 | 1.25943 | 1.25944 | 1.25931 |
| 4 | 1.09E+03 | 8.68 | 1.25924 | 1.25945 | 1.25947 | 1.25933 |
| M1p316.Z1m2 | ||||||
| 1 | 0.00E+00 | 8.64 | 1.316007 | 1.316101 | 1.316103 | 1.316089 |
| 2 | 8.20E+01 | 8.61 | 1.316019 | 1.316130 | 1.316131 | 1.316117 |
| 3 | 1.58E+02 | 8.61 | 1.316037 | 1.316154 | 1.316156 | 1.316142 |
| 4 | 2.33E+02 | 8.61 | 1.316038 | 1.316179 | 1.316181 | 1.316167 |
| 5 | 3.10E+02 | 8.61 | 1.316039 | 1.316204 | 1.316206 | 1.316191 |
| 6 | 3.86E+02 | 8.61 | 1.316042 | 1.316229 | 1.316230 | 1.316216 |
| 7 | 4.62E+02 | 8.61 | 1.316100 | 1.316254 | 1.316255 | 1.316240 |
| 8 | 5.45E+02 | 8.61 | 1.316127 | 1.316279 | 1.316280 | 1.316265 |
| M1p376.Z1m2 | ||||||
| 1 | 0.00E+00 | 8.77 | 1.37616 | 1.37619 | 1.37619 | 1.37618 |
| 2 | 2.50E+01 | 8.73 | 1.37618 | 1.37620 | 1.37620 | - |
| TP: TP number. | ||||||
| : Time since first TP. | ||||||
| : Largest temperature (in logarithm) at the bottom of the flash-convective zone. | ||||||
| : Mass coordinate at the bottom of the He-flash convective zone. | ||||||
| : Mass coordinate at the top of the He-flash convective zone. | ||||||
| : Stellar mass at the TP. | ||||||
| : Stellar mass after the TP. | ||||||
| Specie | M0.856Z0.0100 | M1.025Z0.0100 | M1.259Z0.0100 | M1.316Z0.0100 | M1.376Z0.0100 |
| C 12 | 8.454E+01 | 1.099E+02 | 6.118E+01 | 1.070E+02 | 5.285E+01 |
| C 13 | 3.014E-09 | 4.838E-11 | 1.774E-09 | 4.897E-09 | 5.501E-09 |
| N 14 | 1.252E-05 | 3.665E-10 | 2.646E-13 | 8.528E-13 | 7.233E-14 |
| O 16 | 2.544E+00 | 3.342E+00 | 8.236E+00 | 2.035E+01 | 1.446E+00 |
| NE 20 | 8.191E-01 | 2.778E+00 | 2.037E+01 | 4.726E+01 | 5.008E+00 |
| NE 22 | 2.908E+01 | 2.150E+00 | 1.762E-07 | 2.872E-07 | 2.713E-08 |
| MG 24 | 1.807E-01 | 2.801E+00 | 1.013E+03 | 5.412E+02 | 5.649E+02 |
| MG 25 | 3.439E+01 | 6.383E+01 | 2.229E+02 | 1.955E+02 | 2.365E+02 |
| SI 28 | 8.315E-01 | 1.202E+00 | 3.518E+01 | 3.867E+00 | 5.637E+02 |
| S 32 | 2.639E-01 | 2.076E-01 | 4.903E-01 | 3.657E-01 | 6.946E+00 |
| CA 40 | 2.020E-01 | 1.382E-01 | 4.283E-01 | 2.728E-01 | 1.672E-01 |
| ZN 70 | 2.397E+01 | 7.556E+01 | 2.990E+01 | 5.392E+01 | 1.536E+02 |
| GE 72 | 2.298E+01 | 5.016E+01 | 1.084E+01 | 4.271E+01 | 4.420E+01 |
| GE 73 | 2.431E+01 | 5.463E+01 | 1.268E+01 | 4.837E+01 | 5.316E+01 |
| GE 74 | 2.557E+01 | 5.954E+01 | 1.400E+01 | 5.517E+01 | 4.316E+01 |
| GE 76 | 1.428E+01 | 5.715E+01 | 2.902E+01 | 5.466E+01 | 9.378E+01 |
| SE 82 | 9.012E+00 | 5.441E+01 | 5.978E+01 | 6.250E+01 | 1.836E+02 |
| KR 80 | 3.176E+00 | 1.367E+01 | 2.872E+01 | 7.853E+01 | 2.432E+01 |
| KR 82 | 2.797E+01 | 8.648E+01 | 4.002E+01 | 1.100E+02 | 7.674E+01 |
| KR 86 | 3.360E+01 | 1.717E+02 | 1.592E+02 | 3.667E+02 | 3.640E+02 |
| RB 85 | 2.044E+01 | 7.732E+01 | 2.142E+01 | 9.561E+01 | 7.747E+01 |
| RB 87 | 6.639E+01 | 3.126E+02 | 2.768E+02 | 7.389E+02 | 4.903E+02 |
| SR 88 | 5.568E+00 | 2.623E+01 | 3.594E+01 | 9.610E+01 | 7.792E+01 |
| Y 89 | 4.926E+00 | 2.563E+01 | 4.926E+01 | 1.093E+02 | 1.256E+02 |
| ZR 96 | 1.912E+01 | 1.410E+02 | 8.821E+02 | 1.782E+03 | 3.734E+03 |
| MO100 | 1.004E+00 | 6.555E+00 | 8.355E+01 | 1.045E+02 | 1.976E+02 |
| SB123 | 8.262E-01 | 2.020E+00 | 2.900E+01 | 9.487E+01 | 2.654E+02 |
| BA136 | 9.003E-01 | 1.224E+00 | 2.996E+01 | 1.333E+02 | 4.668E+02 |
| BA138 | 8.352E-01 | 7.401E-01 | 4.807E+00 | 2.327E+02 | 6.383E+02 |
| HG204 | 3.557E+00 | 3.709E+00 | 2.170E+00 | 1.216E+03 | 2.809E+03 |
| PB208 | 1.041E+00 | 1.349E+00 | 7.924E-01 | 1.081E+04 | 1.107E+04 |
| BI209 | 7.343E-01 | 9.915E-01 | 7.004E-01 | 1.141E+04 | 1.157E+04 |
| Specie | X/X⊙ Pre-explosive | X/X⊙ Post-explosive |
| SE 74 | 1.240E-02 | 9.418E+01 |
| KR 78 | 8.860E-03 | 6.279E+01 |
| SR 84 | 9.325E-03 | 1.256E+02 |
| MO 92 | 2.560E-01 | 8.790E+01 |
| MO 94 | 9.970E-01 | 9.417E+01 |
| RU 96 | 5.250E-02 | 1.005E+02 |
| RU 98 | 4.967E-01 | 2.511E+02 |
| PD102 | 9.394E-03 | 1.256E+03 |
| CD106 | 1.792E-02 | 1.570E+03 |
| CD108 | 6.273E+00 | 7.533E+02 |
| SN112 | 3.995E-02 | 1.569E+03 |
| SN114 | 1.555E+00 | 1.256E+03 |
| TE120 | 2.696E-03 | 1.255E+03 |
| XE124 | 1.216E-03 | 5.023E+03 |
| XE126 | 2.353E-02 | 5.651E+03 |
| BA130 | 7.751E-04 | 2.198E+03 |
| BA132 | 1.554E-02 | 1.884E+03 |
| LA138 | 8.211E-03 | 3.704E+00 |
| CE136 | 1.612E-02 | 1.450E+03 |
| CE138 | 1.212E-01 | 1.689E+03 |
| SM144 | 1.980E-01 | 3.704E+03 |
| DY156 | 1.976E-04 | 2.574E+03 |
| DY158 | 1.431E-01 | 1.249E+03 |
| ER162 | 1.810E-04 | 2.511E+03 |
| YB168 | 2.509E-04 | 6.907E+03 |
| HF174 | 3.189E-04 | 6.279E+03 |
| W 180 | 2.598E+00 | 1.256E+04 |
| OS184 | 1.310E-03 | 5.023E+03 |
| PT190 | 2.682E-03 | 2.198E+03 |
| HG196 | 5.216E-02 | 7.848E+03 |
