Detecting Relevance during Decision-Making from Eye Movements for UI Adaptation
Abstract.
This paper proposes an approach to detect information relevance during decision-making from eye movements in order to enable user interface adaptation. This is a challenging task because gaze behavior varies greatly across individual users and tasks and ground-truth data is difficult to obtain. Thus, prior work has mostly focused on simpler target-search tasks or on establishing general interest, where gaze behavior is less complex. From the literature, we identify six metrics that capture different aspects of the gaze behavior during decision-making and combine them in a voting scheme. We empirically show, that this accounts for the large variations in gaze behavior and out-performs standalone metrics. Importantly, it offers an intuitive way to control the amount of detected information, which is crucial for different UI adaptation schemes to succeed. We show the applicability of our approach by developing a room-search application that changes the visual saliency of content detected as relevant. In an empirical study, we show that it detects up to 97% of relevant elements with respect to user self-reporting, which allows us to meaningfully adapt the interface, as confirmed by participants. Our approach is fast, does not need any explicit user input and can be applied independent of task and user.
1. Introduction
Many decisions we make throughout the day are based on the information provided by a user interface (UI). For example, deciding which house appliance to order online, which job to apply for, or selecting a location for a hike. Designing UIs that support decision-making can be difficult. Showing all information might not be useful due to device constraints [Kajan et al., 2016] or to avoid information overload [Hwang and Lin, 1999]. Showing the right information is crucial for the decision quality [Papismedov and Fink, 2019], but identifying it can be hard since users perceive the relevance of information differently (e.g. [Orquin and Loose, 2013]), an aspect that cannot be foreseen at design time. Thus there arises a need for adaptive UIs that understand which parts are relevant for a user, ideally without having to interrupt them.
In this paper, we propose an eye-tracking based approach to detect the relevance of displayed information while a user is making a decision. We demonstrate that it can be flexibly used for different UI adaptation schemes (such as the emphasis or suppression of relevant or irrelevant information) across different application domains without requiring any explicit user input. While directly asking the user is a good way to understand which part of a UI is relevant to them, this compromises user experience and can be unreliable [Aribarg et al., 2010; Lieberman et al., 2001]. Eye tracking has proven to be an objective measure for a person’s attention during visual search [Duchowski, 2002; Salojärvi et al., 2005]. However, gaze behavior during decision-making is even more user- and context-dependent [Orquin and Loose, 2013]. For instance, it can vary drastically across users who employ different decision strategies (see [Orquin and Loose, 2013; Gigerenzer and Gaissmaier, 2011; Payne et al., 1992; Simon, 1957]), but also for the same user as they transitions from obtaining an overview of the UI to comparing relevant information to finally validating their decision [Gidlöf et al., 2013; Russo and Leclerc, 1994]. This makes detecting information relevance during decision-making a challenging task and prior work mostly considers simpler visual search tasks.
The goodness of a relevance detector highly depends on the UI adaptation scheme it is applied to. In particular, it is important to minimize the risk of usability issues due to incorrect adaptations [Findlater and Gajos, 2009]. For example, wrongly highlighting irrelevant elements in a menu can induce a performance cost [Findlater et al., 2009]. In such a case, a successful relevance detector should minimize false positives (content wrongly predicted as relevant). On the other hand, when removing irrelevant elements, we need to prioritize the maximization of true positives (content correctly identified as relevant) to not hide any relevant information. Ultimately, a good relevance detector should not reduce usability or induce any cognitive dissonance between the adapted UI, and what the user expects to see.
Embracing these requirements, we propose an approach to detect information relevance during decision-making from user eye movements. We build on prior work that showed the efficacy of simple gaze metrics (e.g. fixation duration and overall dwell time) in inferring covert attention (the mental focus of a person) from user gaze behavior [Kajan et al., 2016; Faro et al., 2010; Alt et al., 2012]. We select six well-established gaze metrics that capture different aspects of the gaze behavior during decision-making and can thus account for variations in decision strategies across users. Each metric can be seen as a weak relevance detector which makes a binary decision on whether an element is relevant or not. These decisions are considered as individual votes which are summed and thresholded to yield a final decision. This is motivated by the machine learning literature on multiple classifier systems [Polikar, 2006] and, loosely speaking, has similarity to ensemble methods.
Through varying the threshold of votes we obtain a set of recognizers that trade-off true positives and false positives in different ways. This allows us to easily choose the right recognizer for a specific UI adaptation scheme. We validate this on a pilot dataset of stock-trading decisions and choose two thresholds that yield different trade-offs. We develop a proof-of-concept application of a realistic apartment share website and apply the resulting recognizers to visually highlight relevant information or fade out irrelevant ones, based on the gaze data of user deciding whether they should apply for a room. In an empirical study with 19 participants, all but one stated that the adaptation correctly highlighted relevant information and faded the irrelevant ones, without experiencing any usability issues. We find that the two applied voting schemes correctly recognize 97% and 80% of elements reported as relevant by participants, at a false positive rate of 42% and 17% respectively.
In summary, we propose an unobtrusive approach to detect information relevance from eye movements during decision-making. It combines six gaze metrics in a voting scheme which captures the different gaze characteristics during decision-making. Varying the number of votes yields different recognizers that are effective in emphasizing or suppressing information in an adaptive UI. Our method is simple to understand and can be easily implemented, for which we will provide an open-source implementation.
2. Background & Related Work
To detect the relevance of information or infer user’s interest or intent, researchers have explored the use of implicit feedback mechanisms, such as mouse and keyboard interactions [Jayarathna et al., 2015; Kelly and Belkin, 2001]. In this line of work, eye tracking has proven to be an unobtrusive and objective measure for a person’s attention [Duchowski, 2002; Salojärvi et al., 2005] and was suggested to be more reliable than feedback from mouse movements, clicks, or scrolling [Buscher et al., 2012b; Kelly and Teevan, 2003; Navalpakkam et al., 2013]. However, it is a major challenge to infer covert attention (i.e. the mental focus of a person) from eye movements and relate it to the relevance of the displayed information. One reason is that eye gaze is not always strategically controlled but also stimulus-driven [Borji and Itti, 2013], i.e. attracted by visually salient features of a UI. Therefore, researchers have proposed various gaze metrics to aggregate the noisy eye movements and analyze the underlying cognitive processes (e.g. see [Jacob and Karn, 2003] for an overview). In particular, the sum of fixations (the number of times the user focuses an area of interest (AOI)) and the overall dwell time (time spent looking at an AOI) have been successfully used to infer users’ interest. However, most of the prior work focused on well-defined tasks, such as visual target-search, where the ground truth is well-defined (e.g. [Aula et al., 2005; Dumais et al., 2010; Gwizdka, 2014; Kajan et al., 2016; Salojärvi et al., 2003]). Only few researchers have considered more unconstrained settings where ground truth labels are not available, mostly to establish general interest in displayed information [Alt et al., 2012; Nguyen and Liu, 2016; Qvarfordt and Zhai, 2005]. These combine few well-established gaze metrics but are highly tuned to their specific applications.
This paper is one of few that tackles the more complex task of analyzing gaze behavior during decision-making. In the following, we give a brief introduction to the decision-making literature that informed our approach and review prior work that used eye movements to adapt a UI.
2.1. Gaze behavior during decision-making
Decision-making is a complex cognitive process, during which eye movements play an important role in order to retrieve displayed information, e.g. to encode and process it for the first time or to update a person’s working-memory [Orquin and Loose, 2013]. However, the relevance of information varies even during the decision process of an individual. We refer to Orquin and Loose [2013] for an extensive review of eye movements during decision-making and here summarize the phenomena fundamental to our work.
2.1.1. Decision strategies
The theory of bounded rationality suggests that people prioritize information according to their individual decision strategy or heuristics [Simon, 1957], as a consequence of their cognitive capacity limitations (for a review see e.g. [Gigerenzer and Gaissmaier, 2011; Orquin and Loose, 2013]). Accordingly, gaze behavior varies according to a person’s decision strategy. At the same time, learning influences the eye movements, in that repeated exposure to the same decision decreases the time it takes to fixate relevant elements, while the duration of fixations increases [Jovancevic-Misic and Hayhoe, 2009]. Characteristic for the gaze behavior during decision-making, are strategic just-in-time return-fixations on relevant information in order to reduce the working-memory load. The specific trade-off between retrieving information through fixations or from working memory varies across users and tasks [Droll and Hayhoe, 2007]. Our selection of gaze metrics is motivated by these findings.
2.1.2. Cognitive stages during decision-making
Several researchers have argued that the decision-making process can be separated into three cognitive stages which are characterized by different eye movements [Gidlöf et al., 2013; Russo and Leclerc, 1994]. Following Russo and Leclerc [1994], we refer to them as (1) Orientation, (2) Evaluation, and (3) Verification. In the orientation stage the user obtains an overview of the available options or information. It is characterized by a scanning pattern with a series of shorter fixations without any return-fixations on already encoded information. During the evaluation stage, the user compares the information determined as relevant during orientation, which is marked by many return-fixations. The final verification stage again uses short fixations on the most relevant information to validate the decision (see [Orquin and Loose, 2013]). An exact separation of these stages based on changes in gaze behavior is difficult and disputed in the literature [Gidlöf et al., 2013; Russo and Leclerc, 1994]. However, we can use them as a theoretical motivation for choosing gaze metrics that each capture a different aspect of the decision process in order to obtain a more holistic view of a person’s gaze behavior than overall dwell time or number of fixations alone could provide.
| Orientation | |||
|---|---|---|---|
| TFF | Time to First Fixation | The time elapsed between the presentation of a stimulus and the first time that gaze enters a given AOI. A low TFF value indicates high relevance. | [Byrne et al., 1999; Gegenfurtner et al., 2011]. |
| FPG | First Pass Gaze | The sum of duration of fixations on an AOI during the first pass, i.e. when the gaze first enters and leaves the AOI. A high FPG value indicates high relevance. | [Henderson and Hollingworth, 1998; Salojärvi et al., 2005] |
| Evaluation | |||
| SPG | Second Pass Gaze | The sum of duration of fixations on an AOI during the second pass. A high SPG value indicates high relevance. | [Henderson and Hollingworth, 1998] |
| RFX | Refixations Count | The number of times an AOI is revisited after it is first looked at. A high RFX value indicates high relevance. | [Kajan et al., 2016; Klami, 2010; Nguyen and Liu, 2016; Salojärvi et al., 2005] |
| Verification | |||
| SFX | Sum of Fixations | The total number of fixations within an AOI. A high SFX value indicates high relevance. | [Balatsoukas and Ruthven, 2012; Kajan et al., 2016; Klami, 2010] |
| ODT | Overall Dwell Time | The total time spent looking at an AOI including fixations and saccades. A high ODT value indicates high relevance. | [Alt et al., 2012; Bednarik et al., 2012; Nguyen and Liu, 2016] |
2.2. UI adaptation from gaze behavior
Eye gaze has been recognized as an unobtrusive feedback channel that provides rich information about a user’s attention [Qvarfordt and Zhai, 2005]. This opened opportunities for adaptive user interfaces. A large body of work has focused on enhancing the query-based search of images [Faro et al., 2010; Klami et al., 2008; Klami, 2010] or text-documents [Aula et al., 2005; Buscher et al., 2008; Dumais et al., 2010; Bhattacharya et al., 2020]. There, information about eye gaze provides feedback on the relevance of the displayed search results or text documents. Similarly, advertisements on a website were adapted based on relevance inferred from overall dwell time [Alt et al., 2012]. Several works have analyzed the gaze behavior while exploring a map [Krejtz et al., 2017], for example to adapt complex legends to only show relevant items [Göbel et al., 2018], to highlight important points of interest to facilitate planning [Göbel and Kiefer, 2019], or to follow-up on user’s interests [Qvarfordt and Zhai, 2005]. Other systems extract relevant information to compile a summary for later use [Buscher et al., 2012a; Nguyen and Liu, 2016]. UI adaptation based on user’s cognitive load or context has recently been shown for mixed-reality settings [Gebhardt et al., 2019; Lindlbauer et al., 2019] where the design of a good UI can be difficult as the user’s context frequently changes, similar to other applications of ubiquitous computing [Dourish, 2004].
Most of these work detect relevance by using well-established gaze metrics often in a way that is highly tuned to their specific application. The most related work to ours is Gebhardt et al. [2019], where they detect relevance during purchasing decisions in an unsupervised fashion using a reinforcement learning approach. Their method is highly task specific and requires retraining for each new task. In the following, we show that our relevance detector is successful across the very different decision tasks of financial trading and room search, and works without any prior training.
3. Successful relevance detection for adapting a User Interface
The goal of our work is to detect the relevance of information displayed by a user interface (i.e. of UI elements) in order to enable adaptation of the UI. The adaptation techniques considered here can, broadly speaking, be divided into two types. They either
-
(1)
emphasize relevant content, e.g. through coloring, rearranging, or replicating UI elements; or
- (2)
Correspondingly, a successful recognizer in the first case identifies a subset of relevant UI elements (true positives), whereas in the second, we are interested in identifying non-relevant ones (true negatives). At the same time, it is important to consider the consequences of misrecognitions: if incorrect adaptations lead to usability issues or high interaction costs, the adaptive interface is not successful [Findlater and Gajos, 2009].
In the first case, emphasizing content that is not considered as relevant by the user (false positives) could result in cognitive dissonance. For example, highlighting irrelevant information through coloring deflects attention and makes it harder for the user to focus on relevant content. In contrast, failing to emphasize an element regarded as relevant by the user (false negatives) has a comparably low cost, since its appearance does not change in comparison to the non-adapted version. As a result, a successful recognizer for emphasizing information should achieve a low false positive rate.
In the second case of suppressing less relevant information, an incorrect adaptation can hide information that is regarded as relevant (false negatives). This can lead to high interaction costs in order to recover such information, if even possible. In contrast, failing to hide an element because it is wrongly recognized as relevant (false positives) does not change the user interface in comparison to a non-adapted version. As a result, a successful recognizer for suppressing information should achieve a high true positive rate.
In conclusion, depending on the adaptation scheme, emphasizing or suppressing information, a recognizer has to trade-off true positives and false positives differently. In the following we present our voting scheme and show that it allows us to flexibly choose a good trade-off by simply adjusting the number of votes required to recognize a UI element as relevant.
4. Method
As discussed above, gaze behavior during decision-making varies significantly across people depending on their decision strategy. At the same time, the eye movements of a single user vary as she goes through different stages of decision-making (orientation, evaluation, an verification). As a consequence, often-used gaze metrics, such as overall dwell time or number of fixations alone cannot suffice to capture the relevance of each UI element, hereafter called area of interest (AOI). For example, when comparing two AOIs during the evaluation phase, the gaze frequently returns to the same AOI albeit for a short amount of time. The refixation count is a good indicator of its relevance, which would not be captured by the overall dwell time. To account for these variations, we select six well-established gaze metrics from the literature (see Table 1) that are able to capture the relevance of elements from the different gaze characteristics at each decision-making phase. We propose to combine them in a voting scheme with which one can flexibly trade-off true positives and false positives by changing the minimum number of metrics required to indicate relevance of the AOI. This is shown based on a pilot dataset of stock investment decisions.
4.1. Gaze metrics
Table 1 shows the six gaze metrics we selected to capture different characteristics of the gaze behavior associated with the three stages of decision-making. It includes metrics that capture the relevance of AOIs for establishing an initial overview of available information; metrics that capture the in-depth analysis of relevant information; and metrics that summarize the overall attention given to an AOI.
4.2. Voting approach
Our proposed voting scheme considers each metric as informing a single-expert-classifier. For instance, by comparing ODT values across AOIs in an interface, we can determine if the value of a specific AOI is comparably high, indicating its relevance. By allowing multiple metrics to vote on an AOI’s relevance, we imitate a multiple-classifier system while avoiding the need for training data.
We say that a metric casts a vote for a given AOI as being relevant, if its standard score (z-score) for the AOI is positive. Intuitively, this means that for the given AOI, the gaze characteristic captured by the metric deviates from the average across all AOIs. Note, that in the case of TFF, a negative z-score indicates relevance (shorter time to first fixation). The z-score is computed per stimuli (i.e. for each decision made with a UI). If gaze data of several stimuli is available, the z-scores are averaged before a vote is cast. To finally detect the relevance of an AOI, we count the number of votes cast by the metrics and compare it to a threshold. Requiring a higher number of votes would yield a lower number of AOIs being classified as relevant. In the next section, we exhaustively analyze the effect of this threshold on the true and false positive rate of the voting scheme based on a pilot dataset of financial trading decisions.
In contrast to prior work, our voting approach requires no ground-truth data from a target person in order to tune thresholds for combining different metrics [Kozma et al., 2009; Klami, 2010]. Moreover, it assumes no fixed number of relevant AOIs [Kozma et al., 2009; Klami, 2010] but can flexibly select a varying number of AOIs.
4.3. Effect of vote threshold
We collected a pilot dataset of gaze behavior during decision-making. This allowed us to analyze the performance of our voting approach and explore the effect of varying the number of metrics required to cast a vote in order for an AOI to be detected as relevant.
15 participants (13 male, 2 female) were shown a financial trading interface with information about a specific stock. Due to technical problems we excluded three participants. All of the remaining 12 participants had practical experience in stock trading (3 professionally employed, 9 students related fields). For each participant, we recorded the eye gaze using a Tobii Pro Spectrum with a frequency of 150 Hz. Information about the stock was organized within 12 AOIs. We based the interface design on existing trading interfaces and interviews we conducted with financial traders at a local branch of a global investment bank (see Figure A in Appendix). Participants were asked to explore the data and state whether they would invest in the stock. After announcing their decision, we gave them a printout of the application and asked them to circle the parts of the interface (AOIs) they found to be most relevant to their task.
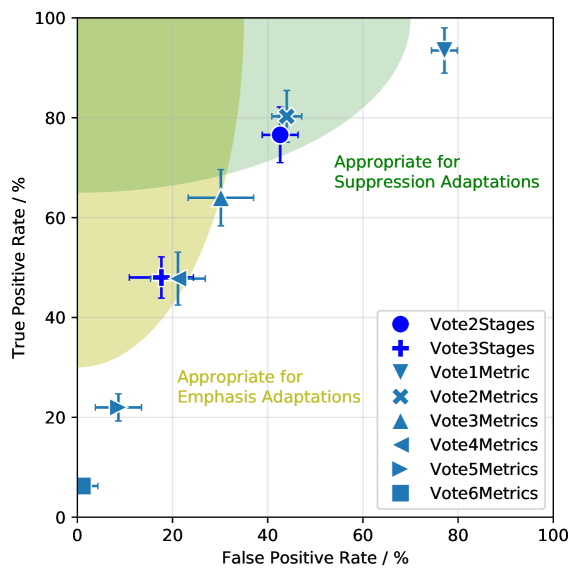
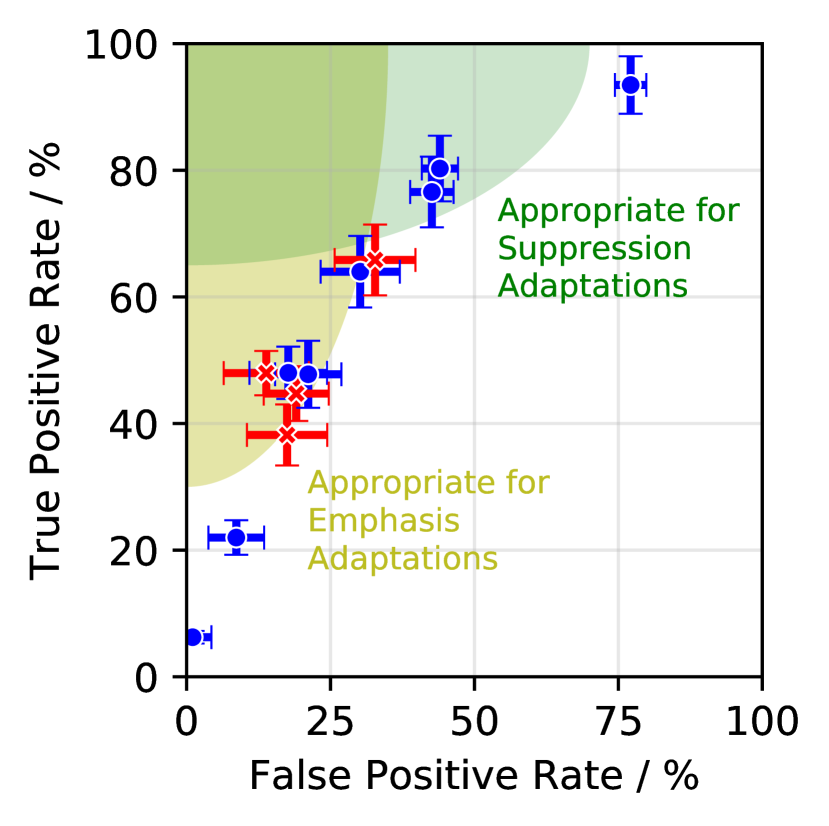
For each AOI, we established if a vote was cast by any of the six gaze metrics. Considering the self-reports as ground truth labels, we can evaluate the performance of our voting approach and explore the effect of different voting thresholds. In order to determine the relevance of an AOI, we can require a minimum of – gaze metrics to cast a vote. We can be more selective by considering votes from metrics associated to the same stage as redundant and require votes to come from metrics of or all stages. Figure 1 shows a clear trade-off between the true positive rate (relevant AOIs correctly detected) and the false positive rate (irrelevant AOIs detected as relevant) depending on the number of required votes. Shaded areas mark a true and false positive rate that seem acceptable when emphasizing or suppressing information.
We conclude that a good trade-off for emphasizing relevant information is achieved when requiring a minimum of votes each from a different stage (hereafter called Vote3Stages). Here, this yields a low false positive rate (18%) reducing the risk to induce cognitive dissonance by emphasizing irrelevant information, while still detecting 48% of relevant elements. In the case of suppressing irrelevant information, a threshold of votes (hereafter called Vote2Metrics) yields a high true positive rate (80%), reducing the risk of suppressing relevant information which would result in a higher interaction cost. The false positive rate of 44% is acceptable, given that this is achieved after observing only one decision and without any explicit user input.
5. Application to UI adaptation
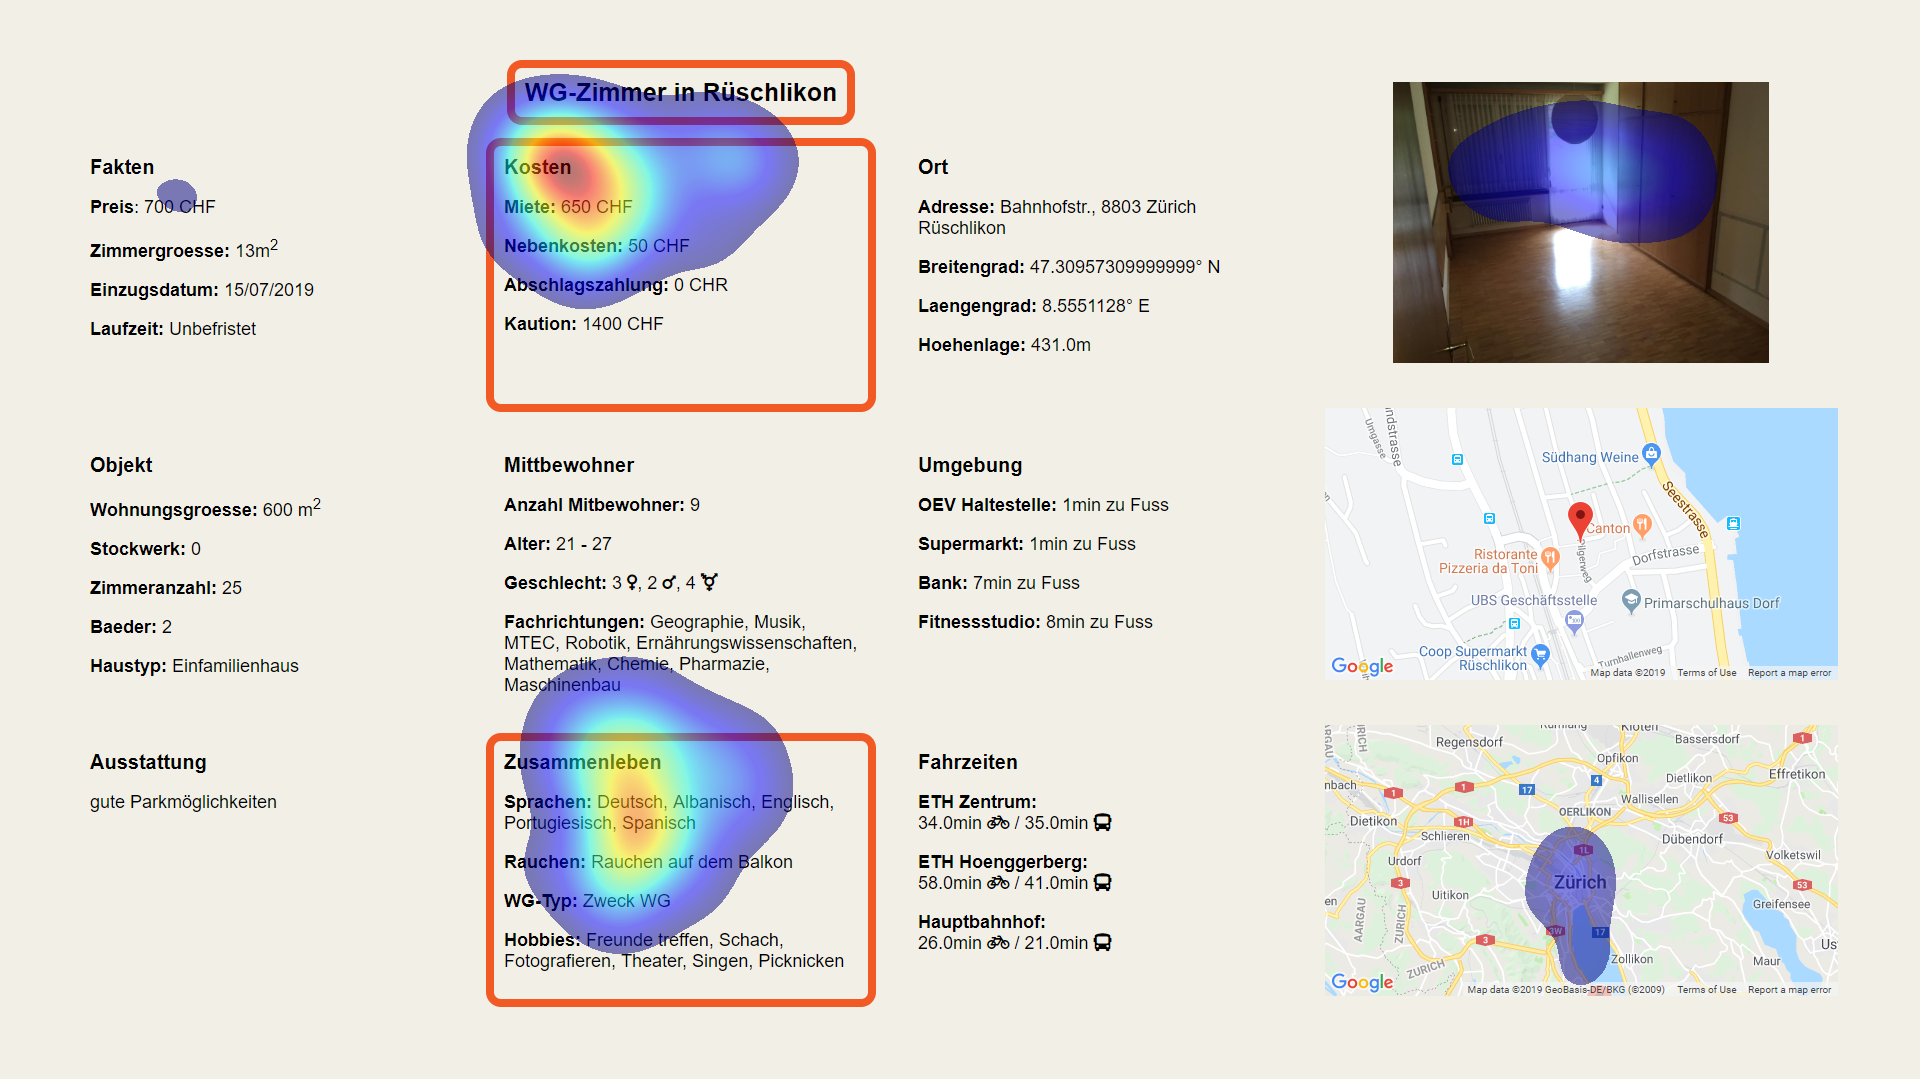
We developed a proof-of-concept application that visually adapts the interface using the Vote2Metrics and Vote3Stages recognizers. We chose a more commonly encountered scenario where users are faced with a decision whether to apply for an advertised apartment. This allows for natural and diverse personal preferences to exist. Indeed, a brief survey among university students indicated that while most found information such as price, location, and contract duration to be highly important, the relevance of information on potential cohabitants, amenities, or nearby landmarks varied.
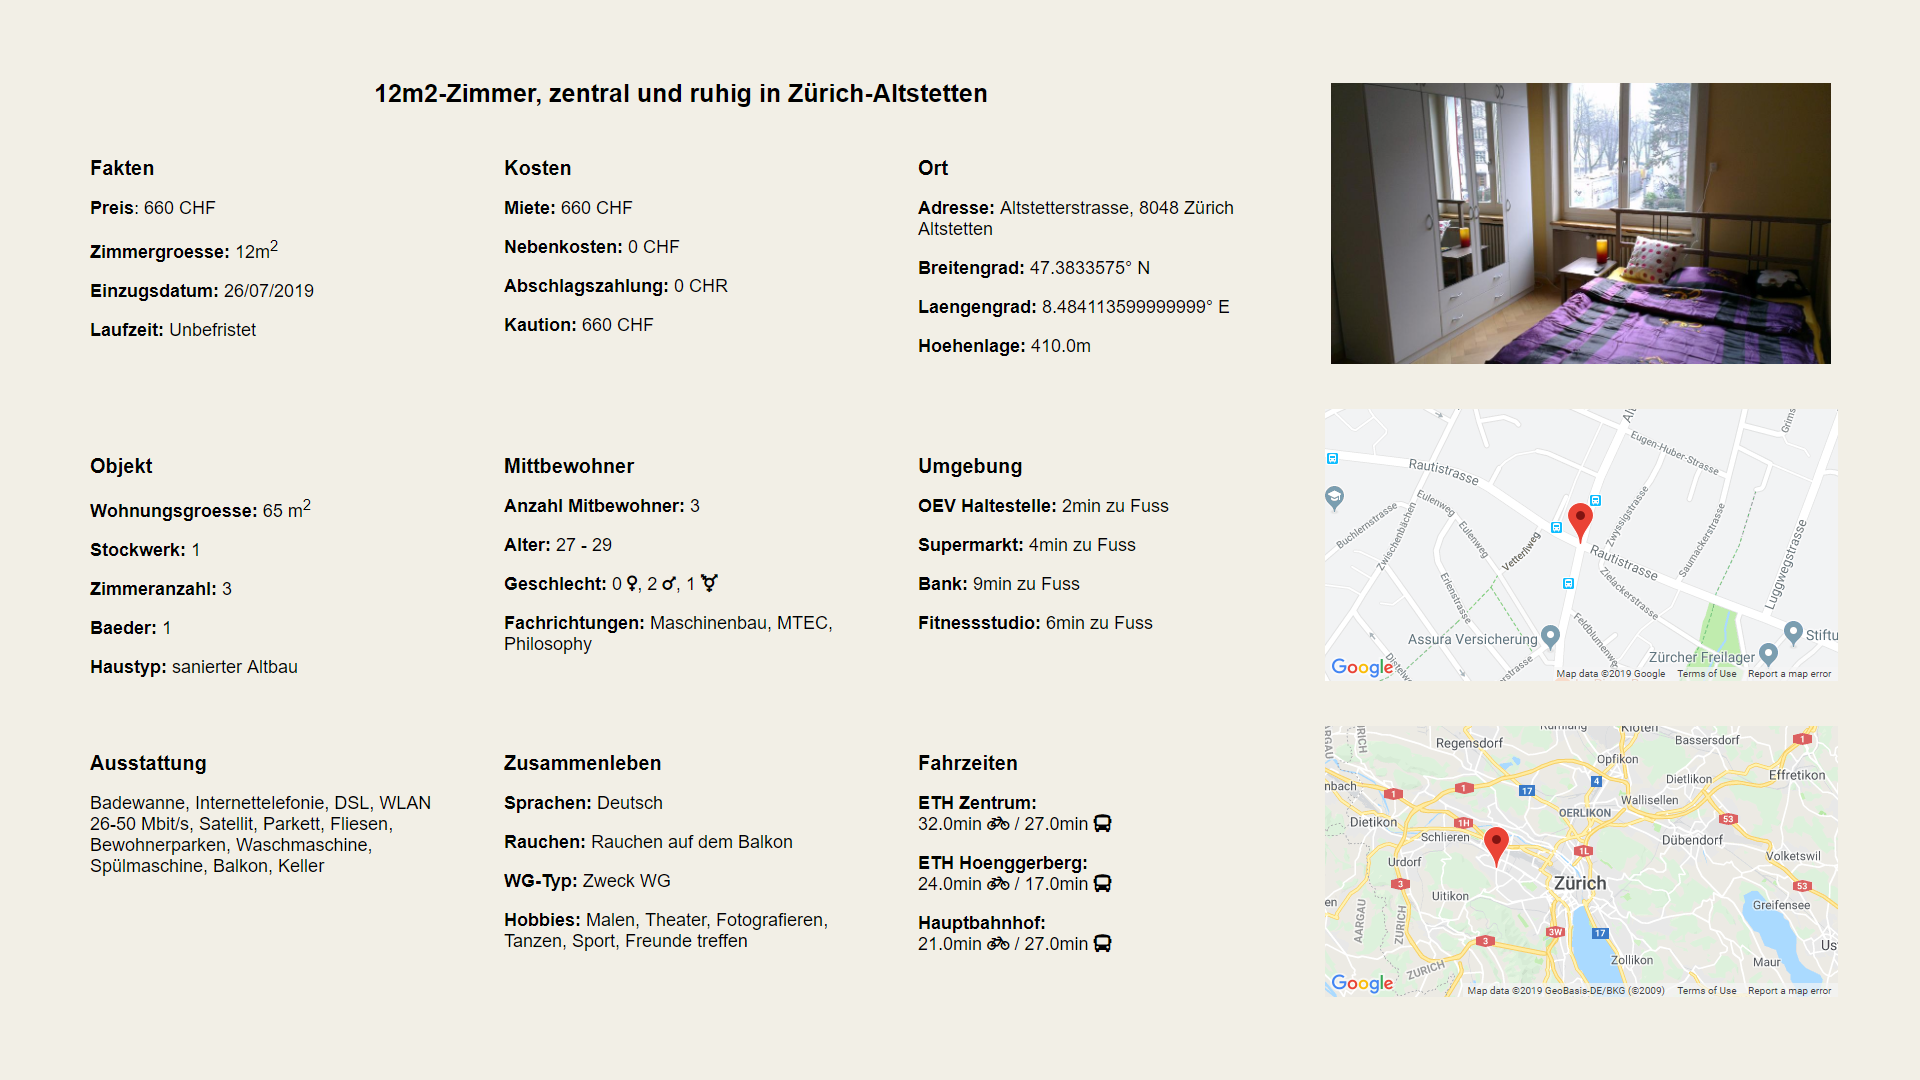
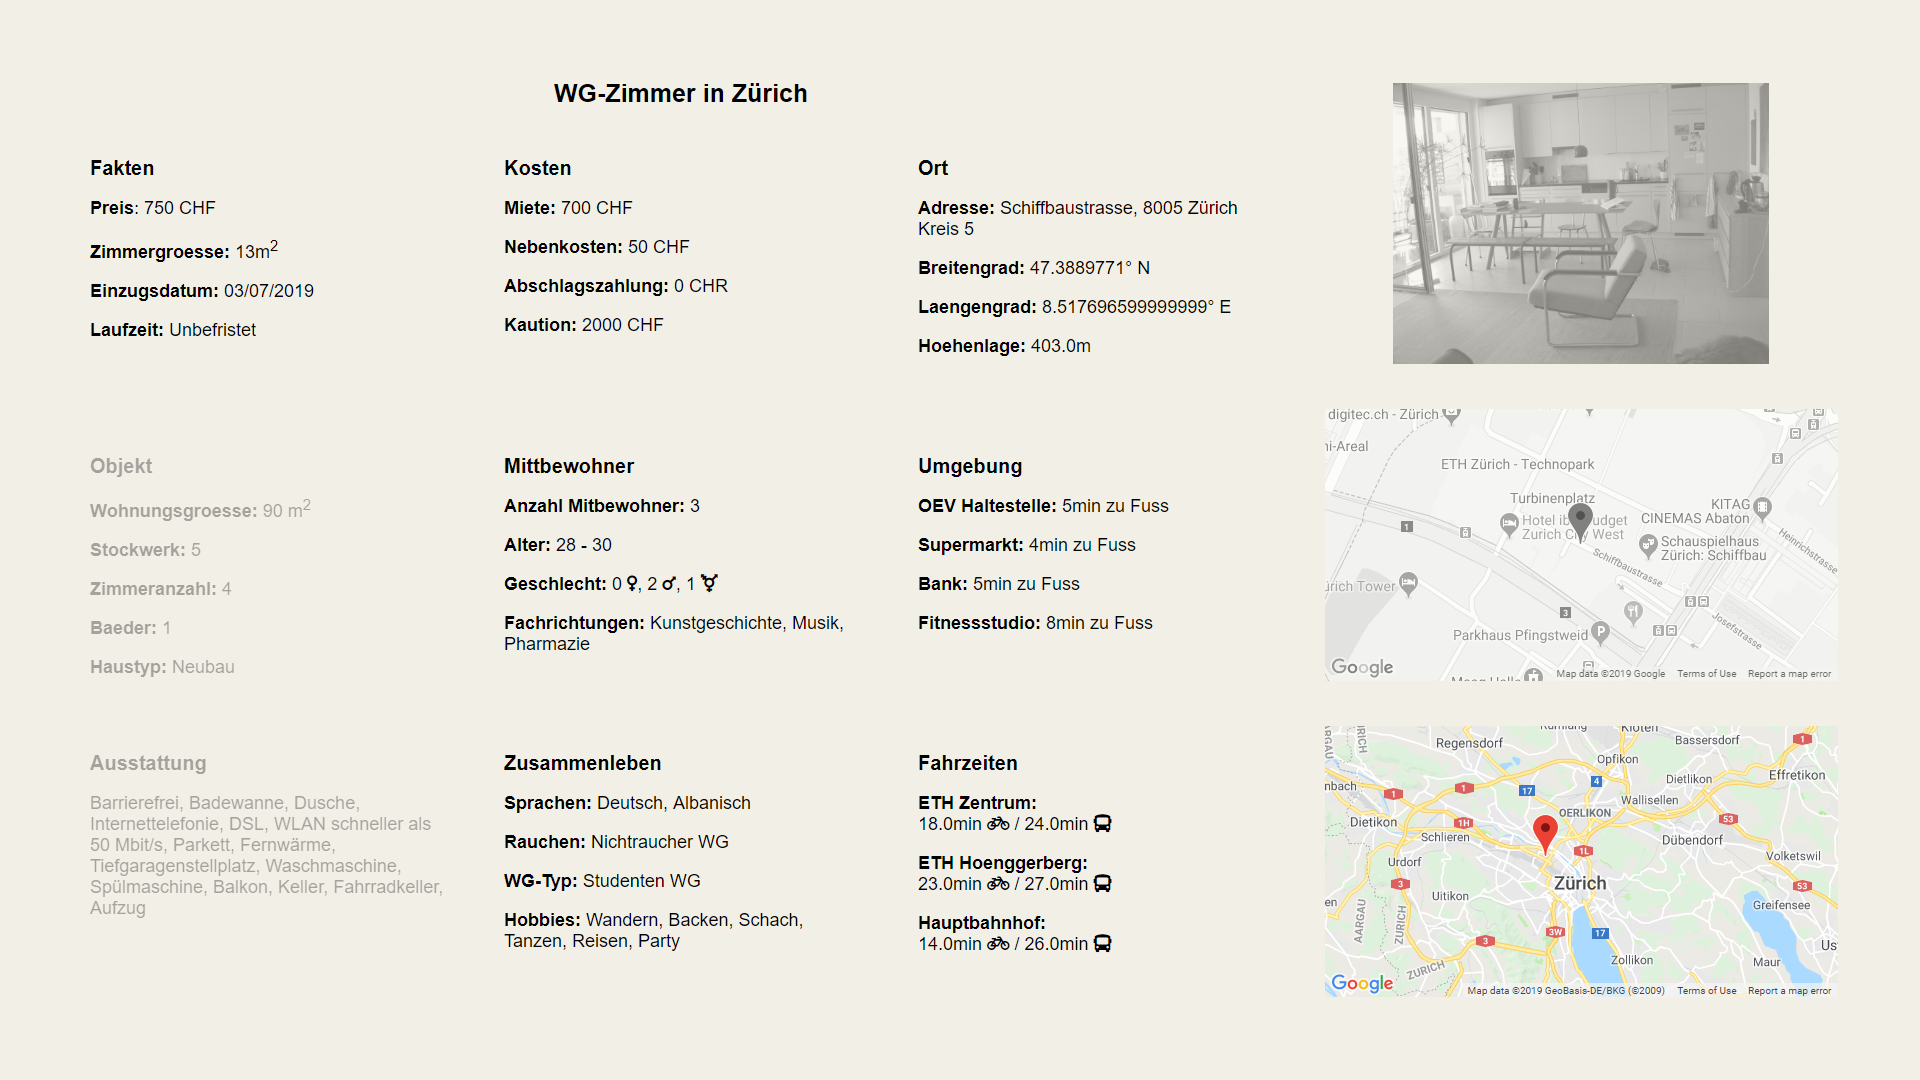
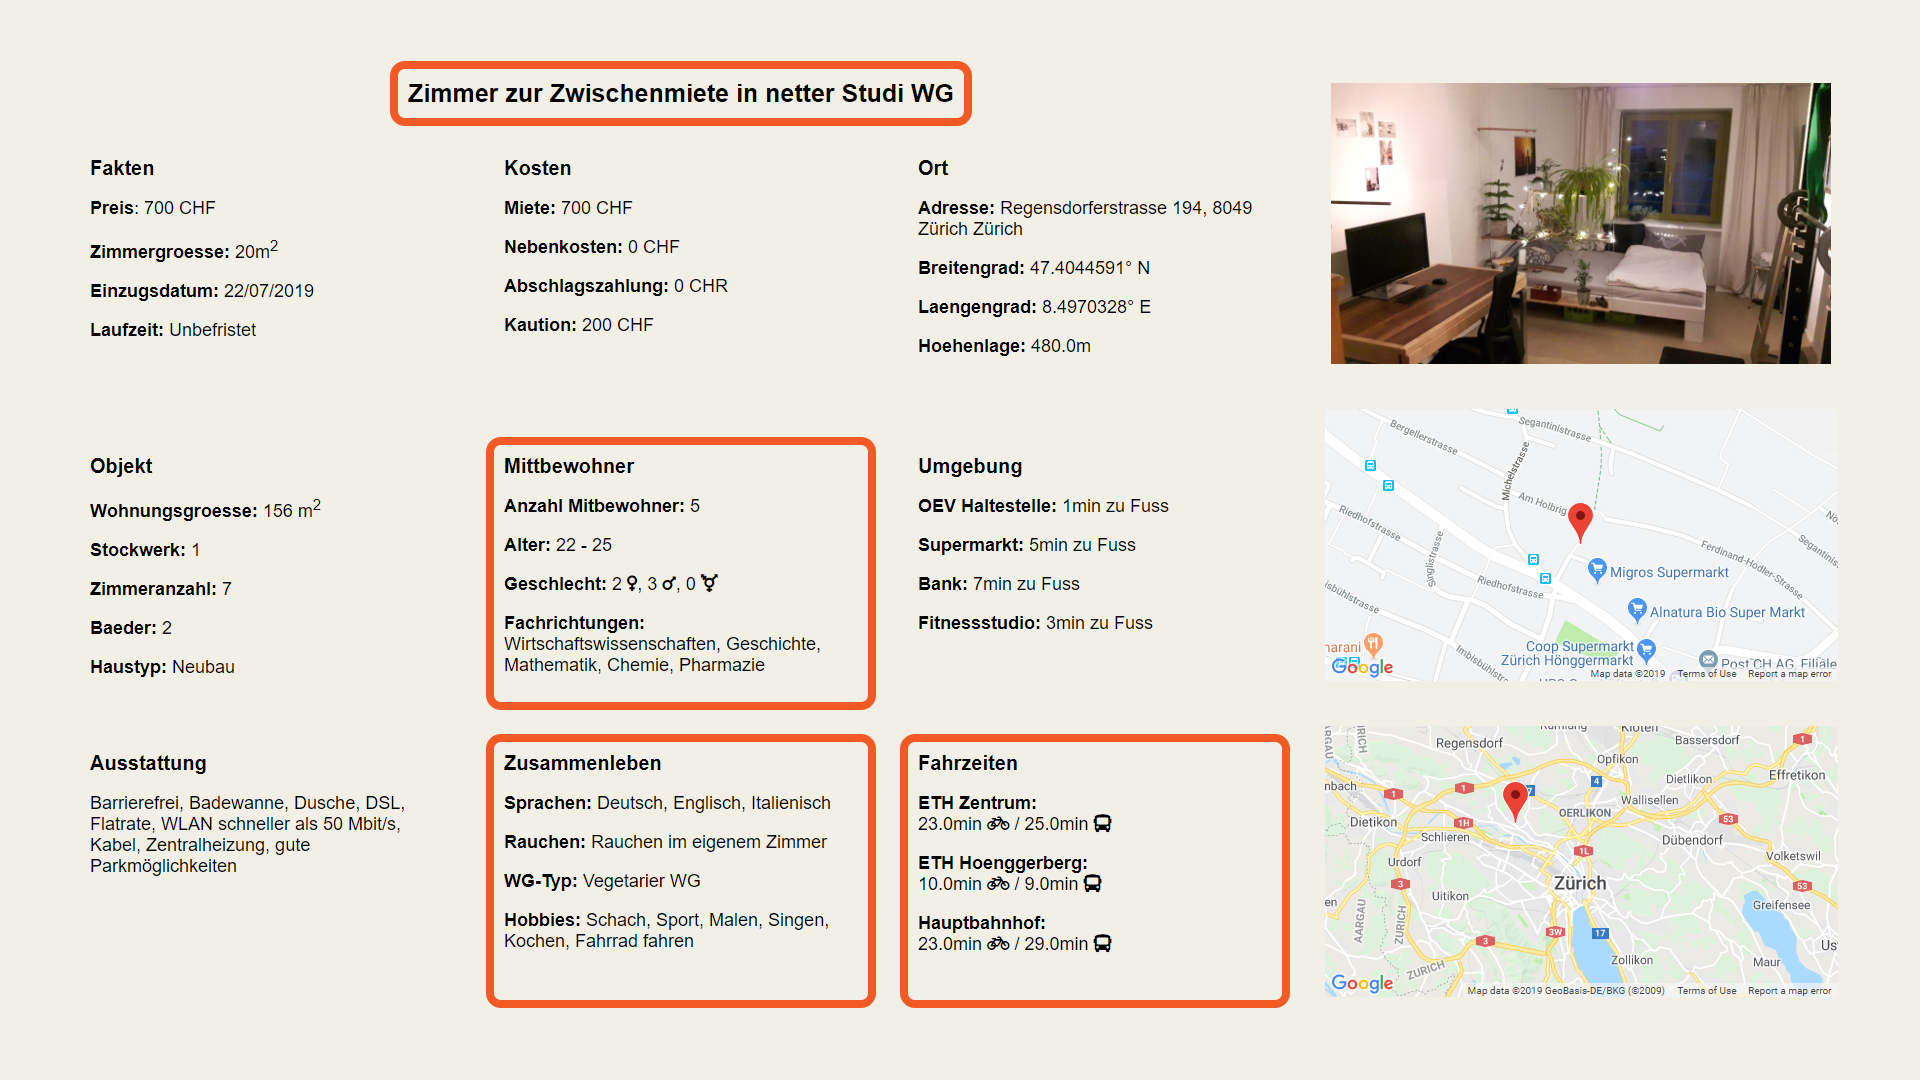
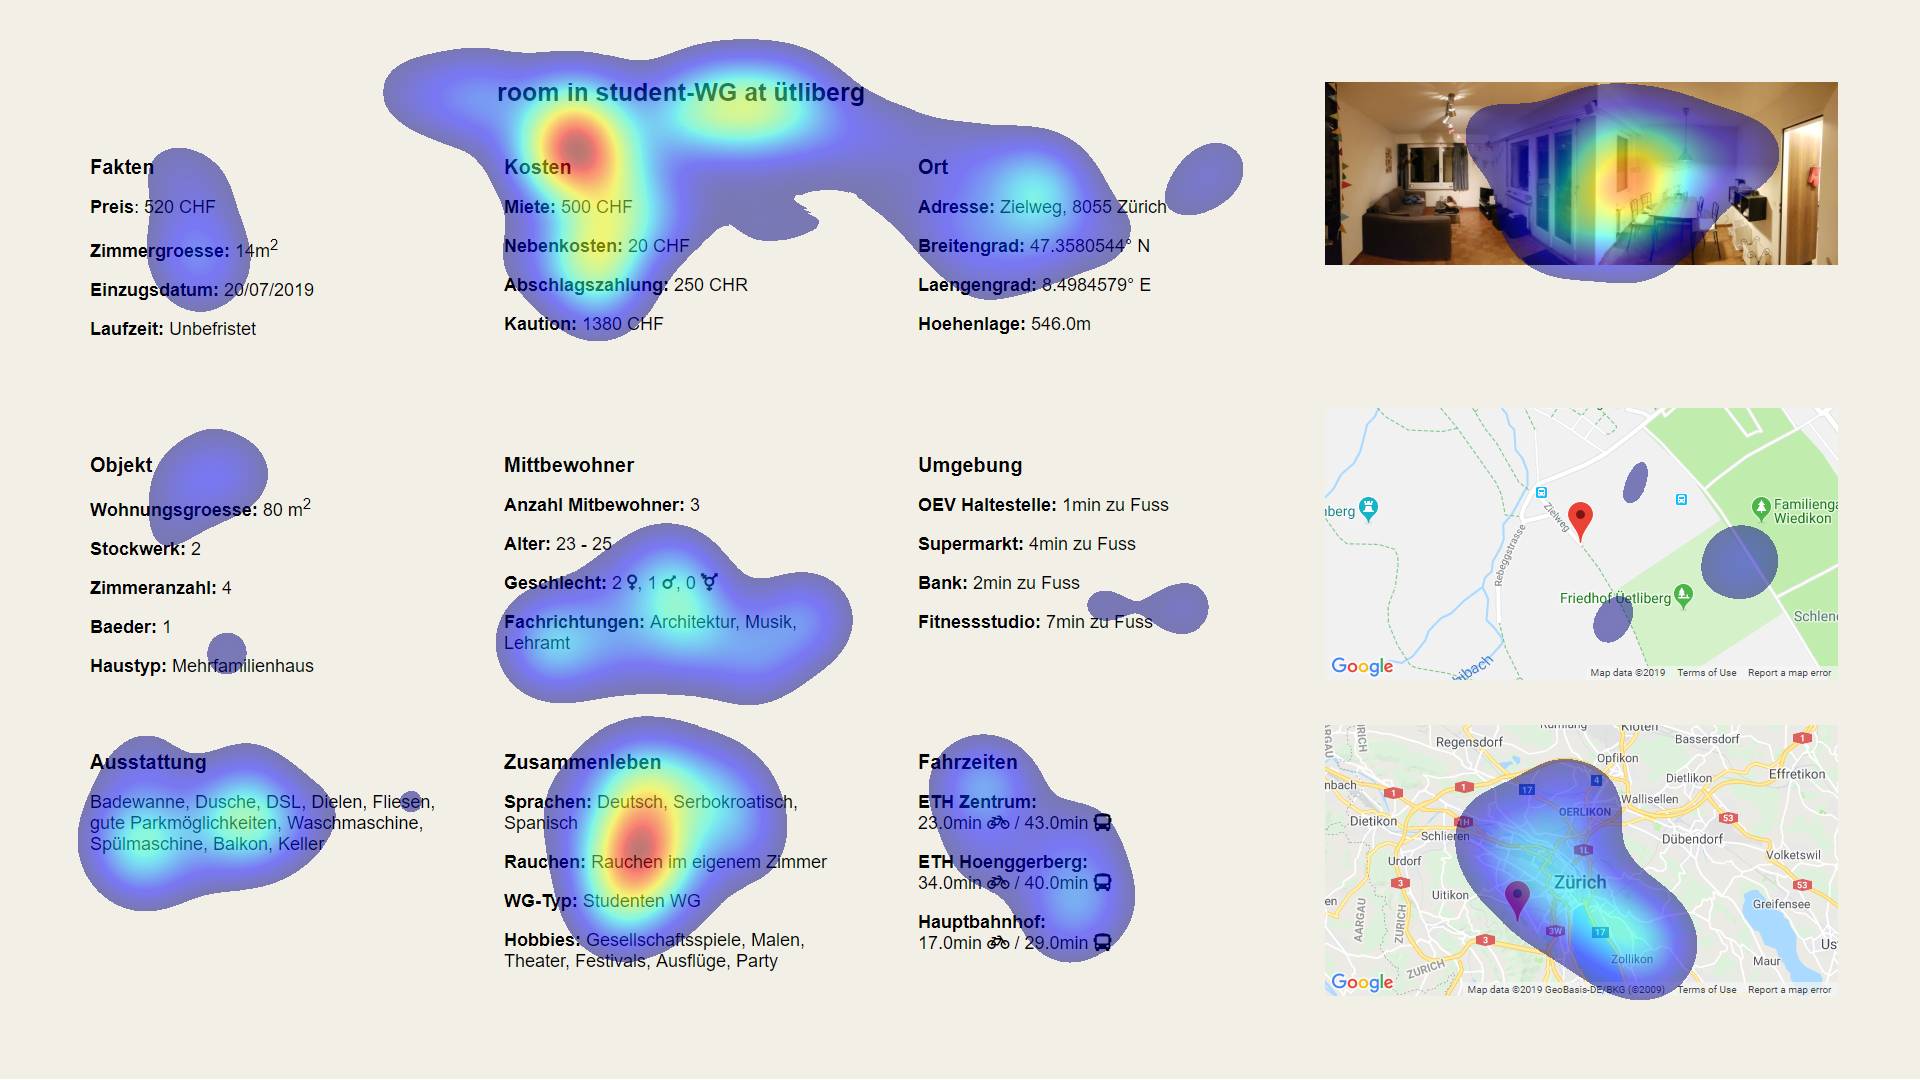
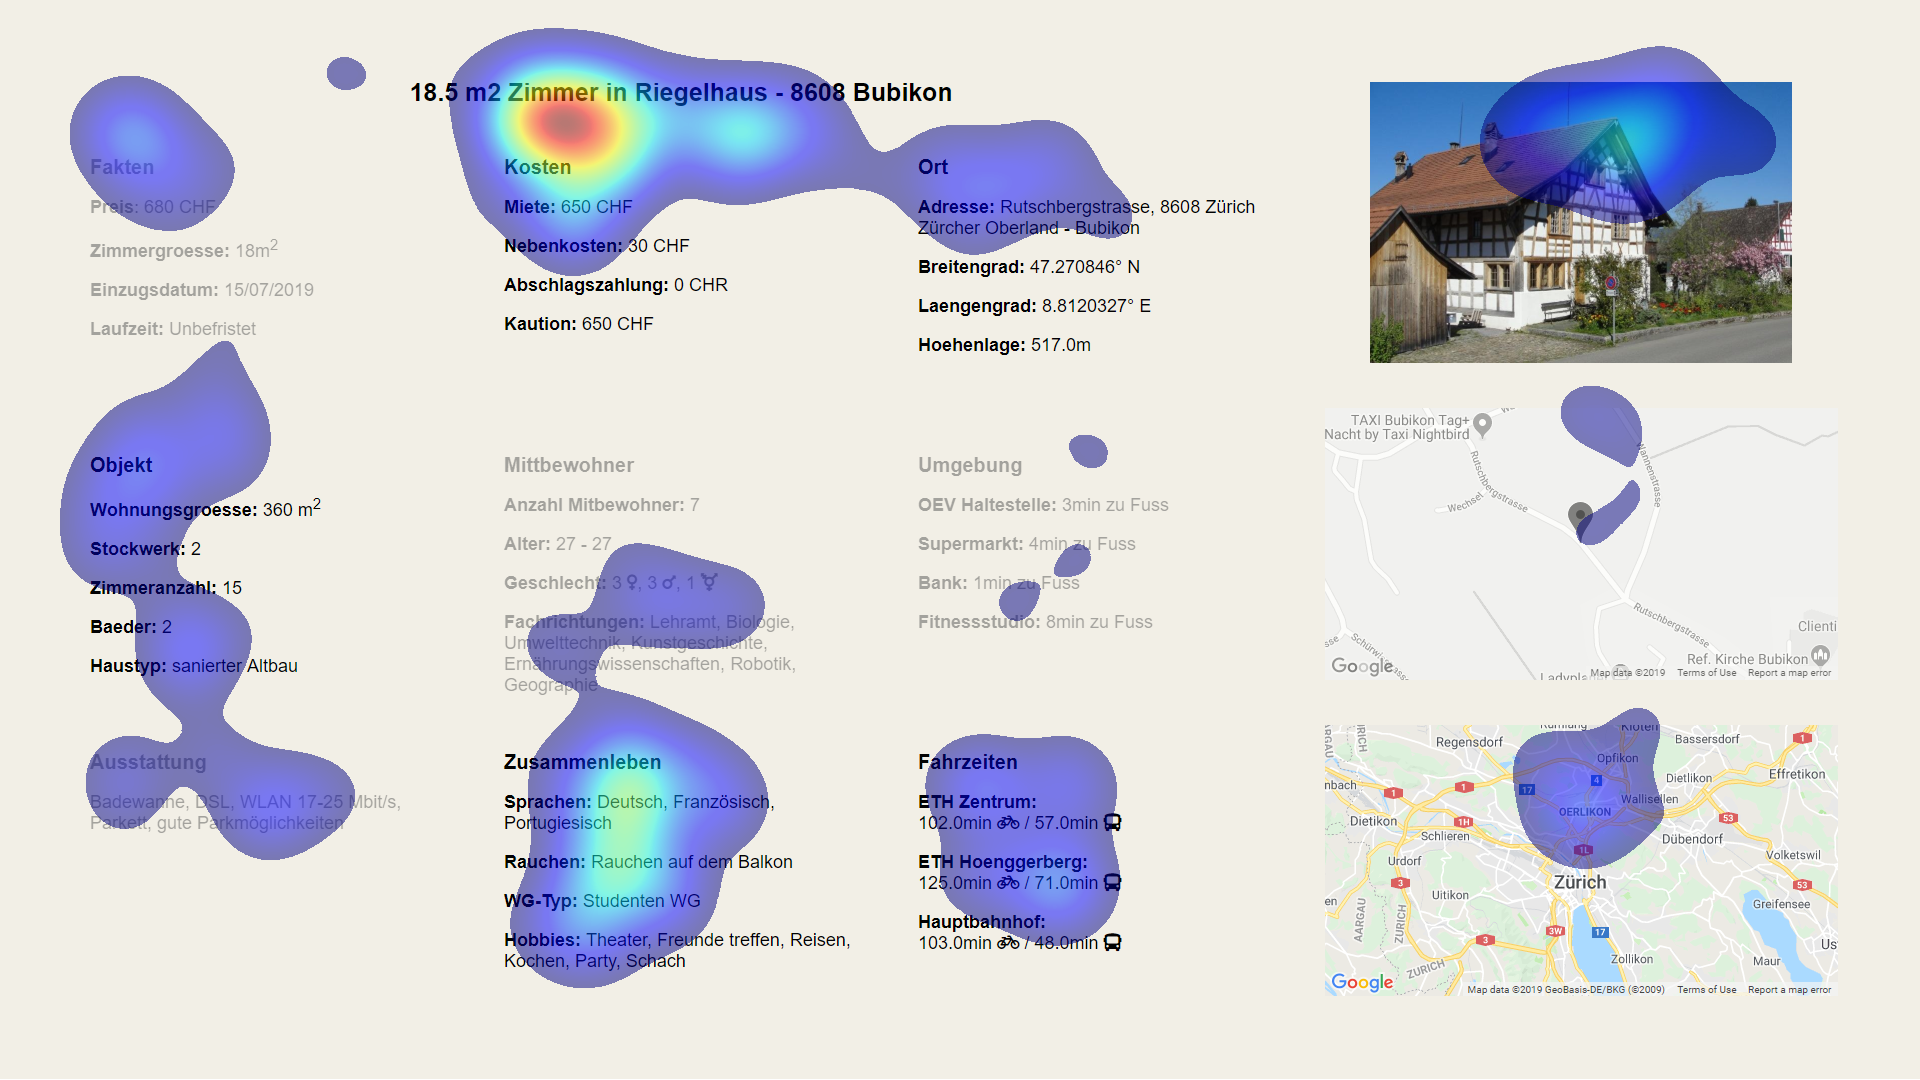
To maximize the external validity of our findings, we carefully designed a realistic and useful interface in terms of content, layout, and adaptation method. The application shows individual room advertisements with information structured into 13 AOIs (including title), telling about a the room, its price and location, roommates, and additional details such as estimated commute time to the university (see Figure 2(a)). These were scraped from public apartment share websites, generated via the Google Maps API, or synthesized. We implement two UI adaptation schemes with the goal to guide users’ attention without being obtrusive. The application can suppress irrelevant AOIs as detected by Vote2Metrics through reducing their opacity to 0.5. Thus, they blend into the background while still being legible (see Figure 2(b)). Image-based AOIs such as embedded maps and photos are made to be monochrome to further reduce their visual saliency. The application can highlight relevant AOIs as detected by Vote3Stages by drawing thick-bordered red boxes around them (see Figure 2(c)).
5.1. User study
We assessed the performance of our relevance detectors and their usefulness for UI adaptation in a lab study where we asked participants to use our adaptive room search application to decide whether they would apply to a displayed advertisement.
5.1.1. Participants
Twenty participants (9 male, 11 female) were recruited through university mailing lists. The majority of them were students from various backgrounds. The average age was 26.2 years (SD = 4.6). The requirement for participation was having experience in searching for a room in a shared apartment and having a reasonable monetary budget. One participant had to be excluded for being beyond the budget (= 1700 Swiss Francs) that our application could support in displaying realistic advertisements. All the other participants (N=19) had searched for a room in a shared apartment in the past 3.73 months on average (SD = 2.93) and had a mean budget of 810.50 Swiss Francs (SD = 225.31). 10 participants had vision corrections (6 with glasses, 4 with contact lenses)
5.1.2. Setup & experimental design
The task consisted of a repetitive binary decision. Participants examined 35 room advertisements and decided for each whether they would apply for the particular room. After announcing a decision they were asked about their confidence on a 7-point Likert scale. Advertisements were shown in one of three conditions: default (no adaptation), highlighting and fading, referring to the adaptations described above and shown in Figure 2. We used a within-subjects design and randomized the order of conditions as described below. We used a Tobii Pro Spectrum screen-based eye-tracker (with chin rest) recording at 150 Hz with a 24-inch monitor.
5.1.3. Procedure
The user study was conducted in German. Participants first gave their informed consent for data collection. Before starting the task they were asked to describe the criteria they consider important when searching for a room in a shared apartment. This was done for participants to form a mental model of their preferences beforehand. After that, we showed them a randomly generated set of 35 room advertisements, none of which were more than 10% above their stated budget. During the first 4 advertisements, participants could familiarize with the interface. Eye-tracking data from the subsequent 10 advertisements (without any adaptation) were used to detect the relevance of each AOI. The last 21 advertisements were split into three blocks, each displaying 7 advertisements in one of the three conditions, where the order of conditions was randomized. After every advertisement, the user was asked to state whether they would apply for this room. The person’s eye gaze was recorded while the advertisements were displayed. The eye-tracker was calibrated using the built-in 5-point calibration procedure at the beginning of the study and between every block. The recorded gaze data was of high quality with a low calibration error () and high precision (, ). The user could control the beginning (onset) and the end of an advertisement display by pressing the space bar. At the end of the experimental session, participants filled a short questionnaire and went trough a semi-structured interview. There, we asked them what information they perceived as relevant for making a good decision and used the self-reported AOIs as ground-truth labels. A session took 60 minutes on average and participants were compensated with 25 Swiss Francs for their participation.
| Metric | TP rate (SD) | FP rate (SD) |
|---|---|---|
| Vote2Metrics | 97% (7) | 42% (12) |
| Vote3Stages | 80% (19) | 17% (11) |
| TFF | 54% (18) | 44% (15) |
| FPG | 79% (24) | 31% (9) |
| SPG | 74% (20) | 32% (7) |
| RFX | 79% (19) | 27% (14) |
| SFX | 89% (15) | 28% (12) |
| ODT | 87% (15) | 26% (13) |
5.2. Results
The room-search scenario and application was well perceived by all participants. When asked about realism, all users stated that the ads were genuine and comparable to those found on existing websites. One participant even asked if our application would be available for personal use. The ratio of yes/no answers on whether participants would apply for rooms in shown advertisements were 44% and 56% respectively. Considering the complexity in providing both a balanced and realistic set of advertisements which do not cause cognitive dissonance due to small imprecision in detail, we achieved our goal of a realistic study environment and can expect our conclusions to generalize to real-world scenarios.
5.2.1. Relevance detection
On average, 97% of relevant AOIs (as reported by participants) were recognized by Vote2Metrics (on average 4.21 AOIs), thus only 3% of relevant information was wrongly faded, on average 0.2 AOIS, minimizing the risk of cognitive dissonance. This comes at the cost of a false positive rate of 42% (on average 3.63 AOIs) which were not faded out although they were not denoted as relevant. However, this does not induce any usability issues. In the highlighting condition, the false positive rate could be reduced to 17% by using Vote3Stages. This ensured that on average only 1.58 AOIs were highlighted although they were not regarded as relevant. As a trade-off the average true positive rate reduced to 80%, resulting in 3.42 AOIs highlighted by red boxes. Such a trade-off is desirable since highlighting more than half of the AOIs would not have the desired effect.
Table 2 compares the performance of these recognizers against that of individual metrics. While overall dwell time (ODT) and sum of fixations (SFX) perform relatively well in comparison to others, Vote2Metrics and Vote3Stages better maximize true positives and minimize false positives respectively, as required for our adaptations. In particular, the voting scheme can recognize edge cases where e.g. a relevant AOI is characterized by a short time to first fixation (TFF) and several refixations (RFX) but not a high ODT.
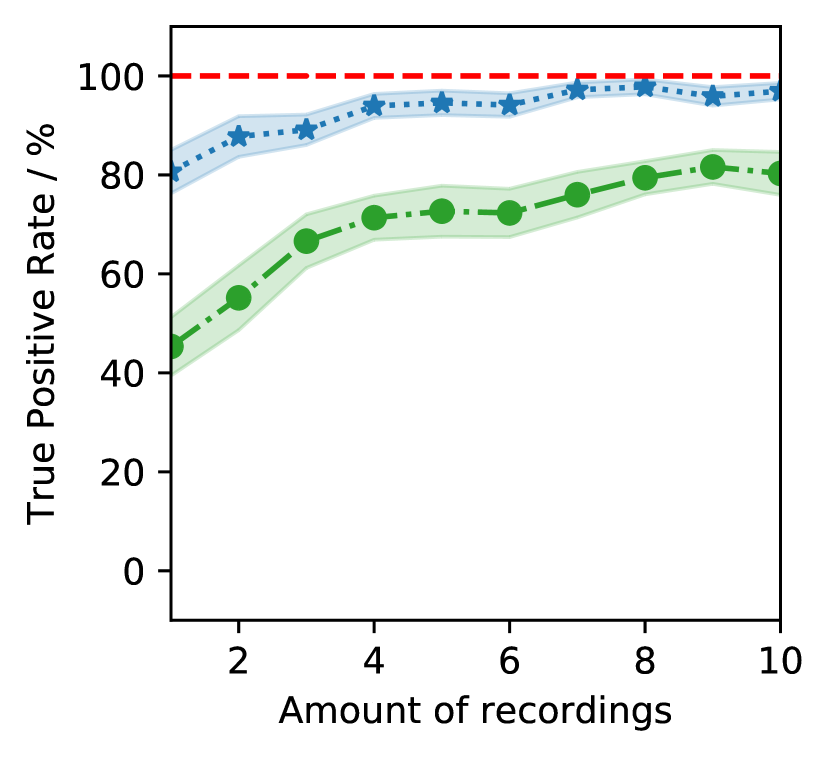
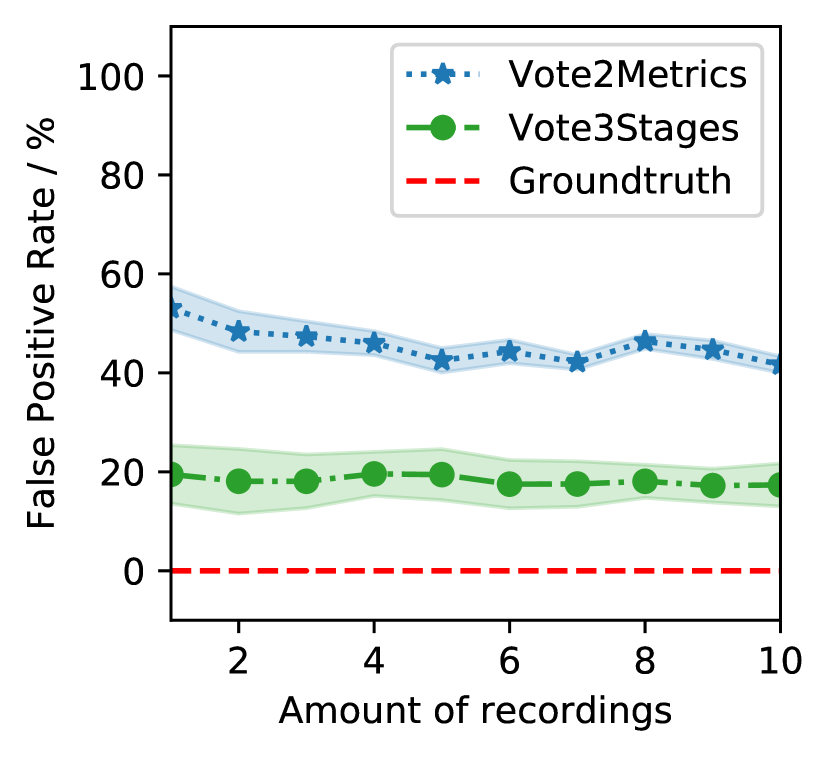
In our pilot evaluation, relevance detection was based on gaze data of only one decision. In contrast, in this study we recorded eye movements over 10 subsequent decisions. As shown in Figure 3, this has a positive effect on the true positive and false positive rates of our two recognizers. Still, already after one observation, we observe a high true positive rate of over 80% with Vote2Metrics. This is consistent with the pilot data. The false positive rate with Vote3Stages is consistently low indicating its robustness even with one or few observations. With more recordings, effects from the specific content of particular advertisements can be smoothed out, and a better understanding of task and user relevance can be made. Consequently, the standard error of our approach decreases.
| Metric | Default | Fading | Highl. | Note |
| Task execution | 20.22s | 20.8s | 19.9s | |
| time (SD) | (6.12) | (7.87) | (6.54) | |
| Confidence | 5.55 | 5.6 | 5.61 | 1 (not confident) – |
| (SD) | (0.5) | (0.74) | (0.66) | 7 (very confident) |
| Perceived inform. | 4.53 | 4.68 | 4.9 | 1 (overwhelming) – |
| density (SD) | (1.61) | (0.95) | (1.52) | 7 (balanced) |
| Adapt. facilitates | - | 3.21 | 4.63 | 1 (never) – |
| task (SD) | - | (1.51) | (2.11) | 7 (always) |
| Preference count | 8 | 4 | 6 | 1 undecided |
Participants commented positively on the effectiveness of the relevance detector, stating for example that “Nothing was faded out, that I actually wanted to read.”, “The red boxes highlight the most important information”, and “First I felt guilty that I did not look at all the information, but when elements were faded out, […] I was okay with not looking at all of the information.” Only one participant said that an AOI they considered important was not highlighted. This concerned the AOI including the net rent, which the participant memorized at a glance and did not have to return to, thus avoiding the triggering of votes from any single gaze metric.
5.2.2. Effect of UI adaptation
Overall, we could not observe any change in task performance as an effect of the UI adaptation (Table 1). Task execution time (TET) remained similar throughout all conditions. Participants reported a slight increase in the confidence of their decision during either one of the adapted conditions. We statistically tested the differences between conditions using Linear Mixed-Effects Models with a random part for participant-level effects (using the LME4 package for R and the lmerTest package to calculate p-values via Satterthwaite’s degrees of freedom method). No significant difference was found for neither TET nor confidence ( in all cases). Nevertheless, when asked about perceived information density on a 7-point Likert scale, a small, yet positive trend was observed for the adapted conditions. These results were similar to answers on whether the adaptation made the task easier. All measurements can be found in Table 3.
When asked which version they would like to use, 10 / 18 participants stated that they preferred one of our adapted interfaces over the default case (one was undecided). Some participants preferred highlighting, stating for example that “The interface had a better structure with red boxes and made it easier to search for information”. However, others disagreed saying: “I prefer fading because default showed too much information and it was easier when things were faded out. On the other hand, I did not like coloring, because it was weird.” This indicates that a visual interface adaptation scheme should consider users’ preferences and offer multiple options.
Interestingly, several participants that preferred the default version did so due to concerns about their behavior being influenced by an algorithmic system, saying: “I like to decide for myself what is relevant and what not.” and “In [the] default [condition,] information is weighted equally. I do not expect from an application to tell me what is relevant, I want to have my freedom of decision.”.
6. Discussion
We proposed an approach to detect the relevance of information displayed by a UI during decision-making from user gaze behavior. Informed by the eye-tracking and decision-making literature, we carefully selected a set of six gaze metrics which each capture different aspects of people’s gaze behavior. By combining them in a voting scheme we can obtain a more holistic view of a person’s attention during the decision process to infer the relevance of the displayed information. At the same time, this makes the detection robust against variations in the gaze behavior across users due to differences in decision strategies. Indeed, our voting schemes (Vote2Metrics and Vote3Stages) performed decidedly better compared to the individual metrics (cf. Table 2). Although there are several more gaze metrics used by prior work such as duration of last fixation, inter-saccadic jumps or Krejtz’s coefficient [Krejtz et al., 2017], we limited our approach to the most commonly used ones that covered gaze characteristics during the different stages of decision-making. This also ensures that our relevance detector is not tuned to a specific task but applicable to very different domains, as shown in this paper.
6.1. Generalizability of the approach
We evaluated our approach with data from two applications. Both had a static graphical layout and presented the user with a yes / no decision. The latter is not a requirement for the applicability of the voting scheme. The three stages of decision-making which form the theoretical basis of our approach were associated also with other types of decisions, such as when choosing between different alternatives [Russo and Leclerc, 1994]. However, future works needs to assess the applicability of our approach for dynamic interfaces. In such a case, the voting scheme could be changed to take into account a longer or re-occuring orientation phase of the user for example by reducing the weight of votes casted by metrics associated with the first stage. We organized the presented information into well-structured AOIs to ensure reliable gaze data. As eye tracking technology improves, the same approach can be used to detect information relevance for individual pieces of information also in less structured interfaces.
6.2. Trading-off true and false positives
For an adaptive UI to be successful, special care needs to be taken in order to avoid wrong adaptations that could increase the interaction cost or induce cognitive dissonance [Findlater and Gajos, 2009]. Accordingly, in this paper, we have argued that depending on whether a UI emphasizes relevant content or suppresses irrelevant information, a recognizer should aim to minimize its false positive rate or focus on maximizing true positives. We have shown that by varying the minimum number of required votes, the trade-off between true and false positives can be easily adjusted in a predictable way. Figure 5 shows that this is the case in both the stock-trading as well as the room-search dataset, indicating that this property generalize across different task domains and holds from the first observed decision, as well as for ten observations. Our work enables UI designers to easily determine the voting scheme that yields the best trade-off for their specific application.
| Model | TP rate (SD) | FP rate (SD) | F1 score (SD) |
|---|---|---|---|
| Vote3Stages | 80% (19) | 17% (11) | 0.72 (0.16) |
| Vote2Metrics | 97% (7) | 42% (12) | 0.68 (0.13) |
| SVM | 68% (23) | 15% (13) | 0.64 (0.18) |
| (Linear kernel, C = 0.1) | |||
| Decision Tree | 61% (20) | 18% (12) | 0.59 (0.20) |
| MLP | 64% (41) | 20% (16) | 0.49 (0.32) |
| (ReLU, h = 16, lr = 0.01) | |||
| Log. Regression | 61% (28) | 14% (12) | 0.58 (0.23) |
| (Elastic net reg., C = 1.0) |
6.3. Effectiveness of the UI adaptation
The large majority of users confirmed the efficacy of our room search application in detecting relevant information and many preferred the adapted version. By using different recognizers for highlighting and fading we could minimize the risk of cognitive dissonances or usability issues due to wrong adaptations. Nevertheless, on average we did not find a significant impact on task execution time, confidence in decision-making or perceived information load. At the same time, participants showed large individual differences. For example, we could observe individual cases where the adaptation guided the eye gaze of the participant, allowing them to better focus their information retrieval process, as shown for an exemplary participant in Figure 4. A possible explanation could be that the chosen adaptations (red boxes and reduced opacity) are not effective in facilitating the decision process in the first place. The few studies that assess the effect of visual adaptations of graphical UIs are often contradictory and do not consider a large range of adaptation techniques [Deuschel and Scully, 2016]. While this paper offers a method to detect information relevance, we need future work to establish better ways to effectively adapt UIs to facilitate the decision-making process. Such work should take into account the concern of some users that they are manipulated by the application and therefore preferred the default and non-adapted version. Similar concerns were observed by by prior work [Yang and Wigdor, 2014; Park et al., 2018]. Adaptive interfaces could offer explicit control mechanisms for users to customize adaptations or to review and change the inferences made about them.
6.4. Relation to supervised classification
While prior work introduced no directly comparable methods, machine learning methods such as logistic regression have been employed in related areas of visual target search and image relevance[Klami, 2010] . Unlike our method, such learning-based methods require ground-truth data from the exact same task and setting. For a fair comparison in the case where the task is known, we performed a leave-one-out cross-validation on our room-search data for several machine learning methods. Table 4 summarizes the results and compares them against Vote2Metrics and Vote3Stages. It shows a clear dominance in true positive rates for both our methods, with Vote3Stages having a comparably low false positive rate. We also find that our methods score well in terms of F1 score – a metric often used for evaluating binary classifier systems.
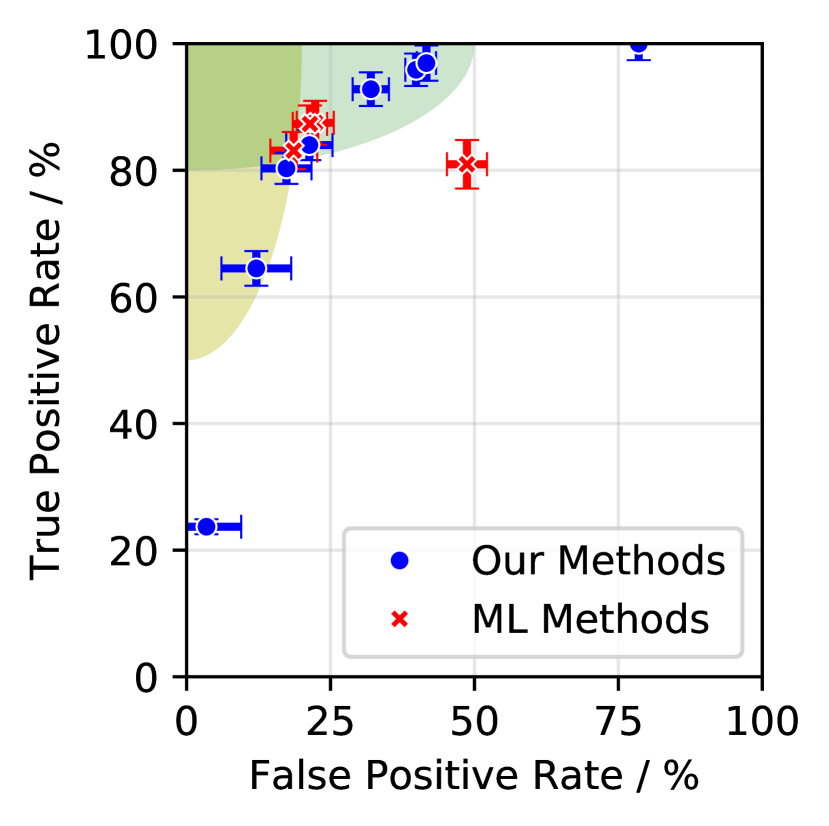
More interesting, however, is to see how these methods generalize to new tasks and settings. We thus performed two experiments: (a) one where we train the machine learning methods on the room search data (10 decisions), and evaluate on the stock trading data (1 decision), and (b) the other way around. As seen in Figure 5, our approach shows the predictable trade-off through varying the number of votes in both task domains, whereas the machine learning methods have no clear consistency in performance, all achieving low false positive rates in one and high true positive rates in the other case. This would make it challenging for a UI designers to anticipate how their system would perform in practise, whereas our method enables them to fit the system’s behavior to the chosen adaptation scheme by selecting an appropriate threshold.
7. Conclusion
This paper contributes an approach for detecting the relevance of information displayed by a UI during the decision-making process of a user. This could enable new adaptive applications that change their interface in response to the interest of a specific user to increase the user’s experience and facilitate her decision-making. Based on two empirical datasets, we show that our approach can trade-off true and false positive rates in a manner where performance changes can be anticipated. It does this without requiring any explicit feedback from users by only observing their gaze behavior during the decision process. Therefore, we combine well-established metrics from the eye-tracking literature in a voting approach which ensure that the recognition is robust to the large variations in gaze behavior during the decision process and across users who might employ different decision strategies. In contrast to supervised learning approaches, it does not require any training or parameter-tuning and is simple to understand, implement and adjust. An open-source python implementation of our approach is available at https://ait.ethz.ch/projects/2020/relevance-detection
Acknowledgements.
The authors thank Christoph Gebhardt for insightful discussions. This project has received funding from the European Union’s Horizon 2020 research and innovation program / from the European Research Council under the Grant Agreement No. StG-2016-717054.References
- [1]
- Alt et al. [2012] Florian Alt, Alireza Sahami Shirazi, Albrecht Schmidt, and Julian Mennenöh. 2012. Increasing the User’s Attention on the Web: Using Implicit Interaction based on Gaze Behavior to Tailor Content. In NordiCHI 2012: Making Sense Through Design - Proceedings of the 7th Nordic Conference on Human-Computer Interaction. 544–553. https://doi.org/10.1145/2399016.2399099
- Aribarg et al. [2010] Anocha Aribarg, Rik Pieters, and Michel Wedel. 2010. Raising the BAR: Bias adjustment of recognition tests in advertising. Journal of Marketing Research 47, 3 (2010), 387–400.
- Aula et al. [2005] Anne Aula, Päivi Majaranta, and Kari-Jouko Räihä. 2005. Eye-Tracking Reveals the Personal Styles for Search Result Evaluation. In Human-Computer Interaction - INTERACT 2005. Springer Berlin Heidelberg, Berlin, Heidelberg, 1058–1061.
- Balatsoukas and Ruthven [2012] Panos Balatsoukas and Ian Ruthven. 2012. An eye-tracking approach to the analysis of relevance judgments on the Web: The case of Google search engine. Journal of the American Society for Information Science and Technology 63, 9 (2012), 1728–1746. https://onlinelibrary.wiley.com/doi/pdf/10.1002/asi.22707
- Bednarik et al. [2012] Roman Bednarik, Hana Vrzakova, and Michal Hradis. 2012. What do you want to do next: a novel approach for intent prediction in gaze-based interaction. In Proceedings of the symposium on eye tracking research and applications. ACM, 83–90.
- Bhattacharya et al. [2020] Nilavra Bhattacharya, Somnath Rakshit, Jacek Gwizdka, and Paul Kogut. 2020. Relevance Prediction from Eye-movements Using Semi-interpretable Convolutional Neural Networks. In Conference on Human Information Interaction and Retrieval (CHIIR ’20). ACM, Vancouver.
- Borji and Itti [2013] Ali Borji and Laurent Itti. 2013. State-of-the-art in visual attention modeling. IEEE transactions on pattern analysis and machine intelligence 35, 1 (2013), 185–207. https://ieeexplore.ieee.org/ielx5/34/6353858/06180177.pdf?tp=&arnumber=6180177&isnumber=6353858
- Buscher et al. [2012a] Georg Buscher, Andreas Dengel, Ralf Biedert, and Ludger V. Elst. 2012a. Attentive Documents: Eye Tracking As Implicit Feedback for Information Retrieval and Beyond. ACM Trans. Interact. Intell. Syst. 1, 2, Article 9 (Jan. 2012), 30 pages. https://doi.org/10.1145/2070719.2070722
- Buscher et al. [2008] Georg Buscher, Andreas Dengel, and Ludger van Elst. 2008. Query Expansion Using Gaze-based Feedback on the Subdocument Level. In Proceedings of the 31st Annual International ACM SIGIR Conference on Research and Development in Information Retrieval (SIGIR ’08). ACM, New York, NY, USA, 387–394. https://doi.org/10.1145/1390334.1390401
- Buscher et al. [2012b] Georg Buscher, Ryen W. White, Susan Dumais, and Jeff Huang. 2012b. Large-scale Analysis of Individual and Task Differences in Search Result Page Examination Strategies. In Proceedings of the Fifth ACM International Conference on Web Search and Data Mining (WSDM ’12). ACM, New York, NY, USA, 373–382. https://doi.org/10.1145/2124295.2124341
- Byrne et al. [1999] Michael D Byrne, John R Anderson, Scott Douglass, and Michael Matessa. 1999. Eye tracking the visual search of click-down menus. In Proceedings of the SIGCHI conference on Human Factors in Computing Systems. ACM, 402–409.
- Deuschel and Scully [2016] Tilman Deuschel and Ted Scully. 2016. On the Importance of Spatial Perception for the Design of Adaptive User Interfaces. In Proceedings - IEEE 10th International Conference on Self-Adaptive and Self-Organizing Systems, SASO 2016. Institute of Electrical and Electronics Engineers Inc., 70–79. https://doi.org/10.1109/SASO.2016.13
- Dourish [2004] Paul Dourish. 2004. What we talk about when we talk about context. Personal and Ubiquitous Computing 8, 1 (feb 2004), 19–30. https://doi.org/10.1007/s00779-003-0253-8
- Droll and Hayhoe [2007] Jason A. Droll and Mary M. Hayhoe. 2007. Trade-offs between gaze and working memory use. Journal of experimental psychology. Human perception and performance 33 6 (2007), 1352–1365.
- Duchowski [2002] Andrew T Duchowski. 2002. A breadth-first survey of eye-tracking applications. Behavior Research Methods, Instruments, & Computers 34, 4 (2002), 455–470.
- Dumais et al. [2010] Susan T. Dumais, Georg Buscher, and Edward Cutrell. 2010. Individual Differences in Gaze Patterns for Web Search. In Proceedings of the Third Symposium on Information Interaction in Context (IIiX ’10). ACM, New York, NY, USA, 185–194. https://doi.org/10.1145/1840784.1840812
- Faro et al. [2010] Alberto Faro, Daniela Giordano, Carmelo Pino, and Concetto Spampinato. 2010. Visual Attention for Implicit Relevance Feedback in a Content Based Image Retrieval. In Proceedings of the 2010 Symposium on Eye-Tracking Research & Applications (ETRA ’10). ACM, New York, NY, USA, 73–76. https://doi.org/10.1145/1743666.1743684
- Findlater and Gajos [2009] Leah Findlater and Krzysztof Z. Gajos. 2009. Design Space and Evaluation Challenges of Adaptive Graphical User Interfaces. AI Magazine 30, 4 (Sep. 2009), 68. https://doi.org/10.1609/aimag.v30i4.2268
- Findlater et al. [2009] Leah Findlater, Karyn Moffatt, Joanna McGrenere, and Jessica Dawson. 2009. Ephemeral Adaptation: The Use of Gradual Onset to Improve Menu Selection Performance. In Proceedings of the SIGCHI Conference on Human Factors in Computing Systems (CHI ’09). Association for Computing Machinery, New York, NY, USA, 1655–1664. https://doi.org/10.1145/1518701.1518956
- Gebhardt et al. [2019] Christoph Gebhardt, Brian Hecox, Bas van Opheusden, Daniel Wigdor, James Hillis, Otmar Hilliges, and Hrvoje Benko. 2019. Learning Cooperative Personalized Policies from Gaze Data. In Proceedings of the 32nd Annual ACM Symposium on User Interface Software and Technology (UIST ’19). ACM, New York, NY, USA, 10. https://doi.org/10.1145/3332165.3347933
- Gegenfurtner et al. [2011] Andreas Gegenfurtner, Erno Lehtinen, and Roger Säljö. 2011. Expertise differences in the comprehension of visualizations: A meta-analysis of eye-tracking research in professional domains. Educational psychology review 23, 4 (2011), 523–552.
- Gidlöf et al. [2013] Kerstin Gidlöf, Annika Wallin, Richard Dewhurst, and Kenneth Holmqvist. 2013. Using eye tracking to trace a cognitive process: Gaze behaviour during decision making in a natural environment. Journal of Eye Movement Research 6, 1 (2013), 1–14.
- Gigerenzer and Gaissmaier [2011] Gerd Gigerenzer and Wolfgang Gaissmaier. 2011. Heuristic Decision Making. Annual Review of Psychology 62, 1 (2011), 451–482. https://doi.org/10.1146/annurev-psych-120709-145346 PMID: 21126183.
- Göbel and Kiefer [2019] Fabian Göbel and Peter Kiefer. 2019. POITrack: Improving Map-based Planning with Implicit POI Tracking. In Proceedings of the 11th ACM Symposium on Eye Tracking Research & Applications (ETRA ’19). ACM, New York, NY, USA, Article 87, 9 pages. https://doi.org/10.1145/3317959.3321491
- Göbel et al. [2018] Fabian Göbel, Peter Kiefer, Ioannis Giannopoulos, Andrew T. Duchowski, and Martin Raubal. 2018. Improving Map Reading with Gaze-adaptive Legends. In Proceedings of the 2018 ACM Symposium on Eye Tracking Research & Applications (ETRA ’18). ACM, New York, NY, USA, Article 29, 9 pages. https://doi.org/10.1145/3204493.3204544
- Gwizdka [2014] Jacek Gwizdka. 2014. Characterizing relevance with eye-tracking measures. In Proceedings of the 5th Information Interaction in Context Symposium. ACM, 58–67.
- Henderson and Hollingworth [1998] John M Henderson and Andrew Hollingworth. 1998. Eye movements during scene viewing: An overview. Elsevier, 269–293.
- Hwang and Lin [1999] Mark I. Hwang and Jerry W. Lin. 1999. Information dimension, information overload and decision quality. Journal of Information Science 25, 3 (1999), 213–218. https://doi.org/10.1177/016555159902500305
- Jacob and Karn [2003] Robert JK Jacob and Keith S Karn. 2003. Eye tracking in human-computer interaction and usability research: Ready to deliver the promises. In The mind’s eye. Elsevier, 573–605.
- Jayarathna et al. [2015] Sampath Jayarathna, Atish Patra, and Frank Shipman. 2015. Unified Relevance Feedback for Multi-Application User Interest Modeling. In Proceedings of the 15th ACM/IEEE-CS Joint Conference on Digital Libraries (JCDL ’15). Association for Computing Machinery, New York, NY, USA, 129–138. https://doi.org/10.1145/2756406.2756914
- Jovancevic-Misic and Hayhoe [2009] Jelena Jovancevic-Misic and Mary Hayhoe. 2009. Adaptive Gaze Control in Natural Environments. Journal of Neuroscience 29, 19 (2009), 6234–6238. https://doi.org/10.1523/JNEUROSCI.5570-08.2009 arXiv:https://www.jneurosci.org/content/29/19/6234.full.pdf
- Kajan et al. [2016] Rudolf Kajan, Adam Herout, Roman Bednarik, and Filip Povolný. 2016. PeepList: Adapting ex-post interaction with pervasive display content using eye tracking. Pervasive and Mobile Computing 30 (2016), 71–83.
- Kelly and Belkin [2001] D. Kelly and N. J. Belkin. 2001. Reading time, scrolling and interaction: Exploring implicit sources of user preferences for relevance feedback. SIGIR Forum (ACM Special Interest Group on Information Retrieval) (22 10 2001), 408–409.
- Kelly and Teevan [2003] Diane Kelly and Jaime Teevan. 2003. Implicit feedback for inferring user preference: a bibliography. In SIGIR forum, Vol. 37. 18–28.
- Klami [2010] Arto Klami. 2010. Inferring task-relevant image regions from gaze data. In 2010 IEEE International Workshop on Machine Learning for Signal Processing. IEEE, 101–106.
- Klami et al. [2008] Arto Klami, Craig Saunders, Teófilo E. de Campos, and Samuel Kaski. 2008. Can Relevance of Images Be Inferred from Eye Movements?. In Proceedings of the 1st ACM International Conference on Multimedia Information Retrieval (MIR ’08). ACM, New York, NY, USA, 134–140. https://doi.org/10.1145/1460096.1460120
- Kozma et al. [2009] László Kozma, Arto Klami, and Samuel Kaski. 2009. GaZIR: Gaze-based Zooming Interface for Image Retrieval. In Proceedings of the 2009 International Conference on Multimodal Interfaces (ICMI-MLMI ’09). ACM, New York, NY, USA, 305–312. https://doi.org/10.1145/1647314.1647379
- Krejtz et al. [2017] Krzysztof Krejtz, Arzu Coltekin, Andrew T Duchowski, and Anna Niedzielska. 2017. Using Coefficient K to Distinguish Ambient/Focal Visual Attention During Cartographic Tasks. Journal of Eye Movement Research 10, 2 (2017).
- Lieberman et al. [2001] Matthew D. Lieberman, Kevin N. Ochsner, Daniel T. Gilbert, and Daniel L. Schacter. 2001. Do Amnesics Exhibit Cognitive Dissonance Reduction? The Role of Explicit Memory and Attention in Attitude Change. Psychological Science 12, 2 (2001), 135–140. https://doi.org/10.1111/1467-9280.00323 arXiv:https://doi.org/10.1111/1467-9280.00323 PMID: 11340922.
- Lindlbauer et al. [2019] David Lindlbauer, Anna Maria Feit, and Otmar Hilliges. 2019. Context-Aware Online Adaptation of Mixed Reality Interfaces. In Proceedings of the 32nd Annual ACM Symposium on User Interface Software and Technology (UIST ’19). ACM, New York, NY, USA, 10. https://doi.org/10.1145/3332165.3347945
- Navalpakkam et al. [2013] Vidhya Navalpakkam, LaDawn Jentzsch, Rory Sayres, Sujith Ravi, Amr Ahmed, and Alex Smola. 2013. Measurement and modeling of eye-mouse behavior in the presence of nonlinear page layouts. In Proceedings of the 22nd international conference on World Wide Web. ACM, 953–964.
- Nguyen and Liu [2016] Cuong Nguyen and Feng Liu. 2016. Gaze-based Notetaking for Learning from Lecture Videos. In Proceedings of the 2016 CHI Conference on Human Factors in Computing Systems - CHI ’16. ACM Press, New York, New York, USA, 2093–2097. https://doi.org/10.1145/2858036.2858137
- Orquin and Loose [2013] Jacob L Orquin and Simone Mueller Loose. 2013. Attention and choice: A review on eye movements in decision making. Acta psychologica 144, 1 (2013), 190–206.
- Papismedov and Fink [2019] Daniele Papismedov and Lior Fink. 2019. Do Consumers Make Less Accurate Decisions When They Use Mobiles?. In International Conference on Information Systems. Munich.
- Park et al. [2018] Seonwook Park, Christoph Gebhardt, Roman Rädle, Anna Maria Feit, Hana Vrzakova, Niraj Ramesh Dayama, Hui-Shyong Yeo, Clemens N. Klokmose, Aaron Quigley, Antti Oulasvirta, and Otmar Hilliges. 2018. AdaM: Adapting Multi-User Interfaces for Collaborative Environments in Real-Time. In Proceedings of the 2018 CHI Conference on Human Factors in Computing Systems (CHI ’18). ACM, New York, NY, USA, Article 184, 14 pages. https://doi.org/10.1145/3173574.3173758
- Payne et al. [1992] John W Payne, James R Bettman, Eloise Coupey, and Eric J Johnson. 1992. A constructive process view of decision making: Multiple strategies in judgment and choice. Acta Psychologica 80, 1-3 (1992), 107–141.
- Polikar [2006] Robi Polikar. 2006. Ensemble based systems in decision making. IEEE Circuits and systems magazine 6, 3 (2006), 21–45.
- Qvarfordt and Zhai [2005] Pernilla Qvarfordt and Shumin Zhai. 2005. Conversing with the User Based on Eye-gaze Patterns. In Proceedings of the SIGCHI Conference on Human Factors in Computing Systems (CHI ’05). ACM, New York, NY, USA, 221–230. https://doi.org/10.1145/1054972.1055004
- Russo and Leclerc [1994] J Edward Russo and France Leclerc. 1994. An eye-fixation analysis of choice processes for consumer nondurables. Journal of consumer research 21, 2 (1994), 274–290.
- Salojärvi et al. [2003] Jarkko Salojärvi, Ilpo Kojo, Jaana Simola, and Samuel Kaski. 2003. Can relevance be inferred from eye movements in information retrieval. In Proceedings of WSOM, Vol. 3. 261–266.
- Salojärvi et al. [2005] Jarkko Salojärvi, Kai Puolamäki, Jaana Simola, Lauri Kovanen, Ilpo Kojo, and Samuel Kaski. 2005. Inferring relevance from eye movements: Feature extraction. In Workshop at NIPS 2005, in Whistler, BC, Canada, on December 10, 2005. 45.
- Simon [1957] Herbert A Simon. 1957. Models of man; social and rational. (1957).
- Yang and Wigdor [2014] Jishuo Yang and Daniel Wigdor. 2014. Panelrama: Enabling Easy Specification of Cross-device Web Applications. In Proceedings of the SIGCHI Conference on Human Factors in Computing Systems (CHI ’14). ACM, New York, NY, USA, 2783–2792. https://doi.org/10.1145/2556288.2557199
Appendix A Appendix
The following image shows the financial trading interface used in the pilot study. Participants were asked to evaluate a stock quote and make an investment decision. The displayed information is organized into 12 AOIs. The recorded gaze was used to test our voting approach in comparison to self-reported ground-truth.
![[Uncaptioned image]](/html/2007.13090/assets/figures/financialDashboard.png)
The following image shows a larger version of Figure 2, the room search application. Similar to the financial dashboard above, information about a room is spatially grouped into 12 AOIs to ensure reliable gaze information.