Controlled density-downramp injection in a beam-driven plasma wakefield accelerator
Abstract
This paper describes the utilization of beam-driven plasma wakefield acceleration to implement a high-quality plasma cathode via density-downramp injection in a short injector stage at the FLASHForward facility at DESY. Electron beams with charge of up to and energy spread of a few percent were accelerated by a tunable effective accelerating field of up to . The plasma cathode was operated drift-free with very high injection efficiency. Sources of jitter, the emittance and divergence of the resulting beam were investigated and modelled, as were strategies for performance improvements that would further increase the wide-ranging applications for a plasma cathode with the demonstrated operational stability.
I introduction
Plasma wakes excited by charged particle beams Rosenzweig et al. (1988); Chen et al. (1985); J. B. Rosenzweig et al. (1991) are capable of generating GV/m accelerating gradients Tajima and Dawson (1979); Ruth et al. (1985). This is 2–3 orders of magnitude larger than conventional radio-frequency-based technologies, thereby promising a drastic reduction in both the size and cost of particle-accelerator facilities. Such a decrease is of particular significance for future linear colliders Cros et al. (2019) and the provision of compact free-electron laser (FEL) photon sources. The research field of beam-driven plasma-wakefield accelerators (PWFA) is dynamic, with advances ranging from the energy doubling of a electron beam over less than a meter Blumenfeld et al. (2007), to the controlled correction of a correlated energy spread within a plasma channel of tens of millimeters D’Arcy et al. (2019a); Shpakov et al. (2019); Wu et al. (2019). In particular, there has been significant progress in energy transfer from the beam driving the wake (the drive beam) to the trailing beam experiencing the accelerating field (the witness beam) Litos et al. (2014); Loisch et al. (2018); Corde et al. (2015). Witness beams can be injected into the plasma wakefield either from an external source or internally by the trapping of ambient plasma electrons. Research on external injection methods has predominantly concentrated on maximizing energy transfer from the drive to the witness beam while preserving other beam parameters, such as emittance and energy spread Libov et al. (2018); Joshi et al. (2018). Internal injection methods with extremely high electric-field gradients (GV/m) have the potential to generate beams with exceptionally high quality. As opposed to injecting a beam into an accelerating structure, in these methods, a relativistic electron beam with much smaller phase space is formed directly inside the accelerating structure. The predicted witness beams have normalized transverse emittance values much smaller than their drive beams and charges in the range of tens to hundreds of picocoulombs with femtosecond bunch durations Hidding et al. (2012); Li et al. (2013); Martinez de la Ossa et al. (2013). Internal injection therefore offers the opportunity to generate a new class of beams with significantly enhanced brightness in comparison to conventional accelerator sources – an extremely desirable feature for future photon sources and applications in high-energy physics. While a variety of complementary internal injection methods have been shown to work in principle Vafaei-Najafabadi et al. (2014); Deng et al. (2019); Oz et al. (2007), precise control over the injection process, and consequently the injected witness-beam parameters, has so far remained relatively unexplored. This paper describes experiments carried out at FLASHForward Aschikhin et al. (2016); D’Arcy et al. (2019b) – a dedicated plasma-wakefield beamline adjacent to the FLASH facility Ackermann et al. (2007), which operates with kiloampere-level beam currents and FEL-grade stability and beam quality Schreiber and Faatz (2015). It reports on the experimental demonstration of stable and controlled internal injection in PWFA utilizing a laser induced density downramp Bulanov et al. (1998); Suk et al. (2001); Wittig et al. (2015, 2016) and demonstrates for the first time a plasma cathode that can be reliably operated. The injected bunch properties as a function of laser alignment and laser energy are also explored.
II Density Downramp injection
Generation of high-quality electron beams in a plasma accelerator via internal injection requires the trapping of electrons in the accelerating phase of the plasma wake. These electron populations can originate from within the wake through ionization injection Hidding et al. (2012); Martinez de la Ossa et al. (2013); Vafaei-Najafabadi et al. (2014); Hidding et al. (2014); Wan et al. (2016) or from plasma electrons forming the boundary of the wake’s ion cavity Bulanov et al. (1998); Thompson et al. (2004). Trapping will occur when electrons that enter the accelerating phase of the plasma wake reach or exceed the phase velocity of the wake itself (). Therefore, electrons need either to enter the wakefield at sufficiently high velocity or the potential of the plasma wake needs to be deep enough to accelerate these electrons to . The velocity of the plasma electrons depends on the strength of the generated wakefield which in turn is related to the drive beam and plasma densities. In a plasma of constant density, , the phase velocity is equal to the velocity of the relativistic drive beam , i.e., close to that of light, . Such a stringent condition readily precludes trapping of electrons from the plasma background unless the phase velocity can be locally reduced using a plasma-density gradient Katsouleas (1986); Suk et al. (2001); England et al. (2002). A plasma density that decreases along the direction of propagation of the driver leads to a longitudinal expansion of the plasma wake with a concurrently reduced phase velocity of
| (1) |
where is the longitudinal coordinate in the co-moving frame, is the longitudinal coordinate in the laboratory frame and is time. As illustrated by Eq. 1, the phase velocity on a density downramp decreases towards the back of the plasma wake, allowing fast plasma electrons to rephase into the accelerating region, where they eventually become trapped and can form a witness beam. If trapping is avoided except on the density downramp, the injection process can be controlled and density-downramp injection characterised in detail.
Numerical studies with 3D particle-in-cell (PIC) codes predict that density-downramp injection with a sufficiently sharp gradient produces electron beams with transverse normalized emittances below Grebenyuk et al. (2014); Martinez de la Ossa et al. (2017); Xu et al. (2017); Zhang et al. (2019). Such sharp density downramps can be achieved either hydrodynamically, as commonly used in laser-driven plasma wakefield acceleration Gonsalves et al. (2011); Faure et al. (2010); Schmid et al. (2010), or by ionization of distinct gas species with two perpendicularly focused laser arms Wittig et al. (2015, 2016); the latter is the approach pursued in this work.
III Experimental setup
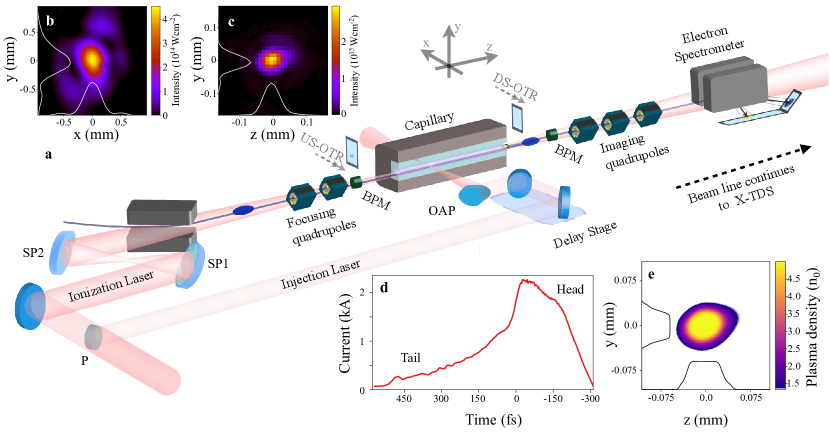
The experimental setup at FLASHForward is depicted in Fig. 1. Electron beams with of charge reaching a mean energy of up to in the FLASH linear accelerator were used to drive a wake inside a capillary plasma source. The plasma was created by ionization inside the capillary using two laser pulses – one focused along the electron-beam axis, the other transverse to it. Combined laser ionization thus formed a sharp density spike surrounded by a plateau region. Spatial alignment and synchronization were achieved with screens sensitive to optical transition radiation (OTR) and by measuring the plasma response due to beam-induced heating.
III.1 The plasma source
Constant-gas-flow capillaries have demonstrated excellent performance in plasma accelerators Gonsalves et al. (2011, 2019); Butler et al. (2002), allowing for tailored, short injector stages. For this experiment, a constant-flow capillary with a total length of at a diameter of with two gas inlets was designed. The capillary incorporates an additional access port with diameter, used to couple in the transverse laser and located downstream of the entrance, leaving a total maximum acceleration length of for the injected witness beam. Gas-flow simulations performed with COMSOL Multiphysics Dickinson et al. (2014) show that the transverse port reduces the plateau gas density by less than and therefore has a negligible effect on the gas-density profile. Either pure argon, pure helium, or an arbitrary ratio of the two gases could be prepared in a mixing volume outside the central vacuum chamber before filling the capillary. In the experiments described in this work, the partial-pressure ratio between helium and argon was set to 2:1. Turbomolecular pumps were connected to the chamber to protect the beamline vacuum, reducing the ambient gas pressure by 3 to 4 orders of magnitude with respect to the pressure inside the capillary. A differential pumping system further reduced the pressure by 3 orders of magnitude both upstream and downstream of the central vacuum chamber. This design ensured that the quality of neither the drive nor witness beam was degraded by interfaces between vacuum chambers and scattering on ambient gas particles.
III.2 Laser ionization
The gas mixture was ionized by two independently focused arms of a Ti:sapphire laser system synchronized to the FLASH electron beam at the 100-femtosecond level Schulz et al. (2015). A pick-off mirror inserted into the laser path reflected the central part of the -diameter laser beam into the injection laser beamline. As depicted in Fig. 1(a), the remaining part of the laser continued to propagate along the ionization laser arm. A FWHM pulse duration of was measured in the injection laser beamline using optimized spectral properties for a short pulse at the injection laser focus. Focusing of the ionization laser was achieved by two spherical mirrors with a resulting effective focal length of 18 m. Such a large effective focal length produced a focal spot with a FWHM in the -direction of (Fig. 1(b)). As a result, the Rayleigh range of the spot approached the meter scale with an intensity profile capable of ionizing a plasma column sufficiently long and wide enough to span the entire length of the capillary whilst fully containing the plasma wake. An off-axis parabola focused the injection laser perpendicular to the electron beam axis through a fused silica window. To minimize non-linear dispersion that can deteriorate the quality of the focal spot or pulse length, the window thickness was chosen to be only. Since the gas profile at the transverse port was assumed to be flat, the resulting plasma-density shape from ionization was defined by the gas-mixture ratio and the injection-laser focus with a FWHM spot size of as shown in Fig. 1(c). Since the intensity of the injection laser was set to be significantly higher than that of the ionization laser, it could ionize more strongly bound electrons from argon and helium via tunneling ionization. The resulting localized plasma-density spike, calculated from the focus measurement with the ADK model Ammosov et al. (1986), is shown in Fig. 1(d). The intensities of the ionization and injection lasers were set such that the former ionized argon up to its second level whilst the latter was capable of additionally ionizing the third ionization level of argon and the first of helium (see Table 1). With such distinct gas ionization, it was possible to control the shape of the plasma, which initially followed the intensity distribution of the laser foci and was subsequently expected to expand hydrodynamically on the nanosecond timescale Durfee and Milchberg (1993); Shalloo et al. (2018).
III.3 Alignment and synchronisation
The ionization laser, injection laser, electron beam and capillary were required to be accurately spatially aligned. Furthermore, the laser timing was required to be set such that ionization occured shortly before the arrival of the electron drive beam. In order to minimize moving parts in the FLASH vacuum, the capillary and the upstream and downstream OTRs were statically mounted on one base plate and controlled in position and angle by a hexapod inside a separate vacuum chamber via a mechanical feedthrough John et al. (2014). Two aluminum-coated silica screens were used to align the system by imaging the optical transition radiation from the passing electron beam and light from the two lasers onto CCD cameras. These two reference points, upstream of the capillary entrance and downstream of the capillary exit, allowed for complete spatial overlap over the length of the plasma stage between the plasma generated by the ionization laser and the axis of the electron beam. The injection laser was aligned to the -position of the electron-beam axis. The capillary was then moved such that each laser propagated through the appropriate channel in the capillary.
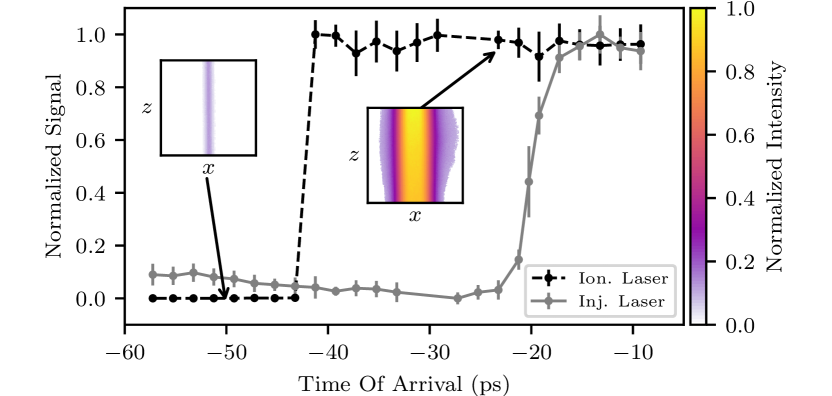
Recent experimental results have shown that the recombination light from the plasma after the passage of an electron beam with currents of order kA can be used to synchronize lasers to electron beams to within a few femtoseconds Scherkl et al. (2019). This effect was used to synchronize the two laser arms to the drive beam. For this measurement, the plasma was ionized outside the capillary after filling the plasma chamber with argon gas to . Figure 2 shows the time-of-arrival (TOA) dependence of plasma light collected by a CCD camera viewing from the top for each of the laser arms; examples of camera images are depicted as insets. The visible transitions in Fig. 2 determine the time-of-arrival delay settings with respect to the electron beam of for the ionization laser and for the injection laser. Once the lasers were set up, the hexapod was positioned to maximise laser transmission through the capillary holes.
III.4 The electron drive beam
Downstream of the plasma, XQA quadrupoles Okunev et al. (2016) in combination with a spectrometer dipole and LANEX scintillating phosphor screens formed an imaging system capable of profiling electron beams from a few MeV to . Alternatively, the electron beam could be transported to an X-band transverse deflecting structure Marchetti et al. (2017); D’Arcy et al. (2018, 2016) for precise longitudinal-phase-space characterisation. The current profile of the drive beam, calculated from such a measurement, is shown in Fig. 1(e). Additionally, the longitudinal phase space of the drive beam could be manipulated upstream of the plasma chamber with an energy collimator located in the dispersive section of the beamline Schröder et al. (2020). The charge and position of the drive beam were measured at various locations along the beamline by toroidal current transformers (toroids) in combination with stripline and cavity BPMs Lipka et al. (2010). The charge of the internally injected witness beam was determined in two independent ways: by subtracting the charges determined by a BPM directly downstream and a toroid upstream of the interaction point with a resolution of Lipka et al. (2016); and from a charge-calibrated phosphor screen in the electron spectrometer. A drive beam with a charge of was accelerated to and compressed to a peak current of . The beam, with a transverse root-mean-squared (rms) normalized emittance of , was focused at the entrance of the capillary by four quadrupoles to a spot size of , as measured by a transverse phase-space measurement using the combination of two BPMs and a scan of the spectrometer object plane Lindstrøm et al. (2020). The plateau plasma density was determined to be by comparing the measured and simulated energy losses of the drive beam, where the measured beam parameters, such as spot size, energy, current distribution and emittance were used as inputs to the simulation.
IV Particle-In-Cell Simulations
The experiment was modeled with the 3D particle-in-cell (PIC) simulation code OSIRIS Fonseca et al. (2002). The modeled plasma-density distribution with a plateau density of was derived from gas-density profiles, simulated with COMSOL and tunneling ionization calculations Ammosov et al. (1986), based on the intensity distributions of the laser foci. Additionally, numerical studies with the code FBPIC Lehe et al. (2016) to model the pre-ionization showed that the longitudinal plasma-density profile beyond an acceleration length of 10 mm would develop a taper resulting from ionization defocussing. Such a taper can lead to a rephasing of the witness beam to lower accelerating fields. However, in this work, the discussion is limited to the injection process and the flat-top region; the longitudinal plasma-density profile that optimizes the acceleration to higher energies will be the subject of future work.
Simulations were conducted with a co-moving window of in with cells. The drive-beam current profile, charge, and spot size were modeled based on the measurements described in Sec. III. The number of macro-particles per cell (PPC) for the drive beam was 8. While the PPC for the background plasma electrons was 1, the PPC was increased to 8 in a radius of around the injection laser focus to resolve the physics of the injection process more accurately. The simulation case shown in this section represents the measurements shown in Figs. 5-8 as well as the working point marked in Fig. 9.
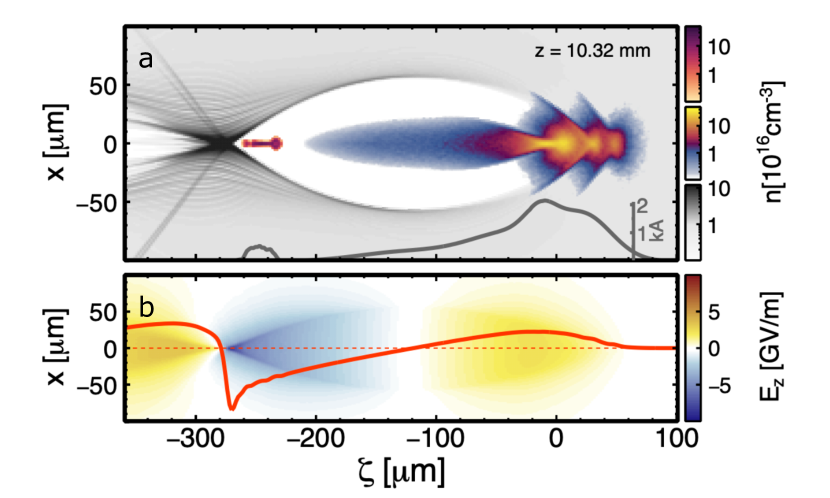
The slice properties and longitudinal phase space of the witness beam are shown in Fig. 4. The simulated witness-beam charge is in excellent agreement with the measured values discussed in Sec. V.
As described in Sec. V, the injection laser was positioned off axis with respect to the electron beam for the majority of the data taking. The simulations show that such an offset leads to an increased emittance in the direction compared to sub-m emittance in . In future experiments, this asymmetry can be avoided with wider transverse foci, enabling sub-m emittance beams in both planes, as predicted for similar parameters Martinez de la Ossa et al. (2017).
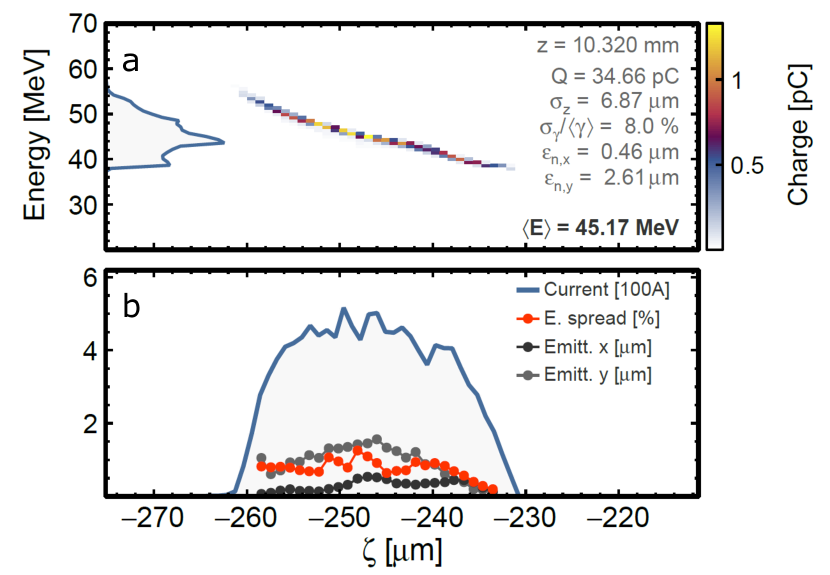
Figure 4 shows that the simulated witness beam has a strongly correlated energy spread. While relatively large energy spread is a characteristic but undesirable property of electron beams from many plasma accelerators, a linearly correlated longitudinal phase space such as that shown in Fig. 4(a) can be corrected for in a downstream plasma dechirper stage D’Arcy et al. (2019a); Shpakov et al. (2019); Wu et al. (2019); Ferran Pousa et al. (2019) or by overloading the plasma wake with additionally injected charge Manahan et al. (2017).
V Experimental Results
V.1 Laser-controlled injection
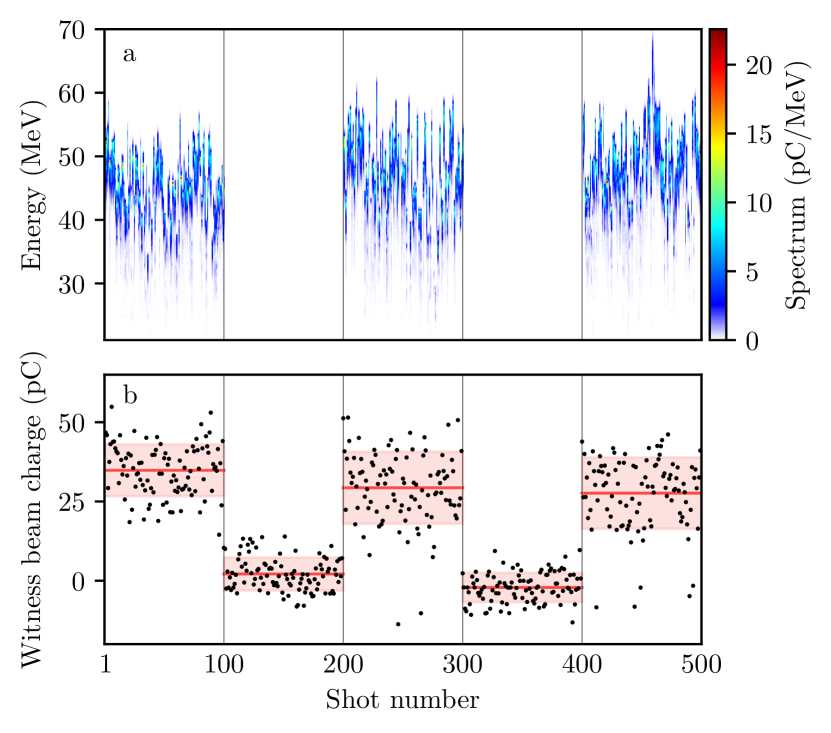
The first investigation explored how the witness beams depended on the presence of the injection laser. This is shown in Fig. 5. Panel (a) depicts the energy spectrum of the witness beam over 500 consecutive shots at a spectrometer imaging energy of , while the corresponding excess-charge values are plotted in panel (b). The injection laser was blocked and unblocked for 100 shots at a time. There is a 100% correlation between the existence of a witness beam and the presence of the injection laser, with no entries being outside the range of the plot. The excess charge was when the injection laser was switched on and otherwise. The injection process is therefore unambiguously triggered by the injection laser. Furthermore, the data confirm that there is no contribution from the ionization laser, in agreement with the PIC simulations (see Sec. IV), so that downramp injection is established as the sole mechanism for witness-beam generation.
V.2 Stability of witness-beam parameters
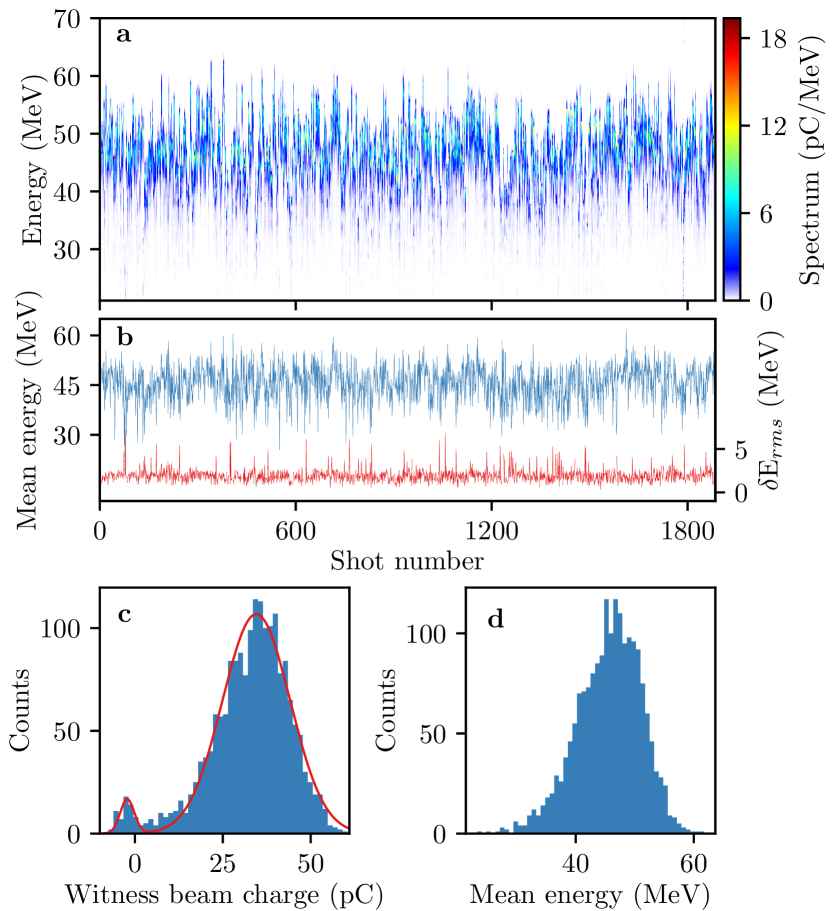
A dataset of 1,885 consecutive shots taken at a repetition rate of 2 Hz and recorded over a time span of approximately 15 minutes was used to explore the reliability of the plasma cathode. A waterfall plot of the projected witness-beam energy spectra is shown in Fig. 6(a). The spectra are remarkably stable. Fig. 6(b) shows the evolution of the mean energy and rms energy spread. An injected witness beam was measured for of the shots presented in Fig. 6(a). The witness beam had a mean charge of and mean energy of with an rms relative energy spread of .
V.3 Witness-beam emittance and divergence
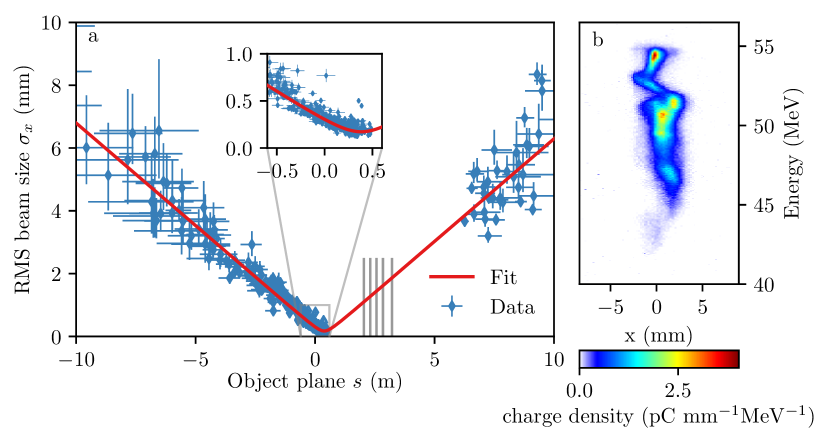
In the absence of focusing forces, a witness beam with a mean Lorentz factor , transverse normalized emittance , and a beta function at its virtual source point will expand outside the plasma such that it has a transverse rms beam size of
| (2) |
at longitudinal position .
Due to the stability of the injection process, this free-space propagation can be examined in a multi-shot measurement by imaging witness beams from different object-plane positions, . Figure 7(a) shows the results of a scan of the quadrupole focusing strength of the imaging spectrometer, giving transverse beam size at the corresponding object plane, which gives information about the transverse expansion of the beam. Fitting Eq. 2 to the data gives a divergence of , , and a transverse rms normalized emittance projected over all shots of . The fact that appears to be downstream of the capillary exit is probably an effect of the gas-density transition between the exit of the capillary and the vacuum of the plasma chamber. According to hydrodynamic simulations, gas-density ramps with atomic densities of order can extend over tens of centimeters. This gas would be ionized by the ionization laser due to its long Rayleigh length. Plasma wakes driven in such a low-density plasma would continue to focus the witness beam for several centimeters beyond the capillary, possibly explaining the particularly low divergence.
An example of the witness-beam signal measured on the spectrometer screen is shown in Fig. 7(b). Since the longitudinal phase space of a witness beam in a plasma accelerator is typically predominantly linear (see Sec. IV), the visible oscillatory structure can be interpreted as transverse centroid oscillations of longitudinal witness-beam slices. This is likely to contribute to the relatively high measured emittance compared to predicted values from numerical studies.
V.4 Influence of laser energy on the plasma cathode
Understanding the influences on the witness-beam characteristics is of primary importance in controlling the injection process whilst optimising its stability, a prerequisite for a reliable electron-beam source. As the plasma is laser ionized, variations in laser-pulse properties are important. No dependence of the charge or energy of the witness beam on laser timing was detected up to at least relative time-of-arrival between the drive-beam and the laser pulses. The ionization and the injection laser arms were derived from the same laser system, so the inherent laser-energy jitter may affect both the longitudinal and transverse laser ionization and thus the shape of both plasmas.
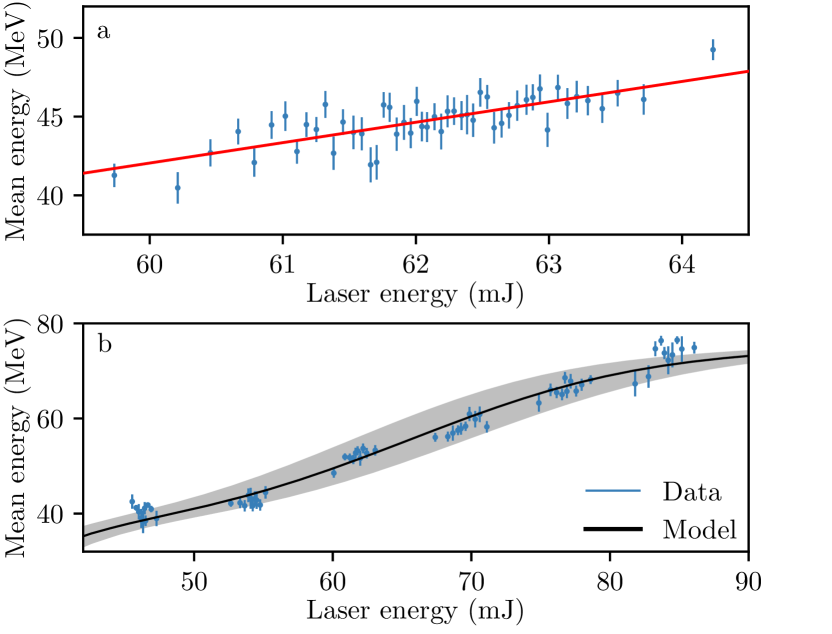
The effect of the laser energy stability on the witness-beam energy was studied by examining the dataset of 1,885 consecutive shots on which Fig. 6 was based. The variation of mean witness-beam energy as a function of on-target laser energy is plotted in Fig. 8(a). The observed linear correlation shows that the witness-beam energy jitter will depend on the stability of the laser energy. This relationship is illustrated more clearly by systematically varying the injection-laser energy over a much larger range, between and . The data is shown in Fig. 8(b). In the fit, a model is used which is based on the fact that higher plasma densities lead to higher accelerating fields and consequently to higher witness-beam energies. Since the plasma-density changes are relatively small in this energy range, the accelerating field acting upon the witness beam was assumed to be proportional to the wave-breaking field Dawson (1959). The witness-beam energy can be parametrized as
| (3) |
where is the on-target laser energy, is a constant adjusting for deviations in effective acceleration length and deviations from acceleration at wave-breaking field-strength and describes an offset in effective average plasma density. The values of were calculated numerically using the ADK model Ammosov et al. (1986), assuming that the laser pulse length and spot size were constant inside the plasma.
The success of this model is illustrated in Fig. 8(b), showing that the change in the mean energy of the witness beam with the total laser energy can be understood as an increase in the average plasma density due to additional Ar-II ionization at higher laser energies. The fit to the data results in and , indicating that the witness beam experiences a lower average plasma density than expected for a uniform longitudinal plasma profile and acceleration at a non-ideal phase or reduced acceleration length. These findings can be explained, for example, with a tapered longitudinal profile caused by ionization defocussing as discussed in Section IV.
The laser rms energy jitter was measured to be . The slope extracted from the model described above translates this into an rms energy jitter of the witness beam of . This is sufficiently small that the accelerating field can be fine-tuned between 1.3 and 2.7 GV/m by varying the laser energy. Control can be improved further by either designing laser systems with lower energy jitter or by using different gas mixtures. For example, if the argon in the gas mixture were to be replaced with hydrogen, the ionization stemming from the ionization laser can saturate, reducing the sensitivity to the laser energy.
V.5 Influence of the injection laser position on the plasma cathode
That precise alignment between the two laser arms and the electron beam is crucial to stable injection can be seen in Fig. 9, which shows the effect on the injected witness charge of changing the height of the injection laser with respect to the electron-beam axis. The height was changed by moving the optical assembly of the injection laser in the -direction along the laser-beam path such that the alignment with respect to the off-axis parabola remained unchanged. The relative calibration between focus position and motor position was carried out with the upstream OTR camera.
Every data point plotted in Fig. 9 represents the average of 20 events; the error on the measured charge is given by the rms variation of the witness-beam charge. The positioning error bar, , was constant throughout the dataset and was calculated from two main contributions: the rms -position jitter of the electron beam at the injection position, , measured by two cavity BPMs Lipka et al. (2010) around the plasma chamber; and the rms variation of the laser centroid position, , measured at the focus. The influence of the jitter on the position of the injection laser, was neglected, as it led to a difference in longitudinal injection position that made a negligible contribution to the witness-beam energy jitter. Furthermore, the -position jitter of the electron-beam waist, was also assumed to have a negligible effect, since it was much smaller than the Rayleigh length of the injection-laser focus. The scan was only performed on one side of the injection-laser position distribution.
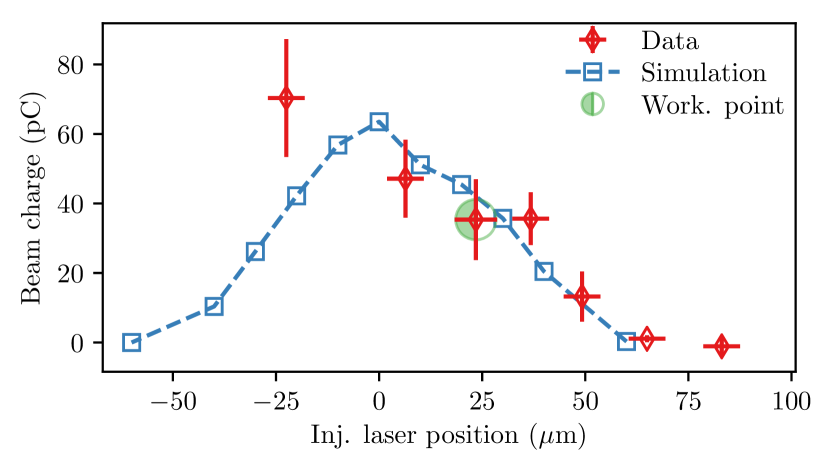
A comparison between the experimental data and a simulated offset scan is plotted in Fig. 9, based on the measured plasma profile (see Fig. 1(d)). In this Figure, zero is at the highest simulated injected charge. Since the relative offset between the electron beam and injection laser was not measured to sub-spot-size accuracy, it was determined by fitting the simulation-based model to the data. The data presented in Figs. 5 - 8 were taken at the point indicated in Fig. 9 as the “work. point”, which shows lower sensitivity to the relative alignment than the experimentally determined position of maximum charge at . The slope of the simulation-based model gives an estimate of the charge variation resulting from position jitter, The charge variation in the witness bunch can be explained predominantly by the position jitter between the electron beam and the injection laser, which is known to be dominated by the laser pointing jitter. This jitter would be eliminated by using an injection laser with a spot size that is many times wider than the plasma wake. Such a shape can be produced with focusing optics that produce asymmetric foci, such as cylindrical lenses.
VI Summary
A plasma cathode with stability at a level unprecedented in the field of beam-driven plasma injectors has been demonstrated, studied, and operated reliably. Effective accelerating gradients of GV/m were demonstrated, tunable in the range of 1.3 – 2.7 GV/m. The stability allowed a multi-shot measurement of the beam-divergence and emittance to be performed. Sources of charge and energy jitter were identified and mitigation strategies were proposed for future applications. Particle-in-cell simulations gave good agreement with the observed witness-beam parameters. These indicate that the requirements for future compact FELs of sub-micron emittances in both planes, peak currents of a few hundred amperes and narrow energy spread can be attained using the methods described in this paper. These results constitute a significant step towards stable, controllable plasma-based cathodes and brightness converter stages, which are of great interest for next-generation photon-science and particle-physics facilities.
Acknowledgements.
The authors would like to thank M. Dinter, S. Karstensen, K. Ludwig, F. Marutzky, A. Rahali, V. Rybnikov, A. Schleiermacher and S. Thiele, as well as the FLASH accelerator team, DESY MVS and the DESY FH and M divisions for their engineering and technical support. We thank the OSIRIS consortium (IST/UCLA) for access to the OSIRIS code and acknowledge the use of the High-Performance Cluster (Maxwell) at DESY. We also gratefully acknowledge the Gauss Centre for Supercomputing e.V. (www.gauss-centre.eu) for funding this project by providing computing time through the John von Neumann Institute for Computing (NIC) on the GCS Supercomputer JUWELS at Jülich Supercomputing Centre (JSC). B.H. and L.B. were supported by the European Research Council (ERC) under the European Union’s Horizon 2020 research and innovation programme (NeXource, ERC Grant agreement No. 865877). We furthermore thank the developers of the pipeline-analysis software, Manuel Kirchen and Sören Jalas from the University of Hamburg.References
- Rosenzweig et al. (1988) J. B. Rosenzweig, D. B. Cline, B. Cole, H. Figueroa, W. Gai, R. Konecny, J. Norem, P. Schoessow, and J. Simpson, Experimental observation of plasma wake-field acceleration, Phys. Rev. Lett. 61, 98 (1988).
- Chen et al. (1985) P. Chen, J. M. Dawson, R. W. Huff, and T. Katsouleas, Acceleration of electrons by the interaction of a bunched electron beam with a plasma, Phys. Rev. Lett. 54, 693 (1985).
- J. B. Rosenzweig et al. (1991) J. B. J. B. Rosenzweig, B. Breizman, T. Katsouleas, and J. J. Su, Acceleration and focusing of electrons in two-dimensional nonlinear plasma wake fields, Phys. Rev. A 44, R6189 (1991).
- Tajima and Dawson (1979) T. Tajima and J. M. Dawson, Laser electron accelerator, Phys. Rev. Lett. 43, 267 (1979).
- Ruth et al. (1985) R. D. Ruth, A. W. Chao, L. Morton, and P. B. Wilson, A Plasma Wake Field Accelerator, Part. Accel. 17, 171 (1985).
- Cros et al. (2019) B. Cros, P. Muggli, C. Schroeder, S. Hooker, P. Piot, J. England, S. Gessner, J. Vieira, E. Gschwendtner, J.-L. Vay, et al., Towards an Advanced Linear International Collider ALEGRO collaboration, arXiv (2019).
- Blumenfeld et al. (2007) I. Blumenfeld, C. E. Clayton, F. J. Decker, M. J. Hogan, C. Huang, R. Ischebeck, R. Iverson, C. Joshi, T. Katsouleas, N. Kirby, et al., Energy doubling of 42 GeV electrons in a metre-scale plasma wakefield accelerator, Nature 445, 741 (2007).
- D’Arcy et al. (2019a) R. D’Arcy, S. Wesch, A. Aschikhin, S. Bohlen, C. Behrens, M. J. Garland, L. Goldberg, P. Gonzalez, A. Knetsch, V. Libov, et al., Tunable Plasma-Based Energy Dechirper, Phys. Rev. Lett. 122, 034801 (2019a).
- Shpakov et al. (2019) V. Shpakov, M. P. Anania, M. Bellaveglia, A. Biagioni, F. Bisesto, F. Cardelli, M. Cesarini, E. Chiadroni, A. Cianchi, G. Costa, et al., Longitudinal Phase-Space Manipulation with Beam-Driven Plasma Wakefields, Phys. Rev. Lett. 122, 114801 (2019).
- Wu et al. (2019) Y. P. Wu, J. F. Hua, Z. Zhou, J. Zhang, S. Liu, B. Peng, Y. Fang, Z. Nie, X. N. Ning, C.-H. Pai, et al., Phase space dynamics of a plasma wakefield dechirper for energy spread reduction, Phys. Rev. Lett. 122, 204804 (2019).
- Litos et al. (2014) M. Litos, E. Adli, W. An, C. I. Clarke, C. E. Clayton, S. Corde, J. P. Delahaye, R. J. England, A. S. Fisher, J. Frederico, et al., High-efficiency acceleration of an electron beam in a plasma wakefield accelerator, Nature 515, 92 (2014).
- Loisch et al. (2018) G. Loisch, G. Asova, P. Boonpornprasert, R. Brinkmann, Y. Chen, J. Engel, J. Good, M. Gross, F. Grüner, H. Huck, et al., Observation of High Transformer Ratio Plasma Wakefield Acceleration, Phys. Rev. Lett. 121, 064801 (2018).
- Corde et al. (2015) S. Corde, E. Adli, J. M. Allen, W. An, C. I. Clarke, C. E. Clayton, J. P. Delahaye, J. Frederico, S. Gessner, S. Z. Green, et al., Multi-gigaelectronvolt acceleration of positrons in a self-loaded plasma wakefield, Nature 524, 442–445 (2015).
- Libov et al. (2018) V. Libov, A. Aschikhin, J. Dale, R. D’Arcy, K. Ludwig, A. Martinez de la Ossa, T. Mehrling, J. H. Roeckemann, L. Schaper, B. Schmidt, et al., FLASHForward X-2: Towards beam quality preservation in a plasma booster, Nuclear Instruments and Methods in Physics Research, Section A: Accelerators, Spectrometers, Detectors and Associated Equipment 909, 80 (2018).
- Joshi et al. (2018) C. Joshi, E. Adli, W. An, C. E. Clayton, S. Corde, S. Gessner, M. J. Hogan, M. Litos, W. Lu, K. Marsh, et al., Plasma wakefield acceleration experiments at FACET II, Plasma Phys. Control. Fusion 60, 034001 (2018).
- Hidding et al. (2012) B. Hidding, G. Pretzler, J. B. Rosenzweig, T. Königstein, D. Schiller, and D. L. Bruhwiler, Ultracold Electron Bunch Generation via Plasma Photocathode Emission and Acceleration in a Beam-Driven Plasma Blowout, Phys. Rev. Lett. 108, 35001 (2012).
- Li et al. (2013) F. Li, J. F. Hua, X. L. Xu, C. J. Zhang, L. X. Yan, Y. C. Du, W. H. Huang, H. B. Chen, C. X. Tang, W. Lu, et al., Generating High-Brightness Electron Beams via Ionization Injection by Transverse Colliding Lasers in a Plasma-Wakefield Accelerator, Phys. Rev. Lett. 111, 15003 (2013).
- Martinez de la Ossa et al. (2013) A. Martinez de la Ossa, J. Grebenyuk, T. Mehrling, L. Schaper, and J. Osterhoff, High-quality electron beams from beam-driven plasma accelerators by wakefield-induced ionization injection, Phys. Rev. Lett. 111, 245003 (2013).
- Vafaei-Najafabadi et al. (2014) N. Vafaei-Najafabadi, K. A. Marsh, C. E. Clayton, W. An, W. B. Mori, C. Joshi, W. Lu, E. Adli, S. Corde, M. Litos, et al., Beam Loading by Distributed Injection of Electrons in a Plasma Wakefield Accelerator, Phys. Rev. Lett. 112, 25001 (2014).
- Deng et al. (2019) A. Deng, O. S. Karger, T. Heinemann, A. Knetsch, P. Scherkl, G. G. Manahan, A. Beaton, D. Ullmann, G. Wittig, A. F. Habib, et al., Generation and acceleration of electron bunches from a plasma photocathode, Nat. Phys. 15, 1156–1160 (2019).
- Oz et al. (2007) E. Oz, S. Deng, T. Katsouleas, P. Muggli, C. D. Barnes, I. Blumenfeld, F. J. Decker, P. Emma, M. J. Hogan, R. Ischebeck, et al., Ionization-induced electron trapping in ultrarelativistic plasma wakes, Phys. Rev. Lett. 98, 084801 (2007).
- Aschikhin et al. (2016) A. Aschikhin, C. Behrens, S. Bohlen, J. Dale, N. Delbos, L. di Lucchio, E. Elsen, J.-H. Erbe, M. Felber, B. Foster, et al., The FLASHForward facility at DESY, Nuclear Instruments and Methods in Physics Research Section A: Accelerators, Spectrometers, Detectors and Associated Equipment 806, 175 (2016).
- D’Arcy et al. (2019b) R. D’Arcy, A. Aschikhin, S. Bohlen, G. Boyle, T. Brümmer, J. Chappell, S. Diederichs, B. Foster, M. J. Garland, L. Goldberg, et al., FLASHForward: Plasma wakefield accelerator science for high-average-power applications, Philosophical Transactions of the Royal Society A: Mathematical, Physical and Engineering Sciences 377, 20180392 (2019b).
- Ackermann et al. (2007) W. Ackermann, G. Asova, V. Ayvazyan, A. Azima, N. Baboi, J. Bähr, V. Balandin, B. Beutner, A. Brandt, A. Bolzmann, et al., Operation of a free-electron laser from the extreme ultraviolet to the water window, Nat. Photon. 1, 336 (2007).
- Schreiber and Faatz (2015) S. Schreiber and B. Faatz, The free-electron laser FLASH, High Power Laser Science and Engineering 3, e20 (2015).
- Bulanov et al. (1998) S. Bulanov, N. Naumova, F. Pegoraro, and J. Sakai, Particle injection into the wave acceleration phase due to nonlinear wake wave breaking, Phys. Rev. E 58, R5257 (1998).
- Suk et al. (2001) H. Suk, N. Barov, J. B. Rosenzweig, and E. Esarey, Plasma electron trapping and acceleration in a plasma wake field using a density transition, Phys. Rev. Lett. 86, 1011 (2001).
- Wittig et al. (2015) G. Wittig, O. Karger, A. Knetsch, Y. Xi, A. Deng, J. B. Rosenzweig, D. L. Bruhwiler, J. Smith, G. G. Manahan, Z. M. Sheng, et al., Optical plasma torch electron bunch generation in plasma wakefield accelerators, Phys. Rev. ST Accel. Beams 18, 081304 (2015).
- Wittig et al. (2016) G. Wittig, O. S. Karger, A. Knetsch, Y. Xi, A. Deng, J. B. Rosenzweig, D. L. Bruhwiler, J. Smith, Z. M. Sheng, et al., Electron beam manipulation, injection and acceleration in plasma wakefield accelerators by optically generated plasma density spikes, Nuclear Instruments and Methods in Physics Research, Section A: Accelerators, Spectrometers, Detectors and Associated Equipment 829, 83 (2016).
- Hidding et al. (2014) B. Hidding, G. G. Manahan, O. Karger, A. Knetsch, G. Wittig, D. A. Jaroszynski, Z. M. Sheng, Y. Xi, A. Deng, J. B. Rosenzweig, et al., Ultrahigh brightness bunches from hybrid plasma accelerators as drivers of 5th generation light sources, Journal of Physics B: Atomic, Molecular and Optical Physics 47, 234010 (2014).
- Wan et al. (2016) Y. Wan, C. J. Zhang, F. Li, Y. P. Wu, J. F. Hua, C. H. Pai, W. Lu, Y. Q. Gu, X. L. Xu, C. Joshi, and W. B. Mori, Colliding ionization injection in a plasma wakefield accelerator, Plasma Phys. Control. Fusion 58, 034015 (2016).
- Thompson et al. (2004) M. C. Thompson, J. B. Rosenzweig, and H. Suk, Plasma density transition trapping as a possible high-brightness electron beam source, Phys. Rev. ST Accel. Beams 7, 011301 (2004).
- Katsouleas (1986) T. Katsouleas, Physical mechanisms in the plasma wake-field accelerator, Phys. Rev. A 33, 2056 (1986).
- England et al. (2002) R. J. England, J. B. Rosenzweig, and N. Barov, Plasma electron fluid motion and wave breaking near a density transition, Phys. Rev. E 66, 016501 (2002).
- Grebenyuk et al. (2014) J. Grebenyuk, A. M. de la Ossa, T. Mehrling, and J. Osterhoff, Beam-driven plasma-based acceleration of electrons with density down-ramp injection at FLASHForward, Nuclear Instruments and Methods in Physics Research Section A: Accelerators, Spectrometers, Detectors and Associated Equipment 740, 246 (2014).
- Martinez de la Ossa et al. (2017) A. Martinez de la Ossa, Z. Hu, M. J. V. Streeter, T. J. Mehrling, O. Kononenko, B. Sheeran, and J. Osterhoff, Optimizing density down-ramp injection for beam-driven plasma wakefield accelerators, Phys. Rev. Accel. Beams 20, 091301 (2017).
- Xu et al. (2017) X. L. Xu, F. Li, W. An, T. N. Dalichaouch, P. Yu, W. Lu, C. Joshi, and W. B. Mori, High quality electron bunch generation using a longitudinal density-tailored plasma-based accelerator in the three-dimensional blowout regime, Phys. Rev. Accel. Beams 20, 111303 (2017).
- Zhang et al. (2019) C. Zhang, C.-K. Huang, K. A. Marsh, X. L. Xu, F. Li, M. Hogan, V. Yakimenko, S. Corde, W. B. Mori, and C. Joshi, Effect of fluctuations in the down ramp plasma source profile on the emittance and current profile of the self-injected beam in a plasma wakefield accelerator, Phys. Rev. Accel. Beams 22, 111301 (2019).
- Gonsalves et al. (2011) A. J. Gonsalves, K. Nakamura, C. Lin, D. Panasenko, S. Shiraishi, T. Sokollik, C. Benedetti, C. B. Schroeder, C. G. R. Geddes, J. Van Tilborg, et al., Tunable laser plasma accelerator based on longitudinal density tailoring, Nat. Phys. 7, 862 (2011).
- Faure et al. (2010) J. Faure, C. Rechatin, O. Lundh, L. Ammoura, and V. Malka, Injection and acceleration of quasimonoenergetic relativistic electron beams using density gradients at the edges of a plasma channel, Physics of Plasmas 17, 083107 (2010).
- Schmid et al. (2010) K. Schmid, A. Buck, C. M. S. Sears, J. M. Mikhailova, R. Tautz, D. Herrmann, M. Geissler, F. Krausz, and L. Veisz, Density-transition based electron injector for laser driven wakefield accelerators, Phys. Rev. Spec. Top.-AC 13, 91301 (2010).
- Gonsalves et al. (2019) A. J. Gonsalves, K. Nakamura, J. Daniels, C. Benedetti, C. Pieronek, T. C. De Raadt, S. Steinke, J. H. Bin, S. S. Bulanov, J. Van Tilborg, C. G. Geddes, C. B. Schroeder, C. Tóth, E. Esarey, K. Swanson, L. Fan-Chiang, G. Bagdasarov, et al., Petawatt laser guiding and electron beam acceleration to 8 gev in a laser-heated capillary discharge waveguide, Phys. Rev. Lett. 122, 084801 (2019).
- Butler et al. (2002) A. Butler, D. J. Spence, and S. M. Hooker, Guiding of high-intensity laser pulses with a hydrogen-filled capillary discharge waveguide, Phys. Rev. Lett. 89, 185003 (2002).
- Dickinson et al. (2014) E. Dickinson, H. Ekstroem, and E. Fontes, COMSOL Multiphysics: Finite element software for electrochemical analysis. A mini-review, Electrochemistry communications 40, 71 (2014).
- Schulz et al. (2015) S. Schulz, I. Grguraš, C. Behrens, H. Bromberger, J. T. Costello, M. K. Czwalinna, M. Felber, M. C. Hoffmann, M. Ilchen, H. Y. Liu, and others, Femtosecond all-optical synchronization of an X-ray free-electron laser, Nat. Commun. 6 (2015).
- Ammosov et al. (1986) M. V. Ammosov, N. B. Delone, and V. Krainov, Tunnel ionization of complex atoms and of atomic ions in an alternating electric field, Sov. Phys. JETP 64, 1191 (1986).
- Durfee and Milchberg (1993) C. G. Durfee and H. M. Milchberg, Light pipe for high intensity laser pulses, Phys. Rev. Lett. 71, 2409 (1993).
- Shalloo et al. (2018) R. J. Shalloo, C. Arran, L. Corner, J. Holloway, J. Jonnerby, R. Walczak, H. M. Milchberg, and S. M. Hooker, Hydrodynamic optical-field-ionized plasma channels, Phys. Rev. E 97, 053203 (2018).
- NIS (2020) NIST Atomic Spectra Database Ionization Energies (2020).
- John et al. (2014) D. John, O. Jens, S. Lucas, and L. Kai, Vorrichtung Mit Beweglicher Aufnahme Für Vakuumkammern (2014).
- Scherkl et al. (2019) P. Scherkl, A. Knetsch, T. Heinemann, A. Sutherland, A. F. Habib, O. Karger, D. Ullmann, A. Beaton, G. Kirwan, G. Manahan, et al., Plasma-photonic spatiotemporal synchronization of relativistic electron and laser beams, arXiv (2019).
- Okunev et al. (2016) I. Okunev, I. Morozov, and N. Nefedov, X-FEL Quadrupole with Gradient of 100 T/m, Physics Procedia 84, 101 (2016).
- Marchetti et al. (2017) B. Marchetti, R. Assmann, B. Beutner, J. Branlard, F. Christie, R. D’Arcy, W. Decking, U. Dorda, J. Herrmann, et al., X-Band TDS Project, in Proc. IPAC’17 (Copenhagen, 2017) pp. 184–187.
- D’Arcy et al. (2018) R. D’Arcy, A. Aschikhin, P. Gonzalez Caminal, V. Libov, and J. Osterhoff, Longitudinal Phase Space Reconstruction at FLASHForward Using a Novel X-Band Transverse Deflection Cavity, PolariX, in 9th International Particle Accelerator Conference (2018).
- D’Arcy et al. (2016) R. D’Arcy, V. Libov, and J. Osterhoff, A transverse deflecting structure for the plasma wakefield accelerator experiment, FLASHForward, in IBIC’16 (JACOW, Barcelona, 2016) pp. 760–763.
- Schröder et al. (2020) S. Schröder, K. Ludwig, A. Aschikhin, R. D’Arcy, M. Dinter, P. Gonzalez, S. Karstensen, A. Knetsch, V. Libov, C. A. Lindstrøm, et al., Tunable and precise two-bunch generation at FLASHForward, arXiv (2020).
- Lipka et al. (2010) D. Lipka, D. Nölle, M. Siemens, and S. Vilcins, Development of cavity BPM for the european XFEL, in Proceedings of LINAC (Tsukuba, 2010).
- Lipka et al. (2016) D. Lipka, A. Affeldt, R. Awwad, N. Baboi, R. Barret, B. Beutner, F. Brinker, W. Decking, A. Delfs, M. Drewitsch, et al., First experience with the standard diagnostics at the European XFEL injector, in IBIC’16 (Barcelona, 2016) pp. 14–19.
- Lindstrøm et al. (2020) C. A. Lindstrøm, R. D’Arcy, M. J. Garland, P. Gonzalez, B. Schmidt, S. Schröder, S. Wesch, and J. Osterhoff, Matching small functions using centroid jitter and two beam position monitors, Phys. Rev. Accel. Beams 23, 052802 (2020).
- Fonseca et al. (2002) R. A. Fonseca, L. O. Silva, F. S. Tsung, V. K. Decyk, W. Lu, C. Ren, W. B. Mori, S. Deng, S. Lee, T. Katsouleas, and J. C. Adam, OSIRIS: A three-dimensional, fully relativistic particle in cell code for modeling plasma based accelerators, in International Conference on Computational Science (Springer, Berlin, 2002) pp. 342–351.
- Lehe et al. (2016) R. Lehe, M. Kirchen, I. A. Andriyash, B. B. Godfrey, and J. L. Vay, A spectral, quasi-cylindrical and dispersion-free Particle-In-Cell algorithm, Comput. Phys. Commun. 203, 66 (2016).
- Ferran Pousa et al. (2019) A. Ferran Pousa, A. Martinez de la Ossa, R. Brinkmann, and R. W. Assmann, Compact multistage plasma-based accelerator design for correlated energy spread compensation, Phys. Rev. Lett. 123, 054801 (2019).
- Manahan et al. (2017) G. G. Manahan, A. F. Habib, P. Scherkl, P. Delinikolas, A. Beaton, A. Knetsch, O. Karger, G. Wittig, T. Heinemann, Z.-M. Sheng, et al., Ultrahigh 6D-brightness electron beams: single-stage plasma-based correlated energy spread compensation, Nat. Commun. 8 (2017).
- Dawson (1959) J. M. Dawson, Nonlinear Electron Oscillations in a Cold Plasma, Phys. Rev. 113, 383 (1959).