Rest-frame UV spectroscopy of extreme [OIII] emitters at : Toward a high-redshift UV reference sample for JWST
Abstract
Deep spectroscopy of galaxies in the reionization era has revealed intense C III] and C IV line emission (EW Å). In order to interpret the nebular emission emerging at , we have begun targeting rest-frame UV emission lines in galaxies with large specific star formation rates (sSFRs) at . We find that C III] reaches the EWs seen at only in large sSFR galaxies with [O III]+H EW Å. In contrast to previous studies, we find that many galaxies with intense [O III] have weak C III] emission (EW Å), suggesting that the radiation field associated with young stellar populations is not sufficient to power strong C III]. Photoionization models demonstrate that the spread in C III] among systems with large sSFRs ([O III]+H EW Å) is driven by variations in metallicity, a result of the extreme sensitivity of C III] to electron temperature. We find that the strong C III] emission seen at (EW Å) requires metal poor gas () whereas the weaker C III] emission in our sample tends to be found at moderate metallicities (). The luminosity distribution of the C III] emitters in our sample presents a consistent picture, with stronger emission generally linked to low luminosity systems () where low metallicities are more likely. We quantify the fraction of strong C III] and C IV emitters at , providing a baseline for comparison against samples. We suggest that the first UV line detections at can be explained if a significant fraction of the early galaxy population is found at large sSFR ( Gyr-1) and low metallicity ().
keywords:
cosmology: observations - galaxies: evolution - galaxies: formation - galaxies: high-redshift1 Introduction
Our understanding of galaxies in the reionization era has advanced considerably in the past decade following a series of multi-wavelength imaging surveys conducted with the Hubble Space Telescope (HST) (e.g. McLure et al., 2013; Bouwens et al., 2015; Finkelstein et al., 2015; Livermore et al., 2017; Atek et al., 2018; Oesch et al., 2018). These campaigns have revealed thousands of galaxies thought to lie at , providing our first census of the star-forming sources thought responsible for reionization (see Stark 2016; Dayal & Ferrara 2018 for reviews). The James Webb Space Telescope (JWST) will soon build on this progress, delivering the first detailed spectroscopic investigation of galaxies and opening the door for investigations of stellar populations and the build-up of metals in early star-forming systems.
The first glimpse of the nebular emission line properties of the population has emerged in the last several years, providing a preview of the science that will be possible with JWST. Deep rest-frame ultraviolet (UV) spectra have revealed intense line emission from highly-ionized species of carbon (C III], C IV; e.g., Stark et al. 2015a, b, 2017; Laporte et al. 2017; Mainali et al. 2017; Hutchison et al. 2019), indicating a hard ionizing spectrum that is not seen in typical star-forming galaxies at lower redshifts. The origin of the hard photons remains a matter of debate, with some suggesting AGN are required (Nakajima et al., 2018) and others suggesting that metal poor massive star populations are sufficient (Stark et al., 2017). While direct constraints on the rest-frame optical spectra await JWST, progress has been made possible by Spitzer/IRAC broadband photometry, with the colors of galaxies commonly revealing the presence of strong [O III]+H nebular emission. The typical rest-frame equivalent widths (EWs) at (EW Å; e.g., Labbé et al. 2013; Smit et al. 2015; De Barros et al. 2019; Endsley et al. 2020) indicate both strong line emission and weak underlying continuum, a signpost of galaxies dominated by very young stellar populations ( Myr), as expected for systems undergoing rapidly rising star formation histories.
Work is now underway to determine what these emission line properties are telling us about the reionization-era population. Central to these efforts are campaigns focused on galaxies with similar emission line properties at lower redshifts where they can be studied in greater detail. Sizeable samples of galaxies with large [O III]+H EWs have been identified in broadband imaging and grism spectroscopy (e.g. Atek et al., 2011; van der Wel et al., 2011; Maseda et al., 2013, 2014), revealing a young population of low mass galaxies with high densities of massive stars. In Tang et al. (2019, hereafter T19), we built on these studies, targeting the strong rest-frame optical lines in galaxies with [O III]+H EW Å. The spectra revealed that the ionizing efficiency of galaxies (defined as the ratio of the hydrogen ionizing photon production rate and the far-UV continuum luminosity at Å) increases with the [O III] EW. The ionization state of the nebular gas (as probed by the [O III]/[O II] flux ratio, hereafter O32) was also found to increase with the [O III] EW, suggesting very large ionization parameters in the most extreme line emitters. Investigations of nearby galaxies show nearly-identical trends (Chevallard et al., 2018), suggesting little redshift evolution in the trends with [O III] EW. Taken together, these studies indicate that very hard spectra and highly-ionized gas conditions are common in a short window following a burst of star formation in low mass galaxies.
Progress has also been made in our understanding of the rest-frame UV nebular line detections. A series of HST/UV spectroscopy programs have investigated the stellar populations and gas conditions required to power C III] and C IV in nearby star-forming galaxies (Senchyna et al., 2017; Senchyna et al., 2019; Berg et al., 2019). The results have revealed that C III] is intense in galaxies with moderately low metallicities () and large specific star formation rates (sSFRs), with the C III] EW increasing in lockstep with the [O III] EW (e.g. Rigby et al., 2015; Senchyna et al., 2017; Senchyna et al., 2019). Both nebular C IV and He II appear in lower metallicity galaxies (), provided the sSFR (or H EW) is large enough to guarantee a significant population of high-mass stars (Senchyna et al., 2019). The local C III] and C IV trends have been successfully explained in the context of photoionization models (Jaskot & Ravindranath, 2016; Gutkin et al., 2016; Byler et al., 2018; Plat et al., 2019). But in spite of these successes, the local studies have struggled to identify galaxies with C III] and C IV equivalent widths as large as seen at , making it challenging to interpret the emerging body of reionization-era spectra.
Rest-frame UV surveys at have provided a viable way forward, leading to the discovery of a significant number of intense UV line emitters in the last decade (Erb et al., 2010; Stark et al., 2014; De Barros et al., 2016; Amorín et al., 2017; Maseda et al., 2017; Vanzella et al., 2017; Berg et al., 2018; Le Fèvre et al., 2019; Feltre et al., 2020). To date, nearly all galaxies with UV line properties similar to those seen at (i.e., EW Å or EW Å) appear to be AGN (Nakajima et al., 2018; Le Fèvre et al., 2019), leading to the suggestion that stellar radiation fields may be incapable of powering the line emission seen in the reionization era. Motivated by the relationship between C III] and [O III] EW (Maseda et al., 2017; Du et al., 2020), efforts targeting star-forming galaxies have begun to focus on very young ( Myr) stellar populations with the most extreme optical line emission (EW Å), with one recently-discovered system identified in this manner displaying UV line properties that are nearly identical to those discovered in the reionization era (i.e., EW Å; Mainali et al. 2020). This finding suggests that stellar populations may be sufficient to power the nebular emission seen at , but without larger samples, it is impossible to generalize to the broader population of young galaxies with EW Å.
Motivated by this shortcoming, work is now underway to build large rest-frame UV spectral databases of galaxies with extreme optical line emission. The first statistical measures of the rest-frame UV spectral properties of galaxies selected to have large EW [O III]+H emission have emerged recently (Maseda et al., 2017; Du et al., 2020). Here we describe results of an ongoing spectroscopic campaign aimed at building on this progress. In particular, we discuss rest-frame UV spectra of extreme [O III] emitting galaxies at together with a smaller sample of galaxies. Our survey includes galaxies with the most extreme [O III]+H EWs ( Å), nearly greater than that in previous studies. Our goals are twofold. First we aim to build a large enough sample of galaxies with [O III]+H EW Å such that we can assess whether the C III] intensities seen at (i.e., C III] EW Å) commonly arise in galaxies with extremely young stellar populations, as suggested by the single galaxy identified in Mainali et al. (2020). And secondly, we seek to quantify the rate at which very metal poor stellar populations () appear among low mass extreme line emitting galaxies at via measurement of the fraction of nebular C IV emitters (with line ratios indicating a stellar origin) in our spectroscopic sample. This will provide a baseline for comparison against future measurements at , giving the control needed to track the rise of low metallicity massive-star populations in early galaxies matched to our sample in and sSFR.
The organization of this paper is as follows. We describe the spectroscopic sample and rest-frame UV spectroscopic observations, as well as our photoionization modeling procedures in Section 2. We then present the rest-frame UV spectra of our galaxies in Sections 3, and the physical properties inferred from spectra in Section 4. We discuss the implications of these results in Section 5 and summarize our conclusions in Section 6. We adopt a -dominated, flat universe with , , and H km s-1 Mpc-1. All magnitudes in this paper are quoted in the AB system (Oke & Gunn, 1983), and all equivalent widths are quoted in the rest-frame.
2 Observations and analysis
In this work, we aim to investigate the rest-frame UV spectra of galaxies with extreme EW optical line emission (extreme emission line galaxies, EELGs). We primarily focus on the extreme [O III] line emitting galaxies at , obtaining rest-frame UV spectra via ground-based optical spectrographs. In addition, we present near-infrared spectroscopy of a subset of sources at . The spectroscopic observations of each sample are described in Section 2.1 and Section 2.2, respectively. We then describe the photoionization modeling we apply to our sample in Section 2.3.
2.1 Optical spectroscopy of EELGs
The rest-frame UV spectra presented in this subsection build on a large spectroscopic effort to obtain rest-frame optical spectra of extreme [O III] emitters at in the CANDELS fields (T19; Tang et al. in prep) and the recent rest-frame UV spectroscopic surveys presented in Du et al. (2020) and Mainali et al. (2020). We direct the reader to T19 for the full description of the sample selection and the follow-up near-infrared (rest-frame optical) spectroscopic observations. The extreme [O III] emitters are required to have large rest-frame [O III] EWs with values Å, which are chosen to match the range expected to be common in reionization-era galaxies (e.g. Endsley et al., 2020). In order to measure the rest-frame UV emission lines of extreme [O III] emitters at , we have been conducting optical spectroscopic observations. Data were taken over three observing runs between 2018 and 2019 with optical spectrographs on the Magellan telescopes and the MMT.
The majority of our optical spectroscopic follow-up program is conducted using the Inamori-Magellan Areal Camera & Spectrograph (IMACS; Dressler et al. 2011) on the Magellan Baade telescope. We use IMACS in multi-slit spectroscopy mode. We designed two masks in the Cosmic Evolution Survey (COSMOS) field and the Ultra Deep Survey (UDS) field utilizing the ‘maskgen’ software, targeting extreme [O III] emitters (EW Å) at . The targets were placed on the IMACS masks using a similar selection function introduced in Section 2.2 of T19. We adjust the target priority based on the [O III] EWs inferred from HST grism spectra (at ; T19) or the -band flux excess (at ; Tang et al. in prep). Objects with the largest EWs ([O III] EW Å) are very rare, and thus we give the highest priority to the largest EW [O III] line emitting galaxies. In addition, we are particularly interested in comparing the properties derived from rest-frame UV spectroscopy and those from rest-frame optical spectroscopy. Therefore, we increase the priority of objects whose rest-frame optical spectra have been taken from our near-infrared spectroscopic follow-up program (T19; Tang et al. in prep).
The details of the IMACS observations are summarized in Table 1. We used the lines/mm grism blazed at degrees on the f/2 camera. The grism provides wavelength coverage from Å to Å, covering UV metal lines including C IV, O III], and C III], as well as Ly emission line at and [O II] emission lines at . The slit length and width of our IMACS mask were set to arcsec and arcsec, respectively. The arcsec slit width results in a spectral resolution of Å for the entire wavelength coverage. For the mask targeting the COSMOS field, we placed extreme [O III] emitters at with [O III] EW Å. The targets have -band magnitude from to , with a median value of . We observed this mask on 2019 March 06 and 07 for a total on-source integration time of 5.7 hours with an average seeing of arcsec. We placed extreme [O III] emitters at with [O III] EW Å on the mask targeting the UDS field. The -band magnitudes of these targets have a range from to (median ). This mask was observed on 2019 October 30 for an integration time of hours with seeing of arcsec. Each mask contains two slits stars to compute the absolute flux calibration. We also observed spectrophotometric standard stars at a similar airmass in each observing run in order to correct the instrumental response.
We reduced the IMACS spectra using the publicly available data reduction pipeline
Carnegie Observatories System for MultiObject Spectroscopy111https://code.obs.carnegiescience.edu/cosmos
The acronyms of the IMACS data reduction pipeline Carnegie Observatories System for MultiObject Spectroscopy, COSMOS, is incidentally the same as that of the Cosmic Evolution Survey. When mentioning COSMOS throughout the paper, we only refer to the Cosmic Evolution Survey.
(Dressler
et al., 2011; Oemler et al., 2017). During the observing runs, flat fields were
obtained using quartz high lamps, and arcs were obtained using HeNeAr lamps. The pipeline
performs bias subtraction, flat-fielding, wavelength calibration, sky subtraction, and
extracts the two-dimensional (2D) spectra. We created one-dimensional (1D) spectra from the
reduced 2D spectra using a boxcar extraction, with the extraction aperture matched to the
spatial profile of the object. We derived the transmission curve from the observed standard
star spectra and corrected the instrumental response. Slit loss corrections were performed
following the similar procedures in T19 (see also Kriek
et al. 2015).
We derived the spatial profile of each target from its HST F606W postage stamp, and
computed the fraction of the light within the slit to that of the total spatial profile.
The flux of each spectrum was then divided by the in-slit light fraction measured for each
object. Finally, the absolute flux calibration was performed using the slit stars, by
comparing the slit-loss corrected count rates of slit star spectra with the flux in the
Skelton
et al. (2014) catalogs. For objects on the mask targeting the COSMOS field, the
median line flux sensitivity of the IMACS spectra is erg s-1 cm-2
(assuming a line width of Å, i.e., the spectral
resolution) in the wavelength range ( Å) where C III]
(at ) or Ly (at ) is situated. This flux limit enables us to detect
emission lines () with rest-frame EW , , and Å for the sources
with the brightest (), median (), and the faintest () continuum
magnitudes. For objects on the mask targeting the UDS field, we reached a median
line flux sensitivity of erg s-1 cm-2 in
Å. This sensitivity provides line EW limits of , , and
Å for the sources with the brightest (), median (), and the faintest
() continuum magnitudes.
| Field | Number of Targets | R.A. | Decl. | P.A. | Instrument | Exposure Time | Average Seeing |
|---|---|---|---|---|---|---|---|
| (hh:mm:ss) | (dd:mm:ss) | (deg) | (hours) | (arcsec) | |||
| (1) | (2) | (3) | (4) | (5) | (6) | (7) | (8) |
| COSMOS | 10:00:21 | 02:18:00 | 80 | Magellan/IMACS | 5.7 | 0.8 | |
| UDS | 02:17:26 | 05:12:13 | 8 | Magellan/IMACS | 3.0 | 0.8 | |
| UDS | 02:17:26 | 05:05:40 | 86 | MMT/Binospec | 5.0 | 1.2 |
We also obtained optical spectra from the Binospec (Fabricant et al., 2019) on the MMT with multi-slit spectroscopy mode. We designed one mask in the UDS field using the ‘BinoMask’ software. Twenty-four extreme [O III] emitters ([O III] EW Å) were placed on the mask with the same selection function used in Magellan/IMACS observations. The targets have magnitude from to (median ). Spectra were taken using the lines/mm grism blazed at degrees, with wavelength coverage from Å to Å. The slit width was set to arcsec, which results in a spectral resolution of . We observed this mask on 2018 October 18 and 2018 November 03 for a total integration time of hours with an average seeing of arcsec. The mask contains 2 slit stars to derive absolute flux calibration, and standard stars were observed to correct the instrumental response. We summarize the details of the Binospec observations in Table 1.
We reduced the Binospec spectra using the publicly available data reduction pipeline222https://bitbucket.org/chil_sai/binospec (Kansky et al., 2019). The pipeline performs flat-fielding, wavelength calibration, and sky subtraction. Before extracting the 2D spectra, the pipeline corrects atmospheric extinction and instrumental response using the sensitivity curve derived from observations of standard stars. We extracted the 1D spectra using a boxcar extraction. The absolute flux calibration was performed using slit stars, and slit loss correction was performed following the same procedures used in Magellan/IMACS observations. The median line flux sensitivity of our Binospec spectra is erg s-1 cm-2 in Å, providing line EW limits of , , and Å for the sources with the brightest (), median (), and the faintest () continuum magnitudes.
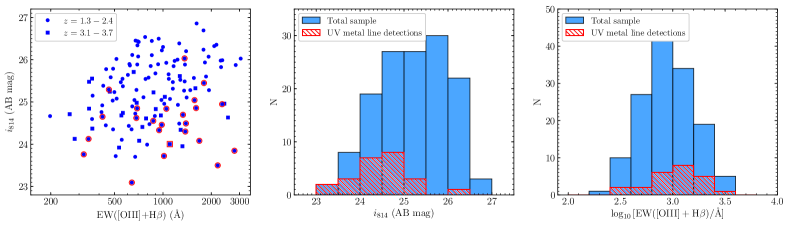
Our observations described above obtained optical (rest-frame UV) spectra for extreme [O III] emitters at . The magnitude distribution of these galaxies are shown in Figure 1. We also add available near-infrared (rest-frame optical) spectra which provide useful constraints on the ionizing radiation fields and the interstellar medium (ISM) conditions. We have obtained ground-based near-infrared spectra for of the sources (T19; Tang et al. in prep), with strong [O III] or H emission lines detected at S/N . Among these thirty-three objects, twenty-four have the full suite of strong rest-frame optical emission line detections ([O II], H, [O III], H), allowing us to measure ionization and metallicity sensitive line ratios (i.e., [O III]/[O II]). For the remaining objects without ground-based near-infrared spectroscopic observations, we utilize the H, [O III], or H emission lines measured from HST grism near-infrared spectra (Momcheva et al. 2016) if the grism S/N is larger than . This results in a sample of (of ) galaxies with [O III] flux measurements. We then compute [O III] EWs following T19 and (Tang et al. in prep). In Section 5, we will discuss the correlations between rest-frame UV spectral properties and rest-frame optical properties (i.e., [O III] EW).
2.2 Near-infrared spectroscopy of EELGs
We have additionally obtained rest-frame UV spectra for a smaller number of extreme optical line emitter candidates at . For galaxies in this redshift range, strong rest-frame optical emission lines (H, [O III]) are situated in Spitzer/IRAC m or m band, allowing us to identify extreme optical line emitters via large flux excesses in the or filters. Recent studies (e.g. Shim et al., 2011; Stark et al., 2013; Rasappu et al., 2016) reveal that extreme H emitters at () show blue (red) colors since the H emission line is within the () filter while the () filter is dominated by rest-frame optical continuum. For galaxies at , [O III]+H and H+[N II] emission lines are situated in and filters, respectively. In this subsection, we first describe selection of a sample of extreme optical line emitter candidates at using IRAC color excess methods, then describe the near-infrared (rest-frame UV) spectroscopic observations of a subset of the sources in this sample.
Our targets were selected from public samples of Lyman break galaxies (LBGs) with spectroscopic or photometric redshift measurements. Taking advantage of the spectroscopic redshifts provided in Stark et al. (2013) and Rasappu et al. (2016), we identified a subset of sources at and . Redshifts in the above papers are derived from Ly emission lines or UV absorption lines. We also selected LBGs with photometric redshifts at (and with photo- uncertainty to ensure robust redshift estimates) from Bouwens et al. (2015), where the redshifts are computed using EAZY (Brammer et al., 2008). To ensure self-consistent astrometry, we matched the coordinates of all the sources with spectroscopic or photometric redshifts to Skelton et al. (2014) catalogs. To efficiently identify extreme emission line galaxies, we required for sources at and for sources at . We also required S/N for the and fluxes so that the H EWs can be accurately derived from IRAC colors. The above color cuts correspond to H+[N II]+[S II] EW Å, which is greater than the average H EW estimated for star-forming galaxies in the reionization era (Labbé et al., 2013). For sources at , we do not apply an IRAC color cut since strong rest-frame optical emission lines are within both and filters.
We use the catalog of extreme optical line emitter candidates described above as input for our near-infrared spectroscopic observations. The spectra presented in this paper were obtained using the multi-object spectrograph MOSFIRE (McLean et al., 2012) on the Keck I telescope. We observed two masks on 2015 November 30, targeting six sources in the GOODS-S field and five sources in the COSMOS field. The remainder of the mask was filled with sources discussed in previous publications (Stark et al. 2017; T19). The slit widths were set to arcsec, resulting in a spectral resolution of ( Å at the blue end, Å, and Å at the red end, Å).
For the mask targeting the GOODS-S field, we observed six objects at . The primary targets of this mask are two extreme H emitting candidates, GOODS-S-46692 and GOODS-S-41253. GOODS-S-46692 is a bright galaxy () with a spectroscopic redshift derived from Ly emission, (Vanzella et al., 2008), and IRAC color . GOODS-S-41253 is fainter () with photometric redshift of and IRAC color . We also added four sources () with photometric redshifts in the range and less extreme IRAC colors ( to ) as fillers of this mask. We observed in -band, for a total on-source integration time of hours with an average seeing of arcsec. The spectral wavelength coverage is from Å to Å, allowing constraints on C III] for the chosen targets.
For the mask targeting the COSMOS field, we observed five objects with photometric redshifts at . Two bright targets () have photometric redshifts in the range with blue IRAC colors to . The other three targets () have photometric redshifts () where both IRAC filters are contaminated by emission lines. We observed the COSMOS mask in -band for a total on-source integration time of hours with an average seeing of arcsec. The observations enable constraints on the C III] line strengths for targets at and O III] for those at . Both of the masks were filled with extreme [O III] line emitting galaxies, which have been discussed in T19. We also placed two slit stars on each mask for absolute flux calibration, and we obtained the telluric star spectrum in order to correct the atmosphere absorption and instrument response. For both masks we performed a dither pattern of arcsec along the slit for sky subtraction. The near-infrared spectroscopic observations of extreme optical line emitter candidates are summarized in Table 2.
The spectra were reduced using the publicly available MOSFIRE Data Reduction Pipeline (DRP333https://keck-datareductionpipelines.github.io/MosfireDRP). The DRP performs flat-fielding, wavelength calibration, and background subtraction before extracting 2D spectra. We corrected the atmosphere absorption and instrument response using the spectrum of a telluric star, and performed slit loss correction the same way as described in T19 (see also Kriek et al. 2015). The absolute flux calibration was performed using the spectra counts and photometric flux of slit stars. We extracted 1D spectra using boxcar extraction with an aperture matched to the spatial profile of the object. Assuming a line width of Å ( the spectral resolution), the median line flux sensitivity is () erg s-1 cm-2 for spectra on the mask targeting the GOODS-S (COSMOS) field. We will present the results of our near-infrared spectroscopy of targets in Section 3.2.
| Target | R.A. | Decl. | Exposure Time | Average Seeing | ||||
|---|---|---|---|---|---|---|---|---|
| (hh:mm:ss) | (dd:mm:ss) | (mag) | (mag) | (hours) | (arcsec) | |||
| (1) | (2) | (3) | (4) | (5) | (6) | (7) | (8) | (9) |
| COSMOS-18502 | … | 10:00:16.82 | 02:22:03.4 | |||||
| COSMOS-19732 | … | 10:00:17.80 | 02:22:46.8 | |||||
| COSMOS-11116 | … | 10:00:24.48 | 02:17:33.1 | … | ||||
| COSMOS-15365 | … | 10:00:22.88 | 02:20:10.8 | … | ||||
| COSMOS-20187 | … | 10:00:16.56 | 02:23:02.6 | … | ||||
| GOODS-S-36712 | … | 4.74 | 03:32:10.32 | 27:44:25.4 | ||||
| GOODS-S-38450 | … | 4.58 | 03:32:09.06 | 27:43:51.8 | ||||
| GOODS-S-39157 | … | 4.17 | 03:32:09.32 | 27:43:38.8 | ||||
| GOODS-S-40887 | … | 4.50 | 03:32:13.24 | 27:43:08.4 | ||||
| GOODS-S-41253 | … | 4.28 | 03:32:11.30 | 27:43:01.3 | ||||
| GOODS-S-46692 | 4.66 | 03:32:10.03 | 27:41:32.6 |
2.3 Photoionization modeling
We utilize photoionization models to investigate the physical properties of the extreme emission line galaxies in our rest-frame UV spectroscopic sample. We fit the broadband photometry and observed emission lines from our objects using the Bayesian SED modeling and interpreting tool BEAGLE (version 0.23.0; Chevallard & Charlot 2016). The broadband photometry is obtained from the 3D-HST catalogs (Skelton et al., 2014), and we use the multi-wavelength data covering m. For each galaxy, we remove fluxes in filters that lie blueward of Ly to avoid introducing uncertain contributions from Ly emission and Ly forest absorption. We simultaneously fit the available rest-frame UV (C IV, O III], C III]; see Section 3) and optical ([O II], H, [O III], H) emission line fluxes. BEAGLE adopts the photoionization models of star-forming galaxies presented in Gutkin et al. (2016), which combines the latest version of Bruzual & Charlot (2003) stellar population synthesis (SPS) models with the photoionization code CLOUDY (Ferland et al., 2013) to describe the emission from stars and interstellar gas. The SPS models, which are described in more detail in Vidal-García et al. (2017, see their Section 2.1), incorporate updated stellar-evolution calculation by Bressan et al. (2012) for stars with initial masses up to M⊙ (Chen et al., 2015), combined with libraries of stellar spectra from various sources. In fitting the data, we will explore whether the models powered by stars can reproduce the emission line fluxes and SEDs of the sources in our spectroscopic sample. The fits will constrain the stellar population parameters (e.g., stellar mass, age, and sSFR) as well as the ionized gas properties (e.g., metallicity, ionization parameter).
We assume a constant star formation history, parameterizing the maximum stellar age in the range from Myr to the age of the Universe at the given redshift. For galaxies with spectroscopic redshifts measured from rest-frame UV or optical spectra, we fix the redshift of each object to its spectroscopic redshift. For sources with photometric redshift measurements only, we allow the model galaxy redshift to vary in the confidence interval of photo- for each object. We adopt a Chabrier (2003) initial mass function and allow the metallicity to vary in the range (; Caffau et al. 2011). The interstellar metallicity is assumed to be the same as the stellar metallicity () for each galaxy. We consider models with an electron density of cm-3, which is consistent with the average density inferred from typical star-forming galaxies at (e.g. Sanders et al., 2016; Steidel et al., 2016). We adjust the ionization parameter and the dust-to-metal mass ratio in the range and , respectively. We also consider models with a set of carbon-to-oxygen abundance ratios (C/O , , , , and (C/O)⊙, where the solar value (C/O)). To account for the effect of dust attenuation in the neutral ISM, we assume the Calzetti et al. (2000) extinction curve. We adopt an exponential distribution prior on the -band dust attenuation optical depths, fixing the fraction of attenuation optical depth arising from dust in the diffuse ISM to (Chevallard & Charlot, 2016). Finally, we adopt the prescription of Inoue et al. (2014) to include the absorption of IGM.
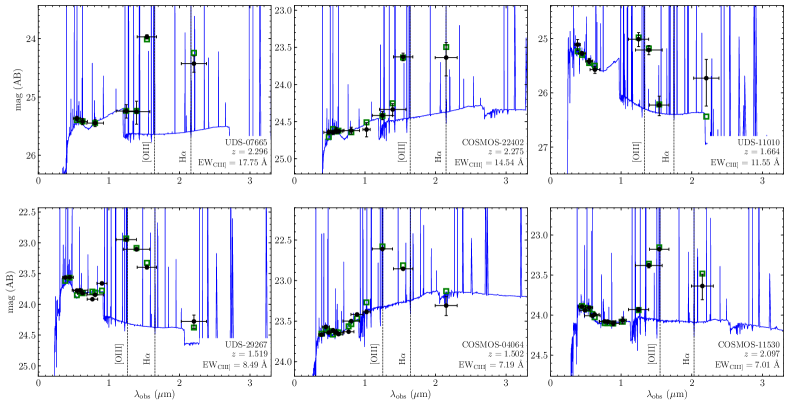
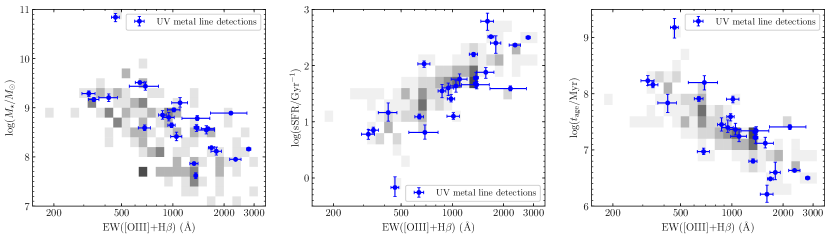
With the above parameterization, we fit the SEDs and available emission line constraints for the EELGs in our sample using the BEAGLE tool. For each free parameter described above, we adopt the median of the posterior probability distribution as the best-fit value. In Figure 2, we overplot the best-fit BEAGLE models on the observed broadband SEDs. The models are able to reproduce the observed SEDs and nebular emission line fluxes. We show the best-fit stellar population properties (stellar mass, sSFR, and stellar age) of the extreme [O III] emitters at in Figure 3, highlighting the distribution for the subset of sources with UV line detections. Similar to what has been demonstrated in T19, galaxies with largest [O III] EWs have the lowest stellar masses, the largest sSFRs, and the youngest stellar ages. Objects with EW Å show much larger sSFRs (median value of Gyr-1) and younger luminosity-weighted stellar ages (median of Myr, assuming a constant star formation history) than those with EW Å (median sSFR Gyr-1 and median age Myr). The latter subset corresponds to the average EW of galaxies (Labbé et al., 2013; De Barros et al., 2019; Endsley et al., 2020), whereas the more extreme optical line emitters are present in significant numbers at (Smit et al., 2014; Smit et al., 2015; Endsley et al., 2020), often associated with strong rest-frame UV line emission (Stark et al., 2017; Hutchison et al., 2019). Here we note that the young ages only refer to the stellar populations that are dominating the rest-frame UV and optical SED and do not exclude the presence of an underlying older stellar population.
The underlying rest-frame UV continuum predicted by BEAGLE is used to compute the UV emission line EWs for the objects without reliable continuum measurement from spectra as described in Section 3. For galaxies at in our spectroscopic sample, BEAGLE can successfully reproduce the large IRAC flux excess caused by nebular emission. We infer the H and [O III] EWs for our sources from BEAGLE models since their rest-frame optical spectra are not visible with current facilities. We will discuss the constraints inferred from photoionization modeling in Section 4.
3 Results
Here we describe nebular emission line constraints made possible by the rest-frame UV spectra we have obtained for our extreme emission line galaxies at (Section 3.1) and those we have observed at (Section 3.2).
3.1 Rest-frame UV spectra at
We characterize the rest-frame UV emission line strengths for the extreme [O III] emitters in our sample described in Section 2.1. The redshifts of the majority () of these sources were computed by fitting the [O III] emission line from the ground-based (T19) or HST grism-based (Momcheva et al., 2016) near-infrared spectra. For a subset () of objects at identified by -band excess (see Section 2.1), we do not yet have a rest-frame optical spectroscopic redshift. For these sources, we use the Ly line to compute the redshift if it is available, and otherwise we rely on the photometric redshift measurements from the Skelton et al. (2014) catalogs. Using the measured redshifts, we search for rest-frame UV emission lines including the blended C IV doublet, He II , O III] , Si III] , the blended C III] doublet, and Mg II .
Emission line fluxes are determined from the extracted 1D spectra. If an emission line feature is well-detected (S/N ), we apply a Gaussian fit to the line profile to derive the flux. Otherwise we calculate the line flux using direct integration. If the flux is measured with S/N , we consider the line as undetected and derive a upper limit. The line flux limit is computed by summing the error spectrum in quadrature over km/s ( Å for a single emission line, and Å for the blended C IV or C III] doublet). This integration range is chosen to be consistent with the upper bound of line widths found for UV metal lines (e.g. Bayliss et al., 2014; James et al., 2014; Stark et al., 2014; Mainali et al., 2017). For each detected line, we calculate the corresponding rest-frame EW. Robust measurements of continuum flux are required to compute EWs. For objects with bright continuum (S/N ) in the extracted 1D spectra, we derive the flux density in a clean window of Å near the emission line. For objects lacking confident continuum detection in our spectra, we derive the continuum flux from the best-fit SED models.
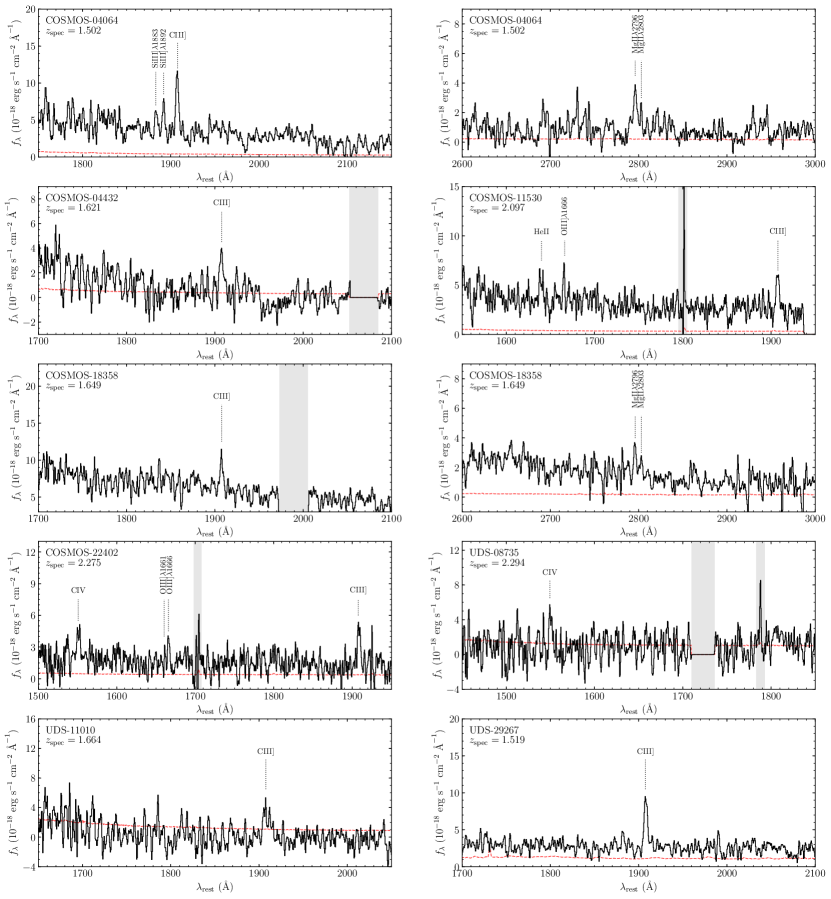
For sources in our sample (Table 3), we have detected at least one UV metal line (C IV, O III], C III]) with S/N . The measured emission line fluxes and EWs are presented in Table 4 and Table 5, respectively. In Figure 4 we show a subset of the sources with UV emission line detections. In most cases, the blended C III] doublet is the strongest rest-frame UV emission line (other than Ly). We measured C III] in extreme [O III] emitters with S/N . For three sources in which the spectral region around C III] is contaminated by sky line residuals, we nonetheless detect emission from O III] . In the remaining source we have a detection of the C IV line and a tentative detection () of the C III] emission.
For the galaxies in our sample with C III] detections, the measured fluxes are from erg s-1 cm-2 to erg s-1 cm-2. We compute the C III] EWs in the range from Å to Å, with a median value of Å. In comparison, Du et al. (2020) report a similar median C III] EW ( Å) for EELGs at which are selected following similar criteria in T19. Our C III] EWs are also consistent with the values of EELGs in Stark et al. (2014) (median EW Å) and in Maseda et al. (2017) (median EW Å). On the other hand, investigations of more massive, typical star-forming galaxies usually find much lower C III] EWs. The median C III] EW of the individual C III] detections in our sample is larger than that of star-forming galaxies at (median EW Å; Du et al. 2017), (median EW Å; Le Fèvre et al. 2019), and (average EW Å derived from composite spectrum; Shapley et al. 2003).
While the 20 C III] emitters in our sample represents a significant boost to the statistics in this very large sSFR regime, the majority of galaxies we observed do not show C III] emission. In many of these cases, the galaxies with non-detections are very faint in the continuum. As a result, our upper limits are often not sufficient to detect C III] or other lines. Indeed, the median flux limit for galaxies without a C III] detection is erg s-1 cm-2. Given the range of continuum magnitudes, we calculate a median upper limit of C III] EW = Å for our sample of non-detected sources. Clearly many of these systems may hold large EW ( Å) C III] line emission below our detection limits. In the future, we aim to obtain deeper exposures which should allow us to uncover emission lines in many of these galaxies. For the analysis in this paper, we will consider the non-detections when assessing the range of line strengths seen in our sample.
The second most commonly detected UV metal line in our sample is O III] . Seven galaxies are seen with O III] above (see Table 4 and Table 5). The O III] EWs range from Å to Å with a median value of Å. This is larger than the average O III] EW ( Å) of typical star-forming galaxies at in Shapley et al. (2003) but comparable to the EWs of O III] detections in other EELGs at (e.g. Stark et al., 2014; Mainali et al., 2020; Du et al., 2020). The O III] emission line is found to be weaker, showing up in only one object, COSMOS-22402 (Figure 4). The doublet flux ratio in this system is O III] . For other galaxies in our sample with O III] detections, we can place a limit on the O III] doublet ratio of at . This is consistent with both the observed doublet ratios (e.g. Stark et al., 2014; Senchyna et al., 2017; Berg et al., 2019; Mainali et al., 2020) and the ratio computed from theoretical transition probabilities (; Froese Fischer & Saha 1985).
We also detected the Si III] emission lines in COSMOS-04064 (Figure 4). The Si III] EWs (Si III] EW Å, Si III] EW Å) of this object are comparable to those measured for low mass, metal-poor galaxies at (Berg et al., 2018, 2019; Mainali et al., 2020). Two systems show Mg II emission (see Figure 4). Both sources show rather intense line emission, with COSMOS-04064 (Mg II EW Å, Mg II EW Å) appearing stronger than COSMOS-18358 (Mg II EW Å, Mg II EW Å). Since Mg II emission is resonantly scattered by neutral gas, it has been suggested that Mg II line properties may provide a valuable probe of the escape fraction of Ly photons (e.g. Henry et al., 2018; Feltre et al., 2018). We will discuss the implications of the Mg II strengths in a separate paper.
Nebular He II emission has been seen in both nearby and high-redshift star-forming galaxies (e.g. Erb et al., 2010; Shirazi & Brinchmann, 2012; Stark et al., 2014; Senchyna et al., 2017; Berg et al., 2018; Senchyna & Stark, 2019; Senchyna et al., 2019; Saxena et al., 2020), reflecting a very hard ionizing spectrum. The origin of strong nebular He II and lines is still a matter of debate, with possibilities including shocks, X-ray binaries, or metal-poor massive stars (e.g., Thuan & Izotov 2005; Senchyna et al. 2017; see also Shirazi & Brinchmann 2012). These papers generally showed that observed He II strengths typically appear larger than predicted by stellar population models, potentially suggesting that these models are missing sources of energetic photons at low metallicity. We detect confident He II emission () in only one galaxy (COSMOS-11530) in our sample. The spectrum of this galaxy also shows O III] and C III] (Figure 4). The He II EW is Å, comparable to the EWs derived for metal-poor dwarf galaxies at (e.g. Erb et al., 2010; Senchyna et al., 2017; Senchyna et al., 2019; Berg et al., 2019). However, the full width at half maximum (FWHM) of He II ( km/s; uncorrected for spectral resolution) is nearly twice that of the O III] emission line ( km/s at Å, i.e., close to the spectral resolution). The broad profile suggests a significant contribution from stellar winds, as is commonly seen in star-forming galaxies. Higher spectral resolution is required to distinguish the nebular and stellar components of He II in this system.
Metal poor galaxies have also been shown to power nebular C IV emission (e.g. Berg et al., 2016, 2019; Senchyna et al., 2019). We detect the blended C IV doublet with S/N in three galaxies (COSMOS-22402, UDS-07665, and UDS-08735; Figure 4). The data imply large C IV EWs in COSMOS-22402 ( Å) and UDS-07665 ( Å), with C IV/C III] ratios of . For UDS-08735, we see even stronger C IV (EW Å), with a very large C IV/C III] ratio (). We do not see any interstellar or stellar absorption in the vicinity of these lines, but we cannot rule out a modest level of emission line filling (and hence larger C IV line strengths). Higher resolution spectra will provide a more robust measure of the total C IV EWs in these systems. In Section 4.2, we will come back to investigate the ionizing nature of these three systems.
For one of the C III] emitters in our sample (COSMOS-04064), we are not able to constrain rest-wavelengths shorter than Si III] due to the low spectral sensitivity at the blue end of IMACS spectra. This galaxy was previously observed with Keck/LRIS in Du et al. (2020), with multiple UV lines detected (C IV , He II , O III] , C III] ). The C III] EW ( Å) measured from Du et al. (2020) is consistent with the value measured from our IMACS spectrum ( Å). When considering this galaxy in the following analysis, we will augment the fluxes and EWs measurements with the fluxes and EWs presented in Du et al. (2020).
| Target | R.A. | Decl. | UV slope | EW[OIII]+Hβ (Å) | sSFR (Gyr-1) | |||||
|---|---|---|---|---|---|---|---|---|---|---|
| COSMOS-04064 | 10:00:24.375 | +02:13:08.921 | ||||||||
| COSMOS-04156 | 10:00:43.037 | +02:13:11.174 | ||||||||
| COSMOS-04432 | 10:00:32.201 | +02:13:21.399 | ||||||||
| COSMOS-04870 | 10:00:17.219 | +02:13:37.980 | ||||||||
| COSMOS-11530 | 10:00:28.638 | +02:17:48.674 | ||||||||
| COSMOS-16680 | 10:00:48.029 | +02:20:57.824 | ||||||||
| COSMOS-18358 | 10:00:40.111 | +02:22:00.462 | ||||||||
| COSMOS-22402 | 10:00:17.831 | +02:24:26.350 | ||||||||
| COSMOS-24660 | 10:00:34.285 | +02:25:58.495 | ||||||||
| UDS-07447 | 02:17:18.162 | -05:15:06.275 | ||||||||
| UDS-07665 | 02:17:33.781 | -05:15:02.848 | ||||||||
| UDS-08735 | 02:17:34.564 | -05:14:48.779 | ||||||||
| UDS-11010 | 02:17:14.707 | -05:14:20.245 | ||||||||
| UDS-11457 | 02:17:08.085 | -05:14:16.134 | ||||||||
| UDS-11693 | 02:17:03.893 | -05:14:13.664 | ||||||||
| UDS-12154 | 02:17:52.098 | -05:14:09.985 | ||||||||
| UDS-12539 | 02:17:53.733 | -05:14:03.196 | ||||||||
| UDS-19167 | 02:17:43.535 | -05:12:43.610 | ||||||||
| UDS-21196 | 02:17:33.633 | -05:12:17.791 | ||||||||
| UDS-27151 | 02:17:36.141 | -05:11:06.180 | ||||||||
| UDS-29267 | 02:17:25.322 | -05:10:40.397 | ||||||||
| UDS-30015 | 02:17:36.517 | -05:10:31.256 | ||||||||
| UDS-30274 | 02:17:21.117 | -05:10:28.812 | ||||||||
| UDS-31649 | 02:17:06.433 | -05:10:13.584 |
| Target | C IV | O III] | O III] | C III] | |
|---|---|---|---|---|---|
| ( erg s-1 cm-2) | ( erg s-1 cm-2) | ( erg s-1 cm-2) | ( erg s-1 cm-2) | ||
| COSMOS-04064 | … | … | … | ||
| COSMOS-04156 | |||||
| COSMOS-04432 | … | ||||
| COSMOS-04870 | |||||
| COSMOS-11530 | |||||
| COSMOS-16680 | … | … | … | ||
| COSMOS-18358 | … | ||||
| COSMOS-22402 | |||||
| COSMOS-24660 | … | ||||
| UDS-07447 | |||||
| UDS-07665 | |||||
| UDS-08735 | |||||
| UDS-11010 | … | ||||
| UDS-11457 | |||||
| UDS-11693 | |||||
| UDS-12154 | … | … | |||
| UDS-12539 | … | ||||
| UDS-19167 | … | ||||
| UDS-21196 | |||||
| UDS-27151 | |||||
| UDS-29267 | … | ||||
| UDS-30015 | … | ||||
| UDS-30274 | … | … | … | ||
| UDS-31649 | … | … | … |
| Target | C IV | O III] | O III] | C III] | |
|---|---|---|---|---|---|
| (Å) | (Å) | (Å) | (Å) | ||
| COSMOS-04064 | … | ||||
| COSMOS-04156 | |||||
| COSMOS-04432 | … | ||||
| COSMOS-04870 | |||||
| COSMOS-11530 | |||||
| COSMOS-16680 | … | … | … | ||
| COSMOS-18358 | … | ||||
| COSMOS-22402 | |||||
| COSMOS-24660 | … | ||||
| UDS-07447 | |||||
| UDS-07665 | |||||
| UDS-08735 | |||||
| UDS-11010 | … | ||||
| UDS-11457 | |||||
| UDS-11693 | |||||
| UDS-12154 | … | … | |||
| UDS-12539 | … | ||||
| UDS-19167 | … | ||||
| UDS-21196 | |||||
| UDS-27151 | |||||
| UDS-29267 | … | ||||
| UDS-30015 | … | ||||
| UDS-30274 | … | … | … | ||
| UDS-31649 | … | … | … |
3.2 Rest-frame UV spectra at
| Target | Line | Line Flux | EW0 | |
|---|---|---|---|---|
| (Å) | ( erg s-1 cm-2) | (Å) | ||
| COSMOS-18502 | [C III] | () | () | |
| C III] | () | () | ||
| COSMOS-19732 | [C III] | () | () | |
| C III] | () | () | ||
| COSMOS-11116 | O III] | () | () | |
| O III] | ||||
| COSMOS-15365 | O III] | () | () | |
| O III] | () | () | ||
| COSMOS-20187 | O III] | () | () | |
| O III] | () | () | ||
| GOODS-S-36712 | [C III] | () | () | |
| C III] | () | () | ||
| GOODS-S-38450 | [C III] | () | () | |
| C III] | () | () | ||
| GOODS-S-39157 | [C III] | () | () | |
| C III] | () | () | ||
| GOODS-S-40887 | [C III] | () | () | |
| C III] | () | () | ||
| GOODS-S-41253 | [C III] | () | () | |
| C III] | () | () | ||
| GOODS-S-46692 | [C III] | () | () | |
| C III] | () | () |
The near-infrared spectra of the eleven targets described in Section 2.2 allow constraints to be placed on the strengths of rest-frame UV metal lines (O III], C III]). Each MOSFIRE -band spectrum is mostly () free from strong OH lines. In all but one case, the spectra do not show emission lines, so we put upper limits on the UV metal lines. For sources only having photometric redshifts, we report upper limits. In the one case where the spectroscopic redshift is already known (see §2.2), we can more confidently identify faint features because of the narrow wavelength window where the line is expected. For this object, we thus present upper limits on non-detected lines. To compute constraints on the UV line EWs, we estimate the underlying broadband continuum using our best-fit SED models (Section 2.3). For sources in the redshift range , the IRAC color is sensitive to the H strength. We quote H EWs implied by our photoionization model fits. We summarize the results for each source below and in Table 6.
The GOODS-S mask has six objects (see Table 2). GOODS-S-46692 is the only galaxy in our sample with a spectroscopic redshift from earlier efforts (Vanzella et al., 2008), with weak Ly emission (Ly EW Å) indicating a redshift of . The IRAC color is blue, suggesting the likely presence of strong H emission. The BEAGLE SED modeling suggests the IRAC color can be reproduced with H EW Å. In this redshift range, the Y-band spectrum covers the C III] doublet. Assuming that the velocity offset of Ly with respect to C III] is between and km s-1 (e.g. Erb et al., 2014; Stark et al., 2017), the [C III] emission line will be located between and Å, and the C III] line will be located between and Å. No emission lines are seen in either wavelength range. We note that two OH skylines are located in this wavelength window. However, the wavelength separation of individual emission lines of C III] at this redshift ( Å) guarantees that at least one of the two emission lines should be situated in a clean region of the spectrum. The upper limit of line flux for each individual component estimated from the clean regions is erg s-1 cm-2. Here and below, the flux limit is computed by summing the error spectrum in quadrature over km/s ( Å), as discussed in Section 3.1 To calculate the upper bound on the C III] EW, we compute the underlying continuum flux using the best-fitting SED model. Taken together with the flux limit, this implies a upper limit of rest-frame C III] EW Å for each component of the doublet. The measured Ly line flux of GOODS-S-46692 is erg s-1 cm-2, and the non-detection of C III] indicates that the flux of doublet is less than of the observed Ly flux, consistent with the C III]/Ly ratios observed in young dwarf galaxies (Stark et al., 2014; Du et al., 2020) and galaxies (Stark et al., 2015a, 2017).
GOODS-S-41253 () has the bluest IRAC [3.6]-[4.5] color on the GOODS-S mask, consistent with a large H EW ( Å). Given its photometric redshift, we expect the C III] emission line to lie in the -band. No significant feature (S/N ) is seen in the spectrum. Using the clean regions between OH skylines, we estimated the upper limits of line flux and EW for GOODS-S-41253 are erg s-1 cm-2 and Å. These limits correspond to individual doublet components.
The remaining four objects on the GOODS-S mask are GOODS-S-36712, GOODS-S-38450, GOODS-S-39157, and GOODS-S-40887. These galaxies have smaller flux excesses in the filter than the two sources described above, suggesting weaker H emission (EW Å). No feature was found in the MOSFIRE spectra, allowing us to place an upper limit on the C III] line strength. Using the clean regions between OH skylines, we estimated the upper limits of line flux are erg s-1 cm-2, corresponding to EW upper limits of Å for individual components of the doublet.
The COSMOS mask contains five galaxies, two of which (COSMOS-18502 and COSMOS-19732) have IRAC colors indicative of strong H emission ( Å and Å, respectively). Visual inspection of the MOSFIRE spectra reveals no convincing line features. The upper limit on the line flux between OH skylines is erg s-1 cm-2 for COSMOS-18502 and erg s-1 cm-2 for COSMOS-19732. Using the continuum from the best-fit SED models, we compute a EW upper limit (for individual doublet components) of Å for COSMOS-18502 and Å for COSMOS-19732.
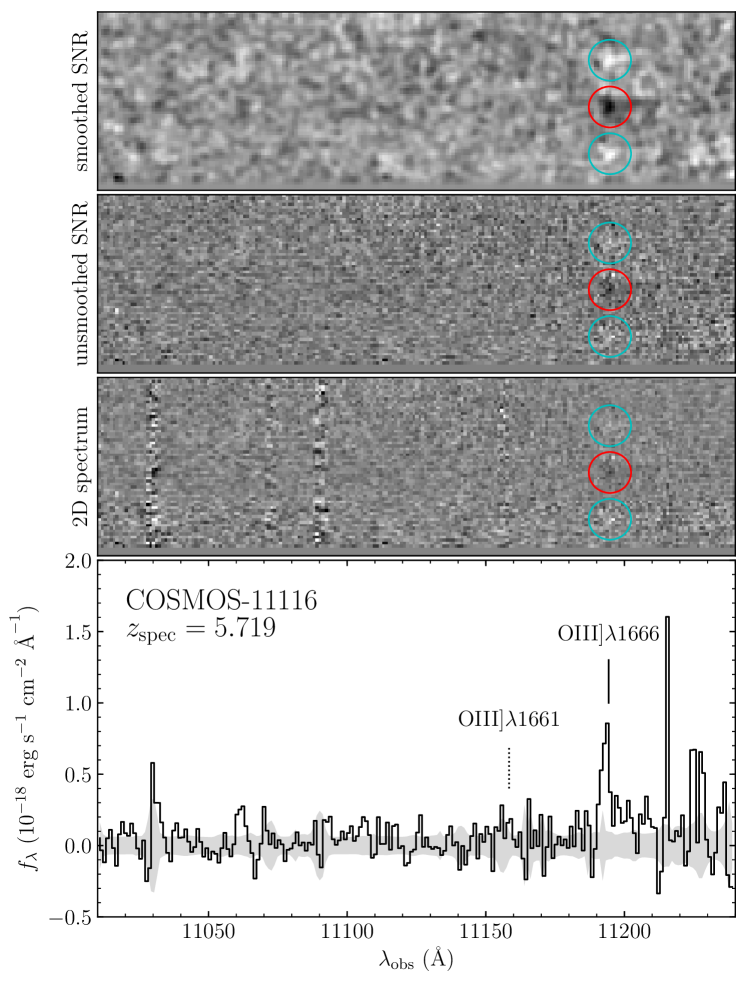
The COSMOS mask additionally contains three objects with photometric redshifts in the range , allowing us to constrain the strength of OIII] emission. The first of these sources, COSMOS-11116, has a photometric redshift of . We detect a emission line feature centered at Å with flux of erg s-1 cm-2 (Figure 5), which is at the expected spatial position of COSMOS-11116. The emission line is unresolved, with FWHM similar to the spectral resolution ( Å). It is shown that the emission line has the standard negative-positive-negative pattern resulting from the subtraction of AB dither pattern, indicating that the emission line is present in both dither positions. Given the photometric redshift, we conclude that the line is most likely either O III] or O III] . The separation between O III] doublets is Å at the expected redshift, which is more than the FWHM of the emission line, indicating that the O III] doublets must be resolved in the spectrum. If the emission line feature is O III] (O III] ), the systematic redshift of COSMOS-11116 would be (), which is consistent with the photometric redshift. Using the spectroscopic redshift derived from O III] (O III] ), we search for O III] (O III] ) which should be located at () Å. No convincing () emission line feature is detected at the expected position. Theoretical transition probabilities imply a O III] /O III] ratio (Froese Fischer & Saha, 1985), and the observed doublet ratio found in high-redshift star-forming galaxies is (e.g. Stark et al., 2014; Mainali et al., 2020). Therefore, we expect the O III] emission line to be stronger than O III] . As a result, we tentatively identify this emission line as O III] , implying a spectroscopic redshift of . Using the far-UV continuum flux density derived from the best-fitting BEAGLE model, we compute the rest-frame O III] EW ( Å). For the O III] component, we estimate a upper limit of erg s-1 cm-2. This implies a O III] doublet ratio of at , which is consistent with both the theoretical and observed doublet ratio. The corresponding upper limit of O III] EW is Å.
The other two objects we targeted at are COSMOS-15365 () and COSMOS-20187 (). No significant () feature is detected in either spectrum. Using the clean regions between OH skylines, we estimate upper limits for the flux and EW of individual components of the O III] doublets. For COSMOS-15365, we derive 5 upper limits of erg s-1 cm-2 and Å; whereas for COSMOS-20187, we compute erg s-1 cm-2 for the flux limit, and Å for the EW limit.
4 The Physical Nature of Galaxies with Intense Rest-Frame UV Nebular Emission
We have presented detection of rest-frame UV metal lines in galaxies at selected to have rest-frame optical line properties similar to those in the reionization era. The emission lines detected in our survey include C III], O III], C IV, Mg II, Si III], and He II, with equivalent widths reaching close to the values seen in sources at . In this section, we briefly summarize the physical properties of the UV line emitters in our sample (Section 4.1) and then investigate the nature of the ionizing sources responsible for powering the lines, considering whether any of our targets require AGN to explain the observed spectra (Section 4.2).
4.1 Gas Conditions and Stellar Populations
Previous studies have demonstrated that rest-frame UV lines tend to be very prominent in metal poor low mass galaxies that are in the midst of a significant star formation episode (e.g. Stark et al., 2014; Feltre et al., 2016; Gutkin et al., 2016; Jaskot & Ravindranath, 2016; Senchyna et al., 2017; Senchyna et al., 2019; Plat et al., 2019; Mainali et al., 2020). The BEAGLE photoionization models (Section 2.3) suggest a similar picture for our targets. A summary of inferred properties is listed in Table 3. We have previously described the physical properties of extreme [O III] emitters in our earlier papers (T19, Tang et al. in prep). Here we briefly describe the average properties of the galaxies with rest-frame UV line detections below but note that the galaxies are very similar to those from the parent sample. Readers are directed to our earlier papers for more detailed discussion of the implied gas and stellar population properties.
In nearly all of the galaxies with rest-frame UV metal line detections (more on the few exceptions in Section 4.2), models powered by stars are able to reproduce both broadband data and the observed nebular line detections (see fits in Figure 2 for examples). The data are best-matched by models with low stellar masses (median values of M⊙) with gas that has moderately low metallicity and large ionization parameter (medians of and ). As the UV continuum slopes tend to be very blue (median of ), the best-fit solutions tend to have minimal reddening from dust (median value of ). The rest-frame optical lines are very intense by virtue of our selection (median of EW Å), requiring models with large specific star formation rates (median of Gyr-1) and dominant young stellar populations.
The rest-frame UV emission line spectra (in particular, C III] and C IV) are also sensitive to the C/O ratio of the ionized gas. Previous studies have suggested that for stellar populations to power the most intense C III] emission lines (EW Å) seen at high redshift, the nebular gas must be enhanced in carbon, with super-solar C/O ratios (Nakajima et al., 2018). While none of our systems are detected above this C III] EW threshold, several are very close. We nonetheless find that the BEAGLE fits prefer sub-solar C/O abundance ratios ( or C/O⊙), as the observed C III] flux tends to be overpredicted in cases where solar C/O ratios are adopted. We can directly test this inference for systems with confident detections of both C III] and O III]. With our current dataset, this limits us to COSMOS-11530 and COSMOS-22402, each of which have high quality (S/N ) measurements of both lines. To infer the C/O ratios, we follow a similar procedure to other recent analyses (e.g. Erb et al., 2010; Stark et al., 2014; Mainali et al., 2020). We first compute the ratio of doubly ionized carbon and oxygen with PyNeb (Luridiana et al., 2015), using the flux ratios of C III] and O III] together with an estimate of the electron temperature derived from the dust-corrected O III] /[O III] flux ratio. We then apply a small ionization correction factor (ICF) to account for the fact that the fraction of carbon that is in the doubly-ionized state is not necessarily the same as that of oxygen. Following Mainali et al. (2020), we estimate the ICFs using scaling relations derived in Berg et al. (2019). If we conservatively adopt a metallicity range between and , we find ICF values of for COSMOS-11530 and for COSMOS-22402. Applying these values, we compute C/O ratios of C/O ( C/O⊙) for COSMOS-11530 and C/O ( C/O⊙) for COSMOS-22402. Both values are sub-solar, consistent with the range implied by the BEAGLE models.
The spectra and imaging of our targets thus support a picture whereby most of the galaxies in our sample are moderately low mass and metal poor systems that have recently experienced a major star formation event. These results are very similar to what has been found in the literature for similar galaxies (e.g. Erb et al., 2010; Stark et al., 2014; Berg et al., 2016, 2019; Vanzella et al., 2016, 2017; Senchyna et al., 2017; Senchyna et al., 2019), suggesting that the intense UV nebular emission can be explained as a natural byproduct of the hard radiation field associated with very young stellar populations that arise in metal poor galaxies with significant star formation. In the following section, we consider whether there are any sources in our sample which are unlikley to fit within this framework.
4.2 Ionizing Sources
In the last several years, work has focused on the development of rest-frame UV diagnostics that distinguish galaxies with spectra powered by stars from those powered by AGNs (e.g. Feltre et al., 2016; Gutkin et al., 2016; Nakajima et al., 2018). Owing to the presence of several high ionization emission features (C IV, He II), the rest-frame UV is particularly well-suited to identify line ratios that require a power-law AGN spectrum in the extreme UV. Here we consider our emission line detections in the context of several of these diagnostics, with the goal of identifying any sources that are not satisfactorily explained with massive stars. This step is a necessary prerequisite for assessing the frequency of low metallicity stellar populations in galaxies with extreme [O III] emission, while also providing some insight into how common AGN might be in similarly-selected samples at .
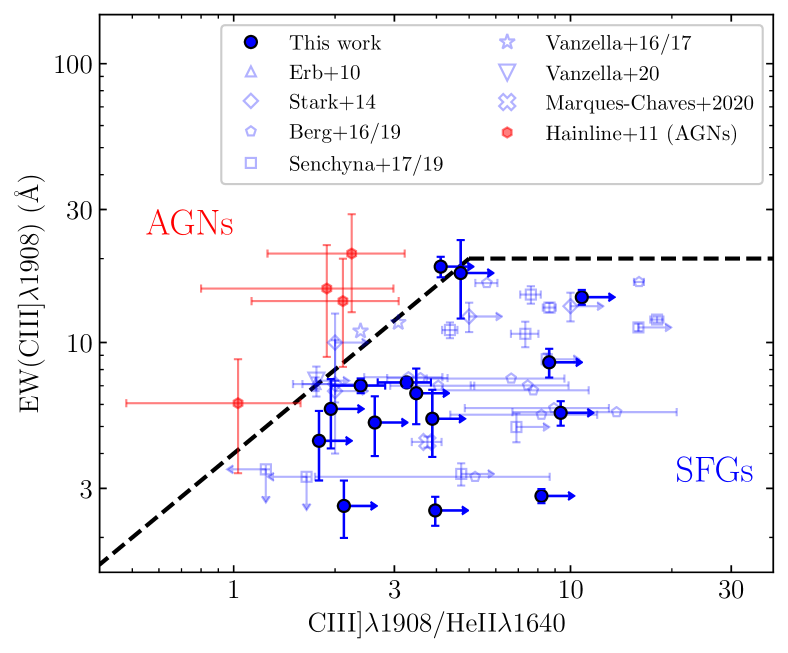
In Figure 6, we compare our C III] emitting galaxies to the C III] EW versus C III]/He II diagnostic developed by Nakajima et al. (2018). As can be seen in the figure, AGN are generally found with either larger C III] EWs or smaller C III]/He II ratios, the latter reflecting the stronger He II emission that arises from an AGN power-law spectrum. We use this diagnostic primarily because of the data we have available to us at present (our spectral coverage often does not extend to C IV). Note that many of our C III]/He II measurements are lower limits, owing to non-detections of He II. In addition to plotting the line ratios of our sample, we overlay those of AGNs (Hainline et al., 2011) and metal poor star-forming galaxies in the literature (Erb et al., 2010; Stark et al., 2014; Berg et al., 2016, 2019; Senchyna et al., 2017; Senchyna et al., 2019; Vanzella et al., 2016, 2017). The majority of galaxies in our sample lie in the part of the diagram associated with star-forming galaxies in the Nakajima et al. (2018) models. Comparison to the data in the literature gives a similar picture, with the bulk of the sample having either larger C III]/He II ratios () or lower C III] EWs than the AGNs in Hainline et al. (2011).
However we note that the two strongest C III] emitters in our sample (EW Å for COSMOS-04432 and EW Å for UDS-07665) are situated very close to the AGN boundary of the Nakajima et al. (2018) diagnostic. For both sources, the [O III] line is also extremely prominent, with EW Å (COSMOS-04432) and EW Å (UDS-07665). These objects thus have nebular line properties that are very similar to what has been seen at , but their position in Figure 6 suggests that AGN ionization might be required to explain the line ratios. The blended C III] doublets of both sources are narrower ( km/s) than the C III] emission seen in type I AGNs ( up to km/s; Le Fèvre et al. 2019) but similar to typical type II AGNs. While neither source has an X-ray counterpart within a arcsec radius, this is consistent with the low X-ray luminosities measured in the C III]-emitting AGNs discussed in Le Fèvre et al. (2019).
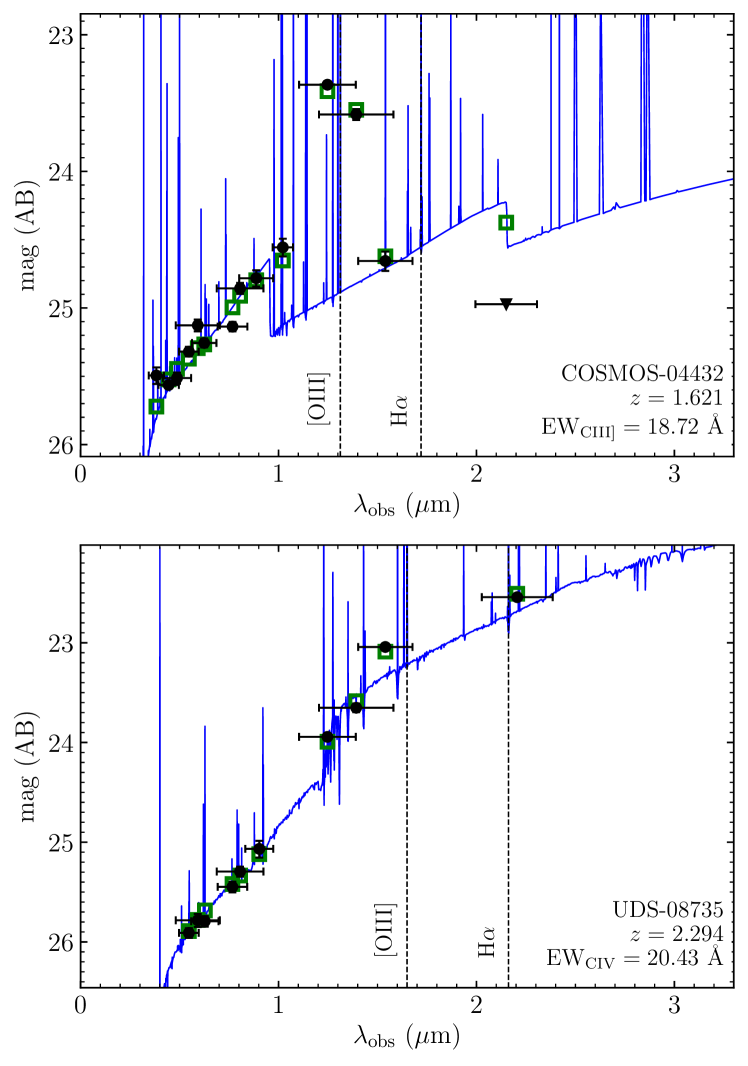
The broadband SEDs offer additional information. The data for UDS-07665 are shown in the upper left panel of Figure 2. Its UV slope is blue () and the near-infrared filters show the characteristic flux excess from strong [O III]+H emission. Such SEDs are very common at and are consistent with expectations for an unreddened metal poor galaxy dominated by very young stellar populations. The SED of COSMOS-04432 (top panel of Figure 7) appears very different. While the flux excess from the rest-frame optical nebular lines are present, the rest-frame UV continuum appears very red (), likely implying a significant dust covering fraction. Such red UV slopes are very similar to what is often seen in UV-selected galaxies with narrow-lined AGN (Hainline et al., 2011; Le Fèvre et al., 2019). While rare at , red UV colors are present in a subset of the population with intense [O III] emission (Smit et al., 2018). COSMOS-04432 appears to be an analog of these reddened reionization-era sources. Deeper spectra of this low-z analog should reveal detection of the higher ionization lines (C IV, He II) necessary to clarify whether a power-law AGN spectrum is indeed present.
The flux ratio of C IV and O III] provides an additional way to identify sources that may be powered by AGN (e.g., Feltre et al. 2016; Mainali et al. 2017). In particular, the intense radiation field powered by an AGN spectrum triply ionizes a significant fraction of the oxygen, leading to weaker O III] and smaller O III]/C IV flux ratios. Our sample contains five objects with nebular C IV measurements (COSMOS-04064, COSMOS-22402, UDS-07665, UDS-08735, UDS-19167), none of which show X-ray detections at their positions. Four of the five systems (all but UDS-08735) exhibit line ratios in the range O III]/C IV to , consistent with observations of metal poor star-forming galaxies (e.g. Stark et al., 2014; Berg et al., 2016; Vanzella et al., 2016). The BEAGLE models suggest a similar picture for these four galaxies, with low metallicities (), young stellar populations ( Myr for constant star formation) and large ionization parameters ( to ) required to reproduce the full spectra and photometry.
The rest-frame UV spectrum of UDS-08735 is more challenging to reproduce with stars as the primary ionizing source. The C IV EW is the largest in our sample ( Å), one of the only measurements known with similar values to those seen at . As with the sources described above, no X-ray source is present in the vicinity of the galaxy. However the O III]/C IV ratio ( at ) is much lower than in the systems described above, similar instead to the values observed in type II quasars (, Hainline et al. 2011; Alexandroff et al. 2013). The SED of UDS-08735 (bottom panel of Figure 7) reveals several additional differences. The UV slope is very red (), which as we described above is comparable to most AGNs which contaminate star-forming galaxy samples (Hainline et al., 2011; Le Fèvre et al., 2019). The flux excesses from the rest-frame optical lines are much weaker than in most of our galaxies, reflecting one of the lower [O III]+H equivalent widths in our sample (EW = Å). If powered by stars, this would indicate a much older stellar population (and hence softer radiation field) than is often linked to strong C IV (e.g., Senchyna et al. 2019). Indeed, the tension in reproducing UDS-08735 with stellar photoionization is readily apparent with BEAGLE. The best-fit C IV EW ( Å) is nearly 70 lower than what is observed. We conclude that this source is most likely an AGN and do not include it in the analysis in the following section.
5 Discussion
Over the last decade, spectroscopic searches have begun to discover a handful of reionization-era analogs with rest-frame UV properties similar to those seen at . In this paper, we have taken steps toward assembling a statistical sample of such systems at . Here we use this database for two purposes. First, we investigate the C III] EW distribution in galaxies with [O III]+H EW Å, with the goal of testing whether the C III] properties seen in the reionization era (C III] EW Å) are uniformly present in low mass galaxies dominated by extremely young stellar populations (Section 5.1). Second, we quantify the fraction of star-forming galaxies in our sample with strong UV line emission, with the goal of constraining how common low metallicity stellar populations are in low mass galaxies with large sSFRs at (Section 5.2). Both measurements will provide a baseline against which current and future observations can be compared.
5.1 A Baseline for interpreting C III] detections
Our first goal is geared toward understanding the high EW ( Å) C III] detections at . While AGNs have been discovered with similar UV line properties at lower redshifts (Le Fèvre et al., 2019), there are very few examples of star-forming galaxies powering comparable spectra, limiting our ability to interpret the nebular emission that has been detected at . Mainali et al. (2020) recently presented discovery of two gravitationally lensed galaxies with C III] EW Å, each of which was selected to have the intense [O III]+H emission ( Å) that is characteristic of galaxies dominated by very young stellar populations. Such systems are extremely rare at lower redshifts, so little is known about the range of rest-frame UV line spectra they exhibit.
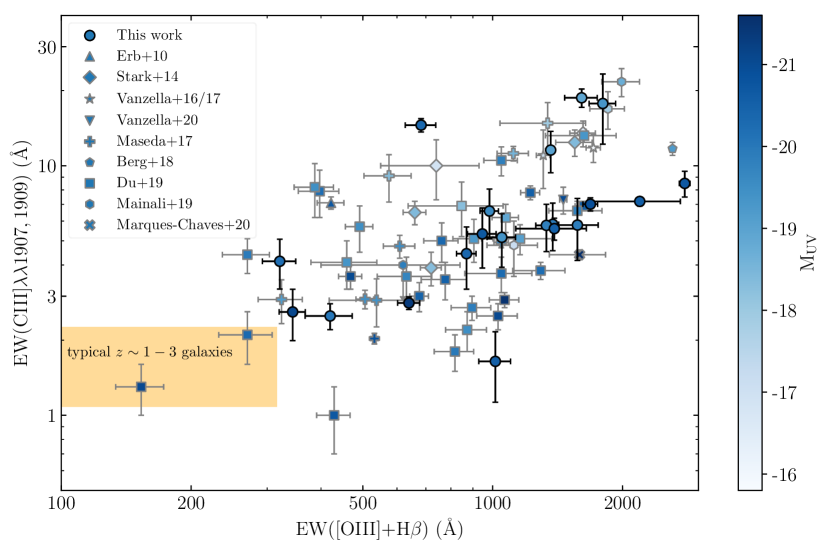
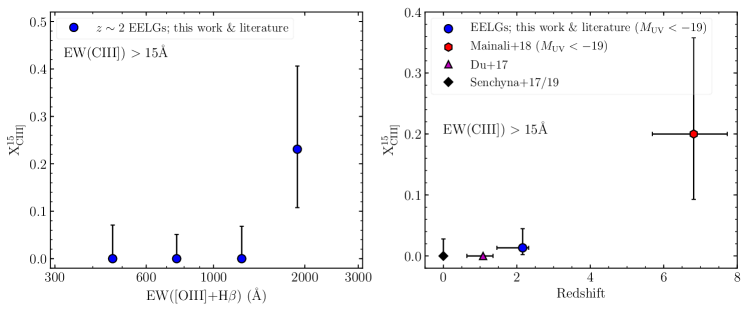
Following the survey presented in this paper as well as those in the literature that also satisfy our selection criteria (Mainali et al., 2020; Du et al., 2020), there is now rest-frame UV spectral coverage of C III] for systems with [O III]+H EW Å, including systems with [O III]+H EW Å. In Figure 8, we plot the dependence of C III] EW on the [O III]+H EW for galaxies in our sample and those in the literature. As has been seen previously (e.g., Senchyna et al. 2017; Senchyna et al. 2019; Maseda et al. 2017; Du et al. 2020), the largest EW C III] emission is seen predominantly at the largest rest-frame optical line EWs. The data in Figure 8 show that C III] detections with EW Å only begin to be seen in galaxies with [O III]+H EW Å. While such intense optical line emission is relatively rare among massive star forming galaxies at (e.g. Reddy et al., 2018), it becomes the norm among galaxies in the reionization era (e.g., Labbé et al. 2013; Smit et al. 2014; Smit et al. 2015; De Barros et al. 2019; Endsley et al. 2020).
We also see in Figure 8 that the C III] EWs that have been detected in galaxies ( Å) appear only at [O III]+H EW Å in our sample. Given the large sSFR required to power these optical line EWs (T19), this suggests that the C III] lines may be a natural consequence of the hard radiation field associated with extremely young stellar populations ( Myr). This trend is most clearly seen in the left panel of Figure 9, where we plot the fraction of galaxies observed in our sample and the literature with C III] EW Å as a function of [O III]+H EW. The C III] emitter fraction is defined in our analysis as the ratio of sources with C III] EW Å and the total number of galaxies for which we obtained C III] measurements. The latter quantity includes only those non-detections for which we can rule out C III] with EW Å (i.e., we do not include spectra that are too shallow to detect strong emission). Of the galaxies we have observed with sufficient sensitivity at [O III]+H EW Å, none have been found to exhibit C III] above this threshold. In the galaxies we have targeted with [O III]+H EW Å, we find galaxy that has C III] EW Å (here we have excluded COSMOS-04432, the candidate AGN discussed in Section 4.2), implying a fraction of . Error bars are derived by adopting the statistics from Gehrels (1986). If we include sources in Du et al. (2020) and Mainali et al. (2020), this fraction increases to . These results suggest that the C III] EWs seen in the reionization era ( Å) require very strong optical line emission, becoming somewhat more common in galaxies with [O III]+H EW Å, similar to previous results at and (Senchyna et al., 2017; Mainali et al., 2020; Du et al., 2020).
What is perhaps most striking about the results described above is that intense C III] emission is not found to be the norm among the most extreme optical line emitters. Indeed, four of the five galaxies in our [O III]+H EW Å sample have C III] EW below Å. This includes the most intense line emitter UDS-29267 ([O III]+H EW Å) in our sample. Based on its optical lines, we naively expected to see among the strongest C III] in our sample. However the spectrum revealed a detection with C III] EW Å, well below the values that have been seen at . Clearly the hard radiation field that emerges from young stellar populations is not a sufficient condition for intense C III] emission.
The BEAGLE photoionization models suggest that the spread in C III] at [O III]+H EW Å is driven by metallicity. As detailed in Section 2.3, the modeling results are based on fits to the rest-frame UV and optical nebular lines together with the broadband continuum, and here we focus on those sources with extreme [O III]+H EW (1500 Å). The results indicate that those galaxies in this subset with strong C III] ( Å) tend to require lower metallicities (median of ), whereas those with weaker C III] ( Å) are fitted with more moderate metallicities (median of ). The strong and weak C III] emitters are found to have nearly-identical ionization parameters (median of and , respectively) and fairly similar specific star formation rates (median of Gyr-1 and Gyr-1). Both subsets prefer sub-solar C/O ratios ( C/O⊙), and deviations from this lead to tension with the observed C III] strength. The photoionization models thus suggest that metallicity is the primary driver of the spread in C III] at fixed [O III] EW. More work is needed to confirm this trend with the temperature-sensitive auroral lines. For the few existing cases in which high S/N auroral line detections exist, the direct-method metallicities confirm the presence of low metallicities () in the most extreme C III] emitters (see e.g., Mainali et al. 2020).
The luminosity distribution of our galaxies suggests a similar picture, with the strength of C III] emission (at fixed [O III]+H EW) generally increasing toward lower luminosities (see color bar in Figure 8) where low metallicity gas and stars are more likely. To investigate the dependence of C III] on UV luminosity, we quantify the average C III] EW in bins of for galaxies with extreme [O III]+H emission (EW Å), including those in our sample and those in the literature selected similarly (Mainali et al., 2020; Du et al., 2020). To avoid biasing our results, we only consider those spectra with the sensitivity to detect weak C III] emission (EW Å). As we will discuss below, this limits our sample of lower luminosity galaxies where continuum magnitudes are faint. Focusing first on luminous galaxies (), there are four [O III]+H EW Å systems in our sample with deep C III] constraints. Of these, none have C III] EW Å, and the median value is just C III] EW Å. At lower luminosities (), there are only three [O III]+H EW Å galaxies with deep enough spectra to detect weak C III], allowing a fair comparison with our bright sample. Two of these are from Mainali et al. (2020) and the third is from Du et al. (2020). Notably, all three have C III] EW Å, with a median value of C III] EW Å. While samples are admittedly small, these results suggest that at , the strongest C III] emission (EW Å) is found primarily in low luminosity galaxies.
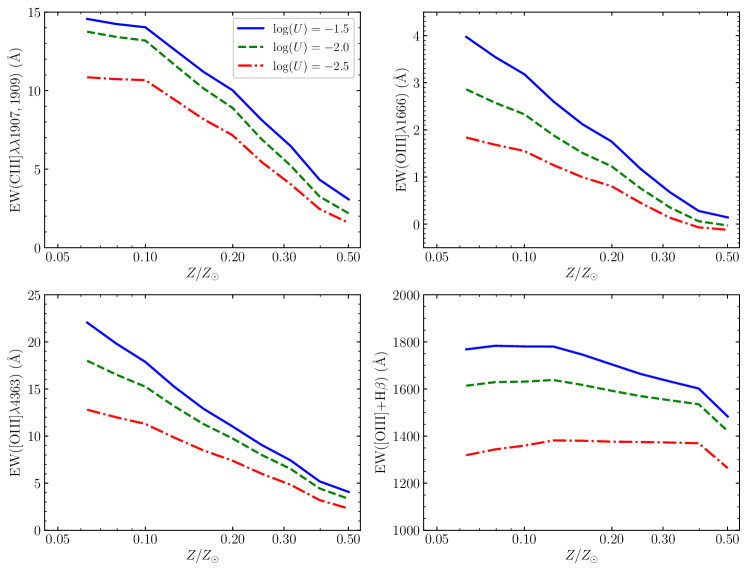
The role of metallicity in regulating C III] has been pointed out elsewhere (Erb et al., 2010; Stark et al., 2014; Rigby et al., 2015; Jaskot & Ravindranath, 2016; Senchyna et al., 2017; Byler et al., 2018; Plat et al., 2019; Du et al., 2020; Ravindranath et al., 2020), reflecting increased collisional excitation in higher temperature gas and the harder radiation field associated with metal poor massive stars. But what is perhaps surprising about our results is that C III] appears to react more to a change in metallicity than [O III] over the range considered here ( to ). This can be seen more clearly in Figure 10, where we plot the dependence of the C III] EW on metallicity in BEAGLE at fixed stellar age ( Myr, assuming constant star formation history) and fixed ionization parameter. Since ionization parameter is well-known to anti-correlate with metallicity, we show the trend for three ionization parameters (, , ). We also display the same trends for two temperature-sensitive auroral lines (O III] and [O III] ) and for the [O III]+H optical lines. Between and , we see that the C III] EW increases by roughly a factor of two (at fixed ). This closely tracks the rise seen in both auroral lines, suggesting that C III] is very sensitive to the gas temperature in this metallicity regime. In contrast, the [O III]+H EW remains nearly constant over the metallicity range. Even accounting for the larger ionization parameters expected at lower metallicity ( at and at according to Pérez-Montero 2014 and Sanders et al. 2020), the BEAGLE models predict that the [O III]+H EW will only increase by a factor of over this metallicity range. While this is computed for stellar ages of Myr, we find similar results for older age populations. A similar picture was previously discussed in Jaskot & Ravindranath (2016) (see their Figure 9). Because we are plotting equivalent width, the trend seen in Figure 10 is sensitive to how the underlying continuum varies with metallicity. Since bluer colors are produced by lower metallicity stellar populations, we expect a slight decline in optical EWs with respect to those seen in the UV as we look toward lower metallicities. However, we have verified using BEAGLE that the trends seen in Figure 10 remain when considering only line luminosity (see also Jaskot & Ravindranath 2016), suggesting that continuum is not a dominant factor.
The physical explanation for the divergent metallicity trends of the C III] and [O III] luminosities is straightforward and has been suggested previously in Plat et al. (2019). The emissivity of both lines is proportional to the collisional excitation rate, which in turn depends on the ionized gas temperature and the energy of the excited state as . For C III] , the excited state has an energy of K, while for [O III] , the energy is just K. It is straightforward to see that as the gas temperature increases from to K, the emissivity of C III] increases considerably more than that of [O III]. The two auroral lines shown in Figure 10 have excited states with energies similar to that of C III] ( K for O III] and K for [O III] ), leading to a similar trend with metallicity. These results suggest that as we approach the metallicity range of (an important regime at ; e.g., Jones et al. 2020), the collisionally-excited UV lines will play an increasingly important role in cooling owing to the higher energies of their excited states (Plat et al., 2019) and as a result, should be increasingly prominent in deep rest-frame UV spectra. It is conceivable that early galaxies will be significantly enhanced in oxygen relative to iron (e.g. Steidel et al., 2016; Strom et al., 2018; Sanders et al., 2020; Jeong et al., 2020; Topping et al., 2020), leading to a harder ionizing spectrum and potentially stronger nebular emission. Following the same photoionization modeling approach as Topping et al. (2020), we find that variations in stellar metallicity at a given gas-phase metallicity do not significantly change the strength of C III] at fixed [O III] EW. The dispersion in C III] at a given [O III] EW appears to be dominated by the variations in gas-phase metallicity described above.
The results laid out above have implications for our understanding of the C III] detections at (Stark et al., 2017; Hutchison et al., 2019). In addition to having extremely strong C III] (EW Å), these galaxies are found to be quite luminous ( and ). As we outlined above, at , very strong C III] is primarily seen among lower luminosity () galaxies, as it is in these systems where the metal poor gas required to support such intense emission is more likely to be found. The presence of strong C III] emission in luminous galaxies at may be one of the first hints of evolution in the luminosity-metallicity relationship between and , with lower metallicities at fixed in the reionization-era population. Current sensitivity limits at allow us to detect C III] only in galaxies with extreme [O III]+H emission, so these inferences are valid only for the subset of the population with very large sSFR. The emergence of new samples of bright galaxies at with intense optical line emission (e.g., Endsley et al. 2020) should allow improved statistics on the C III] EW distribution in this extreme population in the near future.
5.2 Redshift evolution of UV line fractions
The results presented in this paper allow us to revisit the redshift evolution of the fraction of galaxies with intense (EW Å) C III] emission (right panel of Figure 9). Here we have updated the datapoint from Mainali et al. (2018) to include the new detection presented in Hutchison et al. (2019) and reconsider the measurement at (see below). While statistics are still limited, it is clear that the fraction of galaxies with strong C III] (EW Å) at () is larger than in samples at lower redshift. Some of this evolution can be explained by recent results which demonstrate the emergence of a significant population of extreme sSFR galaxies ( Gyr-1) with [O III]+H EW Å at (De Barros et al., 2019; Endsley et al., 2020), as it is only above these large optical line EWs where intense C III] emission becomes common in star-forming galaxies (e.g., left panel of Figure 9).
However if the evolution toward larger [O III]+H EWs is the entire explanation for the rise in the frequency of detecting intense C III] emission, then we would expect the C III] fraction in our sample of EELGs to be similar to that seen in the reionization era. To test this, we have attempted to construct a sample that is matched in [O III]+H EW to that in the sample. We include galaxies with [O III]+H EW Å and , including our sample ( sources) together the [O III]-selected samples that satisfy these criteria in Du et al. (2020) ( sources) and Mainali et al. (2020) ( source). The median [O III]+H EW in this sample is Å, similar to that in samples at (Labbé et al., 2013; De Barros et al., 2019; Endsley et al., 2020). Of the galaxies that satisfy these criteria, only has C III] EW Å. This implies a fraction of , much lower than seen at . While the uncertainties at remain sizeable, this suggests that the emergence of extreme sSFR systems at (Endsley et al., 2020) is not enough on its own to drive the large C III] emission we have observed in early galaxies. As described in Section 5.1, we suggest that this may additionally reflect evolution toward lower metallicities at earlier times. Indeed, if the luminous galaxy population evolves from to between and , we would expect to see a significant rise (up to ) in C III] EWs without any evolution in sSFR (Figure 10). We thus suggest that the combination of larger sSFRs and lower metallicities likely work together to explain the large C III] EWs that are being observed at .
Finally we compare the fraction of star-forming sources in our sample with nebular C IV emission to that seen at . Since powering C IV requires a hard ionizing spectrum associated with very low metallicity stars (), this comparison will allow us to investigate evolution in the incidence of very low metallicity stellar populations among galaxies with extreme optical line emission. The first step is to assemble the statistical baseline at . Here we consider objects with large [O III]+H EWs ( Å) and , focusing on galaxies at , where C IV is visible from the optical spectrographs we have used. Taking together our sample and the extreme [O III] emitter sample in Du et al. (2020) (and removing the AGN candidate discussed in Section 4.2), we find that only out of sources at show C IV EW Å, and none of them shows C IV EW Å. For very low metallicity systems, we might begin to see weaker [O III] emission, so we also consider galaxies with [O III]+H EW Å. Here there are another objects from both our sample and that of Du et al. (2020) that have deep C IV constraints, but none show detections of C IV with EW Å.
These results stand in sharp contrast to the two C IV detections at , both of which show EW Å in galaxies with to (Stark et al., 2015b; Mainali et al., 2017; Schmidt et al., 2017). The absence of such line emission in similar luminosity systems at is suggestive of a shift toward some combination of harder ionizing spectra and weaker underlying UV continuum in a subset of galaxies. Since we are considering samples of similar optical line EW (and similar sSFR), this cannot simply be explained by evolution towards galaxies dominated by younger stellar population (i.e., larger [O III]+H EW). Instead, this likely implies the emergence of massive-star populations dominated by very low metallicities at early times. Ultimately larger datasets at will present a clearer picture of the C IV EW distribution in the reionization era and the physical cause of any evolution that is present. Statistical samples at will continue to be critical in the interpretation of this population.
6 Summary
We have presented rest-frame UV spectroscopic observations of galaxies with extreme [O III]+H line emission at and sources at . The galaxies have rest-frame [O III]+H EWs Å, similar to the EWs of galaxies in the reionization era (e.g. Labbé et al., 2013; Smit et al., 2015; Endsley et al., 2020). The dataset allows us to measure the C III] and C IV] emission lines, which are found to be intense (EW Å) in galaxies (Stark et al., 2015a, b, 2017; Mainali et al., 2017; Hutchison et al., 2019). Using this statistical sample of reionization-era analogs at , we aimed to interpret the nebular line emission emerging at with two goals. First, we investigated the C III] EW distribution in galaxies with [O III]+H EW Å, to see whether the EW Å C III] line emission are uniformly present in these systems. Second, we sought to constrain the fraction of strong UV line emitters in our sample of large sSFR galaxies, providing a baseline at to compare with future observations at . We summarize our findings below:
(1) We detect rest-frame UV emission lines (C IV , He II , O III] , Si III] , C III] , or Mg II ) in extreme [O III] emitters at in our sample using Magellan/IMACS and MMT/Binospec. Four objects show C IV emission lines (EW Å) with S/N , with one of the C IV detections coming from Du et al. (2020). The blended C III] doublet has been detected in sources, with EW Å and a median value of Å. The C III] EWs measured in our sample are consistent with those of EELGs in the literature (Stark et al., 2014; Maseda et al., 2017; Du et al., 2020), and are larger than those of more massive, typical star-forming galaxies at (e.g. Shapley et al., 2003; Du et al., 2017). The largest C IV and C III] EWs ( Å) found in our sample are comparable to that found at .
(2) We find that for all but one of the galaxies with UV metal line detections at , the nebular emission lines and broadband photometry can be reproduced by photoionization models powered by stars. The models suggest these systems are characterized by low stellar masses (median M M⊙), little dust reddening (median ), large ionization parameters (median ), and low metallicities (median ). Both the observed C III]/O III] ratios and photoionization models imply sub-solar carbon-to-oxygen ratios (C/O C/O⊙). The large [O III]+H EWs (median value of Å) indicate very large sSFRs (median Gyr-1), suggesting an ionizing spectrum dominated by very young stellar populations.
(3) We explore the relationship between C III] EW and [O III]+H EW for galaxies at . The intense C III] line emission detected at (EW Å) only appears in galaxies with the largest [O III]+H EWs ( Å), suggesting that very large sSFR ( Gyr-1) is required to power the line emission seen at . We find that there is significant variation in C III] EW at fixed [O III]+H EW, with many of the most extreme optical line emitters showing relatively weak C III] emission (EW Å).
(4) Photoionization models suggest that the spread in C III] is driven by metallicity variations at fixed [O III]+H EW, a result of the extreme sensitivity of C III] to electron temperature. We find that strong C III] emission (EW Å) tends to be found in low metallicity galaxies () with large sSFR, and weaker C III] (EW Å) tends to be found in moderate metallicity systems () with large sSFR. The luminosity distribution supports this picture, with strong C III] emission generally associated with the lowest luminosity () galaxies at a given [O III]+H EW, where low metallicities are most likely. Among more luminous galaxies at (M), we tend to find weaker C III] emission. These results stand in contrast to those at , where very strong C III] has already been identified in extremely luminous () galaxies (Stark et al., 2017), suggesting very low metallicity gas in some of the most massive galaxies known at . While larger samples are ultimately required to confirm, this is consistent with expectations for evolution toward lower metallicities (at fixed luminosity) between and .
(5) We compute the fraction of galaxies with intense C III] emission (EW Å), considering sources that are bright () and have large [O III]+H EWs ( Å; median Å) as have been targeted spectroscopically in the reionization era. Even when we consider the most extreme [O III] emitting galaxies, we find that a very small fraction of galaxies exhibit intense C III] emission (), much lower than the fraction that is inferred at (; Mainali et al. 2018; Hutchison et al. 2019). This suggests that the intense C III] emission seen at is not entirely driven by a shift toward younger stellar populations (i.e., larger [O III]+H EW) and that evolution toward lower metallicities is also likely contributing to the detection rate.
(6) We quantify the fraction of extreme [O III] emitters with nebular C IV emission in our sample, providing a window on the presence of very low metallicity stellar populations () at . Considering those systems in our sample with [O III]+H EW Å and , we find that only out of sources show C IV EW Å and none of them shows C IV EW Å. To account for the possibility that [O III] may be weaker at such low metallicities, we also consider another galaxies with [O III]+H EW . None shows C IV with EW Å. These results stand in contrast to the detection of C IV with EW Å in two of the first galaxies targeted with (Stark et al., 2015b; Mainali et al., 2017; Schmidt et al., 2017). The emergence of such strong C IV emission may reflect the increased incidence of very low metallicity stars () in the reionization-era population.
Acknowledgements
The authors thank referee for the helpful suggestions and comments. We are grateful for enlightening conversations with Xinnan Du, Alice Shapley, Taylor Hutchison, Michael Maseda, and Kimihiko Nakajima. DPS acknowledges support from the National Science Foundation through the grant AST-1410155. EC acknowledges support from ANID project Basal AFB-170002. This work is based on observations taken by the 3D-HST Treasury Program (GO 12177 and 12328) with the NASA/ESA HST, which is operated by the Association of Universities for Research in Astronomy, Inc., under NASA contract NAS5-26555. Observations reported here were obtained from the Magellan Telescopes located at Las Campanas Observatory, Chile, and the MMT Observatory, a joint facility of the University of Arizona and the Smithsonian Institution. This paper uses data products produced by the OIR Telescope Data Center, supported by the Smithsonian Astrophysical Observatory. We thank the MMT queue observers, Chun Ly and ShiAnne Kattner, for assisting with our MMT/Binospec observations. This work was partially supported by a NASA Keck PI Data Award, administered by the NASA Exoplanet Science Institute. Data presented herein were obtained at the W. M. Keck Observatory from telescope time allocated to the National Aeronautics and Space Administration through the agency’s scientific partnership with the California Institute of Technology and the University of California. The Observatory was made possible by the generous financial support of the W. M. Keck Foundation. The authors acknowledge the very significant cultural role that the summit of Mauna Kea has always had within the indigenous Hawaiian community. We are most fortunate to have the opportunity to conduct observations from this mountain.
Data Availability
The data underlying this article will be shared on reasonable request to the corresponding author.
References
- Alexandroff et al. (2013) Alexandroff R., et al., 2013, MNRAS, 435, 3306
- Amorín et al. (2017) Amorín R., et al., 2017, Nature Astronomy, 1, 0052
- Atek et al. (2011) Atek H., et al., 2011, ApJ, 743, 121
- Atek et al. (2018) Atek H., Richard J., Kneib J.-P., Schaerer D., 2018, MNRAS, 479, 5184
- Bayliss et al. (2014) Bayliss M. B., Rigby J. R., Sharon K., Wuyts E., Florian M., Gladders M. D., Johnson T., Oguri M., 2014, ApJ, 790, 144
- Berg et al. (2016) Berg D. A., Skillman E. D., Henry R. B. C., Erb D. K., Carigi L., 2016, ApJ, 827, 126
- Berg et al. (2018) Berg D. A., Erb D. K., Auger M. W., Pettini M., Brammer G. B., 2018, ApJ, 859, 164
- Berg et al. (2019) Berg D. A., Erb D. K., Henry R. B. C., Skillman E. D., McQuinn K. B. W., 2019, ApJ, 874, 93
- Bouwens et al. (2015) Bouwens R. J., et al., 2015, ApJ, 803, 34
- Brammer et al. (2008) Brammer G. B., van Dokkum P. G., Coppi P., 2008, ApJ, 686, 1503
- Bressan et al. (2012) Bressan A., Marigo P., Girardi L., Salasnich B., Dal Cero C., Rubele S., Nanni A., 2012, MNRAS, 427, 127
- Bruzual & Charlot (2003) Bruzual G., Charlot S., 2003, MNRAS, 344, 1000
- Byler et al. (2018) Byler N., Dalcanton J. J., Conroy C., Johnson B. D., Levesque E. M., Berg D. A., 2018, ApJ, 863, 14
- Caffau et al. (2011) Caffau E., Ludwig H. G., Steffen M., Freytag B., Bonifacio P., 2011, Sol. Phys., 268, 255
- Calzetti et al. (2000) Calzetti D., Armus L., Bohlin R. C., Kinney A. L., Koornneef J., Storchi-Bergmann T., 2000, ApJ, 533, 682
- Chabrier (2003) Chabrier G., 2003, PASP, 115, 763
- Chen et al. (2015) Chen Y., Bressan A., Girardi L., Marigo P., Kong X., Lanza A., 2015, MNRAS, 452, 1068
- Chevallard & Charlot (2016) Chevallard J., Charlot S., 2016, MNRAS, 462, 1415
- Chevallard et al. (2018) Chevallard J., et al., 2018, MNRAS, 479, 3264
- Dayal & Ferrara (2018) Dayal P., Ferrara A., 2018, Phys. Rep., 780, 1
- De Barros et al. (2016) De Barros S., et al., 2016, A&A, 585, A51
- De Barros et al. (2019) De Barros S., Oesch P. A., Labbé I., Stefanon M., González V., Smit R., Bouwens R. J., Illingworth G. D., 2019, MNRAS, 489, 2355
- Dressler et al. (2011) Dressler A., et al., 2011, PASP, 123, 288
- Du et al. (2017) Du X., Shapley A. E., Martin C. L., Coil A. L., 2017, ApJ, 838, 63
- Du et al. (2020) Du X., Shapley A. E., Tang M., Stark D. P., Martin C. L., Mobasher B., Topping M. W., Chevallard J., 2020, ApJ, 890, 65
- Endsley et al. (2020) Endsley R., Stark D. P., Chevallard J., Charlot S., 2020, arXiv e-prints, p. arXiv:2005.02402
- Erb et al. (2010) Erb D. K., Pettini M., Shapley A. E., Steidel C. C., Law D. R., Reddy N. A., 2010, ApJ, 719, 1168
- Erb et al. (2014) Erb D. K., et al., 2014, ApJ, 795, 33
- Fabricant et al. (2019) Fabricant D., et al., 2019, PASP, 131, 075004
- Feltre et al. (2016) Feltre A., Charlot S., Gutkin J., 2016, MNRAS, 456, 3354
- Feltre et al. (2018) Feltre A., et al., 2018, A&A, 617, A62
- Feltre et al. (2020) Feltre A., et al., 2020, A&A, 641, A118
- Ferland et al. (2013) Ferland G. J., et al., 2013, Rev. Mex. Astron. Astrofis., 49, 137
- Finkelstein et al. (2015) Finkelstein S. L., et al., 2015, ApJ, 810, 71
- Froese Fischer & Saha (1985) Froese Fischer C., Saha H. P., 1985, Phys. Scr., 32, 181
- Gehrels (1986) Gehrels N., 1986, ApJ, 303, 336
- Gutkin et al. (2016) Gutkin J., Charlot S., Bruzual G., 2016, MNRAS, 462, 1757
- Hainline et al. (2011) Hainline K. N., Shapley A. E., Greene J. E., Steidel C. C., 2011, ApJ, 733, 31
- Henry et al. (2018) Henry A., Berg D. A., Scarlata C., Verhamme A., Erb D., 2018, ApJ, 855, 96
- Hutchison et al. (2019) Hutchison T. A., et al., 2019, ApJ, 879, 70
- Inoue et al. (2014) Inoue A. K., Shimizu I., Iwata I., Tanaka M., 2014, MNRAS, 442, 1805
- James et al. (2014) James B. L., et al., 2014, MNRAS, 440, 1794
- Jaskot & Ravindranath (2016) Jaskot A. E., Ravindranath S., 2016, ApJ, 833, 136
- Jeong et al. (2020) Jeong M.-S., et al., 2020, ApJ, 902, L16
- Jones et al. (2020) Jones T., Sanders R., Roberts-Borsani G., Ellis R. S., Laporte N., Treu T., Harikane Y., 2020, arXiv e-prints, p. arXiv:2006.02447
- Kansky et al. (2019) Kansky J., et al., 2019, Binospec: Data reduction pipeline for the Binospec imaging spectrograph (ascl:1905.004)
- Kriek et al. (2015) Kriek M., et al., 2015, ApJS, 218, 15
- Labbé et al. (2013) Labbé I., et al., 2013, ApJ, 777, L19
- Laporte et al. (2017) Laporte N., Nakajima K., Ellis R. S., Zitrin A., Stark D. P., Mainali R., Roberts-Borsani G. W., 2017, ApJ, 851, 40
- Le Fèvre et al. (2019) Le Fèvre O., et al., 2019, A&A, 625, A51
- Livermore et al. (2017) Livermore R. C., Finkelstein S. L., Lotz J. M., 2017, ApJ, 835, 113
- Luridiana et al. (2015) Luridiana V., Morisset C., Shaw R. A., 2015, A&A, 573, A42
- Mainali et al. (2017) Mainali R., Kollmeier J. A., Stark D. P., Simcoe R. A., Walth G., Newman A. B., Miller D. R., 2017, ApJ, 836, L14
- Mainali et al. (2018) Mainali R., et al., 2018, MNRAS, 479, 1180
- Mainali et al. (2020) Mainali R., et al., 2020, MNRAS, 494, 719
- Marques-Chaves et al. (2020) Marques-Chaves R., et al., 2020, MNRAS, 499, L105
- Maseda et al. (2013) Maseda M. V., et al., 2013, ApJ, 778, L22
- Maseda et al. (2014) Maseda M. V., et al., 2014, ApJ, 791, 17
- Maseda et al. (2017) Maseda M. V., et al., 2017, A&A, 608, A4
- McLean et al. (2012) McLean I. S., et al., 2012, in Ground-based and Airborne Instrumentation for Astronomy IV. p. 84460J, doi:10.1117/12.924794
- McLure et al. (2013) McLure R. J., et al., 2013, MNRAS, 432, 2696
- Momcheva et al. (2016) Momcheva I. G., et al., 2016, ApJS, 225, 27
- Nakajima et al. (2018) Nakajima K., et al., 2018, A&A, 612, A94
- Oemler et al. (2017) Oemler A., Clardy K., Kelson D., Walth G., Villanueva E., 2017, COSMOS: Carnegie Observatories System for MultiObject Spectroscopy (ascl:1705.001)
- Oesch et al. (2018) Oesch P. A., Bouwens R. J., Illingworth G. D., Labbé I., Stefanon M., 2018, ApJ, 855, 105
- Oke & Gunn (1983) Oke J. B., Gunn J. E., 1983, ApJ, 266, 713
- Pérez-Montero (2014) Pérez-Montero E., 2014, MNRAS, 441, 2663
- Plat et al. (2019) Plat A., Charlot S., Bruzual G., Feltre A., Vidal-García A., Morisset C., Chevallard J., Todt H., 2019, MNRAS, 490, 978
- Rasappu et al. (2016) Rasappu N., Smit R., Labbé I., Bouwens R. J., Stark D. P., Ellis R. S., Oesch P. A., 2016, MNRAS, 461, 3886
- Ravindranath et al. (2020) Ravindranath S., Monroe T., Jaskot A., Ferguson H. C., Tumlinson J., 2020, ApJ, 896, 170
- Reddy et al. (2018) Reddy N. A., et al., 2018, ApJ, 869, 92
- Rigby et al. (2015) Rigby J. R., Bayliss M. B., Gladders M. D., Sharon K., Wuyts E., Dahle H., Johnson T., Peña-Guerrero M., 2015, ApJ, 814, L6
- Sanders et al. (2016) Sanders R. L., et al., 2016, ApJ, 816, 23
- Sanders et al. (2020) Sanders R. L., et al., 2020, MNRAS, 491, 1427
- Saxena et al. (2020) Saxena A., et al., 2020, A&A, 636, A47
- Schmidt et al. (2017) Schmidt K. B., et al., 2017, ApJ, 839, 17
- Senchyna & Stark (2019) Senchyna P., Stark D. P., 2019, MNRAS, 484, 1270
- Senchyna et al. (2017) Senchyna P., et al., 2017, MNRAS, 472, 2608
- Senchyna et al. (2019) Senchyna P., Stark D. P., Chevallard J., Charlot S., Jones T., Vidal-García A., 2019, MNRAS, 488, 3492
- Shapley et al. (2003) Shapley A. E., Steidel C. C., Pettini M., Adelberger K. L., 2003, ApJ, 588, 65
- Shim et al. (2011) Shim H., Chary R.-R., Dickinson M., Lin L., Spinrad H., Stern D., Yan C.-H., 2011, ApJ, 738, 69
- Shirazi & Brinchmann (2012) Shirazi M., Brinchmann J., 2012, MNRAS, 421, 1043
- Skelton et al. (2014) Skelton R. E., et al., 2014, ApJS, 214, 24
- Smit et al. (2014) Smit R., et al., 2014, ApJ, 784, 58
- Smit et al. (2015) Smit R., et al., 2015, ApJ, 801, 122
- Smit et al. (2018) Smit R., et al., 2018, Nature, 553, 178
- Stark (2016) Stark D. P., 2016, ARA&A, 54, 761
- Stark et al. (2013) Stark D. P., Schenker M. A., Ellis R., Robertson B., McLure R., Dunlop J., 2013, ApJ, 763, 129
- Stark et al. (2014) Stark D. P., et al., 2014, MNRAS, 445, 3200
- Stark et al. (2015a) Stark D. P., et al., 2015a, MNRAS, 450, 1846
- Stark et al. (2015b) Stark D. P., et al., 2015b, MNRAS, 454, 1393
- Stark et al. (2017) Stark D. P., et al., 2017, MNRAS, 464, 469
- Steidel et al. (2016) Steidel C. C., Strom A. L., Pettini M., Rudie G. C., Reddy N. A., Trainor R. F., 2016, ApJ, 826, 159
- Strom et al. (2018) Strom A. L., Steidel C. C., Rudie G. C., Trainor R. F., Pettini M., 2018, ApJ, 868, 117
- Tang et al. (2019) Tang M., Stark D. P., Chevallard J., Charlot S., 2019, MNRAS, 489, 2572
- Thuan & Izotov (2005) Thuan T. X., Izotov Y. I., 2005, ApJS, 161, 240
- Topping et al. (2020) Topping M. W., Shapley A. E., Reddy N. A., Sanders R. L., Coil A. L., Kriek M., Mobasher B., Siana B., 2020, MNRAS, 495, 4430
- Vanzella et al. (2008) Vanzella E., et al., 2008, A&A, 478, 83
- Vanzella et al. (2016) Vanzella E., et al., 2016, ApJ, 821, L27
- Vanzella et al. (2017) Vanzella E., et al., 2017, ApJ, 842, 47
- Vanzella et al. (2020) Vanzella E., et al., 2020, MNRAS, 491, 1093
- Vidal-García et al. (2017) Vidal-García A., Charlot S., Bruzual G., Hubeny I., 2017, MNRAS, 470, 3532
- van der Wel et al. (2011) van der Wel A., et al., 2011, ApJ, 742, 111