VLA Limits on Intermediate-Mass Black Holes in 19 Massive Globular Clusters
Abstract
The NSF’s Karl G. Jansky Very Large Array (VLA) was used at 3 cm to search for accretion signatures from intermediate-mass black holes (IMBHs) in 19 globular star clusters (GCs) in NGC 3115, an early-type galaxy at a distance of 9.4 Mpc. The 19 have stellar masses , with a mean . None were detected. An IMBH accretion model was applied to the individual GCs and their radio stack. The radio-stacked GCs have an IMBH mass and mass fraction , with each limit being uncertain by a factor of about 2.5. The latter limit contrasts with the extremes of some stripped nuclei, suggesting that the set of stacked GCs in NGC 3115 is not a set of such nuclei. The radio luminosities of the individual GCs correspond to X-ray luminosities erg s-1, with a factor of about 2.5 uncertainty. These limits predicted for putative IMBHs in the GCs are consistent with extant Chandra observations. Finally, a simulated observation with a next-generation VLA (ngVLA) demonstrates that accretion signatures from IMBHs in GCs can be detected in a radio-only search, yet elude detection in an X-ray-only search due to confusion from X-ray binaries in the GCs.
1 MOTIVATION
Intermediate-mass black holes (IMBHs) are defined to have masses , a range poorly explored observationally. Discovering them in the nuclei of dwarf galaxies or in globular star clusters (GCs) would validate formation channels for massive black hole (BH) seeds in the early universe (for a review, see Greene et al., 2020). Finding IMBHs in present-day GCs would also inform predictions for gravitational wave (GW) and tidal disruption (TD) events offset from galactic nuclei, and have broad implications for the dynamical evolution of these compact stellar systems (for an overview, see Wrobel et al., 2019).
To search for IMBHs in GCs, one looks for evidence that the IMBHs are influencing the properties of their GC hosts. Within the Local Group, a common approach is to scrutinize optical or infrared data for the dynamical signatures of IMBHs on the orbits of stars in the GCs. First suggested 50 years ago (Wyller, 1970), such sphere-of-influence searches have a controversial history (e.g., Noyola et al., 2008, 2010; Anderson & van der Marel, 2010; van der Marel & Anderson, 2010; Baumgardt, 2017), even resulting in different IMBH masses when utilizing the orbits of stars or of pulsars in the same GC (Perera et al., 2017; Gieles et al., 2018). More fundamentally, a limitation of dynamical searches is their susceptibility to measuring high concentrations of stellar remnants rather than an IMBH (e.g., Lutzgendorf et al., 2013; Mann et al., 2019). It is thus important to develop alternate ways to search for IMBHs in GCs.
One alternate approach capitalizes on decades of studies of accretion signatures from both stellar-mass BHs and supermassive BHs (for a review, see Fender & Munoz-Darias, 2016). This approach involves searching for radio-synchrotron signatures of slow accretion onto putative IMBHs in GCs, and was first suggested by Maccarone (2004).
Specifically, the semi-empirical model presented by Strader et al. (2012) is invoked to predict the mass of an IMBH that, if accreting slowly from the tenuous gas supplied to the GC from its evolving stars, is consistent with the synchrotron radio luminosity, , of the GC. Summarizing from Strader et al. (2012), gas-capture is assumed to achieve 3% of the Bondi rate (Pellegrini, 2005) for gas at a density of 0.2 particles cm-3 (Abbate et al., 2018) and a temperature of K. It is further assumed that accretion proceeds at less than 2% of the Eddington rate. This establishes an inner advection-dominated accretion flow with a predictable, persistent X-ray luminosity . The empirical fundamental-plane of BH activity (Merloni et al., 2003; Falke et al., 2004), as refined by Plotkin et al. (2012), is then used to estimate the corresponding . In this way, an observation of can lead to a constraint on . The radio continuum emission from the IMBH is expected to be persistent, flat-spectrum, jet-like but spatially unresolved, and located at or near the dynamical center of the GC. For context, a typical GC has a half-starlight diameter of 5 pc (Brodie & Strader, 2006).
Hereafter, this semi-empirical framework as implemented by Strader et al. (2012) is referred to as an IMBH accretion model. Those authors estimate that parameter uncertainties cause the associated with a given to be uncertain by a factor of about 2.5, dominantly from the gas-capture prescription. Also, Strader et al. (2012) adopt a specific underlying Bondi flow that is intermediate between the isothermal and adiabatic cases. For a general-case treatment otherwise consistent with Strader et al. (2012), including a general-case expression for , see Appendix C in Perera et al. (2017). The Strader et al. (2012) framework is retained here for consistency with prior work (Wrobel et al., 2015, 2016, 2018, 2019).
GCs with stellar masses are optimal targets for radio searches, because contraints on their IMBH masses can probe lower values for IMBH mass fractions . Early-type galaxies typically hold more GCs than other galaxy types (for a review, see Brodie & Strader, 2006), increasing their counts of massive GCs. NGC 3115 is among the nearest such galaxies: it has hundreds of candidate GCs (Jennings et al., 2014; Cantiello et al., 2015, 2018) and a distance of only 9.4 Mpc, where 1″= 45.6 pc (Brodie et al., 2014). Here, we report on radio observations of its massive GCs using the NSF’s Karl G. Jansky Very Large Array (VLA; Perley et al., 2011). Section 2 describes the data and Section 3 explores their implications. Section 4 uses simulations to forecast the results of substantially deeper observations with a next-generation VLA (ngVLA; Murphy et al., 2018). A summary and conclusions appear in Section 5.
2 DATA
2.1 VLA Observations and Imaging
Jones et al. (2019) observed NGC 3115 with the VLA in its A configuration under proposal VLA/14B-514, to investigate an optical broad-emission-line nucleus claimed to be displaced from the photometric center of the galaxy’s stellar bulge. Details of the observing, calibration, and wide-field, wide-band imaging are as described in Jones et al. (2019), as is the validation of the VLA astrometry by position-matching a background radio source with a X-ray counterpart (Lin et al., 2015) and a ugi counterpart (Cantiello et al., 2015, 2018). The VLA flux density scale is accurate to 3% (Perley & Butler, 2017). The Common Astronomy Software Application (CASA) package was used (McMullin et al., 2007). About 1.4 hours of data were accrued on NGC 3115 at a wavelength of 3 cm, corresponding to a frequency of 10 GHz. The bandwidth spanned 8 12 GHz.
This work adopts an independent data analysis, also in CASA, which improved the excision of radio frequency interference and yielded a slightly lower rms noise in the image near the peak of the primary beam. After masking below a primary beam threshold of 20%, the image was corrected for the primary beam response and appears in Figure 1. Its synthesized beam is elliptical with a major axis of 308 mas FWHM, a minor axis of 168 mas FWHM, and an elongation position angle of 36 degrees. Hereafter, the synthesized beam will be referred to by its geometric-averaged resolution. The galaxy’s effective radius is 35″ (Brodie et al. 2014) so Figure 1 samples out to about 5.7 effective radii.
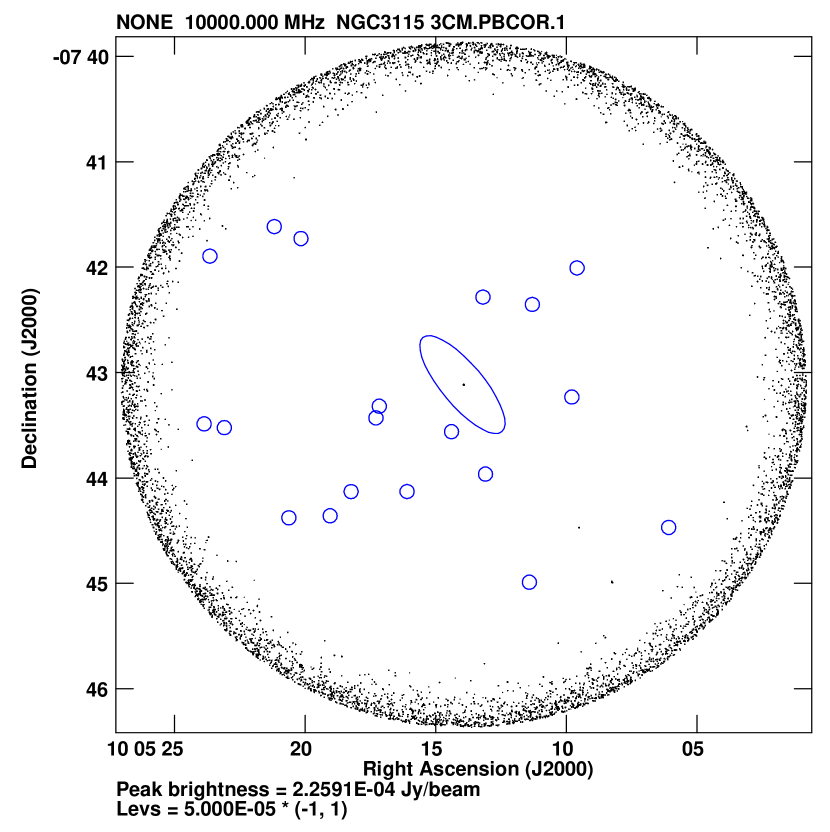
The g-band magnitudes for the candidate GCs (Cantiello et al., 2018) were converted to solar luminosities and then to stellar masses, , by assuming a typical GC mass-to-light ratio of 2.4 (Jordan et al., 2007). Massive, candidate GCs were then selected to have and positions within the primary-beam-corrected region of Figure 1. That region encompasses only candidate GCs with negligible contamination from background g-band objects (Cantiello et al., 2018), so the adjective “candidate” is dropped hereafter. To mitigate contamination from foreground stars, Cantiello et al. (2018) excluded g-band objects brighter than 19.5 magnitudes and thus set a stellar-mass cap of . Nineteen massive GCs survived these selection criteria. Their properties are given in Table 1 and their positions are marked in Figure 1. The rms uncertainty for the positions is 200 mas and for the g-band photometry is typically 0.004 mag (Cantiello et al., 2015, 2018).
| ID | g | 4 | / | ||||||
|---|---|---|---|---|---|---|---|---|---|
| (degrees) | (degrees) | (mag) | () | (Jy beam-1) | ( erg s-1) | () | ( erg s-1) | (%) | |
| (1) | (2) | (3) | (4) | (5) | (6) | (7) | (8) | (9) | (10) |
| 836 | 151.297577 | -7.749814 | 20.4450 | 1.58 | 6.52 | 2.76 | 3.22 | 5.52 | 20.4 |
| 852 | 151.275360 | -7.741160 | 20.7987 | 1.14 | 8.57 | 3.63 | 3.57 | 7.48 | 31.3 |
| 857 | 151.329361 | -7.739307 | 20.6693 | 1.28 | 6.04 | 2.56 | 3.13 | 5.07 | 24.4 |
| 858 | 151.335938 | -7.739635 | 20.0389 | 2.29 | 7.03 | 2.97 | 3.31 | 6.00 | 14.4 |
| 868 | 151.326019 | -7.735492 | 20.0891 | 2.19 | 5.14 | 2.17 | 2.95 | 4.24 | 13.5 |
| 876 | 151.317093 | -7.735482 | 20.7105 | 1.24 | 4.78 | 2.02 | 2.87 | 3.91 | 23.2 |
| 886 | 151.304581 | -7.732720 | 19.9794 | 2.42 | 4.27 | 1.81 | 2.76 | 3.45 | 11.4 |
| 902 | 151.309998 | -7.726009 | 20.7860 | 1.15 | 4.13 | 1.75 | 2.72 | 3.33 | 23.6 |
| 913 | 151.349472 | -7.724780 | 20.2986 | 1.81 | 9.61 | 4.07 | 3.72 | 8.49 | 20.6 |
| 916 | 151.346237 | -7.725379 | 20.7147 | 1.23 | 7.96 | 3.37 | 3.47 | 6.89 | 28.2 |
| 920 | 151.322052 | -7.723844 | 19.8486 | 2.73 | 4.24 | 1.79 | 2.75 | 3.42 | 10.1 |
| 932 | 151.321518 | -7.721987 | 20.6720 | 1.28 | 4.46 | 1.88 | 2.80 | 3.62 | 21.9 |
| 934 | 151.290802 | -7.720541 | 20.0403 | 2.29 | 4.47 | 1.89 | 2.80 | 3.63 | 12.2 |
| 990 | 151.297104 | -7.705904 | 20.7414 | 1.20 | 4.66 | 1.97 | 2.85 | 3.80 | 23.7 |
| 991 | 151.304977 | -7.704742 | 20.2613 | 1.87 | 4.37 | 1.85 | 2.78 | 3.54 | 14.9 |
| 1008 | 151.289978 | -7.700134 | 20.2837 | 1.83 | 5.34 | 2.26 | 2.99 | 4.42 | 16.4 |
| 1014 | 151.348541 | -7.698267 | 19.9248 | 2.55 | 11.4 | 4.83 | 3.97 | 10.3 | 15.6 |
| 1025 | 151.334015 | -7.695483 | 20.1705 | 2.03 | 6.37 | 2.69 | 3.20 | 5.38 | 15.7 |
| 1030 | 151.338272 | -7.693601 | 19.9196 | 2.56 | 8.74 | 3.70 | 3.59 | 7.64 | 14.0 |
Note. — Columns (1)-(4) are from the Cantiello et al. (2018) catalog available at the CDS. Details about Columns (5) and (6) appear in Section 2.1 and 2.2, respectively. Columns (8)-(10) are predictions from the IMBH accretion model described in Section 1; entries for those columns are uncertain by a factor of about 2.5.
2.2 VLA Cutouts
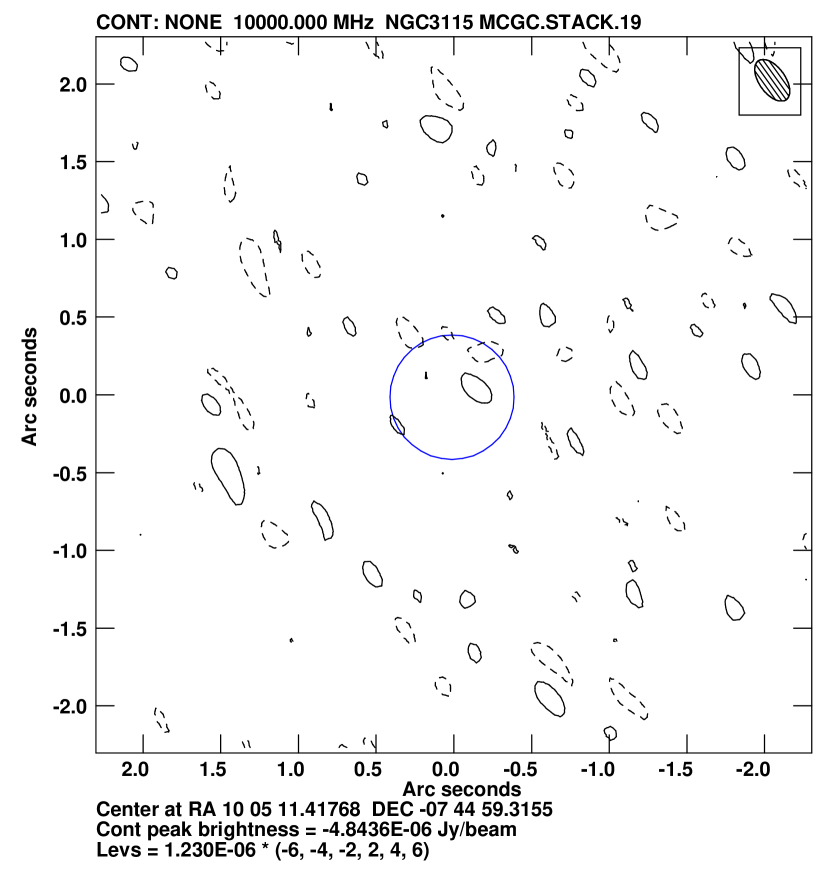
For each of the 19 massive GCs, task subim in NRAO’s Astronomical Image Processing System (AIPS; Greisen, 2003) was used to form a cutout spanning 20 times the geometric-averaged resolution and centered on the tabulated position. Figure 2 shows the VLA cutouts for the 19 massive GCs. Their rms noise levels range over Jy beam-1, as expected given the the primary beam correction. Based on the noise statistics among the 19 cutouts, a detection threshold of 4 was adopted. None of the 19 massive GCs are detected.

2.3 VLA Stack
Inferences from stacks are stronger if similar objects are involved. The stellar masses of the 19 GCs appear to range over (Table 1). This narrow span helps strengthen inferences about other population-averaged traits of the GCs from the stack of their radio upper limits shown in Figure 3. The mean stellar mass of the GCs is .
3 IMPLICATIONS
3.1 Applying the IMBH Accretion Model
The upper limits on the radio flux densities for individual GCs (Figure 2 and Table 1) and for their radio stack (Figure 3) were converted to upper limits on the flat-spectrum radio luminosities. Then, the IMBH accretion model was used to convert from radio luminosities to putative IMBH masses, each uncertain by a factor of about 2.5 (Strader et al., 2012).
3.1.1 The Individual GCs
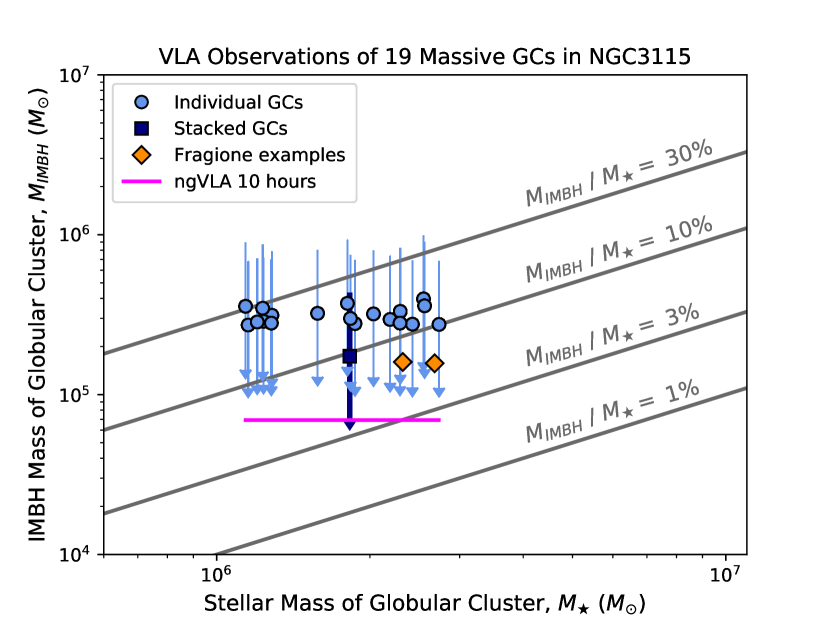
For each GC, its radio luminosity , IMBH mass and mass fraction appear in Table 1, and its is plotted in Figure 4 at its stellar mass . The constraints on the individual IMBH masses range over , whereas those on the individual mass fractions range over . The black-hole mass fractions of some stripped galactic nuclei are 40% or more (Seth et al., 2014; Afanasiev et al., 2018; Ahn et al., 2017, 2018; Greene et al., 2020). Such extreme fractions can be ruled out for only a few individual GCs in NGC 3115, given the factor of about 2.5 uncertainty in their IMBH mass fractions.
The IMBH accretion model also yields the tabulated predictions for the 0.5 10 keV X-ray luminosities , each uncertain by a factor of about 2.5 (Strader et al., 2012). These predictions are consistent with the very deep Chandra X-ray observations reported by Lin et al. (2015). Specifically, X-ray sources 4, 23, 101, 106, 129, 188, and 200 coincide with respective GC IDs 868, 932, 991, 1008, 934, 836, and 852. Lin et al. (2015) argue that those X-ray sources are low-mass binaries with 0.5 7 keV luminosities of about erg s-1, after adjusting for the closer distance to NGC 3115 adopted in this work. Those X-ray luminosities are compatible with the values for their respective GC hosts (Table 1). The balance of the GCs are undetected with Chandra, again at levels compatible with their respective values (Table 1).
3.1.2 The Radio-Stacked GCs
For the radio-stack of massive GCs in NGC 3115, the radio luminosity corresponds to and is plotted in Figure 4 at the stack’s mean stellar mass . The associated mass fraction is .
As mentioned in the previous subsection, some stripped galactic nuclei have black-hole mass fractions of 40% or more. Such extreme mass fractions contrast with the mass fraction for the radio-stacked GCs in NGC 3115, even given its factor of about 2.5 uncertainty. This suggests that the set of stacked GCs in NGC 3115 is not a set of highly-stripped galactic nuclei. This finding is relevant to studies of a galaxy’s admixture of massive GCs and ultracompact dwarf galaxies, from the perspectives of both simulations and observations (e.g., Pfeffer et al., 2016; Norris et al., 2019; Dolfi et al., 2020).
For another early-type galaxy, NGC 1023 at a distance of 11.1 Mpc, similar radio-stacking results were obtained for 13 massive, old star clusters with a mean stellar mass of : an IMBH mass of less than and a mass fraction of less than 13% (Wrobel et al., 2015). Notably, these stacked limits on IMBH masses already reach the mass regime targeted for dynamical searches for black holes in stellar systems, as distant as NGC 3115 and NGC 1023, with next-generation near-infrared telescopes (e.g., Thirty Meter Telescope; Do et al., 2014).
3.2 Investigating a GC Evolution Model
The fate of primordial GCs, each assumed to host a central IMBH, was first explored by Holley-Bockelmann et al. (2008) and considerably elaborated on by Fragione et al. (2018). The latter authors modelled the evolution of the GCs in a variety of host galaxies, as well as the IMBHs as they underwent successive TD events and mergers with stellar-mass BHs in the GCs. Summarizing from Fragione et al. (2018), such mergers generate successive GW events, leading to predictions for the rates per volume of GW events over time. Meanwhile, the GC hosts lose mass due to stellar winds and tidal stripping. Among the primordial GCs that survived to the present day, overall only a few percent retained their IMBHs and the balance lost their IMBH when a GW recoil (Redmount & Rees, 1989) ejected it from its GC host. Once ejected, the IMBHs are no longer able to foster GW or TD events. The more massive the GC, the higher the probability that it will retain its IMBH to the present day.
Lin et al. (2020) reported a TD event from a massive star cluster at a projected distance of 12.5 kpc from the center of a large early-type galaxy. This discovery is intriguing for two reasons. First, the TD event seems to match the Fragione et al. (2018) predictions for the locations of such events. Second, the galaxy hosting the TD event and NGC 3115 are both early-type galaxies.
With a total stellar mass of (Forbes et al., 2017) and an effective radius of 1.6 kpc (Brodie et al., 2014), NGC 3115 roughly matches a model for an early-type galaxy considered by Fragione et al. (2018). That model suggests that more than 100 GCs hosting IMBHs could survive to the present day and reside at galactic radii of up to 20 kpc. Their projected radii would generally be lower, so Figure 1 for NGC 3115 samples radii relevant to the GC evolution model.
Fragione et al. (2018) provide two examples of how a star cluster’s stellar mass, IMBH mass, and mass fraction could evolve to yield a massive, present-day GC. Those examples, plotted in Figure 4, achieve present-day values of , , and . From Figure 4, it is clear that neither the individual GCs nor the radio-stacked GCs in NGC 3115 can provide useful constraints on these example IMBH masses and mass fractions. Such comparisons must await significant improvements to the depth of the radio observations and/or the IMBH accretion model. The former improvement area is addressed in Section 4. Regarding the latter area, the gas-capture prescription dominates the uncertainty in the IMBH masses and mass fractions from the IMBH accretion model (Section 1). It would be desirable to replace that prescription with the results of realistic simulations (e.g., Inayoshi et al., 2018) of gas flows onto IMBHs in GCs.
4 ngVLA SIMULATION
Deeper radio observations of the 19 massive GCs in NGC 3115 would improve the implications explored in Section 3. The associated with a given is uncertain by a factor of about 2.5 (Section 1), so it is reasonable to aim for an IMBH mass about that factor below the of the Fragione et al. (2018) examples (Section 3.2).
Following Wrobel et al. (2018), the IMBH accretion model was used to predict the point-source flux density in the ngVLA band centered at 16.4 GHz as a function of the mass of an IMBH in a GC at the distance of NGC 3115. For selected point-source flux densities, the ngVLA Sensitivity Calculator333 https://gitlab.nrao.edu/vrosero/ngvla-sensitivity-calculator provided estimates of the time to achieve detections with the Main Array offering a synthesized beam of 100 mas FWHM (4.6 pc), resembling that in Figures 1-3. Picking an illustrative case, the ngVLA reaches Jy beam-1 after 10 hours on target, whereas observing with the VLA as in Section 2 would require over 1000 hours on target.
This ngVLA detection threshold corresponds to and is conveyed in Figure 4. Such an IMBH mass is close to the desired factor below the Fragione et al. (2018) examples (Section 3.2), and would also enable exploration of mass fractions of 6% or less among individual GCs in NGC 3115, thus aiding comparisons with stripped galactic nuclei (Section 3.1). Moreover, this ngVLA threshold corresponds to erg s-1. Although uncertain by a factor of about 2.5, this value is below or near the X-ray luminosities of the low-mass binaries in GCs in NGC 3115 (Section 3.1). This illustrates how an X-ray-only search for the accretion signatures of IMBHs in GCs could be hindered by confusion from X-ray binaries in GCs, an issue further developed in Wrobel et al. (2018).
5 SUMMARY AND CONCLUSIONS
The VLA was used at 3 cm to search for accretion signatures from putative IMBHs in 19 GCs in the early-type galaxy NGC 3115. The stellar masses of the 19 have a range and a mean . None of these massive GCs were detected, leading to the following findings:
-
•
An IMBH accretion model was applied to the radio-stacked GCs in NGC 3115, resulting in an IMBH mass and mass fraction . The latter limit contrasts with the extremes of some stripped nuclei, suggesting that the set of stacked GCs in NGC 3115 is not a set of such nuclei. Neither limit was accurate enough for useful comparisons with the present-day predictions of a recent semi-analytical model for GC evolution. Such comparisons must await significant improvements to the IMBH accretion model and/or the depths of the radio observations.
-
•
Within the context of the IMBH accretion model, the radio luminosities of the individual GCs in NGC 3115 correspond to X-ray luminosities erg s-1. These predicted limits for IMBHs in GCs are consistent with existing Chandra observations.
-
•
An ngVLA simulation of NGC 3115 showed that accretion signatures from IMBHs in GCs can be detected in a radio-only search, yet escape detection in an X-ray-only search because of confusion from X-ray binaries in the GCs.
References
- Abbate et al. (2018) Abbate, F., Possenti, A., Ridolfi, A., et al. 2018, MNRAS, 481, 627
- Ahn et al. (2017) Ahn, C. P., Seth, A. C., den Brok, M., et al. 2017, ApJ, 839, 72
- Ahn et al. (2018) Ahn, C. P., Seth, A. C., Cappellari, M., et al. 2018, ApJ, 858, 102
- Afanasiev et al. (2018) Afanasiev, A. V., Chilingarian, I. V., Mieske, S., et al. 2018, MNRAS, 477, 4856
- Anderson & van der Marel (2010) Anderson, J. & van der Marel, R. P. 2010, ApJ, 710, 1032
- Astropy Collaboration (2018) Astropy Collaboration, 2018, AJ, 156, 123
- Baumgardt (2017) Baumgardt, H. 2017, MNRAS, 464, 2174
- Brodie & Strader (2006) Brodie, J. P., & Strader, J. 2006, ARA&A, 44, 193
- Brodie et al. (2014) Brodie, J. P., Romanowsky, A. J., Strader, J., et al. 2014, ApJ, 796, 52
- Cantiello et al. (2015) Cantiello, M., Capaccioli, M., Napolitano, N., et al. 2015, A&A, 576, A14
- Cantiello et al. (2018) Cantiello, M., D’Abrusco, R., Spavone, M., et al. 2018, A&A, 611, A93
- Do et al. (2014) Do, T., Wright, S., Barth, A. J., et al. 2014, AJ, 147, 93
- Dolfi et al. (2020) Dolfi, A., Forbes, D. A., Couch, W. J., et al. 2020, MNRAS, in press
- Falke et al. (2004) Falke, H., Koerding, E., & Markoff, S. 2004, A&A, 414, 895
- Fender & Munoz-Darias (2016) Fender, R., & Munoz-Darias, T. 2016, in Astrophysical Black Holes, eds. F. Haardt et al. (Springer), 65
- Forbes et al. (2017) Forbes, D. A., Sinpetru, L., Savorgnan, G., et al. 2017, MNRAS, 464, 4611
- Fragione et al. (2018) Fragione, G., Leigh, N. W. C., Ginsburg, I., & Kocsis, B. 2018, ApJ, 867, 119
- Gieles et al. (2018) Gieles, M., Balbinot, E., Yaaqib, R., et al. 2018, MNRAS, 473, 4832
- Greene et al. (2020) Greene, J. E., Strader, J., & Ho, L. C. 2020, ARA&A, in press
- Greisen (2003) Greisen, E. W. 2003, in Information Handling in Astronomy, ed. A. Heck (Dordrecht: Kluwer), 109
- Holley-Bockelmann et al. (2008) Holley-Bockelmann, K., Gultekin, K., & Shoemaker, D. 2008, ApJ, 686, 829
- Inayoshi et al. (2018) Inayoshi, K., Ostriker, J. P., Haiman, Z., & Kuiper, R. 2018, MNRAS, 476, 1412
- Jennings et al. (2014) Jennings, Z. G., Strader, J., Romanowsky, A. J., et al. 2014, AJ, 148, 32
- Jones et al. (2019) Jones, M. A., Burke-Spolaor, S., Nyland, K., & Wrobel, J. M. 2019, ApJ, 874, 113
- Jordan et al. (2007) Jordan, A., McLaughlin, D. E., Cote, P., et al. 2007, ApJS, 171, 101
- Lin et al. (2015) Lin, D., Irwin, J. A., Wong, K-W., et al. 2015, ApJ, 808, 19
- Lin et al. (2020) Lin, D., Strader, J., Romanowsky, A. J., et al. 2020, ApJ, 892, L25
- Lutzgendorf et al. (2013) Lutzgendorf, N., Baumgardt, H., & Kruijssen, J. M. D. 2013, A&A, 558, A117
- Maccarone (2004) Maccarone, T. J. 2004, MNRAS, 351, 1049
- Mann et al. (2019) Mann, C. R., Richer, H., Heyl, J., et al. 2019, ApJ, 875, 1
- McMullin et al. (2007) McMullin, J. P., Waters, B., Schiebel, D., Young, W., & Golap, K. 2007, in ASP Conf. Ser. 376, Astronomical Data Analysis Software and Systems, IVI, ed. R. A. Shaw, F. Hill, & D. J. Bell (San Francisco, CA: ASP), 127
- Merloni et al. (2003) Merloni, A., Heinz, S., & DiMatteo, T. 2003, MNRAS, 345, 1057
- Murphy et al. (2018) Murphy, E. J., et al. 2018, in ASP Conf. Ser. 517, Science with a Next Generation Very Large Array, ed. E. J. Murphy et al. (San Francisco, CA: ASP), 3
- Norris et al. (2019) Norris, M. A., van de Ven, G., Kannappan, S. J., Schinnerer, E., & Leaman, R. 2019, MNRAS, 488, 5400
- Noyola et al. (2008) Noyola, E., Gebhardt, K., & Bergmann, M. 2008, ApJ, 676, 1008
- Noyola et al. (2010) Noyola, E., Gebhardt, K., Kissler-Patig, M., et al. 2010, ApJ, 719, L60
- Pellegrini (2005) Pellegrini, S. 2005, apj, 624, 155
- Perera et al. (2017) Perera, B. B. P., Stappers, B. W., Lyne, A. G., et al. 2017, MNRAS, 468, 2114
- Perley et al. (2011) Perley, R. A., Chandler, C. C., Butler, B. J., & Wrobel, J. M. 2011, ApJ, 739, L1
- Perley & Butler (2017) Perley, R. A., & Butler, B. J. 2017, ApJS, 230, 7
- Pfeffer et al. (2016) Pfeffer, J., Hilker, M., Baumgardt, H., & Griffen, B. F. 2016, MNRAS, 458, 2492
- Plotkin et al. (2012) Plotkin, R. M., Markoff, S., Kelly, B. C., Koerding, E., & Anderson, S. F. 2012, MNRAS, 419, 267
- Redmount & Rees (1989) Redmount, I. H., & Rees, M. J. 1989, ComAp., 14, 165
- Seth et al. (2014) Seth, A. C., van den Bosch, R, Mieske, S., et al. 2014, Nature, 513, 398
- Strader et al. (2012) Strader, J., Chomiuk, L., Maccarone, T. J., et al. 2012, ApJ, 750, L27
- van der Marel & Anderson (2010) van der Marel, R. P. & Anderson, J. 2010, ApJ, 710, 1063
- Wrobel et al. (2015) Wrobel, J. M., Nyland, K. E., & Miller-Jones, J. C. A. 2015, AJ, 150, 120
- Wrobel et al. (2016) Wrobel, J. M., Miller-Jones, J. C. A., & Middleton, M. J. 2016, AJ, 152, 22
- Wrobel et al. (2018) Wrobel, J. M., Miller-Jones, J. C. A., Nyland, K. E., & Maccarone, T. J. 2018, in ASP Conf. Ser. 517, Science with a Next Generation Very Large Array, ed. E. J. Murphy et al. (San Francisco, CA: ASP), 743
- Wrobel et al. (2019) Wrobel, J. M., Haiman, Z., Holley-Bockelmann, K., et al. 2019, BAAS, 51, 29
- Wyller (1970) Wyller, A. 1970, ApJ, 160, 443