FCC-hh Experimental Insertion Region Design111The research presented in this document is part of the European Circular Energy-Frontier Collider Study (EuroCirCol) project which has received funding from the European Union’s Horizon 2020 research and innovation programme under grant No 654305.
Abstract
The Future Circular Collider study is exploring possible designs of circular colliders for the post-LHC era, as recommended by the European Strategy Group for High Energy Physics. One such option is FCC-hh, a proton-proton collider with a centre-of-mass energy of 100 TeV. The experimental insertion regions are key areas defining the performance of the collider. This paper presents the first insertion region designs with a complete assessment of the main challenges, as collision debris with two orders of magnitude larger power than current colliders, beam-beam interactions in long insertions, dynamic aperture for optics with peak functions one order of magnitude above current colliders, photon background from synchrotron radiation and cross talk between the insertion regions. An alternative design avoiding the use of crab cavities with a small impact on performance is also presented.
keywords:
Circular collider , Hadron collider , Insertion region , Beam optics1 Overview
FCC-hh will provide proton-proton collisions at a center-of-mass energy of , a factor 7 higher than the LHC. The goal for the integrated luminosity is set to in each high luminosity experiment. This ambitious goal can be reached by an operational scenario with 10 years of operation using the less ambitious parameters (Baseline option) followed by 15 years of operation at the Ultimate parameters. Table 1 shows the two parameter sets for the high luminosity Insertion Regions (IRs) and compares them with the respective parameters of LHC and High Luminosity LHC (HL-LHC). The most notable difference between Baseline and Ultimate are the goals for the functions at the Interaction Point (IP), , leading to a significant increase in instantaneous luminosity at Ultimate optics.
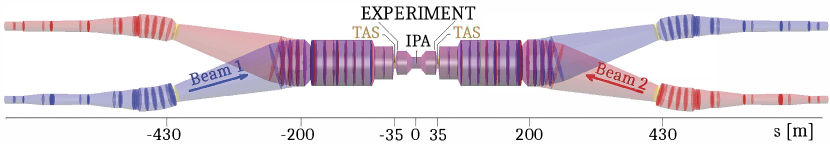
FCC-hh layout is shown in Fig. 1. The high luminosity experiments are located in IRs around the IPs at points A and G (PA and PG in in Fig. 1), while another two experiments are placed in IRs around point L and point B (PL and PB in in Fig. 1), which also contain the injection areas. Due to the high center-of-mass energy and the high luminosity the total power released at the IP towards each side increases from in the LHC or in HL-LHC up to in FCC-hh at ultimate parameters. Most of this power will be absorbed in the detector but debris particles emitted at small angles will travel down the beam pipe and impact in the insertion region magnets, possibly causing quenches and degrading the material. Consequently, the radiation load from collision debris has been identified as a key issue of the final focus system early in the design phase of the IRs [1]. Unifying adequate protection of the triplet magnets with a high luminosity performance has been the driving factor of the IR layout. Nb3Sn technology has been chosen for the IR magnets for his superior performance in terms of magnetic field and operational temperature margins. The possible flux jumps in these magnets should be investigated in the future [2].
| LHC | HL-LHC | FCC-hh | ||
| Baseline | Ultimate | |||
| Center-of-mass energy [] | 14 | 14 | 100 | |
| Injection energy [] | 0.45 | 0.45 | 3.3 | |
| Ring circumference [] | 26.7 | 26.7 | 97.75 | |
| Arc dipole field [] | 8.33 | 8.33 | 16 | |
| Number of IPs | 2+2 | 2+2 | 2+2 | |
| Number of bunches per beam | 2808 | 2748 | 10600 (53000) | |
| Beam current [] | 0.58 | 1.11 | 0.5 | |
| Peak luminosity/IP [] | 1 | 5 | 5 | 30 |
| Events/crossing | 27 | 135 | 170 | 1020 (204) |
| Stored beam energy [] | 0.4 | 0.7 | 8.4 | |
| Synchrotron power per beam [] | 0.0036 | 0.0073 | 2.4 | |
| Arc synchrotron radiation [] | 0.18 | 0.35 | 28.4 | |
| IP beta function [] | 0.4 | 0.15 | 1.1 | 0.3 |
| Bunch spacing [] | 25 | 25 | 25 (5) | |
| Initial norm. rms emittance [] | 3.75 | 2.5 | 2.2 (0.45) | |
| Initial bunch population [] | 1.15 | 2.2 | 1.0 (0.2) | |
| Transv. emittance damping time [] | 25.8 | 25.8 | 1.1 | |
| RMS bunch length [] | 7.55 | 8 | ||
| RMS IP beam size [] | 16.7 | 7.1 | 6.8 | 3.5 |
| Full crossing angle [] | 285 | 590 | 104 | 200 |
In terms of chromaticity correction it has been estimated that the sextupoles in the arcs are able to correct around 557 units of chromaticity. The natural chromaticity for the case with is below this value, and therefore the chromaticity can be corrected. However this is not the case for beyond ultimate optics. While the aperture of the final focus system can accommodate a of almost 20 cm for the nominal crossing angle of Table 1, the strength of the sextupoles necessary to correct the chromaticity is above the achievable maximum. If operation beyond ultimate is desirable an achromatic telescopic squeezing scheme as foreseen for the HL-LHC [3] could be used to increase the chromatic correction efficiency of the arc sextupoles.
Although the high mass of protons usually keeps the synchrotron radiation produced in hadron colliders low, the high beam energy of FCC-hh gives rise to the concern that the photon background in the experimental regions might grow to notable levels. Hence, a closer investigation of the synchrotron radiation was necessary in order to quantify the impact. The simulation of the photon background concluded that the synchrotron radiation is not expected to be an issue for the experiments.
Debris from proton collision at the interactions points may create background in the other detectors. Protons with an energy close to the nominal beam energy travelling far in the beam pipe before being intercepted, as well as muons passing through the rock between two experiments are of particular concern. Tracking studies of the protons and an analysis of the muon range in rock were performed, concluding that the cross talk between experiments is negligible.
The high luminosity IR design relies on the availability of crab cavities to compensate the luminosity loss due to the crossing angle needed to keep beam-beam long range effects under control as described in [4]. As this technology is currently being tested in proton accelerators for the first time it is desirable to have an alternative that avoids crab cavities. Flat beam optics are a good candidate for this as small beamsizes can be achieved in the non-crossing plane to increase the luminosity whilst not having to increase crossing angle as much as when the beamsize is reduced in both planes, therefore reducing the luminosity loss from the geometric overlap of the colliding bunches. Corresponding optics have been developed, using an alternative triplet layout.
In addition to the two high luminosity insertion regions situated around points A and G, FCC-hh features two low luminosity insertion regions around points B and L, much like the LHC. In absence of a physics case – and consequently luminosity goals or space constraints – for these two experimental regions, an initial design is proposed that can reach an integrated luminosity of . An alternative for the low luminosity IRs is FCC-eh [5, Sec. 2.8], a lepton-hadron collider with insertion region scaled up from the LHeC [6].
A filling scheme with 5 ns bunch spacing is considered to mitigate the event pile-up in the detectors. The corresponding parameters are shown in Table 1 in parenthesis. This option has not been addressed in the IR design although it reduces aperture needs thanks to the lower emittance and could pose operational difficulties to keep beams in collision as the beam size reduces below during the physics fill due to synchrotron radiation damping.
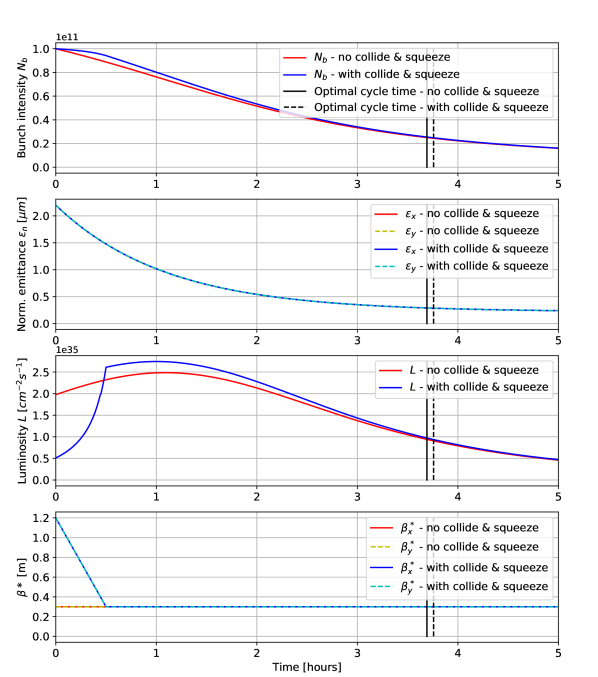
Simulations of collective effects have determined a change of the operational mode that will now assume a collide and squeeze approach [7]. This represents an easy mitigation without a significant penalty in integrated luminosity. Beams will collide at larger , around 1.2 m, and continue the squeeze to the minimum beta while colliding. This will avoid the reduction of the stability area due to long-range beam-beam effects acting against the stabilizing effect of the octupole magnets and will provide enough margin in stability as required by the Run 2 experimental evidences of the LHC. Figure 2 shows an example of how FCC-hh physics fill could look like with a collide & squeeze scenario with decreasing linearly from to in 30 minutes compared to collision without collide & squeeze. It should be noted that the average luminosity production is not reduced significantly in this scenario since the optics squeeze is happening during collision, shortening the turn-around time (not pictured). The simulations in Fig. 2 neglect emittance growth from luminosity burn-off, recently evaluated in [8].
2 System Layout and Optics
This section describes the layout and the optics designs of the high and low luminosity EIRs. An alternative optics design for the high luminosity EIR without crab cavities is also presented.
2.1 Baseline Design of the High Luminosity EIRs
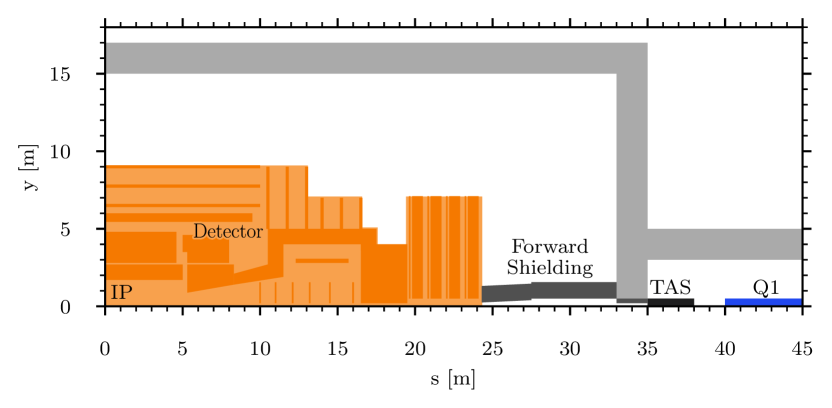
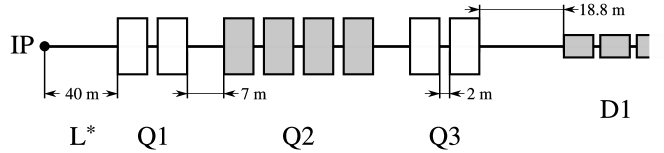
Early studies of the final focus system layout concluded that the main contributor to the minimum is the overall length of the triplet, while the drift between the IP and first quadrupole , , plays a minor role [1, Sec. III D]. This led to a clear strategy to minimize with significant amounts of shielding reducing the free aperture of the final focus magnets: to choose the smallest that does not restrict the detector design and to increase triplet length until dynamic aperture or chromaticity become obstacles. In this strategy the machine-detector interface plays a key role as it defines . A sketch of the detector region layout is shown in Fig. 3. While the detector has a total length of about , extending to on either side of the IP, the opening scenario requires a total cavern length of . During operation, the gap between detector and cavern wall will be occupied by the forward shielding that protects the detector from secondaries back-scattered from the passive absorber for charged particles (TAS), a long copper absorber that protects the final focus magnets from collision debris. The aperture in the thick wall between cavern and tunnel is equipped with a cast iron absorber to complete the forward shielding. The TAS is located to from the IP. With an additional space of reserved for vacuum equipment and for the end of the magnet cryostat, first quadrupole of the final focus triplet starts at .
The beam pipe at the IP is made of thick beryllium and has an inner radius of . This pipe extends to to either side of the IP and is followed by a beryllium cone with an opening angle of corresponding to a pseudorapidity of . From from the IP on, the inner radius of the aluminium beam pipe is constant at , this is necessary for the opening of the detector.
The interaction region layout of FCC-hh follows the same principles as the LHC and HL-LHC interaction regions. The layout is shown in Fig. 4.
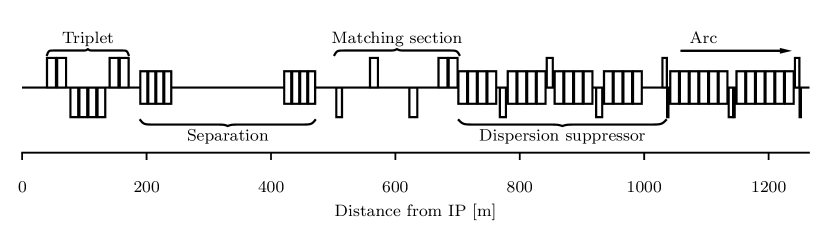
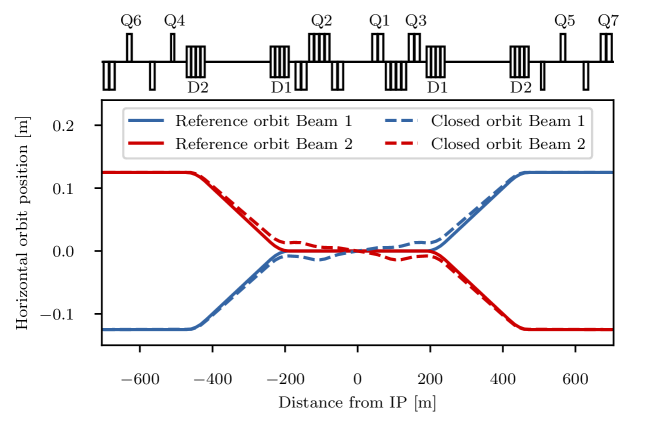
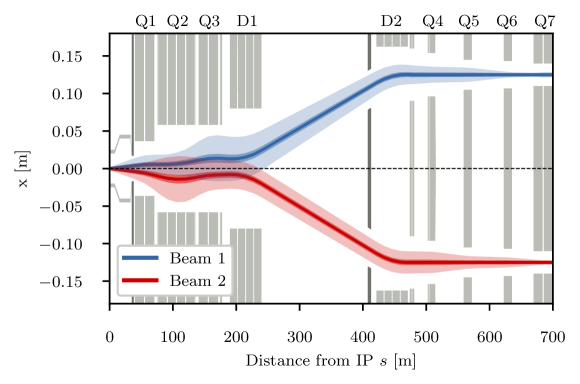
Starting at the interaction point, the strongly focused and highly divergent beams pass a drift space with the length chosen to accommodate the detector. Following this drift space, a final focus system comprised of three large aperture quadrupoles (hence called the triplet) focuses the beams in both the horizontal and vertical planes. The triplet consists of single aperture magnets that host both beams. The triplets on both sides of the IP are powered antisymmetrically. This has the advantage that the triplet region is optically identical for both beams. Behind the triplet, a shared aperture dipole D1 separates the two beams. After a drift, the double bore dipole D2 bends the separated beams onto parallel orbits again. The resulting reference orbits are shown in Fig. 5. Also depicted are orbit excursions that let the two beams collide with a crossing angle in order to avoid parasitic collisions outside the detector area.
Four more quadrupoles Q4-Q7 make up the following matching section that occupies the rest of the straight section. The straight section is connected to the arcs by a two cell dispersion suppressor. To provide enough degrees of freedom to match all required beam parameters from the IP to the arcs, the four matching section quadrupoles, the three individually powered quadrupoles of the dispersion suppressor Q8-Q10 as well as three tuning quadrupoles in the first arc cell QT11-QT13 are used for the matching procedure.
2.1.1 Final Focus Triplet
The final focus design strategy calls for a long triplet in order to achieve small values. In practice, not only chromaticity and dynamic aperture were limiting factors for the triplet length, but also the total length of the straight section that determines the arc side focal length of the final focus system, as well as the strength of the Q7 quadrupole. Furthermore the lengths of individual magnets must be equal or below in order to be compatible with a cryostat length of . The relative lengths of Q1, Q2 and Q3 were adopted from HL-LHC. As suggested in [9], Q1 was chosen to have a smaller aperture and higher gradient than Q2 and Q3 in order to minimize . The specification for the triplet quadrupoles are listed in Table 11 and the layout of the final focus triplet shown in Fig. 6. Q1 and Q3 are made up of two submagnets each with length of . For the interconnects a drift space of is reserved between the submagnets. The drift between Q1 and Q2 as well as Q2 and Q3 is longer at and must house orbit correctors, BPMs and vacuum equipment. Q2 consists of four long submagnets. This not only allows for a similar length ratio as in the HL-LHC but also to place orbit correctors in the cryostat of the outermost Q2 magnets. Behind Q3, of space are reserved for higher order multipole correctors to compensate triplet field errors.
A thick inner shielding of the tungsten alloy INERMET180 protects the triplet magnets from collision debris. Furthermore the free aperture is reduced by a gap for the liquid helium for cooling, the Kapton insulator, a beam screen, a gap for the insulation of the beam screen as well as the cold bore that scaled with of the coil aperture radius. The individual radial thickness of these layers are detailed in Tab. 2 and have been modeled as simple layers.
| Component | Radial Thickness |
|---|---|
| Cold bore | 5.44 % of coil radius |
| Liquid helium cooling | 1.5 mm |
| Kapton insulation | 0.5 mm |
| Beam screen | 2.05 mm |
| Beam screen insulation | 2 mm |
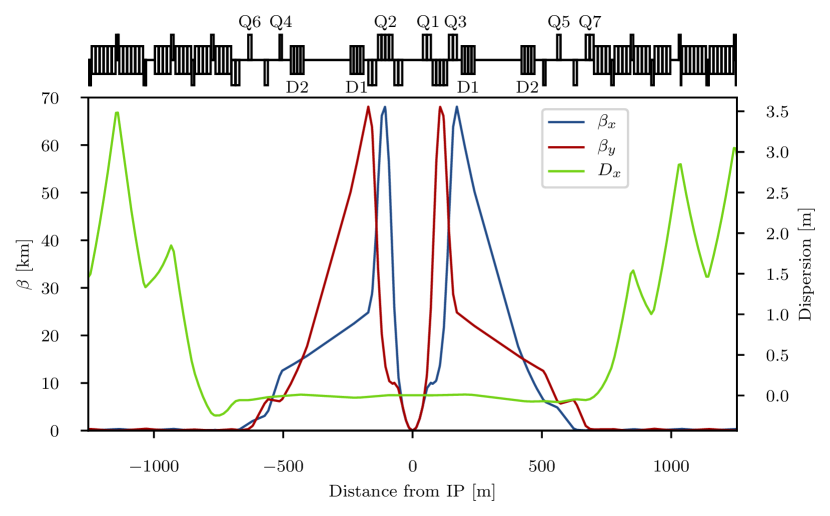
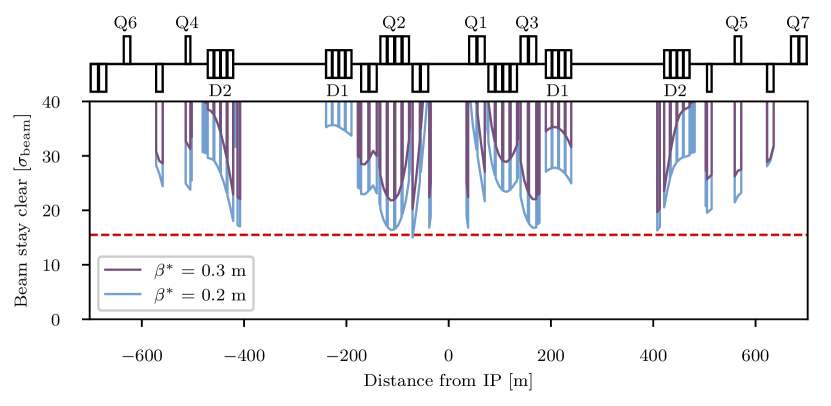
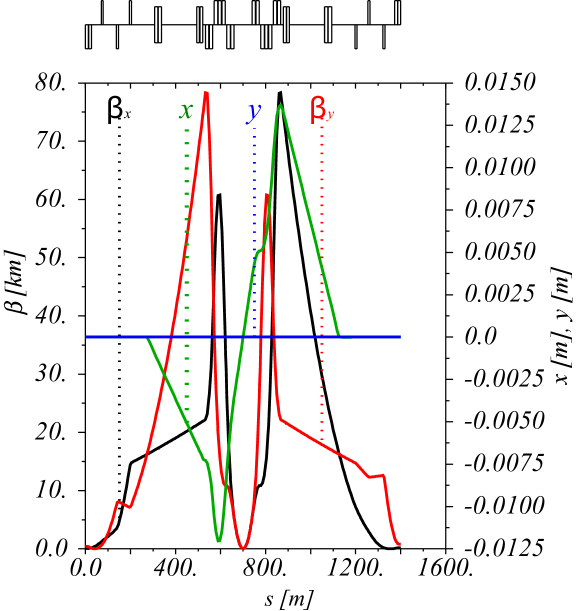
Despite this significant reduction of the free aperture, the triplet can accommodate a beam with lower than ultimate . Figure 7 shows the functions and horizontal dispersion in the Experimental Insertion Region (EIR) and Fig. 8 the corresponding aperture usage. Although aperture and alignment tolerances are not included in Fig. 8, the beam stay clear depicted in Fig. 9 clearly shows that the ultimate optics have a significant margin in terms of aperture. In fact, optics with almost can be achieved, although the chromaticity correction will not suffice with the current arc layout.
2.2 Alternative Triplet and Flat Optics of the High Luminosity EIRs
In parallel to the final focus triplet described in Section 2.1.1, efforts were made to design an alternative triplet [10]. This alternative was designed using an algorithm that systematically scans the design parameter space to find the shortest possible triplet that has sufficient beam stay clear and shielding [11]. In a first approximation, the code scans through the entire design parameter space to estimate the beam stay clear using the thin lens approximation. It then does a more precise scan using the MAD-X aperture module in a smaller area identified by the approximation.
The design was worked on iteratively with energy deposition studies to determine the right amount of shielding required to protect the triplet from the collision debris. In a first iteration, the optimisation code was used to find the shortest triplet with 1.5 cm of tungsten shielding. This triplet was integrated into the baseline EIR and energy deposition studies were performed to estimate the amount of shielding needed. Next, the triplet was optimised again with the new shielding estimate and again integrated and tested. This process was repeated several times until a triplet was found that is as short as possible whilst still having sufficient beam stay clear and shielding.
In the course of this optimisation it was found that peaks in energy deposition could be minimized if all triplet quadrupoles had similar coil radii [12, 13]. Therefore, the optimisation code was modified to find triplets made of quadrupoles of equal radii. In order to fulfil the technical requirements, the quadrupoles of the ideal solution had to be split into sub-magnets that were no longer than 15 m. The resulting triplet consisted of seven 15 m sub-magnets with equal radii and similar gradients – the details of the magnets in this triplet are shown in Table 3. Like the baseline triplet, the main quadrupoles in the alternative triplet are separated by 7 m drifts to leave space for correctors and instrumentation, whilst the sub-magnets only need 2 m separation to leave room for connectors.
| Parameter | Quadrupole | ||
|---|---|---|---|
| Q1 | Q2 | Q3 | |
| Sub-Magnets | 2 | 3 | 2 |
| Sub-Magnet Length [m] | 15 | 15 | 15 |
| Coil Radius [mm] | 96.5 | 96.5 | 96.5 |
| Gradient [T/m] | 106 | 112 | 99 |
| Shielding [mm] | 44.2 | 33.2 | 24.2 |
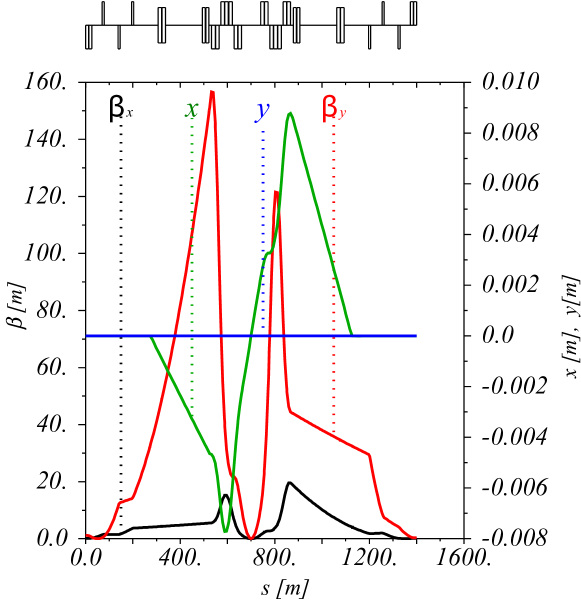
The triplet was integrated into the same EIR as in Section 2.1.1, leaving the same 18.8 m drift between Q3 and the first separation dipole for the correction package. The matching quadrupoles in the EIR were used to match the Twiss functions to the arc. The resulting optics in the triplet are shown in Fig. 10, which also shows the beam orbit for a crossing in the horizontal plane.
Once the triplet was integrated the beam stay clear in the individual quadrupoles was reassessed and the shielding was increased wherever possible. This lead to an increase in shielding in Q2 and Q1 by 9 mm and 20 mm respectively. These increases are possible because the functions and orbit are smaller near the front of the triplet, hence leaving more space for potential shielding. This distribution in shielding is advantageous since most of the collision debris will hit the magnets closer to the IP. The exact amounts of shielding are also shown in Table 3.
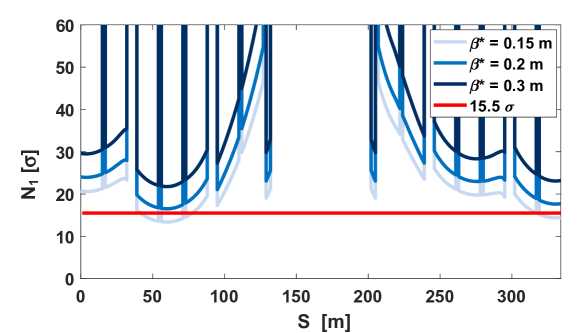
Whilst the ultimate collision optics aims for a of 0.3 m, the shielding was designed to leave for an optics with a of 0.2 m to provide a luminosity handle. The aperture studies were performed using the same technical specifications for the cooling, cold bore and beam screen as outlined in Section 2.1.1 and the results are shown in Fig. 11. As one can see from Fig. 11, the alternative triplet can comfortably reach a of 0.3 m and even 0.2 m. Figure 11 also shows the beam stay clear for a case with 0.15 m, whilst this is lower than the required it may still be a viable option should the beam current be low enough to change the collimator settings accordingly. A low beam current may be one of the reasons why the would need to be decreased in the first place to compensate for the loss in luminosity.
The alternative triplet can also be used for a flat optics, which can be exploited to compensate for the luminosity loss in case crab cavities are not feasible[12, 14]. Without crab cavities the average integrated luminosity with round optics would decrease from to per day, however, the proposed flat beam optics could still achieve a luminosity of per day, without crab cavities. This can be achieved without changing the gradients in the triplet but re-matching the functions using the matching section quadrupoles. In this initial study we assumed a flat optics. Detailed studies should be conducted. Table 4 shows a comparison between the main parameters of the round and flat optics.
The normalized separation for the flat optics is set at a value 30 % higher than for round optics. This is achieved by an increase in the crossing angle. The reason comes from beam-beam studies, that requires an increase in beam to beam separations at the long-range encounters in the case of flat optics to maintain the dynamic aperture similar to the equivalent round optics case. This is due to two factors: an uncompensated tune shift that can be in average corrected for and a different dimension of the detuning with amplitude. Preliminary results can be found in [15]. For our final beta ratio of 8 an 80 % larger normalized beam to beam separation is needed. However thanks to the collide and squeeze operation this need comes only when the beam emittances have shrunken significantly and the beam intensities have been reduced by 10%. We therefore assume that only a 30% larger normalized separation is required for this study case.
| Parameter | Round | Flat |
| [m] | 0.3 | 1.2 |
| [m] | 0.3 | 0.15 |
| Full crossing angle [rad] | 200 | 130 |
| Beam-beam separation [] | 17 | 22 |
2.3 Low luminosity EIRs
In addition to the high luminosity IRs, located around points A and G, the FCC-hh will also host two low luminosity experimental insertions in points B and L. Similar to the LHC, in these insertion also the beams from the injector chain will be injected upstream of the experiments. Due to initial injection hardware considerations, the length of half cells containing such hardware has been set to . Contrary to the LHC injection/experimental insertions, two additional half cells were added after the injection cells. These give the possibility to add more injection protection elements to protect both the superconducting magnets and experiment from misinjected beam. Due to this, the interaction point is not located in the center of the straight section but rather further downstream. Unlike the high luminosity experimental insertions, currently no required performance is established for these low luminosity experiments and subsequently no target can be specified. Similarly, due to the lack of a detector design and required cavern length, has been tentatively set to . The layout of this combined injection/experimental insertion for point B based on these considerations is presented in Fig. 14.
The final focus triplet left and right of the interaction point consists of three quadrupoles. Each one of these quadrupoles is split into two submagnets to keep the magnet length below . Each one of the Q1 and Q3 submagnets has a length of wheres each Q2 submagnet is long. Between each submagnet, a drift space with a length of has been reserved for the interconnects. All triplet quadrupoles have the same coil aperture of . The specifications of the triplet quadrupoles can be found in Tab. 17. This aperture is further reduced, because of the presence inside the coil of a liquid helium layer, a Kapton insulator layer, and the stainless steel cold bore, using the same specifications as described in Tab. 2. A thick tungsten (INERMET180) shielding is finally put inside the cold bore to mitigate the radiation in the superconducting coils. The available radial aperture for the beam is therefore reduced to . In order to keep the separation section after the triplet as short as possible a superconducting solution was chosen. Using two long shared aperture separation dipoles D1 with a field strength of and two long double aperture recombination dipoles D2 with a field strength of the length of this section can be keep under . Due to the aforementioned considerations on the injection hardware and the added additional cells, the matching sections on the left and right hand side of the insertion do not have the same length. On the non-injection side of the insertion, four matching quadrupoles make up the matching section which is long. The long matching section on the injection side of the insertion consist six matching quadrupoles. Between Q8 and Q9 the injection septum (MSI) is located which deflects the injected beam in the vertical plane. In the following half cell between Q7 and Q8 the injection kicker system (MKI) is installed which provides a horizontal kick to put the injected beam on the closed orbit. The quadrupole Q8 between the MSI and the MKI was chosen to be horizontally defocussing to provide an additional horizontal kick which helps in reducing the required kick strength of the injection kickers. A long absorber (TDI) to protect superconducting magnets further downstream from misinjected beam is installed in the cell between Q6 and Q7. Each of these half cells is long.
Both the optics for collision energy as well as for an injection energy are presented in Fig. 15.
At collision energy a minimum of has been matched. The crossing angle for these insertion has obtained from scaling the normalized separation of the high luminosity insertion [16] with the reduced number of long range encounters. This leads to a normalized separation of , corresponding to a half crossing angle of . With this crossing angle the beam stay clear in the triplet is well above the minimum allowed beam stay clear of and could be further increased, which is illustrated in Fig. 16.
However, a crossing angle of at full intensity as detailed in Section 3.2 would lead to a beam stay clear below limit of . To comply with both constraints, the at begin of collision then has to be set to . The minimum of could then be reached after 1.5 hours, assuming a reduction of the separation to at this point. During collision, the beams are always colliding with transverse offset to keep the head-on beam-beam tune shift from these two experiments below .
At injection energy, the crossing angle is limited by the triplet aperture to a beam separation of . Further studies are required to assess the viability of this separation. If the separation proves to be insufficient, the shielding in the triplet could be reduced, in turn potentially decreasing also the achievable integrated luminosity.
For the injection optics various constraints had to be taken into account to provide optimum injection protection efficiency. The horizontal phase advance between the MKI and the TDI should be to ensure any kicker failure translating into an orbit offset at the TDI. The beta functions at the TDI were matched to the largest possible values to increase the beam size which in turn reduces the peak energy density in case of an injection kicker malfunction. Furthermore, the dispersion function in the straight section is kept below .
As the injection of beam 2 will take place in point L the low luminosity insertion for this straight section is mirrored with respect to s. Here the interaction point is located upstream of the middle of the straight section for beam 1. Both the collision optics with a of and injection optics with a of are illustrated in Fig. 17.
2.4 Crab Cavities
In the long shared aperture section around the IP, the two counter rotating beams must be separated by an orbit bump in order to avoid parasitic beam-beam encounters that occur every left and right of each IP. The two beams only cross each other at the IP with a crossing angle . The crossing angle determines the separation of the beam in the shared aperture and thus the long range beam-beam separations. The minimum crossing angle was determined by beam-beam studies to be for the ultimate of and then scaled for other optics to provide the same normalized separation of for the maximum bunch intensity. Table 5 list the crossing angle for a set of collision optics together with the luminosity reduction factor caused by the reduced geometric overlap of the bunches at the IP due to the crossing angle. For ultimate optics and beyond, FCC-hh is not able to provide even half of the luminosity head-on collisions would provide. It is clear that the luminosity reduction in the high luminosity EIRs must be compensated by crab cavities.
| Optics version | [] | Full crossing | Luminosity |
| angle [] | reduction factor | ||
| baseline | 1.1 | 104 | 0.85 |
| ultimate | 0.3 | 200 | 0.40 |
| beyond ultimate | 0.2 | 245 | 0.28 |
Initial studies with crab cavities show that a crab voltage of per beam on either side of each high luminosity IP is needed to provide full crabbing in ultimate optics, corresponding to in total. Half of this voltage must be horizontally deflecting in one EIR, the other half vertically deflecting in the other EIR. For optics beyond ultimate parameters, the crab voltage increases up to . Orbit leakage of the crab orbit into the arcs varied strongly during the evolution of the lattice. In the latest lattice version it appears to be small, causing only small orbit aberrations in the other IPs. More detailed studies should be performed to get a better control of the orbit leakage in the future. The crab orbits and orbit leakage into the other high luminosity EIR are shown in Fig. 18 for ultimate optics.
3 Dynamic Aperture Studies
The insertion regions presented in the previous sections have been integrated into the FCC-hh lattice and Dynamic Aperture (DA) studies are run to validate the particle stability. Below simulations without and with beam-beam interaction are presented.
3.1 Dynamic Aperture with Triplet Errors
This section covers DA studies run at collision energy to evaluate the impact of errors on the magnets and analyze possible correction schemes to achieve the minimum DA necessary to ensure the stability of the beam. The studies covered in this section do not include beam-beam effects, and therefore, based on the experience of the LHC, the target DA was set to be 10. DA studies including beam-beam effects, with a corresponding lower target DA are covered in Section 3.2.
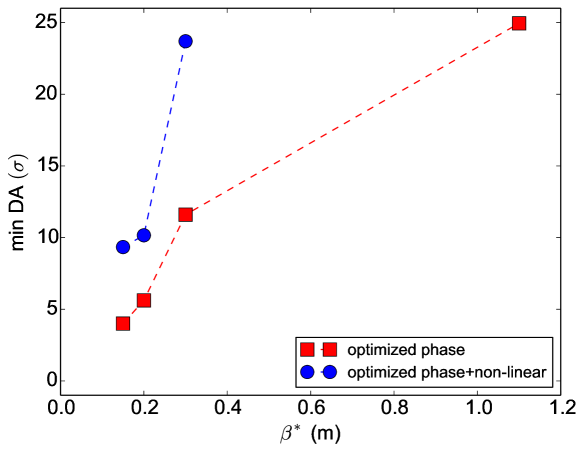
Given the large beta functions and integrated length of the quadrupoles of the final focus triplet of the high luminosity EIRs, the effects of systematic and random non-linear errors in the magnets had a severe impact on the stability of the beam. Therefore, DA studies at collision energy with errors on the triplet and crossing angle on proved to be challenging. Several corrections were implemented to compensate for the reduction on DA, but it was found that at collision energy two corrections were particularly important to achieve a DA above the target: the first one is to optimize the phase between the main IRs (IRA and IRG), which comprises running simulations to find which phase provided the best compensation between the errors of both IRs and therefore the higher DA; and the second one the implementation of non-linear correctors in the IR, to minimize the resonance driving terms arising from the errors in the triplet.
The minimum DA vs at collision energy with errors on both the arcs and the triplets, and with and without non-linear correctors is shown on Fig. 19. A significant increase is observed on all cases when adding the non-linear correctors, except for the case with =1.1 m whose DA is already large without non-linear correctors. The ultimate case with =0.3 m shows a DA above the target of 10 even without non-linear correctors, by optimizing the phase advance between the main IRs and other corrections; however, the use of non-linear correctors is still recommended in case other errors affect the DA. In the presence of beam-beam effects different optimized phases are required and detailed optimization should be foreseen. The figure also shows dynamic apertures for optics with below the ultimate 0.3 m. The use of non-linear correctors becomes essential for these cases.
3.2 Beam-Beam effects and crossing angle
The beam-beam interaction can limit the performance of a particle collider. In fact, the beam-beam interaction can induce particle losses, resulting in a reduction of the beam lifetimes and can create a high background for physics experiments. In addition, the beam-beam interaction can be responsible for an elevated heat and radiation load on the collimation system, can induce emittance blow-up and can cause coherent beam instabilities with a consequent reduction of the luminosity reach.
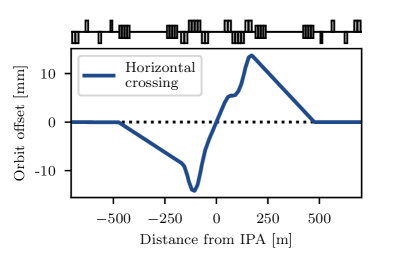
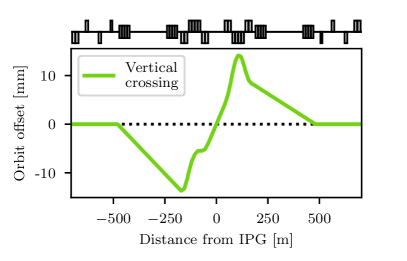
The design of FCC-hh is based on the LHC beam-beam theoretical studies and experience [17, 18, 19, 20]. The beams collide head-on in two high luminosity interaction points (IPA and IPG). According to the filling scheme used, the bunches experience different number of head-on and long range collisions generating two different families of bunches [21]. The so-called Nominal bunches are located in the middle of a train while the PACMAN bunches are located in the head or in the tails of the train. Due to empty slots at the interaction points the PACMAN bunches experience fewer long range interactions than Nominal bunches, leading to different beam-beam effects. As for the LHC and the HL-LHC, an alternating crossing scheme is chosen for the two high luminosity experiments in IPA and IPG, in order to passively compensate for tune and chromaticity shifts for PACMAN bunches [22]. In these studies we have assume the beam crossing with a finite horizontal angle for IPA and a vertical one in IPG as shown in Fig. 21. Different schemes have also explored and seem feasible with reduced beam-beam long-range effects [23] but will require further studies. Two additional, lower luminosity experiments are located in IPB and IPL. Assuming that the four experiments operate in proton-proton collisions with 25 ns bunch spacing, 352 long range encounters are expected compared to the 120 long range beam-beam interactions of the LHC. Detailed beam-beam studies have been carried out by means of weak-strong as well as strong-strong models by using the SixTrack [24, 25] and COMBI [26, 27, 28] codes. The SixTrack code has been used for the computation of the area of stable motion in real space, the DA. A detailed lattice description and the LHC experimental data have been employed for the benchmark of the SixTrack code with and without beam-beam effects [29, 30]. The COMBI code makes use of a self-consistent treatment, including a simplified lattice description, and provides the evolution of macroscopic beam parameters, such as, the beam intensity and the emittance together with the Landau damping of coherent beam instabilities [20, 31]. For the DA studies presented here, the approach used is similar to the LHC and HL-LHC design studies [32, 33]. The LHC observations have shown that below a simulated DA of 4 a reduction of beam lifetime starts to appear [17]. As described in [29, 34] a strong correlation exists between the beam intensity lifetime and the simulated DA for different beam configurations with and without beam-beam interactions. The conservative approach to ensure the good performance of the machine is to target a DA with beam-beam as large as the collimation gap, which is 7.2 for FCC-hh. As it is shown in Fig. 20, a DA of 7.2 is ensured with a crossing angle in IPA and IPG for the nominal normalized emittance of and at the Ultimate of . The corresponding orbit bumps at the two interaction points are shown in Fig. 21 and the beam-beam long range separations in units of the transverse beam size are shown in Fig. 22. For the Ultimate scenario with and the chosen crossing angle of (the blue dots), the long range separation at the first encounter is 17 . At this separation, the value of DA (7.2 ) is well above 4 providing sufficient margin to avoid additional particle losses on the collimation system due to beam-beam diffusive mechanisms (including a relative momentum deviation of ).
In addition, margins are also left for high chromaticity operations (up to 20 units) if required for mitigation of coherent beam instabilities, for operating in the presence of multipolar lattice errors [35] or to also collide in IPB and IPL. For the Baseline scenario with collisions at , the long range beam-beam separation is well above 30 (the red dots).
The DA as a function of the crossing angle in IPA and IPG for PACMAN bunches is shown in Fig. 23 (the blue and the green lines) for the H-V alternating crossing scheme. The red line corresponds to Nominal bunches. As visible, the DA for PACMAN bunches is always above the DA for Nominal bunches. The PACMAN effects of tune and chromaticity shifts are negligible assuming the passive compensation with alternating crossing planes in IPA and IPG [23].
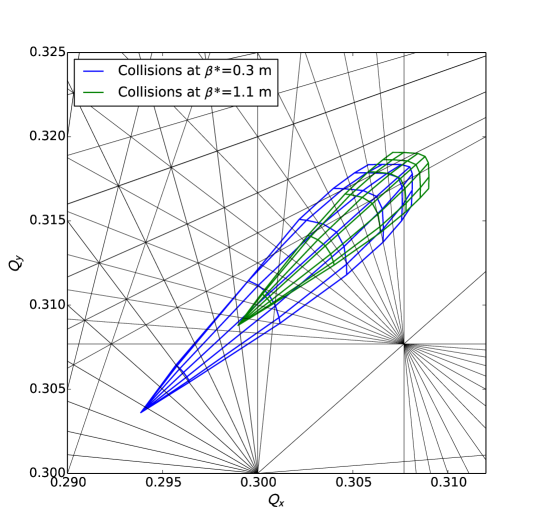
The two-dimensional expected tune footprints for particles up to 6 amplitude are shown in Fig. 24 for the two values of ( and ) with and without the effects of the long-range beam-beam effects. Without long-range beam-beam effects the tune spread in frequency is generated by the Landau octupoles (the blue color) at maximum strength and powered with negative polarity as described in [36]. The tune spread is then reduced by the long-range beam-beam effects depending on the interactions strength. In Fig. 24 the Ultimate scenario with , corresponding to a minimum beam to beam separation at the long-range encounters of 17 (the green color) and the the Baseline scenario with (the red color) at relaxed beam to beam separations of 32 , are shown. Despite the tune spread reduction due to the beam-beam long-range compensating the octupole spread, such configuration is preferred because it maximizes the DA [37]. The strategy proposed for the FCC is to collide head-on at the two main IPs before the long-range interactions reduce significantly the tune spread provided by the Landau octupole system. Such reduction occurs during the betatron squeeze and collisions should be foreseen around 1.1 meters , value at which no reduction on the tune footprint is visible (the red color in Fig. 24) compared to the pure Landau octupoles tune spread (the blue color in Fig. 24).
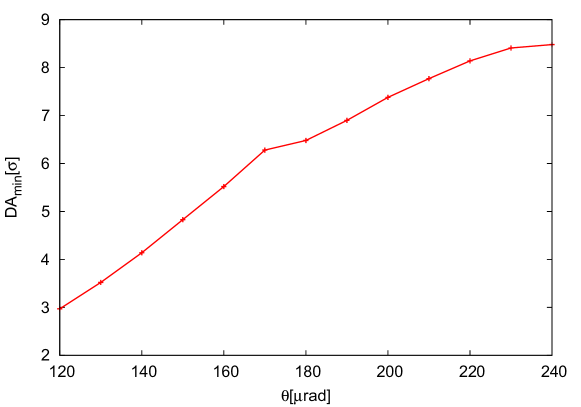
If no coherent instabilities are observed, a reduction of the crossing angle at is possible down to a minimum value of . In fact, for this value of the crossing angle a DA of 7 is still preserved since the beam-beam long range separations (the green dots in Fig. 22) are the same as the Ultimate case with a crossing angle of (the blue dots in Fig. 22).
The beam parameters of the ”Collide & Squeeze” scheme, together with the luminosity evolution, are shown in Fig. 2 as function of time. When the Ultimate is reached the normalized emittance is reduced to due to synchrotron radiation, as shown in Fig. 2. The corresponding beam-beam long range separations are also shown in Figure 22. As expected the long range beam-beam separation at the first encounter is larger w.r.t. the Ultimate case and it is about 20 (the light blue dots).
In order to keep the impact of the two low luminosity experiments IPB and IPL in the shadow of the high luminosity ones, IPA and IPG, a crossing angle of is required for the optics at these two experiments. As visible in Fig. 25 the DA does not depend anymore on the crossing angle because it is defined by the dynamics of IPA and IPG. In this configuration the long-range effects of IPB and IPL are negligible and the impact of the long-range beam-beam effects coming from these two experiments can be neglected leaving more margin to push the performances of IPA and IPG.
The total beam-beam tune shift for two head-on collisions in IPA and IPG will be , as also visible in Fig. 26, where the two dimensional tune footprints with two head-on collisions in IPA and IPG are shown for the Baseline scenario with (the green color) and for the Ultimate scenario with a reduced normalized emittance (the blue color) in order to take into account the effect of the synchrotron radiation shown by the emittance reduction in Fig. 2 at the end of the ”Collide & Squeeze”. For the case with the reduced normalized emittance () the total head-on beam-beam tune shift increases up to approximately 0.016 (the blue color in Fig. 26). Since the total beam-beam tune shift is limited to be less than 0.03 [22, 38, 39, 40] the two low luminosity experiments IPB and IPL are required to operate with a transverse offset resulting in a maximum tune shift of . However if the total beam-beam tune shift approaches the value of 0.03 and it is not tolerated, mitigations can be applied such as the blow-up of the transverse emittances with controlled noise.
4 Energy Deposition from Collision Debris
This section evaluates energy deposition from collision debris in the IR for the nominal design, alternative triplet and low luminosity experimental insertions described in Sec. 2.
4.1 Nominal Design
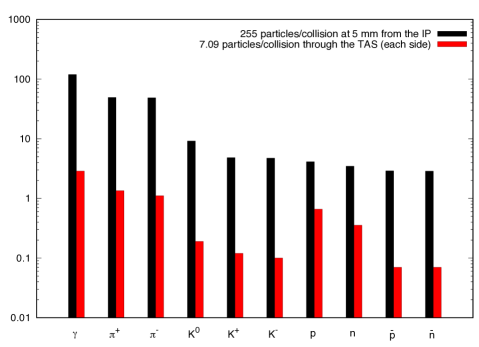
Proton-Proton inelastic collisions taking place in the FCC-hh, particularly in the two high luminosity detectors, generate a large number of secondary particles. Moving away from the IP, this multiform population evolves even before interacting with the surrounding materials due to the decay of unstable particles, such as neutral pions which decay into photon pairs. Most of these particles are intercepted by the detector and release their energy within the cavern. However, the most energetic particles, emitted at small angles with respect to the beam direction, travel farther inside the vacuum chamber and reach the accelerator elements, causing a significant impact on the magnets along the EIR, particularly in the final focusing quadrupoles and the separation dipoles. Fig. 27 shows the particle population close to the interaction point and at the exit of the TAS: the average multiplicity of a single c.m. proton-proton inelastic interaction is 255. At ultimate instantaneous luminosity conditions () the power released toward each side of the IP is , that is impacting upon the FCC-hh elements and consequently dissipated in the machine, the nearby equipment (e.g. electronics racks), and the tunnel walls. It is important to study how these particles are lost in order to implement the necessary protections for shielding sensitive parts of the machine and in particular of the magnets.
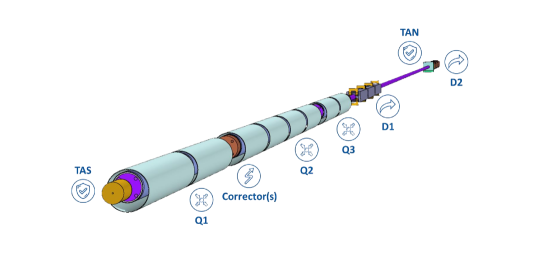
In this context, Monte Carlo simulation of particle interaction with matter plays a crucial role relying on a detailed implementation of physics model and an accurate 3D description of the region of interest. The FLUKA code [41, 42] is extensively used in this conceptual design study, based on the experience collected in the LHC and HL-LHC design [43] as well as the benchmarks already available in literature for these machines [44]. Fig. 28 shows part of the FLUKA model of the EIR, for the latest layout available at the time of the simulation () including of accelerator line with the inner triplet, the separation and recombination dipoles (D1 and D2), the TAS, the Target Absorber Neutrals (TAN), and the matching section (Q4-Q7). The following coil apertures (in diameter) were implemented in the model: Q1 (MQXC) , Q2 (MQXD) and Q3 (MQXE) , orbit correctors , Q4 (MQY) , Q5 (MQYL) and Q6 (MQYL) , Q7 (MQM) . The matching section quadrupoles include a rectellipse beam-screen modelled according to optics constraints. To protect the inner quadrupoles coils, a thick tungsten shielding was implemented in the mechanical design of the triplet magnets and the orbit correctors: the shielding thickness reported in this study is the maximum allowed in order to comply with optics requirements. The first separation dipole, D1 (MBXW), is a single aperture warm dipole, with a pole tip aperture of . The TAN, made of a long tungsten absorber, includes twin diverging apertures of . D2 (MBRW) is a twin aperture warm dipole: each module has been modelled with two parallel bores centered at a separation distance varying from the first to the last, in order to reach on the non-IP side the arc value of . Proton-proton collisions at 100 TeV c.m. with a vertical half crossing angle of have been simulated and the particle shower was tracked all along the accelerator elements [45, 46]. The study of the matching section requires an extreme computational effort to achieve a statistically meaningful outcome and therefore it is planned to be finalized at a later stage. Results concerning the triplet-D2 area are presented in the following.
The total power deposited in the cold magnets (Tab. 6) is shared between the cold mass and the massive tungsten shielding, with a 15-85 ratio. In particular, the Q1B (MQXC.B1RA) turns out to be the most impacted element of the triplet with a total power of about in the cold mass and in the shielding.
| Element | Total Power [] | ||
|---|---|---|---|
| Cold Shielding | Cold Mass | Warm Mass | |
| TAS | |||
| Q1a | |||
| Q1b | |||
| C1 | |||
| Q2a | |||
| Q2b | |||
| Q2c | |||
| Q2d | |||
| C2 | |||
| Q3a | |||
| Q3b | |||
| C3 | |||
| D1a | |||
| D1b | |||
| D1c | |||
| D1d | |||
| TAN | |||
| D2a | |||
| D2b | |||
| D2c | |||
| D2d | |||
Fig. 29 shows the absorbed power profile (in ) along the TAS-D2 region, where triplet cold mass and shielding contributions are added up. In the Q1B cold mass a linear power loss of is reached. On the other hand, a preliminary evaluation, based on the cooling capabilities of the beam-screen of the main dipoles, indicates that four helium tubes of diameter, placed in a pattern with respect to the mid planes, would allow to dissipate the () deposited in the Q1B shielding [46]. The possibility of a shielding mechanical design embedding such a cooling circuit is currently under investigation.
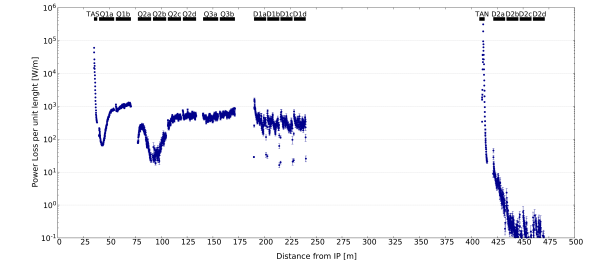
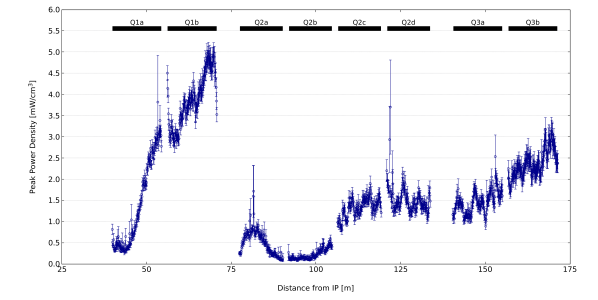
Figure 30 shows the peak power density profile in the triplet quadrupole coils, reaching a maximum of at the end of the Q1B that matches with no margin a first conservative estimate of the quench limit. Studies to better determine the latter are currently ongoing [47]. Recently, [48] showed that the Nb3Sn HL-LHC dipoles are expected to withstand steady state loads ten times higher.
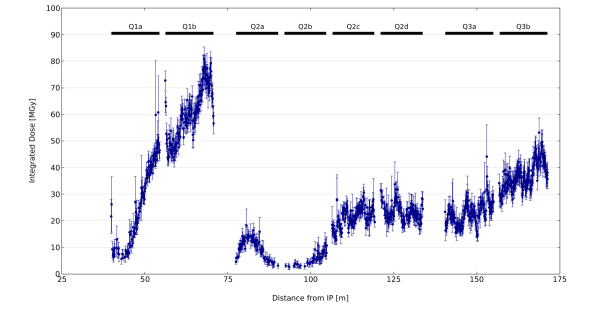
To estimate the integrated luminosity reach with respect to the insulator lifetime, the absorbed dose in the magnet coils was calculated. Figure 31 shows the peak dose profile for the ultimate integrated luminosity goal (). Assuming an operational limit of for conventional radiation resistant insulator materials, the most critical element (Q1B) exceeds it by a factor . As previously mentioned, the model is already containing the maximum shielding thickness allowed by beam aperture requirements (). Nevertheless, a Q1 split featuring a larger Q1B aperture at the price of a lower gradient, to be compensated in the Q1A, would allow a respective increase of the shielding thickness reducing the maximum dose. Moreover, crossing angle polarity and plane alternation are known to significantly reduce the maximum dose, by more equally distributing the radiation load in the coils [45]. Finally, the dose limit might be increased by using more radiation hard insulator, e.g. epoxy/cyanate-ester blends [47]. Alternatively, the replacement of the inner triplet once during the FCC-hh era might be considered.
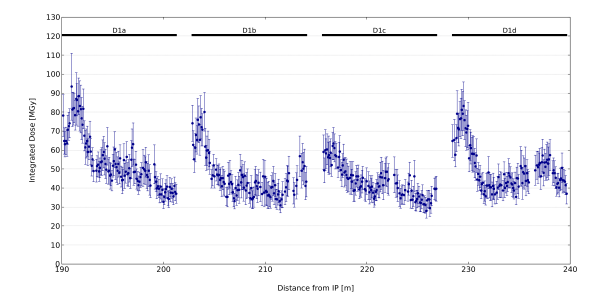
With regard to the warm dipoles, the peak dose profile in D1 is reported in Fig. 32. Both D1 and D2 have been modelled without embedding any shielding but with a design moving the return coils far from the beam pipe, to reduce their exposure to the collision debris. This solution allows already for an important gain. However, the picture is rather similar to what was shown above for the triplet quadrupoles, with a peak dose in the first module (D1A) evaluated to be three times the limit. In this case, a front mask as well as internal shielding can offer a substantial benefit. With regard to D2, the highest value expected at the D2A IP end is below , while peak doses ten times lower have been found in the D2C and D2D. Thanks to the protection provided by the TAN, the D2 presents no major concern for the coil insulator lifetime, even for the ultimate integrated luminosity target.
4.2 Energy Deposition in Alternative Triplet
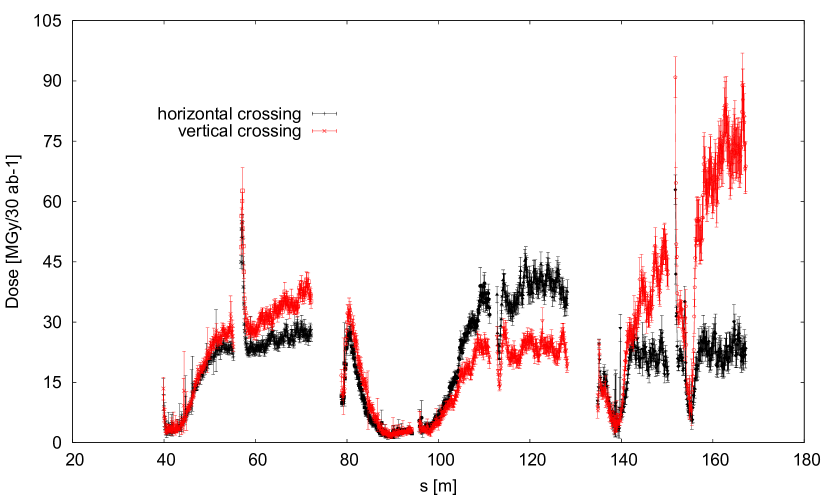
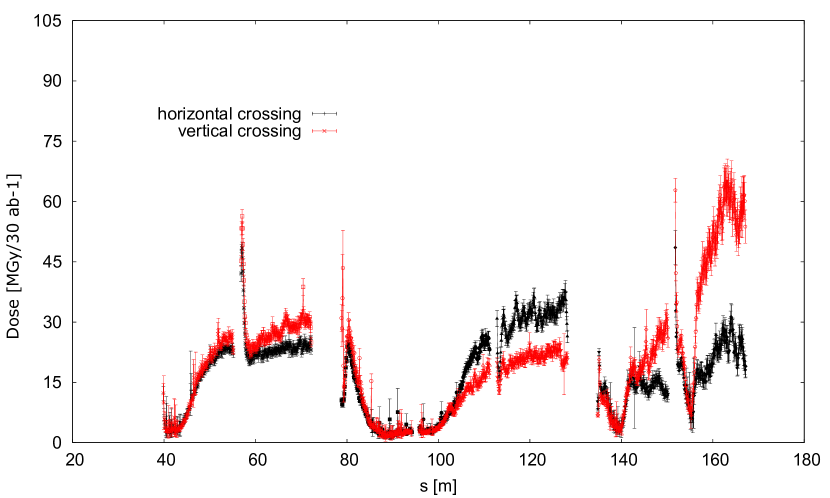
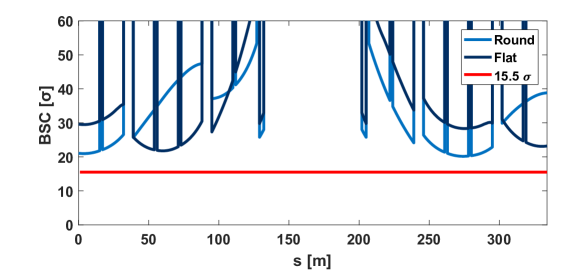
Figure 34 shows the peak dose in the triplet magnets along the longitudinal axis. The maximum dose is found at Q3, with a maximum of 30 MGy/10 ab-1 (excluding the peak at the beginning, that can be reduced by reducing the missing gap for the interconnects). This means 65 MGy for the entire life of the magnet, assumed to resist, at least, an integrated luminosity of 18.5 ab-1. The dose can also be reduced when using the alternate crossing scheme, in a similar ways as the baseline triplet [1, 45]. On the other hand, the peak dose profile for the alternative flat beam option is shown in Fig. 34. The peak dose is reduced to from 55 to 42 MGy for 18.5 ab-1, due to the lower crossing angle allowed by the flat beam optics.
4.3 Energy Deposition in the Low Luminosity EIR
The energy deposition in the low luminosity EIR has been assessed with FLUKA simulations, for both vertical and horizontal crossing.
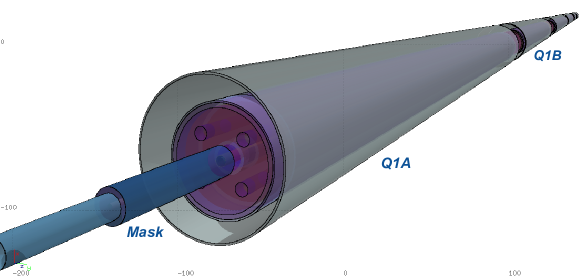
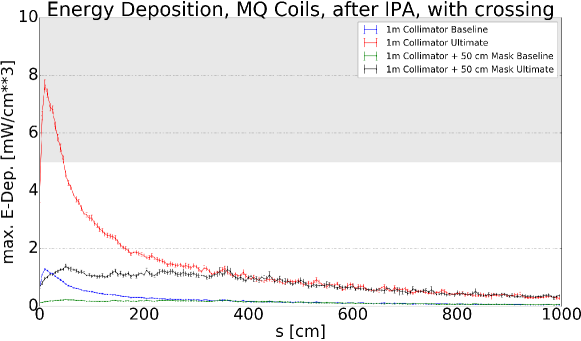
For this purpose, the insertion region has been modelled, as shown in Fig. 35. The quadrupole design is very similar to the one for the main EIR described in Section 2.1.1, but the model has been scaled down to cope with the smaller coil radius of 32 mm. In order to better protect the superconducting magnets, the 10 mm thick tungsten shielding is prolonged in the interconnect cold bore, with tentative gaps of 70 cm. In addition to this, a mask has been put in front of the Q1A, to shield its entrance. The mask is clearly visible in Fig. 35 and it is modelled as a 76 cm long tungsten (INERMET180) cylinder with an external radius of 81 mm and a free radial aperture of 13.26 mm.
The power impacting on the quadrupoles and the orbit correctors C1 and C2 is reported in Table 7 for the shielding and the cold mass separately, assuming an instantaneous luminosity of 51033 cm-2 s-1. Even if the mask in front of Q1A intercepts about 280 W, this magnet remains the most exposed and the total power on the cold mass is about 150 W for both crossing schemes.
| Magnet | Vertical Crossing [] | Horizontal Crossing [] | ||||
|---|---|---|---|---|---|---|
| Total | Shielding | Cold | Total | Shielding | Cold | |
| Mass | Mass | |||||
| Q1A | 249 | 101 | 147.9 | 251 | 102 | 149 |
| Q1B | 268 | 183 | 85 | 269 | 184 | 85 |
| C1 | 27 | 19 | 8 | 28 | 19 | 8 |
| Q2A | 118 | 82 | 36 | 119 | 83 | 36 |
| Q2B | 204 | 147 | 57 | 191 | 137 | 54 |
| Q3A | 111 | 77 | 34 | 113 | 80 | 33 |
| Q3B | 113 | 81 | 31 | 132 | 95 | 37 |
| C2 | 15 | 11 | 4 | 18 | 13 | 5 |
| Total | 1105 | 701 | 404 | 1121 | 714 | 407 |
Less than 40% of the total power generated in the collision is deposited in the inner triplet. The remaining 63%, which corresponds to about 2.7 kW for an instantaneous luminosity of 51033 cm-2 s-1, escapes downstream on both sides of the IP and it will be deposited elsewhere in the accelerator.
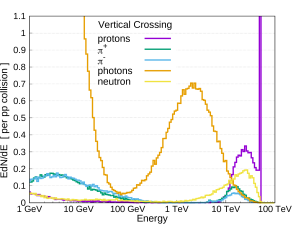
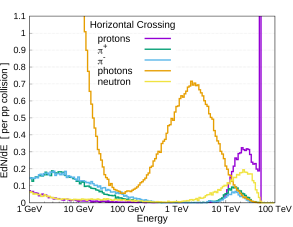
Figure 36 shows the spectra of particles at the exit of Q3B for vertical crossing on the left and horizontal crossing on the right. The peak at 50 TeV is due to protons produced in single diffractive events. These protons travel much further in the accelerator and are expected to impact in the dispersion suppression region. The charged pions and the protons of few tens of TeV will instead be lost on D1, on the TAN or in the matching section. Many high energy photons and neutrons escape as well downstream Q3 and they will be captured by the TAN or even at longer distances from the IP, depending on on their angle. In order to precisely assess the impact of these particles in the accelerator components, new calculations are foreseen, which will extend the simulation to the matching section, as it has been done for the high luminosity EIR.
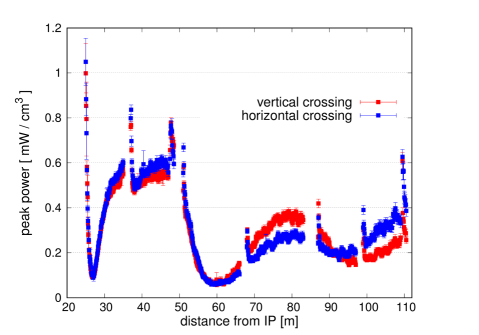
The peak power density in the magnet inner cable is presented in Figure 37 as a function of the distance from the interaction point for both the vertical and the horizontal crossing. For both cases, the values are safely below the quench limit for the superconducting coils. The maximum is indeed 1 mWcm-3 and it is reached at the entrance of Q1A. Without the presence of the mask, this value would be more than 30 times higher and would significantly exceed quench limits. The presence of a peak at the entrance of each magnet is due to the shielding gaps in the interconnects.
For what concerns the dose, the maximum is reached as well at the entrance of Q1A for both schemes and, for an integrated luminosity of 500 fb-1, it remains below 30 MGy, which is the limit presently assumed for the damage of insulators and organic materials.
The cause of the shape difference between the red and the blue curves in Fig. 37 is the different crossing scheme of the collisions. The crossing choice influences as well the azimuthal position of the peaks. This can be seen from Fig. 38, which shows the dose distribution in the innermost strands of the magnet coils as a function of the distance from the IP and of the azimuthal angle , for vertical crossing on top and horizontal crossing on bottom. The observed asymmetric pattern is due to the combined effects of the crossing angle and plane and of the focusing/defocusing action of the quadrupoles, which sweep low energy secondary particles into the magnets, preferentially along the vertical and horizontal planes.
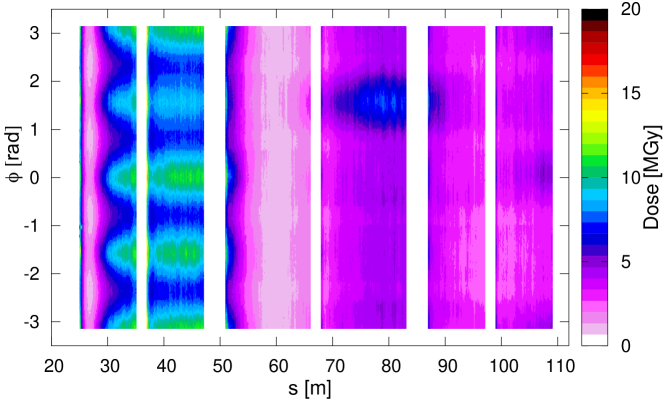
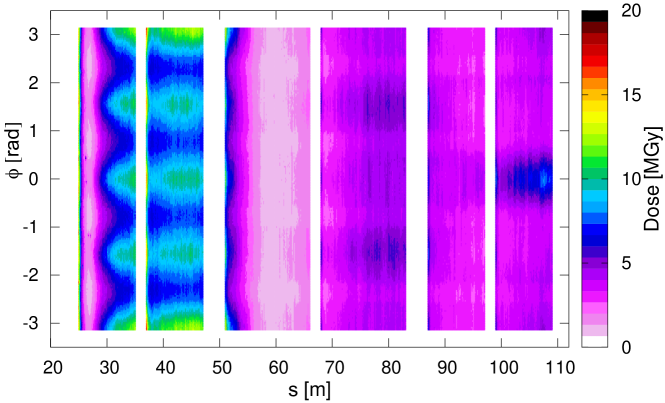
The triplet polarity is DFD in the horizontal plane for positive particles, which are more abundant in p-p collisions. In Q1 positive particles are therefore deflected in the horizontal plane and, in the case of vertical crossing, hit the coil symmetrically at 0 and . On the vertical plane, negative particles impact at 222The position of the peak is -, because the crossing angle is negative. In the case of positive crossing, the peak would have been at ., because of the crossing angle offset. In the case of horizontal crossing, positive particles impact mainly at , because of the initial crossing angle. For this reason both peak power density and peak dose values in Q1A and Q1B are higher for this case. The lower peaks at are due to negative particles symmetrically deflected in the vertical plane. Due to the polarity change in Q2, positive particles are deflected on the vertical plane and impact at for the vertical case, because of the initial crossing angle. In the case of h-crossing two symmetric and lower peaks are present at . Finally in Q3, where the polarity is inverted again, positive particles are deflected in the horizontal plane and are collected at 0 for h-crossing, while for v-crossing they hit symmetrically at 0 and at . Higher power density and dose values are therefore observed in Q3B for the horizontal crossing.
5 Photon Background From Synchrotron Radiation
The amount of power radiated by Synchrotron Radiation (SR) strongly depends on the relativistic Lorentz factor of the moving particle, and thus on its energy to mass ratio: [49].
Due to their mass, SR emitted by protons is usually a very small source of backgrounds in the experiments, even in very high energy proton beams such as LHC.
However, in the case of FCC, in which beams are planned to reach 50 TeV of energy, also this possible source of background should be carefully evaluated.
The critical energy of the emitted SR scales with Lorentz factor and bending radius according to . While the increase of FCC-hh center of mass energy with respect to the LHC is about a factor 7, the critical energy of emitted photons increases by a factor 100, shifting the energy spectrum from hard ultraviolet for LHC (which is easily absorbed) into soft X-rays of several keV for FCC. Since the Beryllium of the inner beam pipe can start to become transparent at these energies, some of these photons could traverse the beam pipe and may potentially constitute a background in the detectors.
To address this study, a dedicated software tool has been developed, validated and used. MDISim [50] is a toolkit that combines existing standard tools MAD-X [51], ROOT [52] and GEANT4 [53]. It reads the MAD-X optics files, and it uses its Twiss (and optionally Survey) output file to export the geometry and the magnetic field information in a format which can be directly imported in GEANT4 to perform particle tracking, including the generation of secondaries and detailed modelling of the relevant absorption processes.
MDISim has been used to reconstruct the region from -700 m to 700 m of the EIR around IPA, see Figure 39 for a top view. The study also applies to the second interaction point named IPG, that has the same design and is located approximately 50 km away from IPA.
The beam pipe apertures upstream and downstream IPA are symmetrical. As described in Section 2 the beam pipe is made of 0.8 mm thick Beryllium with an inner radius of 20 mm from IPA to 8 m, representing a critical region due to its proximity to the vertex detector. The following 8 m are covered by a Beryllium cone with an opening angle of 2.5 mrad. From m to 35 m respectively, the material is Aluminum and the beam pipe radius is 40 mm. The entire detector layout occupies the region between m, followed by a forward shielding section from m to m. At 35 m from the IPA, outside the detector and shield area, the TAS is placed as absorber to protect the insertion quadrupoles from collision debris and its aperture radius is 20 mm. The aperture radii outside the region between the two TAS are larger than 56 mm, until the collimator TAN at 412 m where it is reduced to 29 mm.
The dipoles in the experimental region shown in Figure 39 are 2 T magnets 11.3 m long, differently from the nominal arc dipoles which are 16 T. These low field dipoles are located at about 200 m and at 430 m upstream and downstream IPA providing a bending angle of 135 rad each. The aim of our study was to determine SR photons coming from these dipoles and entering the TAS that might impact the detector, also possibly crossing the Beryllium beam pipe from -8 m to 8 m around IPA. Figure 40 shows a zoom of this region.
As reference position we have chosen the TAS. We give the power of the photons passing through the TAS and look in detail where these photons were generated and calculate the energy spectra and hit positions downstream of the TAS and determine the fraction of photons hitting the inner Beryllium pipe.
Table 8 gives the exact longitudinal position of the last eight dipoles 470 m upstream the IPA. The critical energy in the dipoles is 0.536 keV, the mean energy 0.165 keV and the emitted power by each dipole is 6.4 W. In total, their power emitted is about 50 W. However, only a fraction of these photons will reach the experimental area, due to geometrical reasons and to the TAS presence, and even fewer of them will hit the m Beryllium beam pipe.
| Dipole name | Distance from IPA [m] |
|---|---|
| D1a | 190.0 |
| D1b | 202.8 |
| D1c | 215.6 |
| D1d | 228.4 |
| D2a | 421.3 |
| D2b | 434.1 |
| D2c | 446.9 |
| D2d | 459.7 |
As described above we used MDISim to produce the geometry and the magnetic field description. GEANT4 has been used to perform the detailed simulation, starting at approximately m from IPA with a Gaussian beam with the expected size and emittance. These protons were tracked with the Monte Carlo, taking into account the production of SR photons and their subsequent propagation. For this study the baseline and ultimate optics discussed in Section 2 were used, with and without the horizontal crossing angle. The results of this simulation, summarized in Table 9, suggest that about 10 W are expected to enter the experiment area with no crossing angle. The power of the photon flux at the inner Beryllium pipe located from -8 m to 8 m around IPA remains below 1 W. A possible 10 Tm detector spectrometer placed in the experimental area would increase this value by one Watt. Even if the power deposited on the Beryllium pipe remains small, the simulations show that the number of photons is significant and merits a closer investigation. To evaluate the amount of particles that can pass through the Beryllium, we also used a more local GEANT4 simulation, in which the photons with the energy spectra obtained from the beams were directly impacting at a rad grazing angle on the 0.8 mm Beryllium pipe, to provide an upper limit estimate for the ultimate crossing angle.
| Lattice | Half Crossing | PTAS | PBe | NγBe | EmBe |
|---|---|---|---|---|---|
| Angle rad] | [W] | [W] | [] | [keV] | |
| Baseline | 0 | 8.5 | 0.74 | 1.1 | 0.166 |
| Ultimate | 0 | 8.7 | 0.73 | 1.1 | 0.163 |
| Baseline | 52 | 26.5 | 1.17 | 1.8 | 0.163 |
| Ultimate | 100 | 46.4 | 12.86 | 16.0 | 0.198 |
Table 9 summarizes the study of the SR impacting the experimental area. Without crossing angle, the SR emitted by beam protons in the last magnetic elements upstream IPA is small and only a very minor source of backgrounds to the experiments. With crossing angle, we get a small increase in power and a more significant increase in the number of photons reaching the experimental area. A small part of the increase is due to the extra SR generated by the field of the corrector magnets that generate the crossing angle (shown in Table 10).
| Corrector name | Distance | Length | B field [T] | |
|---|---|---|---|---|
| to IPA [m] | [m] | Baseline | Ultimate | |
| MCBXDHV.A2LA.H | 75.8 | 1.3 | ||
| MCBXCHV.3LA.H | 174.2 | 1.3 | ||
| MCBRDH.4LA.H1 | 474.0 | 3.0 | ||
We find that the power from the SR of the corrector magnets is 0.6 W for the baseline and 1.8 W for the ultimate lattices, or a rather small increase compared to the power produced by the 11.3 m long 2 T dipoles. Figure 41 shows the z-position at the origin of the photons reaching the TAS. We can see, that without crossing angle (left plot of Figure 41), almost all photons entering the experimental originate in the 2 T dipoles located -450 and -200 m upstream of IPA, and that only few of these hit the Beryllium beam pipe. The simulation includes SR from quadrupoles which increases significantly with crossing angle over the last 100 m as can be seen in Fig. 41). With crossing angles many of these photons and in particular those generated by the quadrupole magnets MQXD.A2LA.H at -77.6 m and MQXC.B1LA.H at -56.3 m will hit the Beryllium pipe.
The magnetic field gradient of these quadrupoles in the last 100 m does not vary much between the different optics configurations. Much of the increase with crossing angle is from the last quadrupoles.
In conclusion, the contribution of synchrotron radiation photons into the experimental area has been addressed by means of a detailed GEANT4 simulation using MDISim. Similar studies were also carried out for other lattice versions [54] and the results have been benchmarked with SYNRAD [55], finding a very good agreement. We expect less than 1 photon per bunch with an energy of the order of 1 keV to traverse the Beryllium beam pipe towards the experiments. So we conclude that the photon background from synchrotron radiation does not generate significant noise in the detector, the impact on the detector performance is expected to be minimal.
6 Cross Talk Between Experimental Insertion Regions
Proton collisions at the interaction points of the FCC-hh may contribute to background in the subsequent detector, and losses between the detectors. As the proton luminosity is high, this may be of concern.
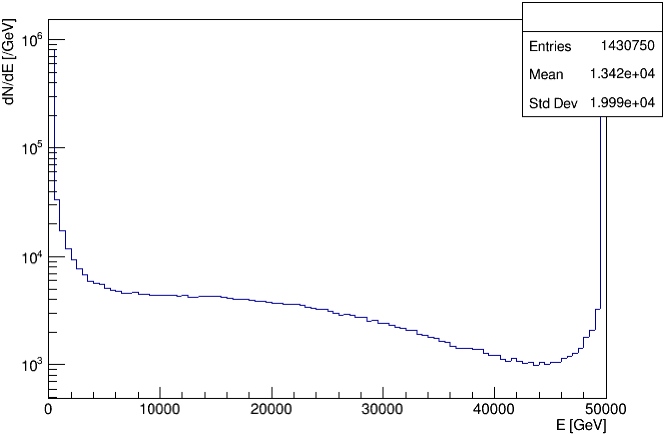
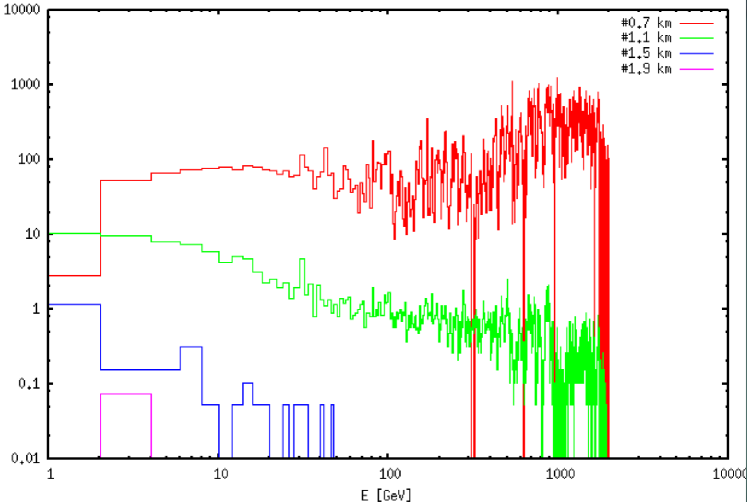
Using the upgraded version of the DPMJET-III event generator [56] inside FLUKA [41] we generate the debris from the proton-proton () collisions with vertical crossing. Due to the rigidity of the charged particles, only protons are transported by the accelerator. Muons are the only other major concern, and are treated separately. The energy distribution of protons is large, this is shown in Fig. 43.
For proton cross-talk, we use the energy of as a threshold. Protons from the collision with energy greater than this are defined as ‘elastic’, and those with energy below this are defined as ‘inelastic’ protons. PTC [57] and MERLIN [58] are used to perform tracking of both elastic and inelastic protons to determine the cross-talk. That is, the number of collision debris protons that will reach the next detector. We generate the debris at IPA and track to IPB.
For the case of elastic protons, nearly all reach IPB with a spot size similar to that of the beam. This is likely to lead to an emittance growth, but should pose no major concern. Around 2 inelastic protons per bunch crossing will arrive at IPB under nominal settings, this rises to 9 under ultimate settings. The mean energy of these few protons is , and they are unlikely to be of concern in terms of cross-talk.
What is of greater concern is the loss of inelastic protons between the two points. Most are lost in the short straight section and dispersion suppressor (DS) regions post IPA. A detailed study of losses in the detector, inner triplet, and separation and recombination dipoles has been conducted in detail with FLUKA. This is documented in section 4. Therefore we focus on losses after these elements, of which, the DS losses are of great concern as they are bottlenecks for off-momentum particles and the proton energy is high.
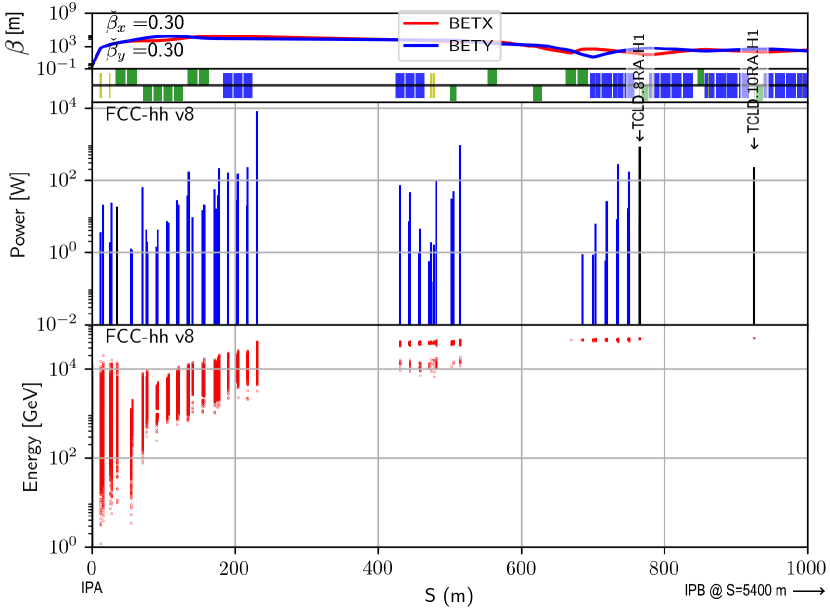
It was decided to mitigate these losses using HL-LHC style ‘TCLD’ collimators in the DS. Two long TCLD collimators were placed before the first quadrupole in cells 8 and 10, at the points where the dispersion rises rapidly. With these collimators in place, the DS losses are minimised, as all particles are intercepted by the TCLDs. In these simulations all apertures are treated as black absorbers.
These collimators are placed in regions of relatively low function, thus allowing larger jaw gaps so as not to violate the collimation hierarchy. A jaw half-gap of 35 was found to be sufficient. Using MERLIN the power and energy of lost particles in the short straight section are shown, in the presence of the two TCLD collimators, in Fig. 44. We note that all losses are shown per element, therefore the largest peak in the power plot corresponds to the loss over the full length of a long drift.
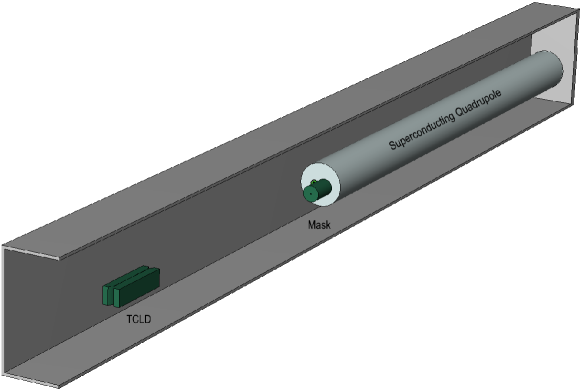
Collimators clean the ‘primary’ halo, but produce a ‘secondary’ halo in turn. In order to verify that this secondary shower would not exceed the maximum energy deposition allowed on the subsequent superconducting quadrupole, a two step simulation was used. Firstly the inelastic protons were transported from IPA to the TCLDs using MERLIN, to generate hits on the collimator jaws. These hits were fed into a FLUKA model, shown in Fig. 45, which consists of the first TCLD collimator, a drift space, followed by a long mask prior to the superconducting quadrupole. The quadrupole coils are simulated as a mixture of 50% Nb3Sn and 50% copper. INERMET180 has been chosen as the material for the TCLD jaw and quadrupole mask, as in the current LHC absorbers. The distance between the collimator and the mask and quadrupole gives space for the shower to spread, thus minimising the load on the quadrupole coils.
As the first collimator (in cell 8) has the higher load, it was used for shower simulations. A jaw half-gap of 35 was shown to intercept all inelastic protons whilst not violating the betatron collimation hierarchy. There is the possibility that this could still interfere with the momentum cleaning hierarchy - as the momentum cleaning was not defined at the time of this investigation.
It is evident from Fig. 46, which shows the maximum energy deposition in the first quadrupole post-TCLD, that the mask is required in order to stay below the limit of 5 - [59] at ultimate parameters. For baseline parameters the mask is not required. Thus we may mitigate the DS losses due to inelastic protons from collision debris using the two long INERMET180 TCLDs, placed in cells 8 and 10, before the first quadrupole in the cell.
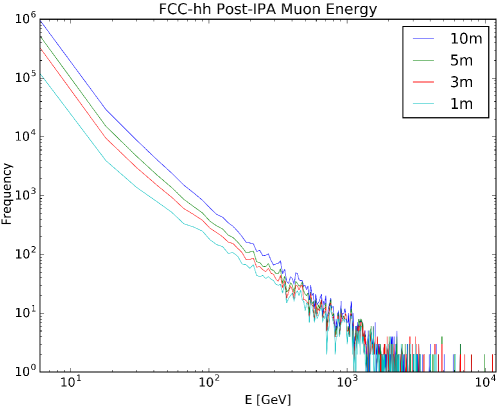
As muons have a large mean free path, they can travel kilometres in dense materials, therefore muon cross-talk may be a concern. The muon energy distribution generated from 106 collisions using DPMJET-III inside FLUKA is shown in Fig. 47. Low energy muons are produced from a multitude of particle physics processes, this results in an increase in the number of low energy muons as the observation point is moved further from the collision point, within a small range. High energy muon production is rare, the highest energy muon produced is around .
We may separate muon energy loss into; ionisation, bremsstrahlung, production of electron-positron pairs, and through photo-nuclear and photo-nucleon interactions. This approach is summarised in Eq. (1) [60]:
| (1) |
where is the ionisation contribution, and is the sum of the contributions of bremsstrahlung, pair production, and photo-nuclear/nucleon interactions [61]. In the continuous slowing down approximation the range is given by
| (2) |
At high energy and are constant, and this becomes
| (3) |
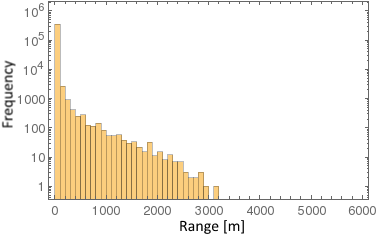
where the electronic and radiative losses are equal at the critical energy . We use this approach to calculate the theoretical range of muons in standard rock, which has a specific gravity of and , and in which the muon critical energy is . The result of this calculation is shown in Fig. 48, which gives a maximum range of for collision debris muons in the FCC-hh through standard rock. This analytical calculation does not include the interaction of collision debris with the detector.
In order to verify the analytical expectation, collisions were generated using DPMJET-III inside FLUKA with a complete model of the detector [62] in order to generate the initial muon distribution. These muons were then tracked in FLUKA using a total of 109 histories through the tunnel model shown in Fig. 49.
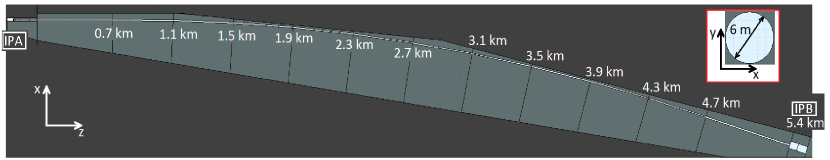
The muon energy distributions along the tunnel model are shown in Fig. 50. From this it is clear that few muons travel , no muons travel beyond , thus we may conclude that muon cross-talk should not be an issue at the FCC-hh.
In summary, elastic protons with an energy greater than from collisions at IPA nearly all reach IPB with a spot size similar to the beam. This should result in an emittance growth of the beam. Inelastic protons, with an energy less than pose a greater threat. Only 2 - 9 inelastic protons per bunch crossing are foreseen to reach IPB, this is deemed negligible. The losses from inelastic protons in the short straight section and dispersion suppressor regions post IPA are of concern. By using two long TCLD collimators with INERMET180 jaws, the losses in the DS region post IPA was mitigated. Shower simulations of the inelastic proton impacts upon the first TCLD in cell 8 were performed in order to gauge secondary shower damage on the next superconducting element, the first quadrupole in the cell. Results show that for baseline parameters the energy deposition is below the suggested limit, and for the ultimate parameters the addition of a long INERMET180 mask would be required to protect the quadrupole coils [63].
Despite high energy muons of up to being created in the collisions, by analytical and Monte Carlo methods we have shown that muons should not travel far enough through rock or the accelerator tunnel to reach the subsequent detector [64].
Photons and other charged hadrons in the collision debris are ignored as their rigidity means that they will not be accepted in the accelerator, and thus cannot be transported to IPB.
7 Hardware Specifications
Table 11 lists the specifications for the magnets of the high luminosity EIRs. The cryostats of the triplet quadrupoles will have to be designed so they can support thick and consequently heavy shielding inside the coil apertures. The field quality specifications of the triplet magnets using the same notation as in [65] are given in Tables 12 and 13.
| Magnet | Length | Field | Coil aperture | Number |
| [] | strength | diameter [] | per IP | |
| Triplet quadrupoles | ||||
| Q1 | 14.3 | 164 | 4 | |
| Q2 | 12.5 | 210 | 8 | |
| Q3 | 12.5 | 210 | 4 | |
| Separation and recombination dipoles | ||||
| D1 | 11.3 | 170 | 8 | |
| D2 | 11.3 | 91 | 8 | |
| Matching quadrupoles | ||||
| Q4 | 9.1 | 70 | 2 | |
| Q5/6 | 12.8 | 60 | 4 | |
| Q7 | 14.3 | 50 | 4 | |
| Non-linear correctors | ||||
| Sextupole | 0.07 | 210 | 2/2 | |
| (normal/skew) | ||||
| Octupole | 0.21 | 210 | 2/2 | |
| (normal/skew) | ||||
| Orbit correctors | ||||
| MCBX | 1.3 | 210 | 6 | |
| MCBRD | 3.0 | 70 | 4 | |
| MCBYM | 1.5 | 60 | 4 | |
| MCB | 1.2 | 50 | 4 | |
| Systematic | Uncertainty | Random | ||||
| Normal | Injection | High | Injection | High | Injection | High |
| Field | Field | Field | ||||
| 0.000 | 0.000 | 0.000 | 0.000 | 0.000 | 0.000 | |
| 0.000 | 0.000 | 0.000 | 0.000 | (10) | (10) | |
| 0.000 | 0.000 | 0.82 | 0.82 | 0.82 | 0.82 | |
| 0.000 | 0.000 | 0.57 | 0.57 | 0.57 | 0.57 | |
| 0.000 | 0.000 | 0.42 | 0.42 | 0.42 | 0.42 | |
| -19.947 | -0.357 | 1.1 | 1.1 | 1.1 | 1.1 | |
| 0.000 | 0.000 | 0.19 | 0.19 | 0.19 | 0.19 | |
| 0.000 | 0.000 | 0.13 | 0.13 | 0.13 | 0.13 | |
| 0.000 | 0.000 | 0.07 | 0.07 | 0.07 | 0.07 | |
| 3.664 | -0.129 | 0.2 | 0.2 | 0.2 | 0.2 | |
| 0.000 | 0.000 | 0.26 | 0.26 | 0.26 | 0.26 | |
| 0.000 | 0.000 | 0.18 | 0.18 | 0.18 | 0.18 | |
| 0.000 | 0.000 | 0.009 | 0.009 | 0.009 | 0.009 | |
| 0.158 | -0.866 | 0.023 | 0.023 | 0.023 | 0.023 | |
| 0.000 | 0.000 | 0.000 | 0.000 | 0.000 | 0.000 | |
| Skew | ||||||
| 0.000 | 0.000 | 0.000 | 0.000 | 0.000 | 0.000 | |
| -0.877 | -0.877 | 0.000 | 0.000 | (10) | (10) | |
| 0.000 | 0.000 | 0.65 | 0.65 | 0.65 | 0.65 | |
| 0.000 | 0.000 | 0.65 | 0.65 | 0.65 | 0.65 | |
| 0.000 | 0.000 | 0.43 | 0.43 | 0.43 | 0.43 | |
| 0.062 | 0.062 | 0.31 | 0.31 | 0.31 | 0.31 | |
| 0.000 | 0.000 | 0.19 | 0.19 | 0.19 | 0.19 | |
| 0.000 | 0.000 | 0.11 | 0.11 | 0.11 | 0.11 | |
| 0.000 | 0.000 | 0.08 | 0.08 | 0.08 | 0.08 | |
| 0.002 | 0.002 | 0.04 | 0.04 | 0.04 | 0.04 | |
| 0.000 | 0.000 | 0.026 | 0.026 | 0.026 | 0.026 | |
| 0.000 | 0.000 | 0.014 | 0.014 | 0.014 | 0.014 | |
| 0.000 | 0.000 | 0.01 | 0.01 | 0.01 | 0.01 | |
| -0.004 | -0.004 | 0.005 | 0.005 | 0.005 | 0.005 | |
| 0.000 | 0.000 | 0.000 | 0.000 | 0.000 | 0.000 | |
| Systematic | Uncertainty | Random | ||||
| Normal | Injection | High | Injection | High | Injection | High |
| Field | Field | Field | ||||
| 0.000 | 0.000 | 0.000 | 0.000 | 0.000 | 0.000 | |
| 0.000 | 0.000 | 0.000 | 0.000 | (10) | (10) | |
| 0.000 | 0.000 | 0.82 | 0.82 | 0.82 | 0.82 | |
| 0.000 | 0.000 | 0.57 | 0.57 | 0.57 | 0.57 | |
| 0.000 | 0.000 | 0.42 | 0.42 | 0.42 | 0.42 | |
| -19.752 | -0.317 | 1.1 | 1.1 | 1.1 | 1.1 | |
| 0.000 | 0.000 | 0.19 | 0.19 | 0.19 | 0.19 | |
| 0.000 | 0.000 | 0.13 | 0.13 | 0.13 | 0.13 | |
| 0.000 | 0.000 | 0.07 | 0.07 | 0.07 | 0.07 | |
| 3.631 | -0.132 | 0.2 | 0.2 | 0.2 | 0.2 | |
| 0.000 | 0.000 | 0.26 | 0.26 | 0.26 | 0.26 | |
| 0.000 | 0.000 | 0.18 | 0.18 | 0.18 | 0.18 | |
| 0.000 | 0.000 | 0.009 | 0.009 | 0.009 | 0.009 | |
| 0.151 | -0.865 | 0.023 | 0.023 | 0.023 | 0.023 | |
| 0.000 | 0.000 | 0.000 | 0.000 | 0.000 | 0.000 | |
| Skew | ||||||
| 0.000 | 0.000 | 0.000 | 0.000 | 0.000 | 0.000 | |
| -1.003 | -1.003 | 0.000 | 0.000 | (10) | (10) | |
| 0.000 | 0.000 | 0.65 | 0.65 | 0.65 | 0.65 | |
| 0.000 | 0.000 | 0.65 | 0.65 | 0.65 | 0.65 | |
| 0.000 | 0.000 | 0.43 | 0.43 | 0.43 | 0.43 | |
| 0.071 | 0.071 | 0.31 | 0.31 | 0.31 | 0.31 | |
| 0.000 | 0.000 | 0.19 | 0.19 | 0.19 | 0.19 | |
| 0.000 | 0.000 | 0.11 | 0.11 | 0.11 | 0.11 | |
| 0.000 | 0.000 | 0.08 | 0.08 | 0.08 | 0.08 | |
| 0.002 | 0.002 | 0.04 | 0.04 | 0.04 | 0.04 | |
| 0.000 | 0.000 | 0.026 | 0.026 | 0.026 | 0.026 | |
| 0.000 | 0.000 | 0.014 | 0.014 | 0.014 | 0.014 | |
| 0.000 | 0.000 | 0.01 | 0.01 | 0.01 | 0.01 | |
| -0.007 | -0.007 | 0.005 | 0.005 | 0.005 | 0.005 | |
| 0.000 | 0.000 | 0.000 | 0.000 | 0.000 | 0.000 | |
For the separation and recombination dipoles D1 and D2 in the high luminosity EIRs, normal conducting dipoles, similar to the MBXW and MBW designs of the LHC, were chosen because of the radiative environment and because they can provide better field quality. The field quality specification using the same notation as in [65] are listed in Tables 14 and 15.
The required strengths of the non-linear corrector package behind the triplet were obtained from the dynamic aperture studies. The coil apertures are the same as in the triplet quadrupoles Q2 and Q3 in order to avoid exposure to collision debris. With this the possible field strengths could be determined [66] and the lengths requirements calculated. The sextupole and octupole correctors require only lengths of a few centimetres. Thus it is possible to increase the coil apertures of the sextupole and octupole correctors further in order to reduce energy deposition if necessary.
Table 11 also lists the hardware specifications of the high luminosity IR orbit correctors. The single aperture MCBX magnets have nested coils, allowing them to deflect the beam in both planes. Each matching section quadrupole is equipped with one orbit corrector of the same aperture, hence the need for 3 classes. The MCB class is identical to the arc orbit correctors and two units are placed next to Q7 in order to provide enough strength. No strengths requirements for the low luminosity EIR orbit correctors have been established so far, but we expect to require 4 single aperture correctors per IP in the triplet region, as well as 5 double aperture correctors with 70 mm coil aperture per IP and 5 double aperture correctors with 50 mm coil aperture per IP.
| Systematic | Uncertainty | Random | ||||
| Normal | Injection | High | Injection | High | Injection | High |
| Field | Field | Field | ||||
| 0.000 | 0.000 | 0.000 | 0.000 | 0.000 | 0.000 | |
| -0.200 | -0.300 | 0.000 | 0.000 | 0.100 | 0.200 | |
| 0.100 | -0.900 | 0.000 | 0.000 | 0.300 | 0.000 | |
| 0.000 | 0.000 | 0.000 | 0.000 | 0.000 | 0.000 | |
| -0.100 | -0.100 | 0.000 | 0.000 | 0.200 | 0.000 | |
| Skew | ||||||
| 0.000 | 0.000 | 0.000 | 0.000 | 0.000 | 0.000 | |
| -0.200 | -0.100 | 0.000 | 0.000 | 0.200 | 0.100 | |
| 0.000 | 0.000 | 0.000 | 0.000 | 0.000 | 0.100 | |
| 0.000 | 0.000 | 0.000 | 0.000 | 0.000 | 0.000 | |
| 0.000 | 0.000 | 0.000 | 0.000 | 0.000 | 0.100 | |
| Systematic | Uncertainty | Random | ||||
| Normal | Injection | High | Injection | High | Injection | High |
| Field | Field | Field | ||||
| 0.000 | 0.000 | 0.000 | 0.000 | 0.000 | 0.000 | |
| 0.300 | -1.400 | 0.000 | 0.000 | 1.800 | 1.100 | |
| 1.500 | -0.400 | 0.000 | 0.000 | 0.400 | 0.800 | |
| 0.000 | 0.300 | 0.000 | 0.000 | 0.400 | 0.800 | |
| -0.400 | -0.500 | 0.000 | 0.000 | 0.300 | 0.200 | |
| 0.000 | 0.000 | 0.000 | 0.000 | 0.400 | 0.300 | |
| -0.300 | -0.200 | 0.000 | 0.000 | 0.200 | 0.200 | |
| 0.000 | 0.100 | 0.000 | 0.000 | 0.200 | 0.200 | |
| -0.100 | 0.000 | 0.000 | 0.000 | 0.000 | 0.200 | |
| 0.000 | 0.100 | 0.000 | 0.000 | 0.000 | 0.200 | |
| 0.000 | 0.100 | 0.000 | 0.000 | 0.000 | 0.100 | |
| Skew | ||||||
| 0.000 | 0.000 | 0.000 | 0.000 | 0.000 | 0.000 | |
| 0.100 | 0.200 | 0.000 | 0.000 | 0.100 | 0.200 | |
| 0.000 | -0.100 | 0.000 | 0.000 | 0.100 | 0.300 | |
| 0.000 | 0.100 | 0.000 | 0.000 | 0.000 | 0.200 | |
| 0.000 | -0.100 | 0.000 | 0.000 | 0.000 | 0.100 | |
| 0.000 | 0.000 | 0.000 | 0.000 | 0.100 | 0.200 | |
| 0.000 | -0.100 | 0.000 | 0.000 | 0.000 | 0.100 | |
| 0.000 | 0.000 | 0.000 | 0.000 | 0.000 | 0.100 | |
Orbit correction studies have shown that the alignment tolerances for the high luminosity EIR elements listed in Table 16 result in a residual orbit below (90th percentile). It should be noted that the residual orbit is very sensitive to misalignments of the strong Q7 quadrupoles. Thus those elements need to be aligned more precisely than the other matching quadrupoles, possibly requiring a remote alignment system as proposed for the HL-LHC [67].
| Element | Error | Value | Comments |
| Separation dipole D1 | roll angle | ||
| Recombination dipole D2 | roll angle | ||
| Triplet quadrupoles Q1-Q3 | |||
| Matching quadrupoles Q4-Q6 | |||
| Matching quadrupole Q7 | remote | ||
| alignment | |||
| BPM | |||
| accuracy |
For collision optics beyond ultimate parameters (with down to ) a crab voltage of per beam on either side of each high luminosity IP was sufficient to provide full crabbing. This corresponds to in total. Following a direct scaling from the HL-LHC lattice, of space were allocated for the crab cavities on each side of the two main IPs. No detailed studies on number of cavities or cryostat design were done yet. It should be noted that a radiation mitigation strategy to protect the triplet is to change the crossing plane on the two main IPs at least once during the lifetime. This will also require an exchange of the crab cavities (horizontally/vertically deflecting). Since IPA and IPG will always run with different crossing planes, it should be possible to simply exchange the hardware between the two main IPs during a shutdown. This should be taken into account when designing the cryostats and RF connections.
The specifications for the triplet quadrupoles in the low luminosity experimental insertions are listed in Table 17. Contrary to the high luminosity EIRs, the separation and recombination dipoles in the low luminosity EIRs are chosen to be superconducting. This allows a significantly shorter separation, providing more space for both experiment and the injection hardware.
| Magnet | Length [] | Field | Coil aperture | Number |
|---|---|---|---|---|
| strength | diameter [] | per IP | ||
| Triplet quadrupoles | ||||
| Q1 | 10 | 64 | 4 | |
| Q2 | 15 | 64 | 4 | |
| Q3 | 10 | 64 | 4 | |
| Separation and recombination dipoles | ||||
| D1 | 12.5 | 100 | 4 | |
| D2 | 15 | 60 | 4 | |
| Matching quadrupoles | ||||
| Short type | 9.1 | 70 | 6 | |
| Long type | 12.8 | 50 | 5 | |
8 Summary and Outlook
We have presented the first complete design of the FCC-hh IR, which demonstrates to meet the ambitious project goals in terms of energy and luminosity. The main unknowns reside in the assumed Nb3Sn magnet technology, with the largest peak magnetic field of about 11 T for the high luminosity EIR magnets. This technology will profit from developments and experimental demonstrations within the HL-LHC project. The current design addresses the severe limitations coming from the high power luminosity debris. The current layout can withstand the synchrotron radiation from the beam in the IR. The various detectors are placed sufficiently far apart to avoid any significant exchange of radiation.
Further luminosity upgrades beyond the Ultimate scenario are conceivable. The IP beam size is first limited by the strength of the arc sextupoles followed by the triplet quadrupole aperture. Both limitations could be mitigated by developing magnets with High Temperature Superconducting (HTS) materials.
Acknowledgements
The European Circular Energy-Frontier Collider Study (EuroCirCol) project has received funding from the European Union’s Horizon 2020 research and innovation programme under grant No 654305. The information herein only reflects the views of its authors and the European Commission is not responsible for any use that may be made of the information. These studies are also supported by the Swiss Institute of Accelerator Physics and Technology (CHART).
References
- [1] Roman Martin, Maria Ilaria Besana, Francesco Cerutti, Andy Langner, Rogelio Tomás, Emilia Cruz-Alaniz, and Barbara Dalena. Interaction region design driven by energy deposition. Phys. Rev. Accel. Beams, 20:081005, Aug 2017.
- [2] Jaime Coello, Rogelio Tomas, Lucio Fiscarelli, Davide Gamba, and Michelle Martino. Impact of flux jumps in future colliders. Phys. Rev. Accel. Beams, 23:011001, Jan 2020.
- [3] S. Fartoukh. Achromatic telescopic squeezing scheme and application to the LHC and its luminosity upgrade. Phys. Rev. ST Accel. Beams, 16:111002, Nov 2013.
- [4] J. Barranco García et al. Beam-beam studies for FCC-hh. FCC week 2018, Amsterdam, April, 2018,.
- [5] Future Circular Collider Study. Volume 3: The Hadron Collider (FCC-hh) Conceptual Design Report. preprint edited by M. Benedikt et al. CERN accelerator reports, CERN-ACC-2018-0058, December 2018. Submitted to Eur. Phys. J. ST.
- [6] Emilia Cruz-Alaniz, David Newton, Rogelio Tomás, and Maxim Korostelev. Design of the large hadron electron collider interaction region. Phys. Rev. Accel. Beams, 18:111001, Nov 2015.
- [7] X. Buffat, W. Herr, M. Lamont, T. Pieloni, S. Redaelli, and J. Wenninger. Squeezing with colliding beams. In 4th Evian Workshop on LHC beam operation, pages 27–32. 6 p, Dec 2012.
- [8] R. Tomás, J. Keintzel, and S. Papadopoulou. Emittance growth from luminosity burn-off in future hadron colliders. Phys. Rev. Accel. Beams, 23:031002, Mar 2020.
- [9] Riccardo de Maria. Layout design for final focus systems and applications for the LHC interaction region upgrade. CERN-LHC-PROJECT-REPORT-1051, 2007.
- [10] Jose Abelleira, Leon van Riesen-Haupt, et al. An alternative final-focus system for the FCC-hh: triplet optimization with energy deposition studies. submitted for publication, 2018.
- [11] L. van Riesen-Haupt, J.L. Abelleira, E. Cruz Alaniz, and A. Seryi. A Code for Optimising Triplet Layout. In Proc. of International Particle Accelerator Conference (IPAC’17), Copenhagen, Denmark, 14–19 May, 2017, number 8 in International Particle Accelerator Conference, pages 2163–2166, Geneva, Switzerland, May 2017. JACoW. https://doi.org/10.18429/JACoW-IPAC2017-TUPVA043.
- [12] J.L. Abelleira, E. Cruz Alaniz, A. Seryi, and L. van Riesen-Haupt. Energy Deposition Studies and Luminosity Evolution for the Alternative FCC-hh Triplet. In Proc. 9th International Particle Accelerator Conference (IPAC’18), Vancouver, BC, Canada, April 29-May 4, 2018, number 9 in International Particle Accelerator Conference, pages 352–355, Geneva, Switzerland, June 2018. JACoW Publishing. https://doi.org/10.18429/JACoW-IPAC2018-MOPMK003.
- [13] L. van Riesen-Haupt, J.L. Abelleira, E. Cruz Alaniz, and A. Seryi. An Optimised Triplet for the Final Focus of the FCC-HH with a 40m Final Drift. In Proc. 9th International Particle Accelerator Conference (IPAC’18), Vancouver, BC, Canada, April 29-May 4, 2018, number 9 in International Particle Accelerator Conference, pages 364–367, Geneva, Switzerland, June 2018. JACoW Publishing. https://doi.org/10.18429/JACoW-IPAC2018-MOPMK007.
- [14] R Tomás, G Arduini, D Banfi, J Barranco, H Bartosik, O Brüning, R Calaga, O Dominguez, H Damerau, S Fartoukh, S Hancock, G Iadarola, R De Maria, E Métral, T Pieloni, G Rumolo, B Salvant, E Shaposhnikova, and S White. HL-LHC Alternative Scenarios. Chamonix 2014: Workshop on LHC Performance, pages 217–224.
- [15] T Pieloni et al. Beam-beam effects. FCC week 2018, Amsterdam, Netherlands, April 2018, 2018.
- [16] A. Chancé et al. Status of the Beam Optics of the Future Hadron-Hadron Collider FCC-hh. In Proc. of International Particle Accelerator Conference (IPAC’16), Busan, Korea, May 8-13, 2016, number 7 in International Particle Accelerator Conference, pages 1470–1472, Geneva, Switzerland, June 2016. JACoW. doi:10.18429/JACoW-IPAC2016-TUPMW020.
- [17] W. Herr, X. Buffat, R. Calaga, R. Giachino, G. Papotti, T. Pieloni, and D. Kaltchev. Long Range Beam-beam Effects in the LHC. In Proceedings, ICFA Mini-Workshop on Beam-Beam Effects in Hadron Colliders (BB2013): CERN, Geneva, Switzerland, March 18-22 2013, pages 87–92, 2014.
- [18] T. Pieloni et al. Two Beam Effects. In Proc. 2014 Evian Workshop on LHC Beam Operation, pages 69–79, Geneva, 2014. CERN.
- [19] X. Buffat, G. Arduini, E. Bravin, G. Iadarola, E. Metral, Y. Papaphilippou, D. Pellegrini, S. Redaelli, B. Salvachua, M. Solfarloli, G. Trad, D. Valuch, J. Wenninger, J. Barranco, T. Pieloni, C. Tambasco, and M. Crouch. Long-range and head-on beam-beam: what are the limits? In 7th Evian workshop on LHC beam operation: Evian-les-Bains, France., pages 133–140, Geneva, 2017. CERN.
- [20] T. Pieloni. A study of beam-beam effects in hadron colliders with a large number of bunches. PhD thesis, Ecole Polytechnique Federale de Lausanne (EPFL), 2008.
- [21] W Herr, R Calaga, Emanuele Laface, G Papotti, and Tatiana Pieloni. Observations of beam-beam effects at high intensities in the LHC, 01 2011.
- [22] Werner Herr. Features and implications of different LHC crossing schemes. Technical Report LHC-Project-Report-628. CERN-LHC-Project-Report-628, CERN, Geneva, Feb 2003.
- [23] J. Barranco García et al. EuroCirCol Meeting Oct 2017, Presentation at the LHC machine committee, October, 2017.
- [24] Sixtrack web site: http://sixtrack.web.cern.ch/SixTrack/.
- [25] F. Schmidt. Sixtrack User’s Reference Manual. Technical report, CERN, 1994.
- [26] W. Herr and T. Pieloni. http://lhc-beam-beam.web.cern.ch/lhc-beam-beam/combi_welcome.html.
- [27] T. Pieloni and W. Herr. Coherent beam-beam modes in the CERN Large Hadron Collider (LHC) for multiple bunches, different collision schemes and machine symmetries. In Proceedings of 2005 Particle Accelerator Conferencee, Knoxville, Tennessee, pages 4030–4032, May 2005.
- [28] T. Pieloni and W. Herr. Models to study multi bunch coupling through head-on and long-range beam-beam interactions. CERN-LHC-Project-Report-937 and Proceedings of EPAC06, Edinburgh, United Kingdom, 2006, CERN, 2006.
- [29] M. Crouch. Luminosity Performance Limitations due to the Beam-Beam Interaction in the Large Hadron Collider. PhD thesis, Manchester University, 2017.
- [30] M. Giovannozzi. Proposed scaling law for intensity evolution in hadron storage rings based on dynamic aperture variation with time. Phys. Rev. ST Accel. Beams, 15:024001, Feb 2012.
- [31] X. Buffat, W. Herr, N. Mounet, T. Pieloni, and S. White. Stability diagrams of colliding beams in the Large Hadron Collider. Phys. Rev. ST Accel. Beams, 17:111002, Nov 2014.
- [32] H Grote, F Schmidt, and L H A Leunissen. LHC Dynamic Aperture at Collision. Technical Report LHC-PROJECT-NOTE-197, CERN, Geneva, Aug 1999.
- [33] Y Luo and F Schmidt. Dynamic Aperture Studies for LHC Optics Version 6.2 at Collision. Technical Report LHC-PROJECT-NOTE-310, CERN, Geneva, Jan 2003.
- [34] M.Crouch et al. Dynamic aperture studies of long-range beam-beam interactions at the LHC. In Proceedings, 8th International Particle Accelerator Conference (IPAC 2017): Copenhagen, Denmark, page THPAB056, 2017.
- [35] J. Barranco García, X. Buffat, S.V. Furuseth, T. Pieloni, and C. Tambasco. Beam-Beam Studies for FCC-hh. In Proc. of International Particle Accelerator Conference (IPAC’17), Copenhagen, Denmark, 14-19 May, 2017, number 8 in International Particle Accelerator Conference, pages 2109–2112, Geneva, Switzerland, May 2017. JACoW.
- [36] J. Gareyte, J.P. Koutchouk, and F. Ruggiero. Landau damping, Dynamic Aperture and Octupoles in the LHC. Technical Report LHC-Project-Report-91, CERN, Geneva, Switzerland, 1997.
- [37] J. Shi, O. Kheawpum, and L. Jin. Global compensation of long-range beam-beam interactions with multipole correctors. In Proc. of EPAC 2002, Paris, France), Paris, France, June, 2002, pages 1296–1298. EPS-IGA and CERN, June 2013.
- [38] T. Pieloni et al. Colliding High Brightness Beams in the LHC. In Proceedings, HB2012, Beijing, China, page MOP250, 2012.
- [39] Xavier Buffat, Nicolo Biancacci, Sondre Vik Furuseth, Delphine Jacquet, Elias Metral, Dario Pellegrini, Mirko Pojer, Georges Trad, Daniel Valuch, Javier Barranco Garcia, Tatiana Pieloni, Claudia Tambasco, and Qiang Li. Probing the behaviour of high brightness bunches in collision at 6.5 TeV and the interplay with an external source of noise (MD1433). https://cds.cern.ch/record/2261037, Apr 2017. CERN-ACC-NOTE-2017-0030.
- [40] Sondre Vik Furuseth and Xavier Buffat. Modeling of nonlinear effects due to head-on beam-beam interactions. Phys. Rev. Accel. Beams, 21:081002, Aug 2018.
- [41] A. Ferrari, P.R. Sala, A. Fassò, and J. Ranft. FLUKA: a multi-particle transport code. CERN Report CERN-2005-10, 2005.
- [42] T.T. Böhlen, F. Cerutti, M.P.W. Chin, A. Fassò, A. Ferrari, P.G. Ortega, A. Mairani, P.R. Sala, G. Smirnov, , and V. Vlachoudis. The FLUKA Code: Developments and Challenges for High Energy and Medical Applications. Nuclear Data Sheets, (120):211–214, 2014.
- [43] G. Apollinari, I. Béjar Alonso, O. Brüning, P. Fessia, M. Lamont, L. Rossi, and L. Tavian. High-Luminosity Large Hadron Collider (HL-LHC): Technical Design Report V. 0.1. CERN Yellow Reports: Monographs. CERN, Geneva, 2017.
- [44] E. Skordis, R. Bruce, F. Cerutti, A. Ferrari, P.D. Hermes, A. Lechner, A. Mereghetti, P.G. Ortega, S. Redaelli, and V. Vlachoudis. Impact of Beam Losses in the LHC Collimation Regions. In Proc. 6th International Particle Accelerator Conference (IPAC’15), Richmond, VA, USA, May 3-8, 2015, number 6 in International Particle Accelerator Conference, pages 2116–2119, Geneva, Switzerland, June 2015. JACoW. https://doi.org/10.18429/JACoW-IPAC2015-TUPTY046.
- [45] F Cerutti et al. Beam loss studies in IP. talk, FCC week 2018, Amsterdam, Netherlands, April 2018, 2018.
- [46] A. Infantino, B.L. Humann, and F. Cerutti. Energy deposition from collision debris in FCC-hh EIR. presented at the 4th EuroCirCol meeting, Oct 2018.
- [47] D. Schoerling. Review of peak power limits for high-luminosity IR triplet magnets, 2017.
- [48] L. Bottura. 11T magnet operating margin, 2018.
- [49] R.P. Walker. Synchrotron radiation. In CAS – CERN Accelerator School : 5th General Accelerator Physics Course, volume 1, pages 437–454. CERN, Geneva, Switzerland, 1992.
- [50] M. Boscolo and H. Burkhardt. Tools for flexible optimisation of IR designs with application to FCC. In Proc. 6th International Particle Accelerator Conference IPAC15, pages 2072–2074 TUPTY031, 2015.
- [51] L. Deniau, H. Grote, G. Roy, and F. Schmidt. The MAD-X program: Methodical Accelerator Design User’s Reference Manual. CERN, Geneva, Switzerland, Oct 2018. http://cern.ch/madx/.
- [52] A. Naumann, B. Bellenot, D. Piparo, E. Tejedor, G. Amadio, L. Moneta, O. Couet, P. Canal, and V. Vassilev. ROOT: Data Analysis Framework User’s Guide. CERN, Geneva, Switzerland, May 2018. https://root.cern.ch/.
- [53] S. Agostinelli et al. Geant4–a simulation toolkit. Nuclear Instruments and Methods in Physics Research Section A: Accelerators, Spectrometers, Detectors and Associated Equipment, 506(3):250 – 303, 2003.
- [54] F. Collamati, M. Boscolo, H. Burkhardt, and R. Kersevan. Synchrotron radiation backgrounds for the FCC-hh experiments. Journal of Physics: Conference Series, 874(1):012004, 2017.
- [55] R. Kersevan, M. Ady, and J.L. Pons. Molflow–SynRad: A Monte Carlo Simulator package developed at CERN. CERN, Geneva, Switzerland. https://molflow.web.cern.ch/.
- [56] A. Fedynitch. Cascade Equations and Hadronic Interactions at Very High Energies. PhD thesis, KIT, 2015. CERN-THESIS-2015-371.
- [57] P. K. Skowronski et al. Advances in MAD-X using PTC, 2007. LHC-Project-Report-1016.
- [58] S. Tygier, R. B. Appleby, H. Rafique, R. J. Barlow, and J. G. Molsen. Recent development and results with the MERLIN tracking code. In Proceedings, 8th International Particle Accelerator Conference (IPAC 2017): Copenhagen, Denmark, page MOPAB013, May, 2017.
- [59] Ezio Todesco. Private Communication, 2017.
- [60] R. K. Adair and H. Kasha. The range of muons in rocks. In Proceedings, 13th International Conference on Cosmic Rays, Denver, Colorado, 1973.
- [61] Particle Data Group. Passage of particles through matter http://durpdg.dur.ac.uk/lbl/index.html, 2005.
- [62] M. I. Besana, F. Cerutti, A. Ferrari, W. Riegler, and V. Vlachoudis. Evaluation of the radiation field in the future circular collider detector. Phys. Rev. Accel. Beams, 19:111004, Nov 2016.
- [63] H. Rafique, A.M. Krainer, R. Appleby, and J. L. Abelleira. Proton cross-talk and losses in the dispersion suppressor regions at the FCC-hh. In Proceedings, 8th International Particle Accelerator Conference (IPAC 2017): Copenhagen, Denmark, page TUPIK037, May, 2017.
- [64] J. L. Abelleira, H. Rafique, R. B. Appleby, M. I. Besana, and A. Seryi. Cross-talk studies between FCC-hh experimental interaction regions. In Proceedings, 8th International Particle Accelerator Conference (IPAC 2017): Copenhagen, Denmark, page TUPVA036, May, 2017.
- [65] G. Apollinari, I. Bejar Alonso, O. Brüning, P. Fessia, M. Lamont, L. Rossi, and L. Tavian (editors). High-Luminosity Large Hadron Collider (HL-LHC): Technical Design Report V. 0.1. CERN Yellow Reports: Monographs. CERN-2017-007-M. CERN, Geneva, 2017.
- [66] A. Louzguiti. private communication, 2018.
- [67] H. Mainaud Durand et al. HL-LHC Alignment Requirements and Associated Solutions. In Proc. of International Particle Accelerator Conference (IPAC’17), Copenhagen, Denmark, 14–19 May, 2017, number 8 in International Particle Accelerator Conference, pages 1893–1896, Geneva, Switzerland, May 2017. JACoW. https://doi.org/10.18429/JACoW-IPAC2017-TUPIK085.