Can Volcanism Build Hydrogen-Rich Early Atmospheres?
Abstract
Hydrogen in rocky planet atmospheres has been invoked in arguments for extending the habitable zone via \ceN2-\ceH2 and \ceCO2-\ceH2 greenhouse warming, and providing atmospheric conditions suitable for efficient production of prebiotic molecules. On Earth and Super-Earth-sized bodies, where hydrogen-rich primordial envelopes are quickly lost to space, volcanic outgassing can act as a hydrogen source, provided it balances the hydrogen loss rate from the top of the atmosphere. Here, we show that both Earth-like and Mars-like planets can sustain atmospheric \ceH2 fractions of several percent across relevant magmatic ranges. In general this requires hydrogen escape to operate somewhat less efficiently than the diffusion limit. We use a thermodynamical model of magma degassing to determine which combinations of magma oxidation, volcanic flux and hydrogen escape efficiency can build up appreciable levels of hydrogen in a planet’s secondary atmosphere. On a planet similar to the Archean Earth and with a similar magmatic , we suggest that the mixing ratio of atmospheric \ceH2 could have been in the range 0.2-3%, from a parameter sweep over a variety of plausible surface pressures, volcanic fluxes, and \ceH2 escape rates. A planet erupting magmas around the Iron-Wüstite (IW) buffer (i.e., 3 log units lower than the inferred Archean mantle ), but with otherwise similar volcanic fluxes and \ceH2 loss rates to early Earth, could sustain an atmosphere with approximately 10-20% \ceH2. For an early Mars-like planet with magmas around IW, but a lower range of surface pressures and volcanic fluxes compared to Earth, an atmospheric \ceH2 mixing ratio of 2-8% is possible. On early Mars, this \ceH2 mixing ratio could be sufficient to deglaciate the planet. However, the sensitivity of these results to primary magmatic water contents and volcanic fluxes show the need for improved constraints on the crustal recycling efficiency and mantle water contents of early Mars.
keywords:
volcanic degassing , hydrogen , atmosphere , redox , early Earth1 Introduction
Atmospheric \ceH2 could be key to the development of terrestrial planets. The presence of significant hydrogen fractions has been invoked in extending the habitable zone (e.g., Sagan, 1977; Stevenson, 1999; Wordsworth, 2012; Pierrehumbert and Gaidos, 2011; Abbot, 2015; Ramirez and Kaltenegger, 2017) and providing conditions suitable for the production of prebiotic molecules via \ceH2 buildup then loss (Miller and Urey, 1959). Several studies have looked at the climatic consequences of adding a hydrogen fraction to the atmospheres of the early Earth (Wordsworth and Pierrehumbert, 2013), early Mars (Ramirez et al., 2014; Batalha et al., 2015; Wordsworth et al., 2017; Hayworth et al., 2020) and terrestrial planets more widely (e.g., Ramirez and Kaltenegger, 2017). Others have looked at how hydrogen can be introduced into the earliest primary atmospheres of terrestrial bodies from proto-planetary nebular gases (Stevenson, 1999), magma oceans (Deng et al., 2020) and accretion/impact processes (Schaefer and Fegley, 2007, 2010). However, hydrogen is a light element which escapes easily to space; on terrestrial sized bodies, any primary atmosphere should be blown off by high rates of stellar irradiation within the first few million years (Pierrehumbert and Gaidos, 2011). Therefore, to maintain a hydrogen-rich atmosphere on a rocky planet, \ceH2 must be constantly replenished over geologic timescales to offset its continuous loss to space.
In the presence of life, methanogens and anoxygenic phototrophs can be an important source of hydrogen in the form of methane (Kharecha et al., 2005). However, in a prebiotic context geologic sources of \ceH2 are required to generate abiotic secondary atmospheres (i.e., atmospheres generated post-accretion and magma ocean phase, and before the emergence of life). These can include the serpentinisation of ultramafic rock, metamorphic fluxes of \ceCH4 from hydrothermal vents, and volcanism (Kasting, 2013). It is this latter possibility of volcanic \ceH2 production in an early secondary atmosphere that this paper focuses on.
A key parameter determining the build up of \ceH2 in planetary atmospheres is the escape rate of hydrogen to space. Were this loss rate to have been lower on the early Earth, moderate to significant fractions of hydrogen could have built up (Tian et al., 2005; Kuramoto et al., 2013). In these studies, the hydrogen source is assumed to be volcanic and is based on extrapolating from the modern volcanic hydrogen flux. The missing link for these studies is a more thorough analysis of the amount of hydrogen which could reasonably be released to an atmosphere through volcanism, as a function of planetary interior and exterior conditions. There are 3 primary controls on this; 1) the redox state of the degassing magma, 2) the pressure of degassing, and 3) the overall volcanic flux of the planet. Once these factors have been constrained, the hydrogen loss rate necessary to achieve a particular hydrogen fraction from volcanism can be evaluated. Here, we aim to address this issue by using a magma degassing code to constrain the possible range of volcanically sustained \ceH2 in planetary atmospheres, linking the atmospheric \ceH2 fraction to the potential oxidation state, geological activity and atmospheric loss rates of early Earth, early Mars and terrestrial planets.
2 Controls on a volcanic hydrogen atmospheres
2.1 Magma degassing
Volcanic gases are widely considered to be approximately in equilibrium with the oxidation state of the magma from which they exsolved (e.g., Moretti and Papale, 2004; Burgisser et al., 2015). Therefore, to change the speciation of a gas phase from oxidised (\ceH2O, \ceCO2 and \ceSO2 dominated) to reduced (\ceCO, \ceH2 and \ceH2S dominated), and therefore more \ceH2-rich, the of the magma needs to be lower. A greater dissolved water content at a constant will result in a melt with a greater total atomic hydrogen content, and therefore will also increase the volcanic hydrogen emission.
Pressure exerts a dominant control over volatile partitioning between the melt and the gas phase in a magmatic system, and therefore also controls the composition of a volcanic gas phase (Gaillard and Scaillet, 2014). Species with a low solubility such as \ceCO2 and \ceCO exsolve at higher pressures and therefore dominate the early stages of magma degassing, with more soluble and often more abundant phases such as water becoming dominant at low pressures (e.g., Dixon and Stolper, 1995). The effect of pressure on the composition of secondary volcanic atmospheres has been examined by Gaillard and Scaillet (2014), in which they assume average redox conditions across the solar system driven by graphite saturation buffering an ascending magma’s ,
| (1) |
and therefore perform all their calculations starting at FMQ -1.5. However, the average of erupting MORB on Earth (a relatively oxidised planet) is FMQ -0.410.43 (Bézos and Humler, 2005), and values across the solar system vary down to IW-5 on Mercury (Zolotov et al., 2013; Wadhwa, 2008). Given the similar potential for diversity among exoplanets (Doyle et al., 2019), here we examine a wide range of values.
While pressure and magmatic can control the mass and composition of the gas phase, the total amount of \ceH2 emitted to an atmosphere will also be controlled by the volcanic flux. A higher flux can be achieved either through a larger total volatile content of the magma, which then releases a greater volume of gas into the atmosphere per unit mass of magma degassed, or a greater total flux of magma to the surface, such as may occur in a younger volcanically active planet, or a planet experiencing tidal heating (e.g., Io in our own solar system).
2.2 Hydrogen escape mechanisms
The escape flux of hydrogen from an atmosphere is dictated by the rate at which hydrogen diffuses through the layer of background air between the homopause (the level below which an atmosphere is well mixed) and the exobase, above which the atmosphere becomes collisionless. I.e., the escape flux is limited by the rate at which \ceH2 can be supplied to the altitude where it can escape Earth’s atmosphere. In a diffusion-limited escape regime, once hydrogen diffuses above the exobase it is rapidly lost from the atmosphere so that the rate of replenishment from below is the limiting factor. These removal processes can be thermal, with two end-member approximations, or involve suprathermal mechanisms (e.g., photochemical escape, charge exchange and polar wind) which we do not consider here.
Thermal escape can occur as Jeans’ escape; where molecules from the high-energy tail of the molecular thermal distribution attain enough kinetic energy to escape from the exobase; and hydrodynamic escape, occurring when heating of the atmosphere below the exobase by stellar extreme ultraviolet radiation (XUV) causes an upward pressure gradient driving a bulk, radial outflow. Jeans’ escape occurs with a high temperature exobase, and is responsible for a non-negligible fraction of hydrogen escape occurring today on Earth and Mars (Catling and Kasting, 2017). Hydrodynamic escape becomes dominant when the XUV flux is sufficient to drive a bulk outflow, and is key early in the lifetime of planetary systems, when the parent star is more active (Tu et al., 2015).
Hydrogen escape from Earth is generally assumed to be diffusion-limited, and this diffusion rate can be linked to the concentration of hydrogen in an atmosphere (Walker, 1977). However, some models of the early atmosphere suggest a cold exobase, and insufficient stellar XUV, resulting in a less efficient, energy limited escape regime (Tian et al., 2005; Kuramoto et al., 2013). Estimates for the hydrogen mixing ratio in the Archean atmosphere range from 0.1 % (e.g., Walker, 1977; Kasting, 1993), through 1 % \ceH2 (Kuramoto et al., 2013; Zahnle et al., 2019) up to 30 % (Tian et al., 2005). To reflect uncertainty around the escape rate of \ceH2, we model cases both at and below the diffusion limit in this paper. This is initially carried out in manner which is agnostic of the specific physics of hydrogen escape, so that the reduction from the diffusion limit into an energy limited scenario can be applied to planets generally, including those in different stellar regimes (and therefore different high energy UV spectra). However, escape fluxes below the diffusion limited rate are later compared to XUV-limited escape to physically inform results for the early Earth and Mars.
3 Modelling Volcanic Outgassing
3.1 Thermodynamics
To calculate the gases input to an atmosphere from a volcanic source, we built a model using the mass balance and equilibrium constants method (e.g., Holloway, 1987; Gaillard and Scaillet, 2014; Burgisser et al., 2015). This model calculates the speciation and volume of a COHS gas phase in equilibrium with a silicate melt at a given pressure, temperature and magma , considering both the homogeneous gas-phase equilibria and the heterogeneous gas-melt equilibria. Equilibrium is always assumed throughout the system, and we run the calculations at the prescribed surface pressure and eruptive . The COHS volatile system is made up of 9 species, undergoing the following reactions,
| (2) |
| (3) |
| (4) |
| (5) |
| (6) |
Melt-gas equilibria are considered in the form of a solubility law, where the amount of species dissolved in the melt is found by applying a power law
| (7) |
where is a species fugacity coefficient, is the mol fraction of the species currently in the gas phase, and is pressure in bars. and are calculated from Holland and Powell (1991), from Shaw and Wones (1964) and all other fugacity coefficients from Shi and Saxena (1992). Values for and are taken from Burgisser et al. (2015), \ceCO, \ceCH4 and \ceS2 are treated as insoluble. Volatile solubility laws are compositionally dependent; for this study all solubility constants were chosen to be suitable for a basaltic melt. The equilibrium constant equations of eqs. 2 - 6 for each species are solved simultaneously with eq. 7, and mass balance is maintained by keeping the mass of atomic O, C, H and S constant.
We note here that this is a somewhat simplistic model for sulfur, which does not account for how sulfur degassing can impact the of a melt as it erupts. Source-to-surface modelling of a magma degassing \ceH2 would show sulfur species further complicating the relationship between mantle and \ceH2 outgassing, as release of S2- can lower the of a system (e.g., Gaillard et al., 2011), while sulfur degassing is enhanced under oxidising conditions. Given that the conditions relevant to most planetary magmatism will have sulfur speciated as S2-, the result of our simplified S degassing model is to slightly underestimate the \ceH2 production, if the ’s we quote are viewed as being mantle .
3.2 Volcanic outgassing
The outgassing flux of a species can be parameterized in terms of a concentration of species X as
| (8) |
where is the total volcanic outgassing flux [mol s-1], and is the total number mixing ratio of species in the volcanic input to the base of the atmosphere.
The volcanic outgassing flux varies according to the vent pressure and melt (See A). To account for this, Earth’s modern flux ( = mol s-1, taken from Tables 7.1 and 7.3 in Catling and Kasting, 2017), was assumed to be equal to the amount of volcanic outgassing modelled for a magma degassing at 1 bar and FMQ=0, with an initial volatile content of 350 ppm H, 550 ppm C and 1000 ppm S (approx 0.3 wt % \ceH2O and 2000 ppm \ceCO2; this modern Earth reference run was chosen as a good approximation of the average modern melt compositions degassing at mid-ocean ridges, Michael and Graham, 2015; Wallace et al., 2015). In all cases, the initial volatile content refers to an undegassed magma, rather than a mantle source. The number of moles from all other model runs were then scaled against the total number of moles of gas (of all species) released by this reference run for the modern Earth,
| (9) |
where is the total number of moles of gas released by any one model run, and is the number of moles released by our reference modern Earth run. This ratio is used to adjust the volcanic flux to account for the effect of redox and surface pressure on volcanic degassing.
Volcanic outgassing of hydrogen is discussed here as , the total hydrogen (H, tracked as \ceH2 molecules) number mixing ratio of the volcanic gases input to the base of the atmosphere. This value can be parameterized in several different ways,
| (10a) | ||||
| (10b) | ||||
| (10c) | ||||
where is the mixing ratio of each individual species (i.e., \ceH2, \ceCH4 etc) in the volcanic gas. of The three different cases in eq.10, summarised here, are discussed in more detail in B.
- Case a:
-
Only molecular \ceH2 from volcanic outgassing is considered as providing a \ceH2 input to the base of the atmosphere. All other hydrogen-bearing species, e.g., \ceCH4 and \ceH2S are assumed to be removed rapidly via deposition to the surface.
- Case b:
-
All the reduced hydrogen-bearing volcanic gases i.e., \ceH2, \ceCH4 and \ceH2S contribute to . This is equivalent to assuming that all the \ceCH4 and \ceH2S is oxidised to \ceCO2 and \ceSO2 respectively, before reaching the homopause, providing an additional volcanically derived flux of \ceH2 (Catling and Kasting, 2017). As \ceH2O is the oxidant in both cases, this case requires a large enough reservoir of atmospheric water to oxidise all the \ceCH4 and \ceH2S released, to maintain the photochemically-derived \ceH2 over the geological timescales of interest.
- Case c:
-
Some volcanic \ceH2S will be deposited to the surface, and some volcanic \ceH2 will be removed from the atmosphere as it undergoes subsequent photochemical and thermochemical reactions followed by rainout of any soluble species produced. The rest of the \ceCH4 and \ceH2S reacts as in case b, leaving in this case to be the sum of the H-bearing species, weighted by the number of moles of \ceH2 each species contains (equivalent to all the H-bearing species being photodissociated in the upper atmosphere).
In a natural system, it is very unlikely that all the outgassed \ceCH4 and \ceH2S will be efficiently converted to \ceH2 with no deposition to the surface. We therefore adopt the definition of case c here, with defined in equation 10c. This provides a compromise that is intermediate between the definitions of equations 10a and 10b (See B for examples of how the choice of photochemical regime impacts results).
, the total flux of molecular hydrogen from volcanic sources, can therefore be calculated as:
| (10k) |
In order to consider atmospheric escape, it is convenient to convert from geological units of mol s-1 to the photochemical units molecules cm-2 s-1.
Although volcanic CO can generate \ceH2 through
| (10l) |
we treat volcanic CO outgassing as compensated for by CO deposition, i.e.,
| (10m) |
as the deposition rate is expected to overwhelm the photochemistry. is the volcanic flux of \ceCO, the deposition velocity [cm s-1] and the atmospheric mixing ratio of \ceCO.
4 Relating outgassing to atmospheric \ceH2 mixing ratios
We initially assume the rate of escape of \ceH2 to space is limited by the diffusion rate across the homopause, as is the case on the modern Earth. The diffusion limited flux is given by Walker (1977) as
| (10n) |
where b is the binary diffusion parameter for species X, is the scale height of the atmosphere, and is the total number mixing ratio of X in the atmosphere (as opposed to , which is the mixing ratio in the volcanic gas).
here is , the sum of the mixing ratios of all \ceH2-bearing atmospheric constituents above the tropopause (e.g., Kharecha et al., 2005). is evaluated above the stratospheric cold trap, where \ceH2O has been removed by condensation,
| (10o) |
We use a well established convention for the escape of \ceH2 (Walker, 1977; Kasting, 1993; Kharecha et al., 2005), by balancing the volcanic outgassing flux with escape, i.e.,
| (10p) |
The escape flux can be less than or equal to the diffusion limited case , with the difference parameterized by an escape efficiency factor bound between 0 and 1.
Volcanic flux is also a variable, so this is examined using an outgassing flux factor , indicating the factor of increase in volcanic outgassing rate compared to the modern Earth. This maintains a steady-state atmosphere, with the total fraction of \ceH2 in the atmosphere defined as
| (10q) |
is the binary diffusion parameter at 1.8 , the weighted average of (2.73 ) and (1.46 ) based on the modern relative abundances of H and \ceH2 at the homopause. In detail, these values will vary slightly depending on the homopause temperature and background atmospheric composition. To find the reduction in escape efficiency necessary to achieve a given , we solve for
| (10r) |
setting to a desired atmospheric mixing ratio of \ceH2 and keeping in mind that is an efficiency factor bound between 0 and 1, defining how far below the diffusion limited loss rate \ceH2 escape is occurring.
5 systematics with and pressure
We initially examine how varies with and vent pressure alone, across three different initial volatile contents. Different pressures are considered to cover the range of vent pressures relevant for the Archean (from 3 to 0.5 bar, e.g., Goldblatt et al., 2009; Som et al., 2016; Rimmer et al., 2019). They also cover pressures relevant to vents in submarine settings under shallow oceans, a possible scenario for the Archean (Flament et al., 2008).
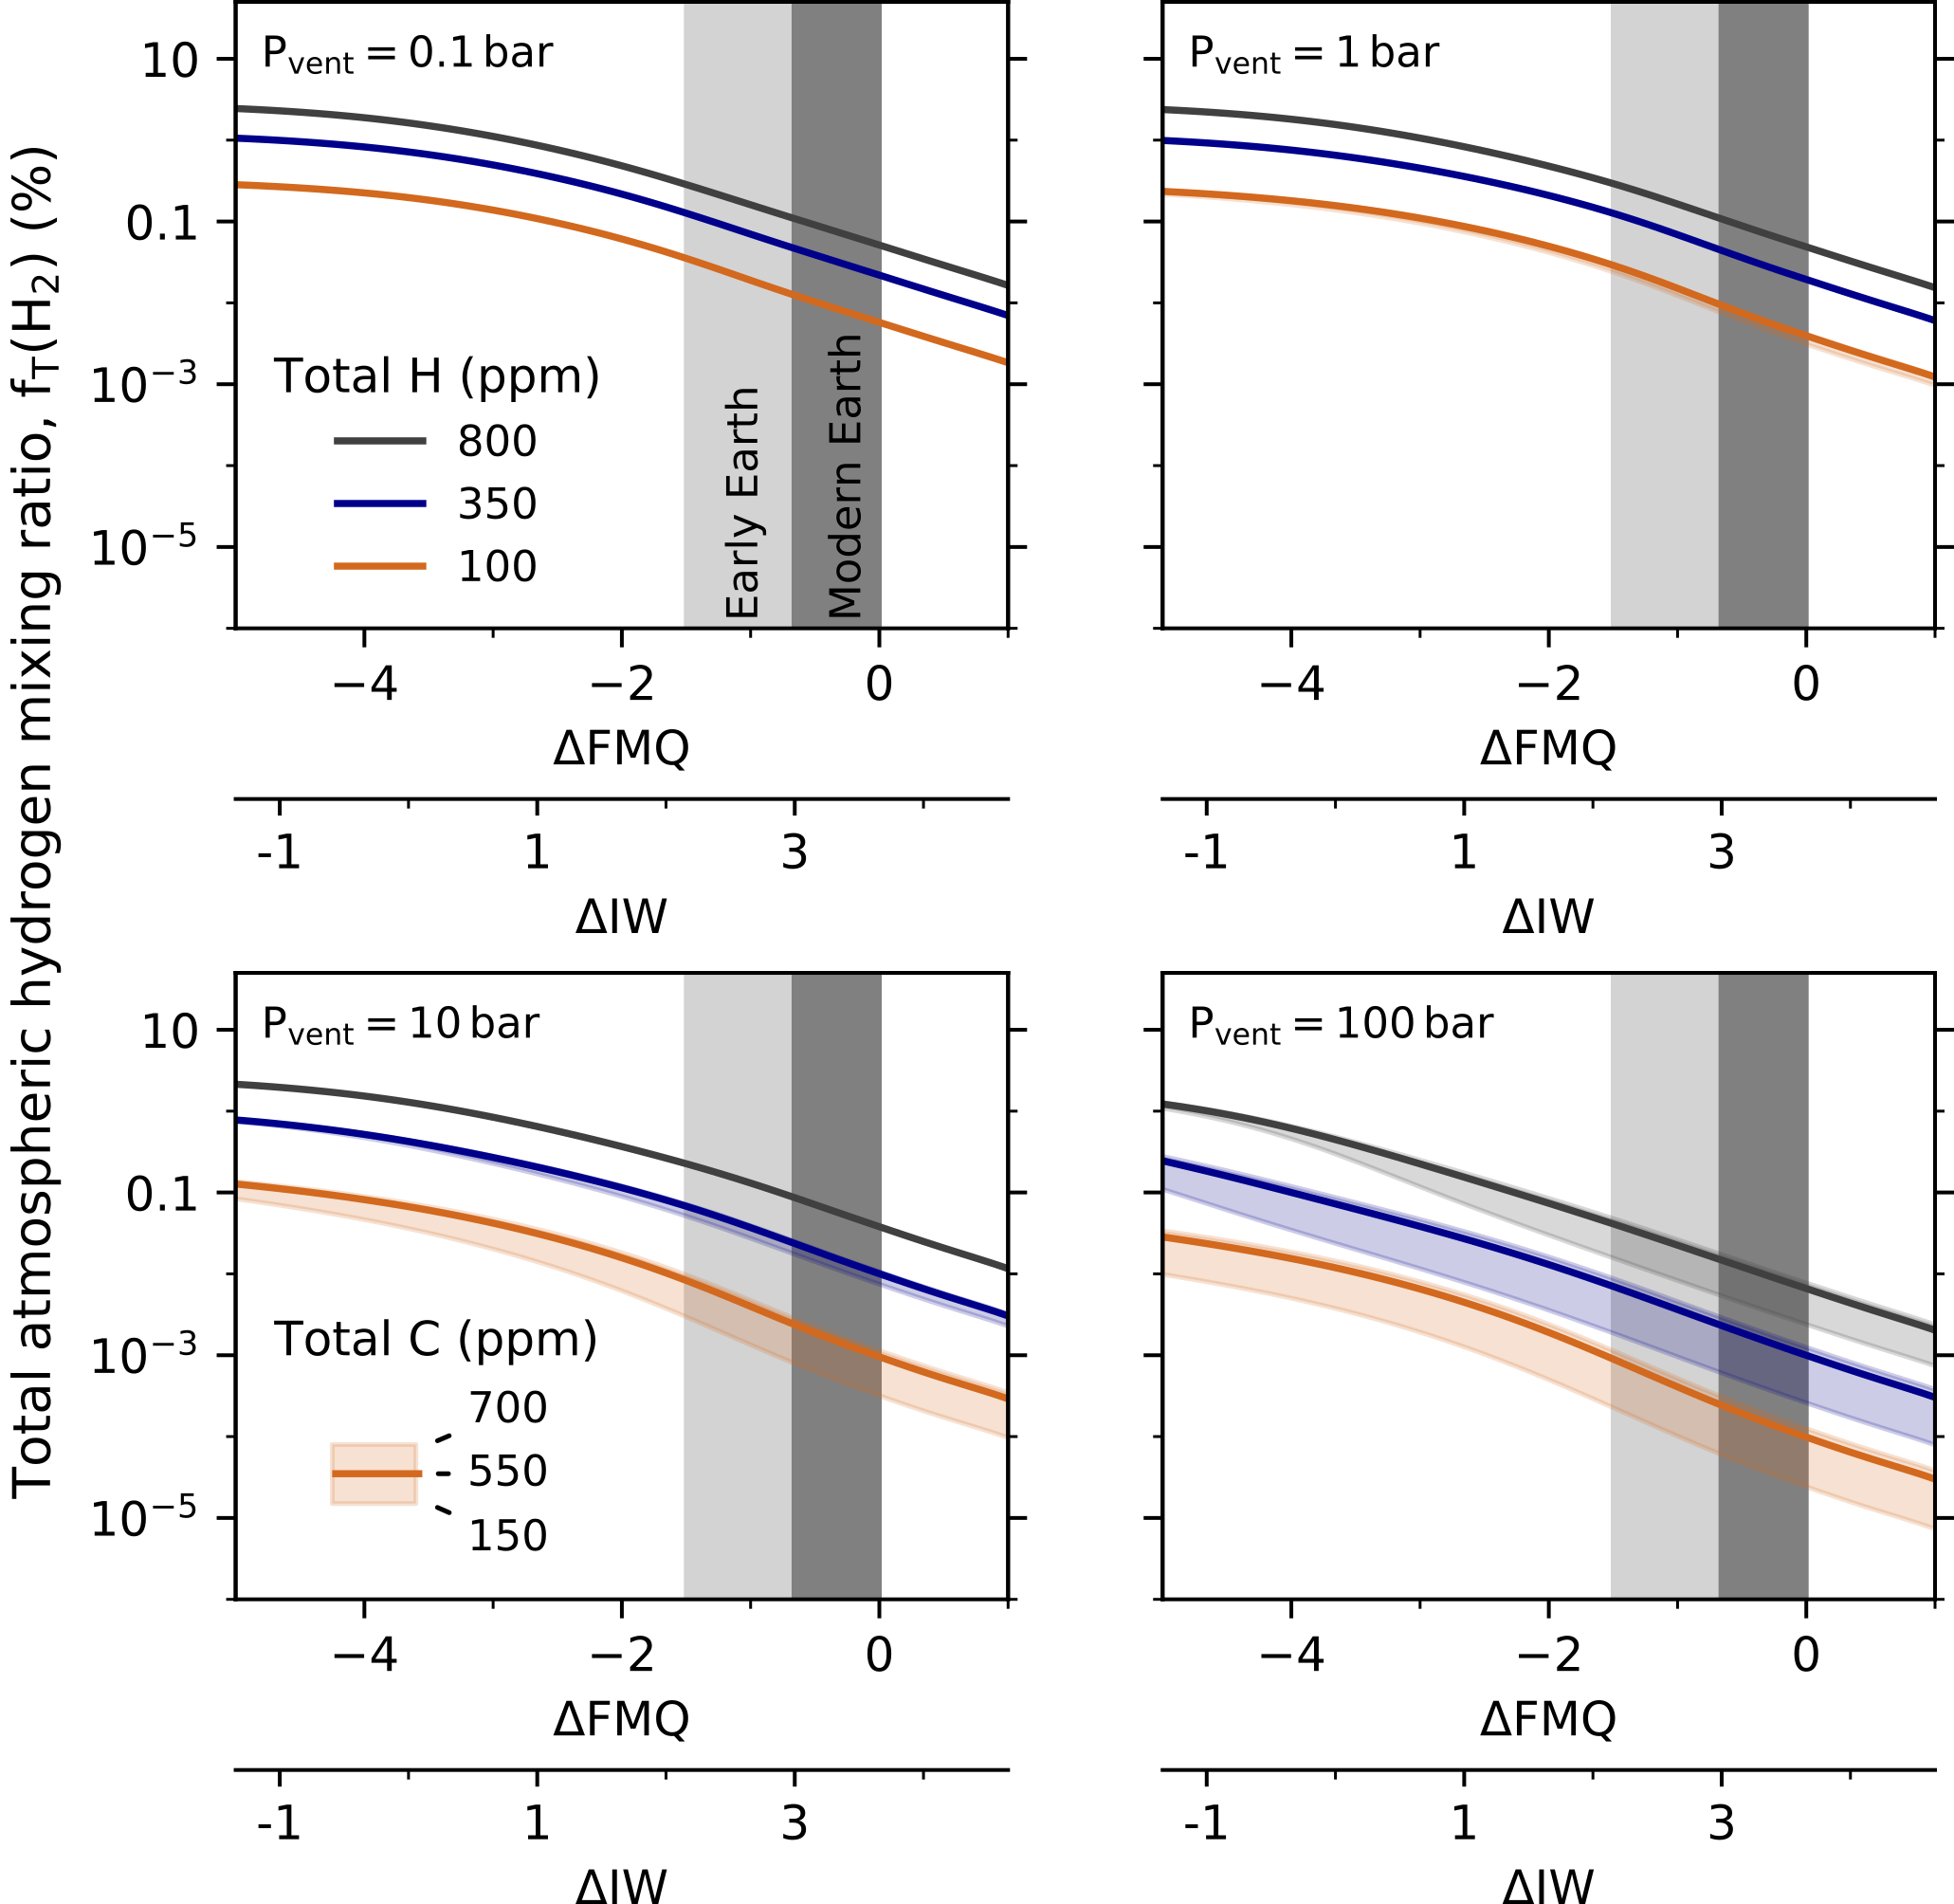
Depending on the initial volatile content of the melt (see A) and the vent pressure, more reduced melts can sustain an atmosphere with a greater fraction of \ceH2 (Fig. 1), with a decrease in of 2 log units providing a 15 increase in . converges on a maximum value at low , which is dependent on greatest achievable for a melt’s volatile content and vent pressure (see A). for a fixed decreases with increasing surface pressure, although there is very little difference in the results for 0.1 and 1 bar. This is due to the pressure dependent solubility of water and sulfur species; at high vent pressures a smaller fraction of the system’s volatiles have exsolved and are available to form the fraction, effectively decreasing the volcanic flux. Atmospheres fed by H-poor magmas show a greater decrease in as surface pressure is increased. The scale of this decrease is greater the more oxidised the system is. H-poor systems are particularly sensitive, as water is very soluble in basalt: for a 100 ppm H system at FMQ -3, 45 % of the H content (almost entirely speciated as water) can remain dissolved in the melt even at 1 bar pressure. In contrast, for an 800 ppm H system, 10 % of the total hydrogen is still stored in the melt at 1 bar and with an FMQ -1.
Higher pressure also results in greater variability of with carbon content. At low pressures, and to some extent low , a carbon content change of 4.5 produces a negligible impact on atmospheric . However, at high pressures and higher , this range changes the by almost 1 order of magnitude. increases with C content at high pressures because the magma reaches \ceCO2 saturation earlier, and forms a gas phase within the melt at higher pressures. Hydrogen bearing species can then partition into this gas phase and be degassed at higher pressures than they would be in a C-poor magma.
6 Achieving volcanically-sustained \ceH2 atmospheres
Fig. 1 suggests that for a very reduced planet with a moderate to low pressure atmosphere and with a mantle volatile budget, volcanic flux, and stellar environment otherwise similar to the modern Earth, the maximum achievable is 3.2 %. More conservatively, considering the range of magma likely across Earth history (e.g., Aulbach and Stagno, 2016; Nicklas et al., 2019; Bézos and Humler, 2005), represented as the dark and light grey bars in Fig. 1, the maximum possible from this model would be 0.4 %, assuming 1 bar surface pressure and a high H content. This result is consistent with the 0.1 % often quoted for the Archean (Walker, 1977; Kasting, 1993), but it requires degassing pressures of less than 10 bar and 350 ppm H in the melt. To achieve values of more conducive to greenhouse heating, prebiotic chemistry, and to match evidence for 1 % (Zahnle et al., 2019), an increase in the volcanic flux (, Fig. 2), or a reduction in the loss efficiency, (Fig. 3) must be invoked. We therefore explore varying these two parameters in this section.
6.1 Changing the volcanic flux
A change in the volcanic flux can modify the \ceH2 flux to an atmosphere (see eq. 10q, Fig. 2) and is representative of either, 1) a change in the magma’s initial volatile content, 2) a greater proportion of magma reaching low pressure, or 3) increased magma production. Here, we have examined a range of volcanic fluxes from modern to 20 the modern rate. As expected, increasing the volcanic flux produces a nearly proportional increase in (Fig. 2); proportional where 1, and slightly less than a proportional as increases above this point. Increasing the H content from 350 ppm to 800 ppm is equivalent to increasing the volcanic flux by 2-3. For a magma at FMQ -1.5, increasing the volcanic flux to 10 modern produces an of 1.6 - 3.4 % for 350 ppm H and 800 ppm H, respectively.
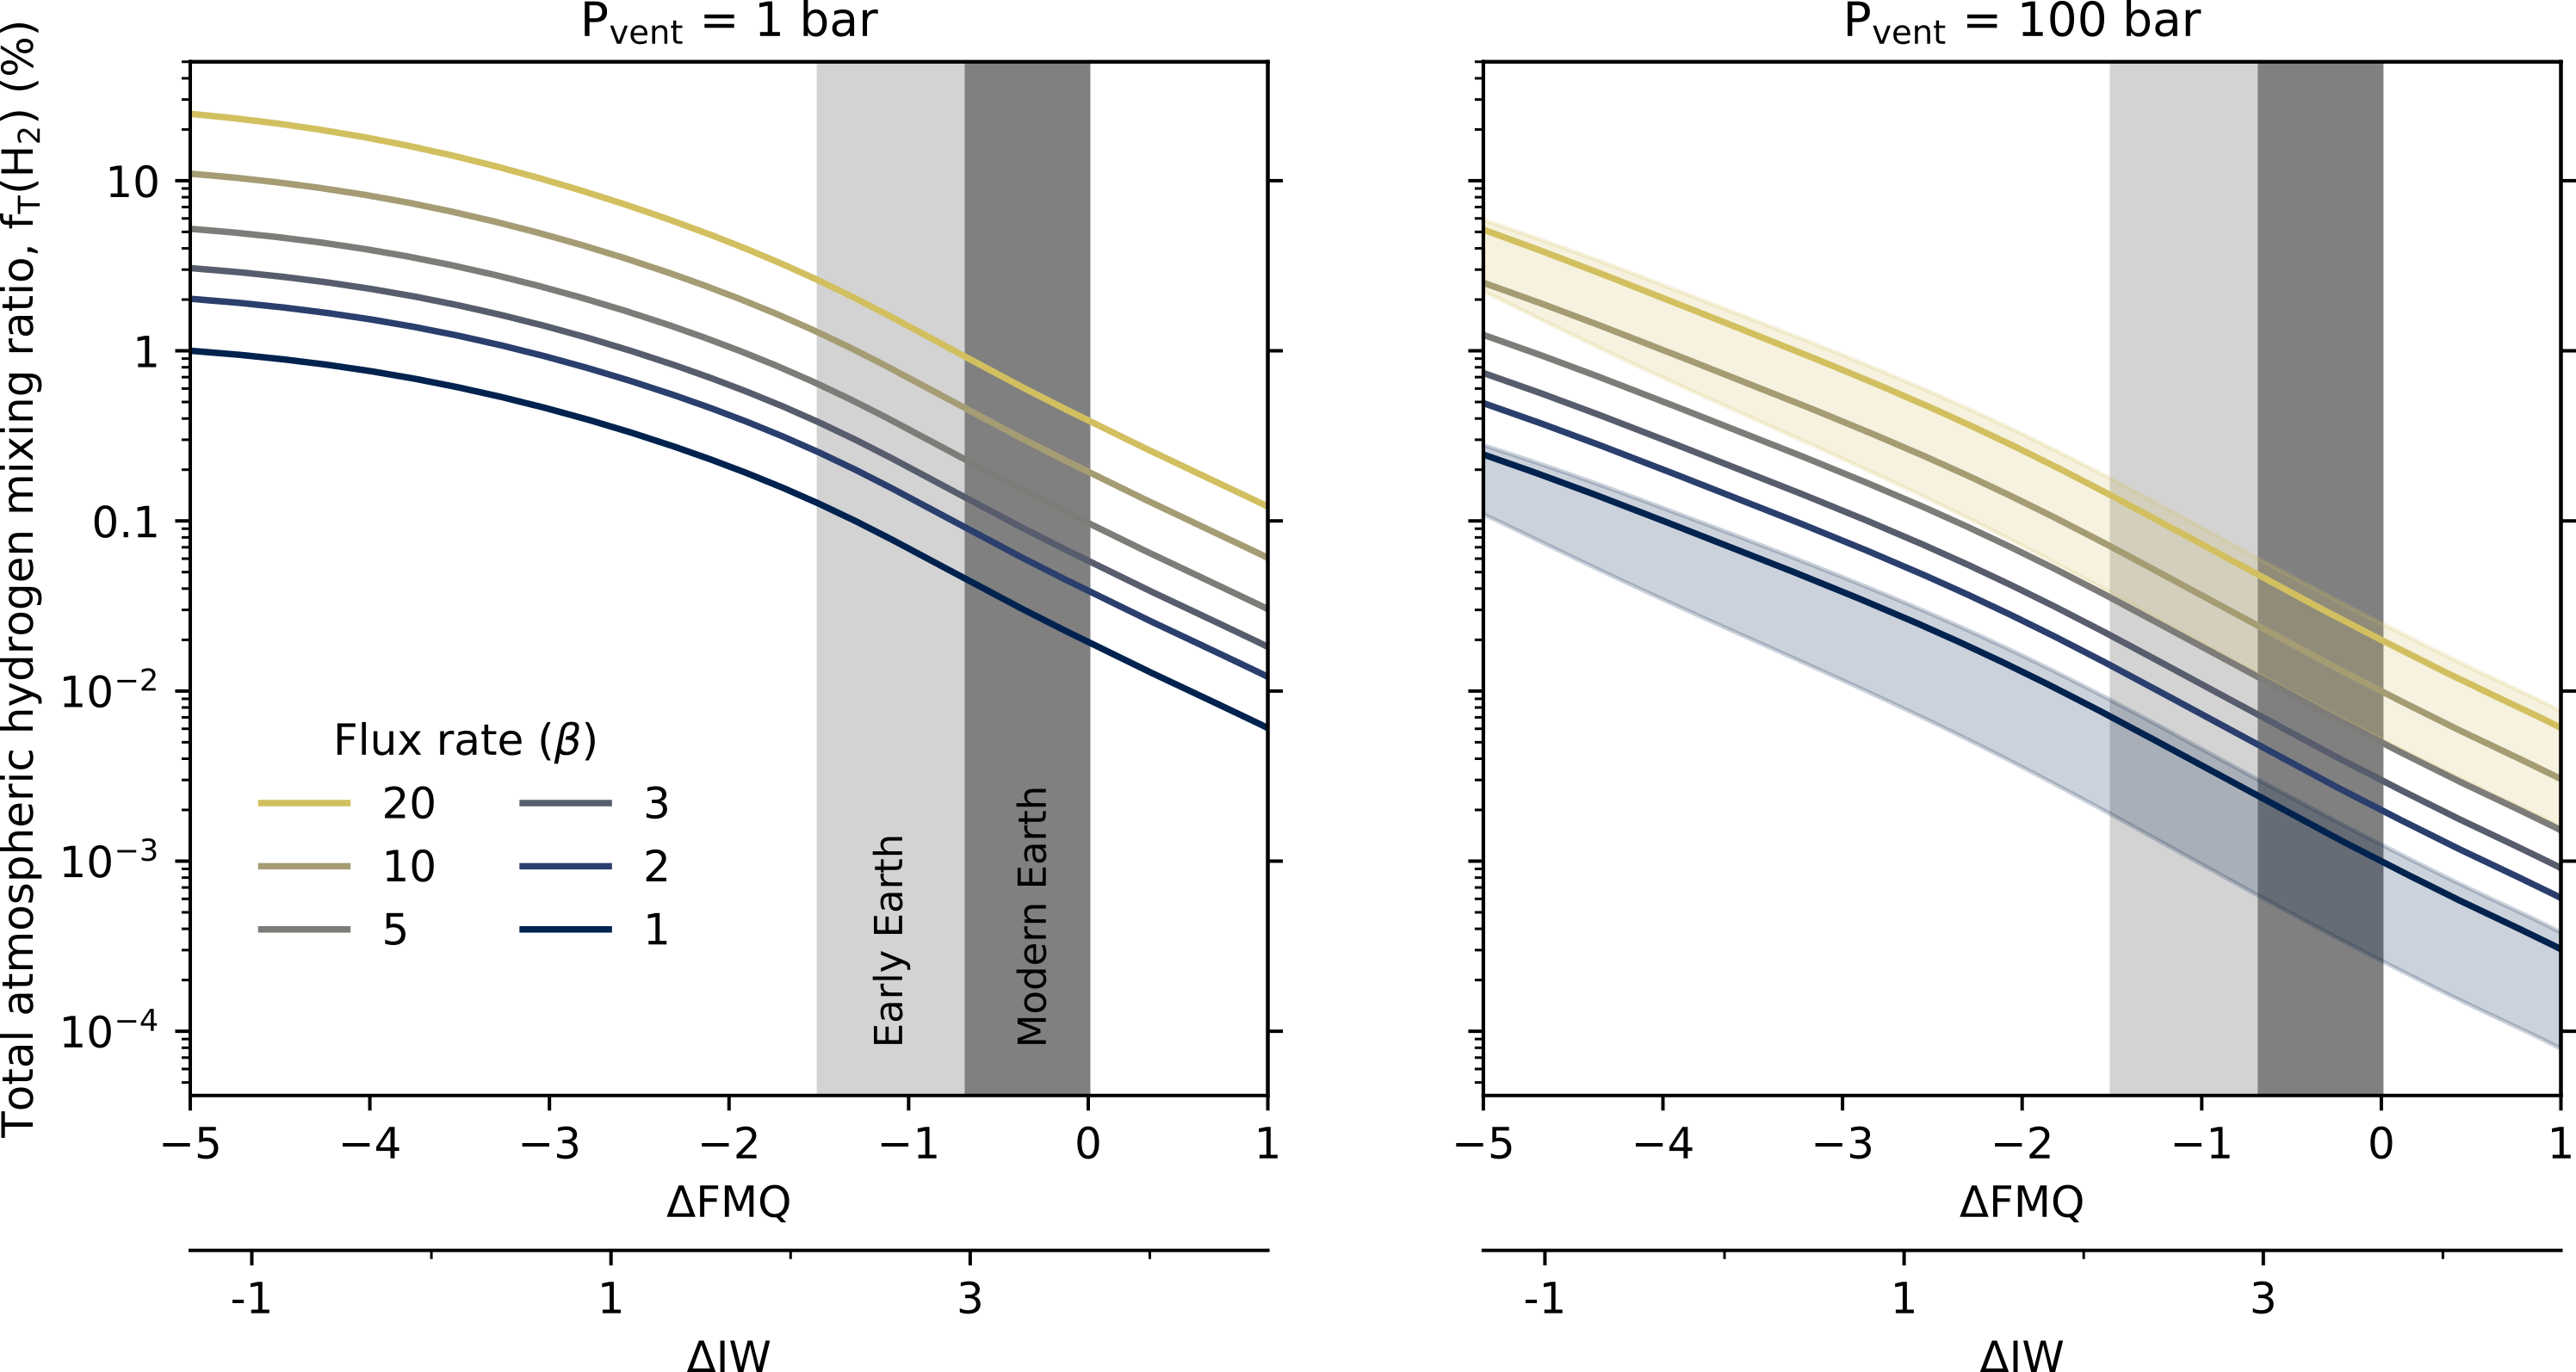
The 100 bar panel in Fig. 2 indicates that even with very high fluxes and a reduced Archean melt, the maximum achievable would be around 0.2 %. Only a highly reduced planet erupting melts around the IW buffer, with a high volatile content (equivalent to 400 ppm H) would see contents above 1 % in an atmosphere if the average vent pressure is at 100 bar. We therefore suggest that without significant modification to the hydrogen escape rate, it is unlikely than an early Earth scenario with the majority of it’s volcanism occurring in submarine settings could attain a hydrogen-rich secondary atmosphere. Exoplanets covered by global oceans, and those with dense atmospheres (e.g., \ceCO2-rich atmospheres similar to that of Venus) would similarly have to be erupting highly reduced melts with a high volcanic flux, and/or have a lower hydrogen escape rate to achieve an atmosphere with an on the order of 1% or above.
6.2 Changing the \ceH2 escape rate
Rather than modifying the volcanic input term to the atmosphere, hydrogen can be built up in the atmosphere by reducing the loss rate to space. So far, we have considered loss rate to be purely diffusion-limited, as it is on the modern Earth (Catling and Kasting, 2017). However, if the loss rate were less efficient, a greater could be achieved for the same and volcanic flux. We have parameterized the reduction in loss efficiency as , and calculated the value of required to achieve a certain , for a given magma and =1 (Fig. 3).
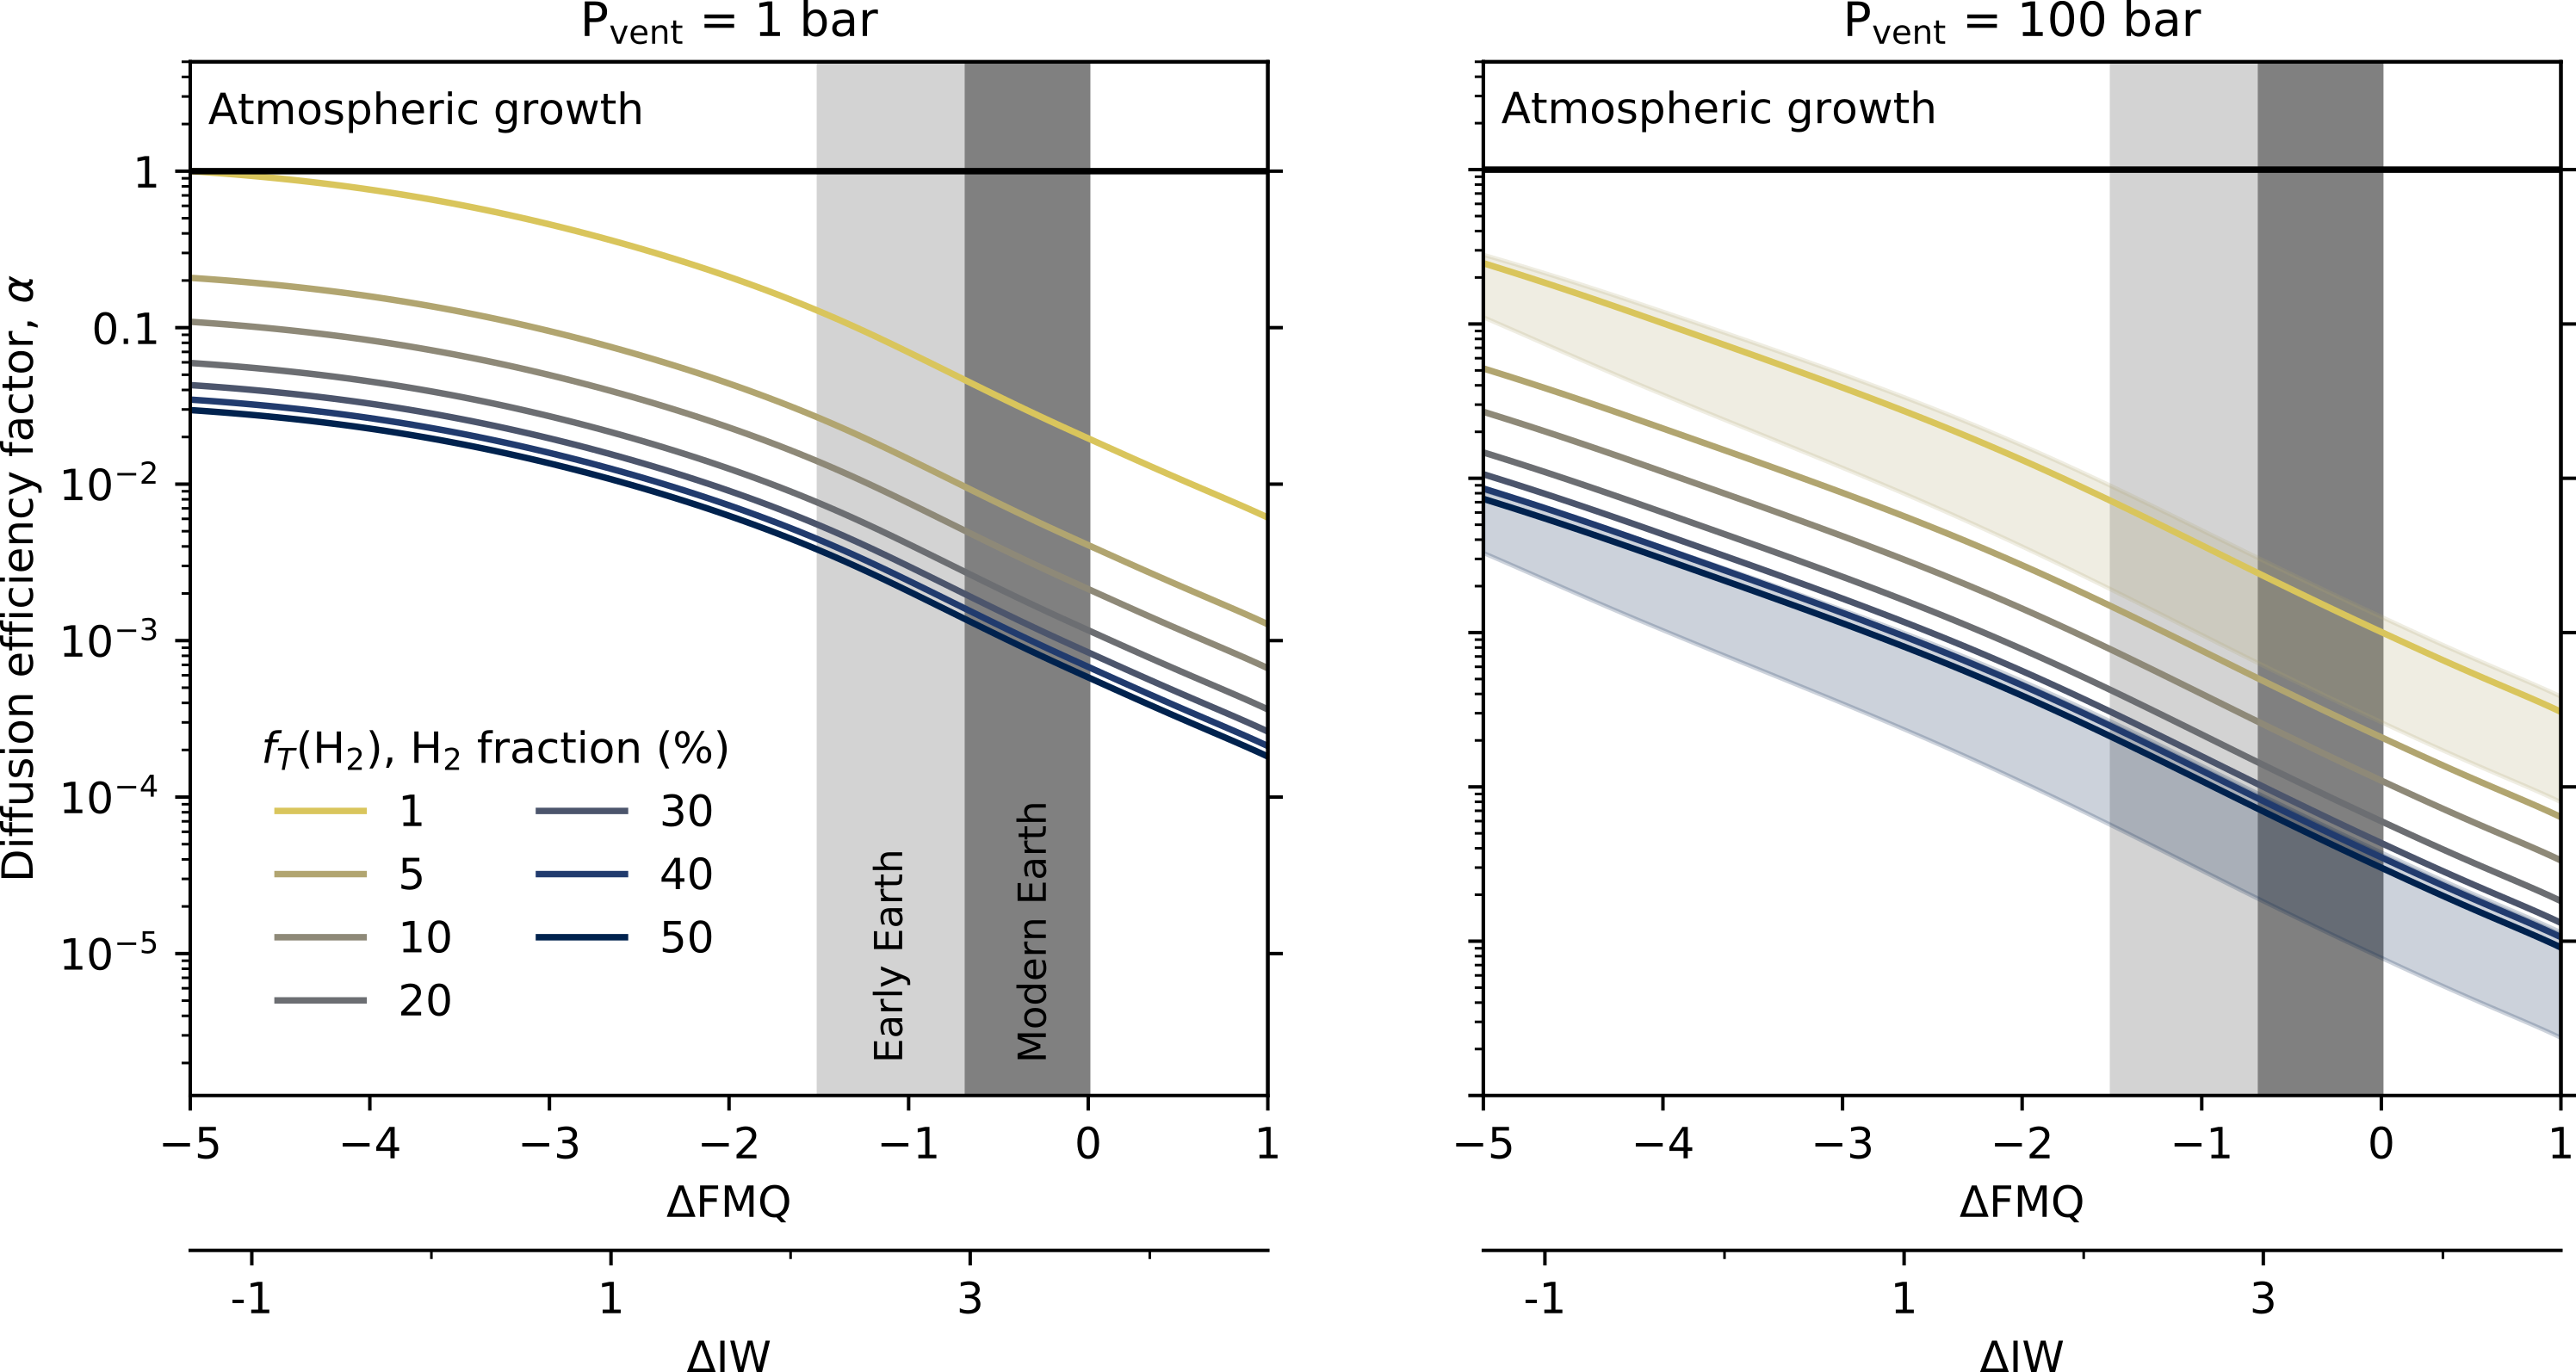
At the reduced end of Fig. 3, around IW, a loss rate of = 0.1 (i.e., 10 % of modern) is enough to build up an of 10 %. In contrast, across the more oxidised magmatic conditions prevailing over Earth history, an of 0.16 - 0.025 is needed to build up a 1 % mixing ratio of \ceH2 in a 1 bar atmosphere. Increasing the volatile content to 800 ppm H allows to increase to 0.4-0.06 while still generating 1 % \ceH2 at 1 bar. However, once the vent pressure has been increased to 100 bar, is required to achieve 1 % given Earth’s magmatic . Large reductions in escape efficiency below the diffusion limit are required to obtain at the percent level. We discuss whether such values for are plausible in the following section, but this suggests that the volatile content and rate of volcanism could be the key variables in achieving a hydrogen-rich secondary atmosphere, rather than large changes in the atmospheric loss rate.
7 \ceH2 on the early Earth
Using a thermodynamic magma degassing model, we have mapped the parameter space for producing a terrestrial atmosphere with a significant \ceH2 mixing ratio. The parameters we have considered are magma , volatile content, volcanic outgassing flux, and atmospheric escape efficiency as variables. A 6 log unit change in can produce a change in of around a factor of 100. On planetary bodies with a reduced mantle such as Mars, volcanic fluxes comparable to those likely over the evolution of the Earth (1-12 modern e.g., Korenaga, 2006; Sleep and Zahnle, 2001; Avice et al., 2017) could result in secondary atmospheres with hydrogen fractions on the order of 1-10’s of percent. However, over the restricted range of likely for the Archean Earth, the most effective way to achieve an 1% is to vary both the outgassing flux and the loss efficiency within ranges closer to modern.
7.1 Likely escape rates on the early Earth
The escape rate of hydrogen from an atmosphere with a given will decrease below the diffusion limited escape rate, if removal of \ceH2 from above the homopause becomes less efficient. In this scenario, \ceH2 escape becomes energy limited by the incident XUV flux (e.g., Tian et al., 2005). Luger and Barnes (2015) describe the energy-limited mass loss rate () as
| (10s) |
where is the absorption efficiency of XUV, is the XUV flux at the top of atmosphere, is the mass of the planet, is the planet radius, is the radius where the bulk of the energy is deposited (which, for simplicity, we take to be equal to ), and is a tidal correction term of order unity. We convert this equation into units of flux,
| (10t) |
where is the XUV irradiation relative to modern Earth, is the modern XUV flux of 4.5 ergs for Earth (Ribas et al., 2005), is Avogadro’s constant ( mol-1) and is the molecular mass of a \ceH2 molecule ( g mol-1). Eq. 10t shows that as planetary mass decreases, the increases, getting closer to the diffusion limited rate (). At the same time, the diffusion limited flux decreases as gravitational strength. Hence as planetary mass decreases, the difference between the energy limited and diffusion limited fluxes decreases, and the resulting \ceH2 escape flux is reduced. Eq. 10t is also highly dependent on the absorption efficiency of XUV, . This value is typically fixed at 0.1 for terrestrial planets with high molecular weight atmospheres (e.g., Lopez et al., 2012; Owen and Alvarez, 2015; Bourrier et al., 2017), and is linked to the availability of different atmospheric species. For example, high \ceH2 fractions cause more efficient XUV absorption, a greater heating rate and faster escape; the presence of IR cooling molecules such as \ceCO2 reduces the amount of thermal energy which can be converted into atmospheric escape, reducing the loss rate.
Modelling of the hydrogen escape flux compared to diffusion limited and energy limited escape rates, depending on the activity of the Archean sun, has been carried out by Tian et al. (2005); Kuramoto et al. (2013) and Zahnle et al. (2019) (with these results summarised in Fig. 4). These models of the early Earth use a very low temperature for the exobase (250 K compared to the modern 1000 K), after assuming an anoxic and \ceCO2-rich atmosphere, similar to Mars and Venus today. A cold exobase makes the Jeans’ escape rate minimal, so that hydrodynamic escape controls escape efficiency. However, the temperature of the Archean upper atmosphere is highly debated, and will strongly depend on the atmospheric composition (Catling, 2006) and non-LTE effects, the operation of which in the Archean atmosphere are poorly constrained. A warmer exobase would increase the overall rate of loss, making it more likely the loss occurred at, or close to, the diffusion limit; therefore the hydrodynamic loss rates seen below should be considered a lower limit of escape rate and .
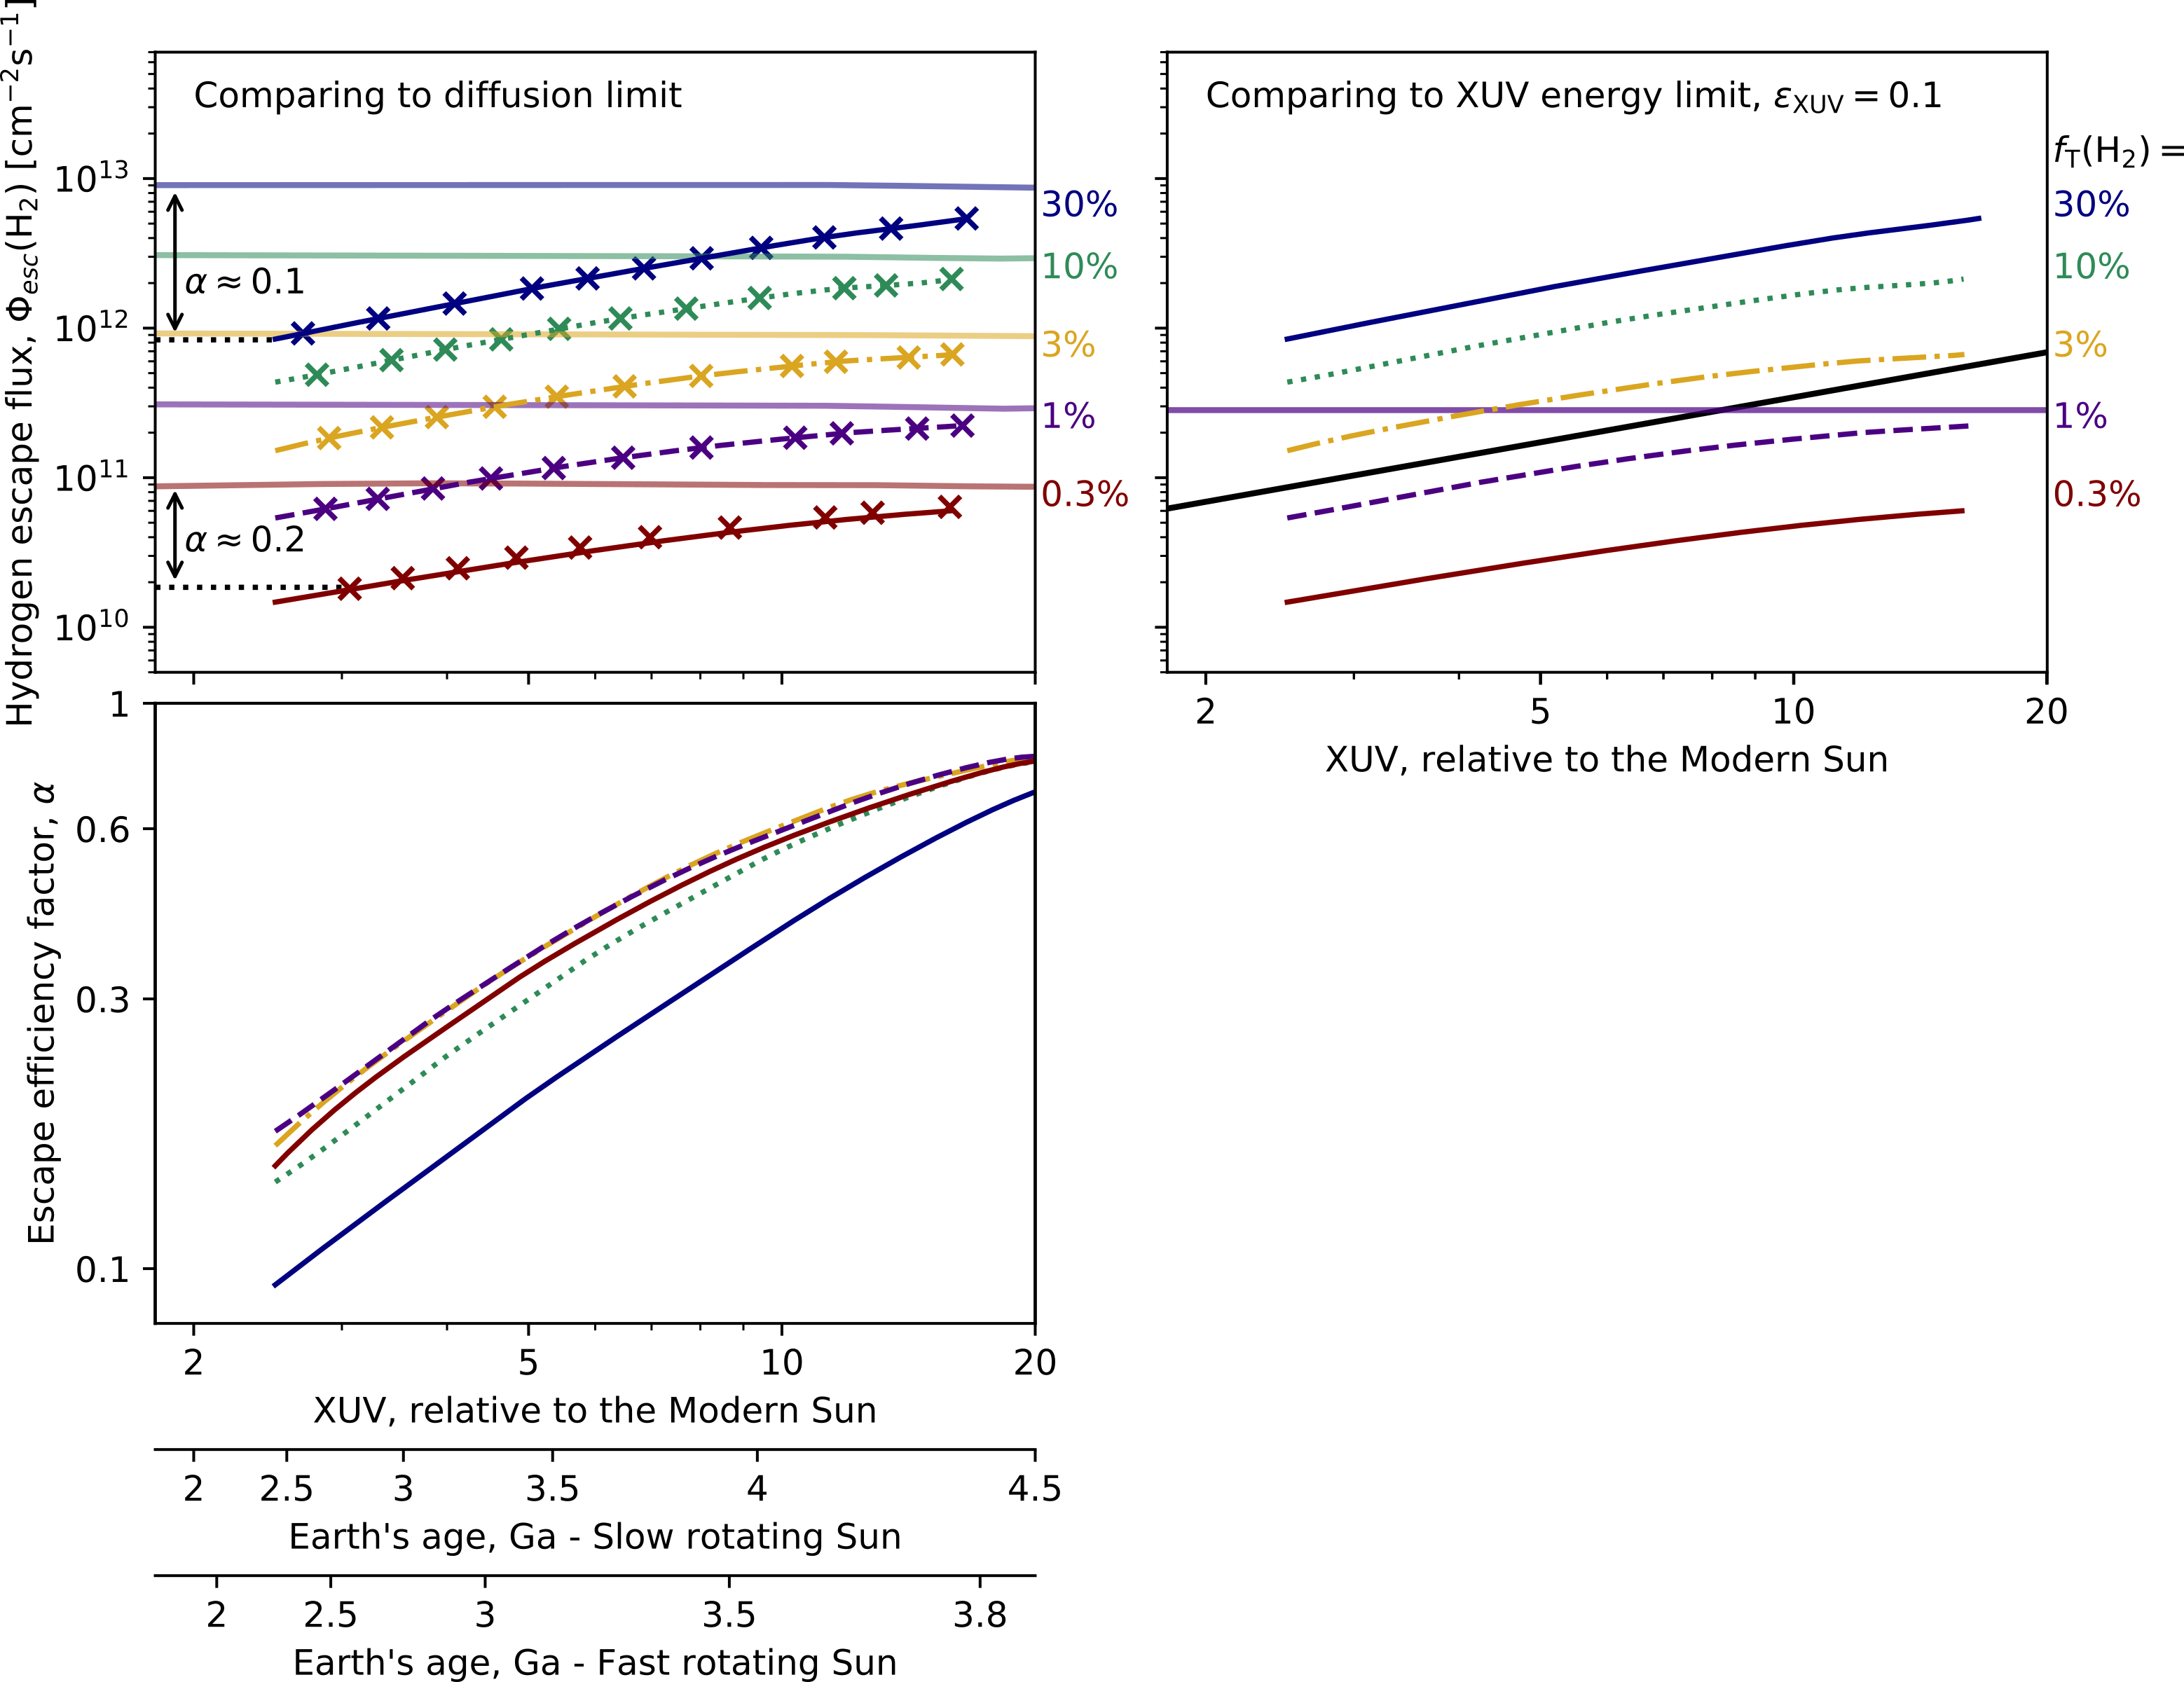
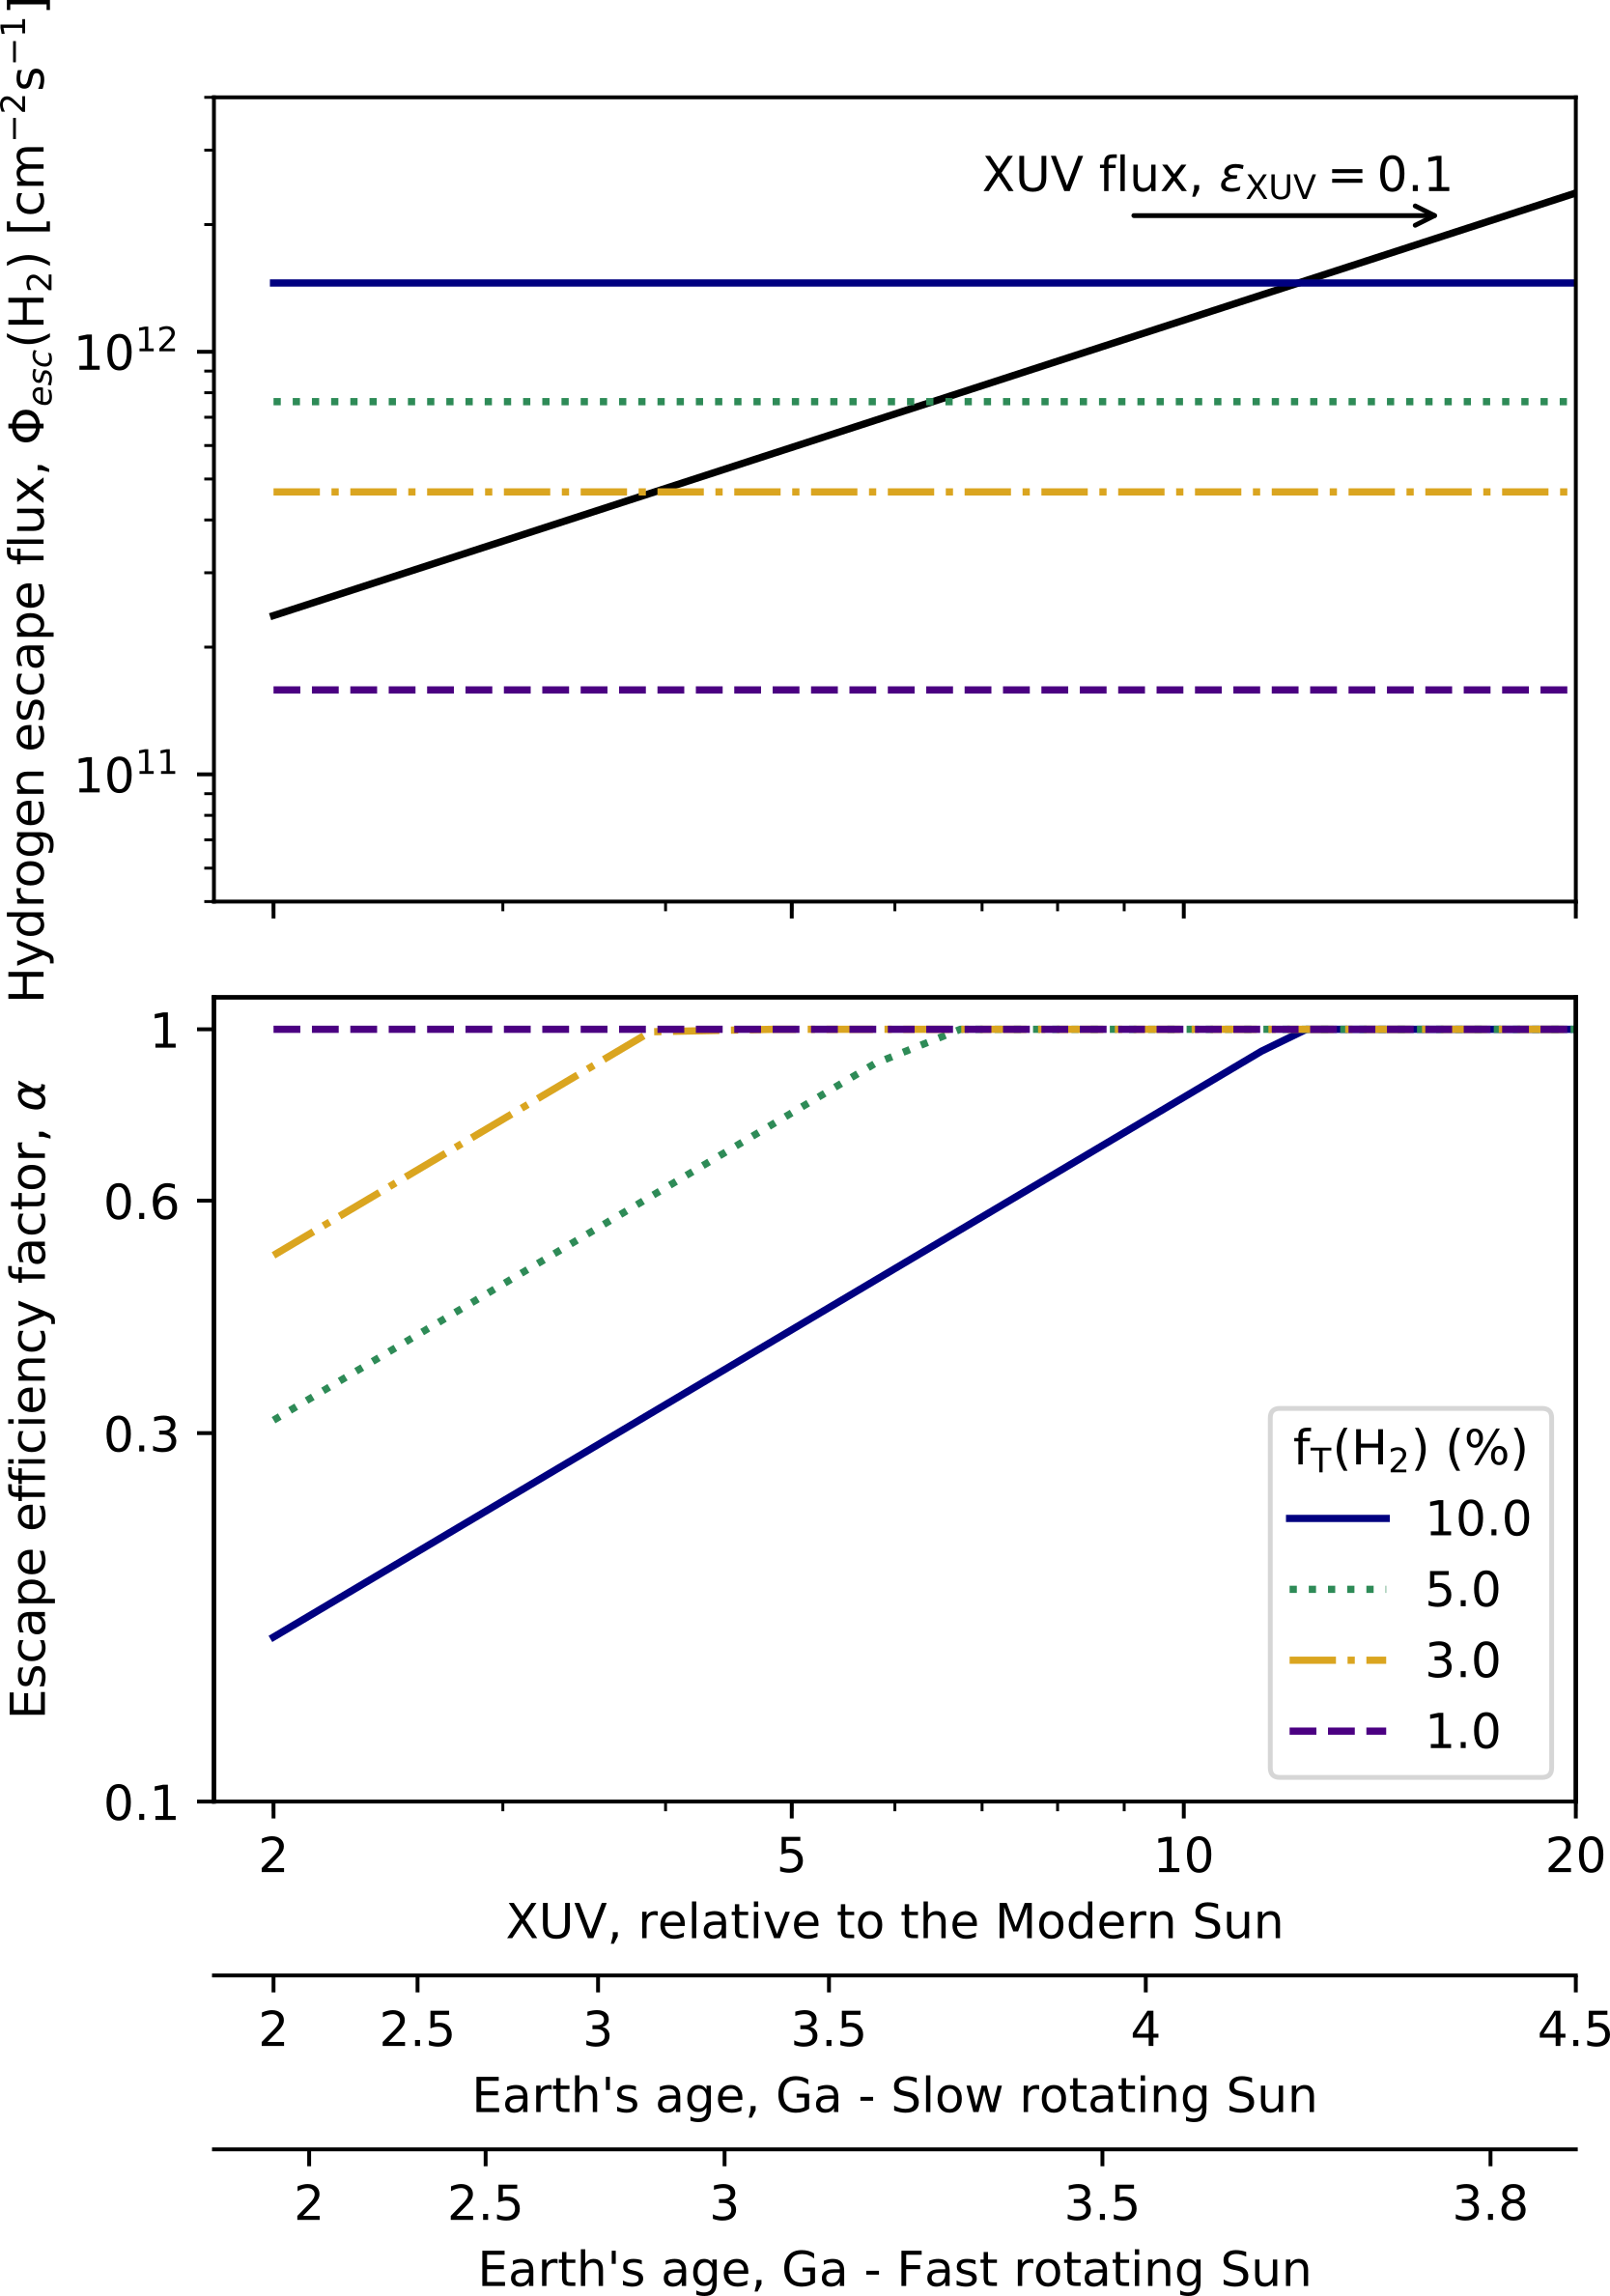
In Fig. 4 the escape flux from the model of Zahnle et al. (2019) is compared to both the diffusion limited escape rate, and an XUV energy-limited rate. Young stars are more active, and therefore emit more XUV radiation earlier in their life-cycles, so the average incident XUV () at 2.5 Ga is thought to be around 2.5-3 today’s, up to 5 -10 modern at 3.5 Ga depending on whether the Sun was a slow or fast rotator early in it’s lifetime (Tu et al., 2015). Higher radiation levels drive higher rates of hydrogen loss above the exobase following the slope of XUV limited escape, until loss starts to asymptote to the diffusion limit, i.e., is limited by supply of \ceH2 to the hydrogen escape region. During the solar cycle today, the XUV flux can vary by up to a factor of 5 between a quiet and active sun; however, this variation occurs on a high frequency 11 year cycle, so has been ignored in preference for an average XUV flux to calculate . is defined as
| (10u) |
which is plotted in Fig. 4, representing a fractional reduction in the escape efficiency from the diffusion limited case. Fig. 4 suggests that a reasonable range for on the early Earth, assuming an of 10 % or less, is 0.2 at 2.5 Ga, and 0.5-0.6 at 3.5 Ga. Comparing these values of to those explored in Fig. 3, suggest that achieving an on the order of 1 % or higher seems implausible for a high pressure degassing scenario on the early Earth, and indicates that an increase in the volcanic flux compared to modern is likely to be necessary even at lower degassing pressures.
7.2 Hydrogen mixing ratios on the Archean Earth
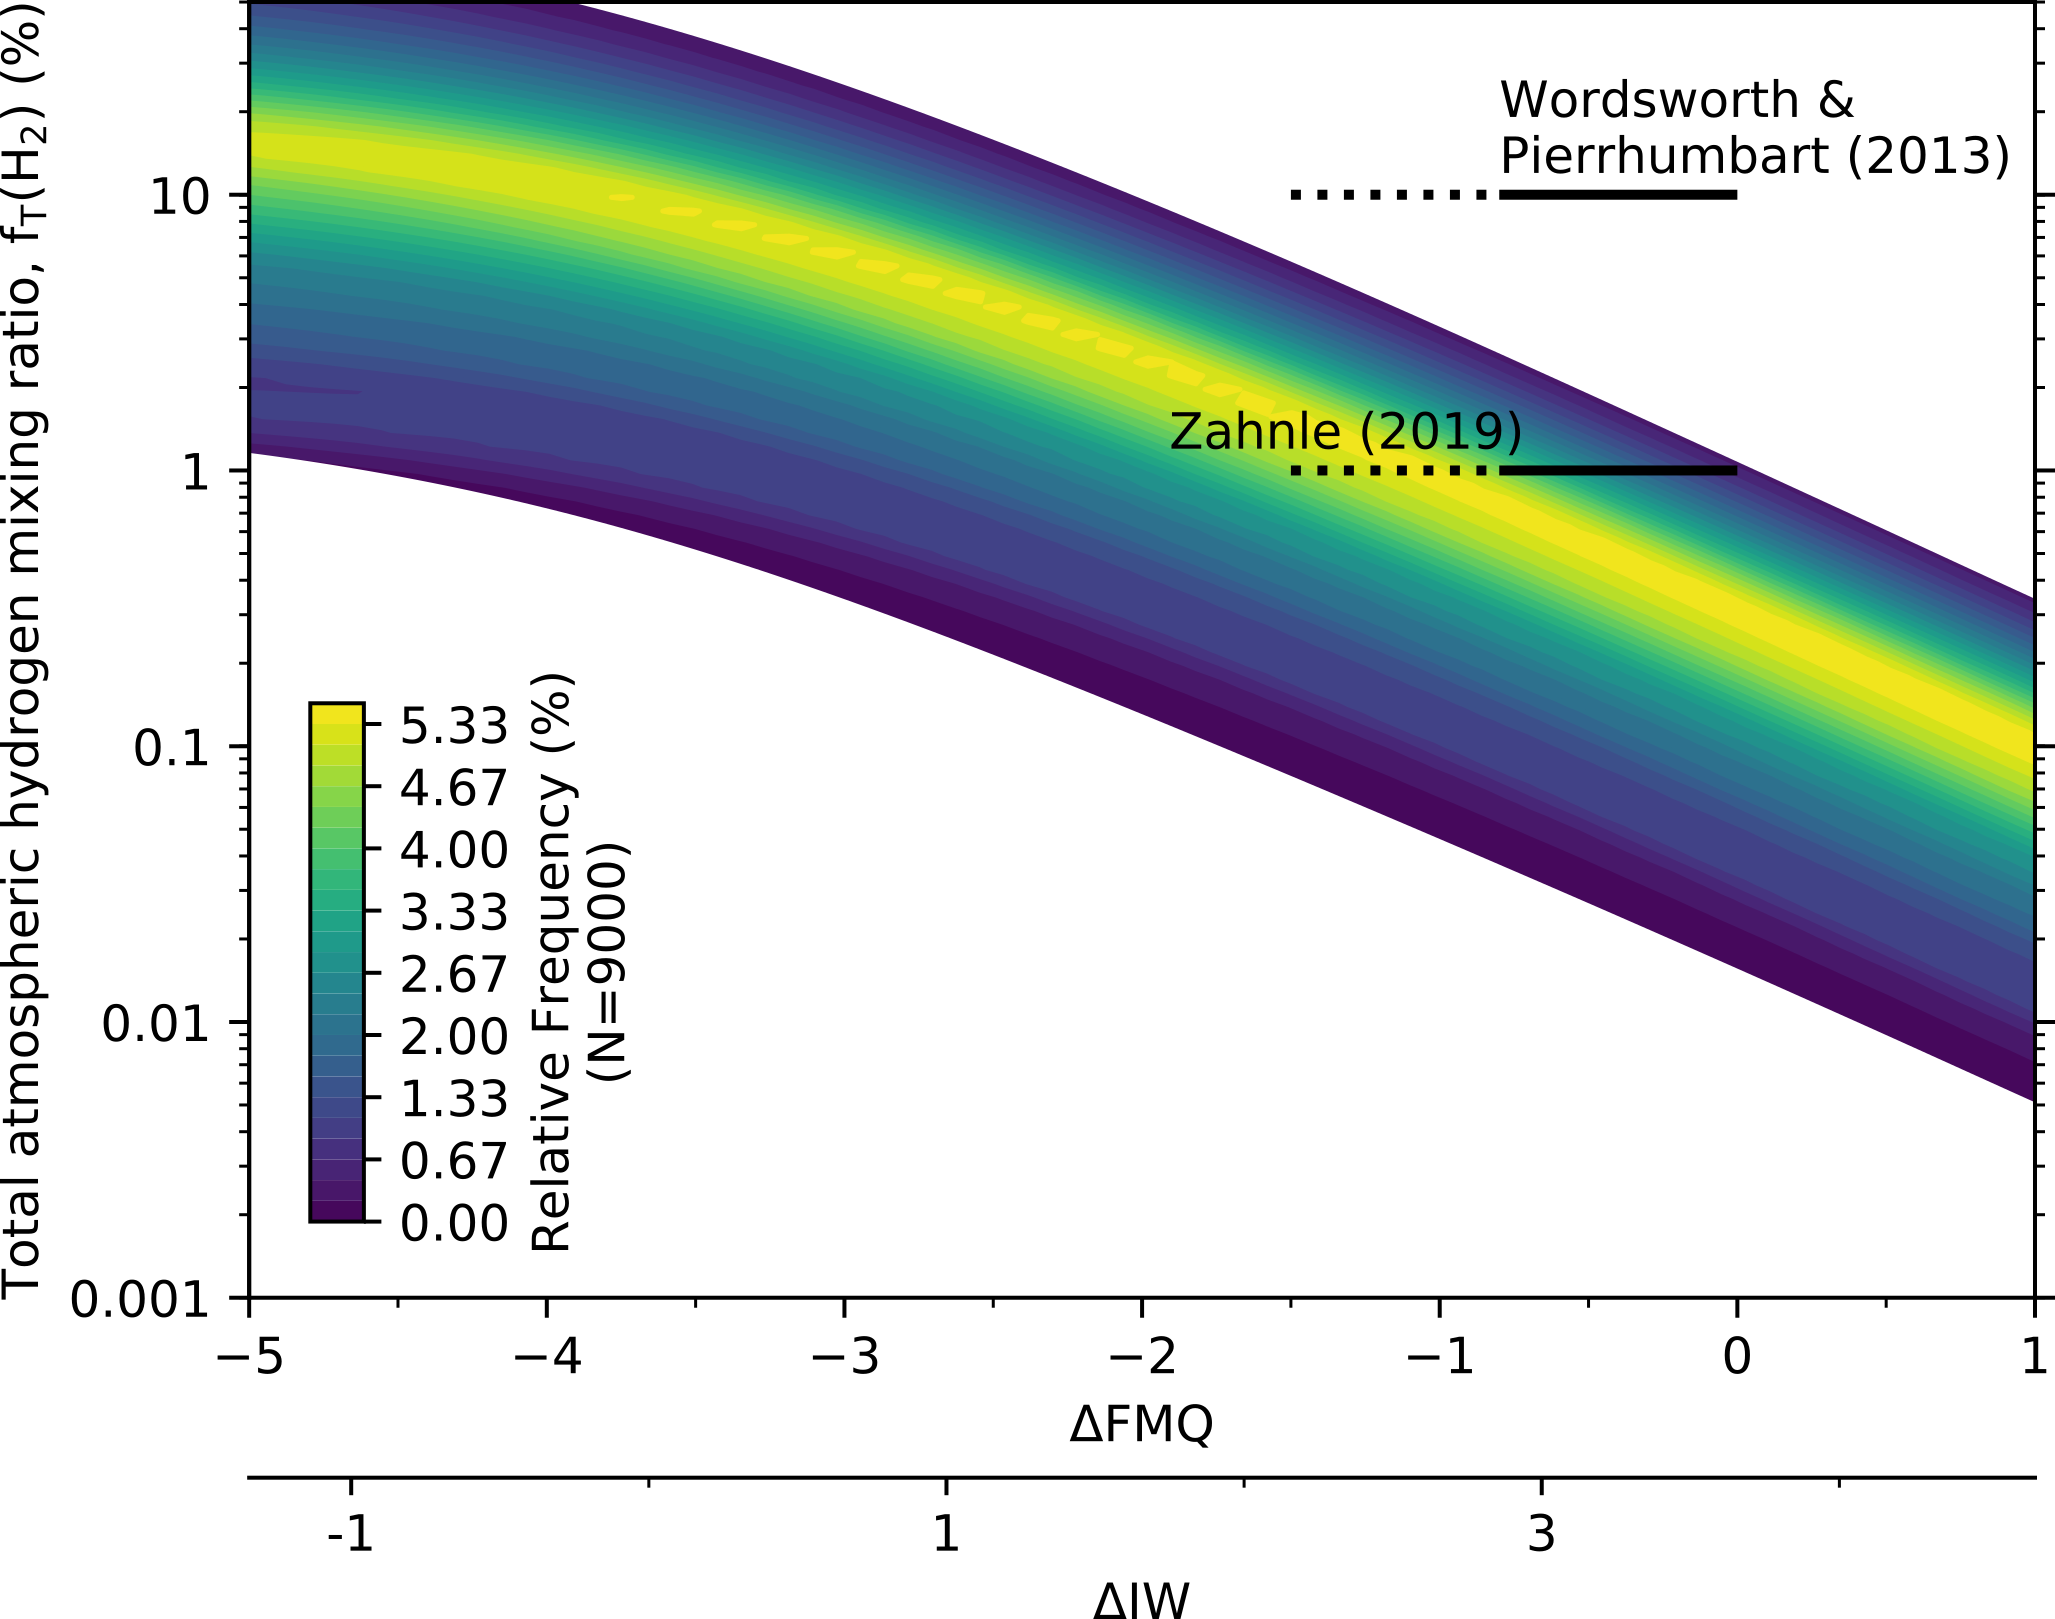
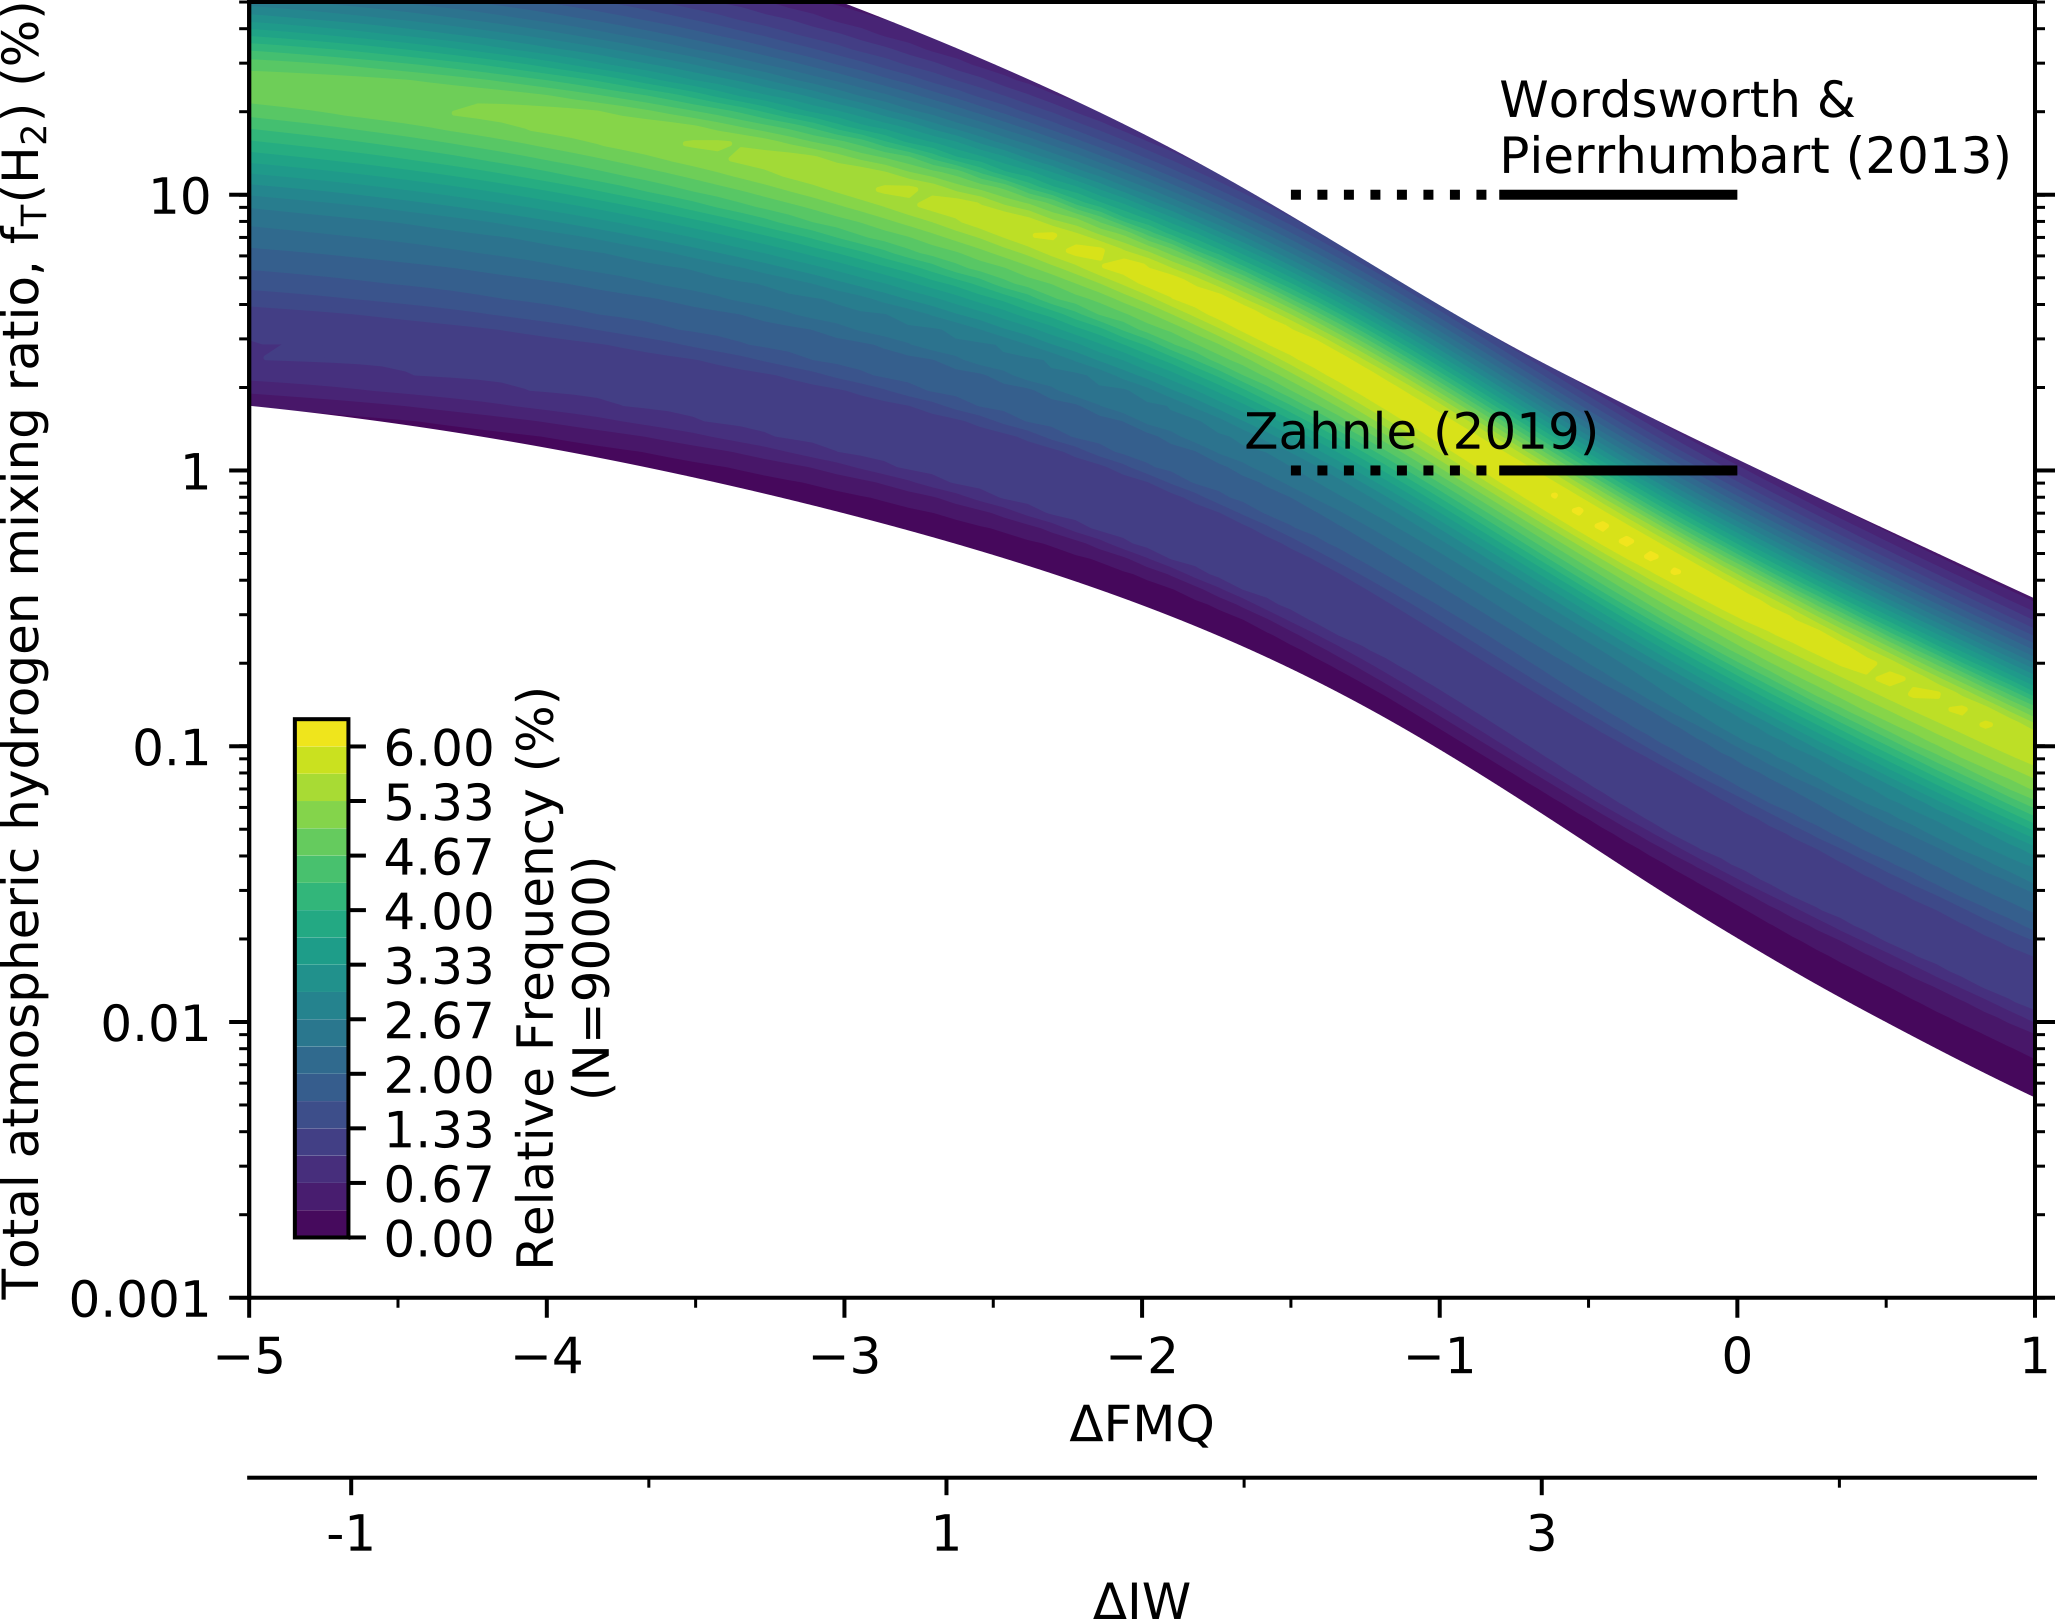
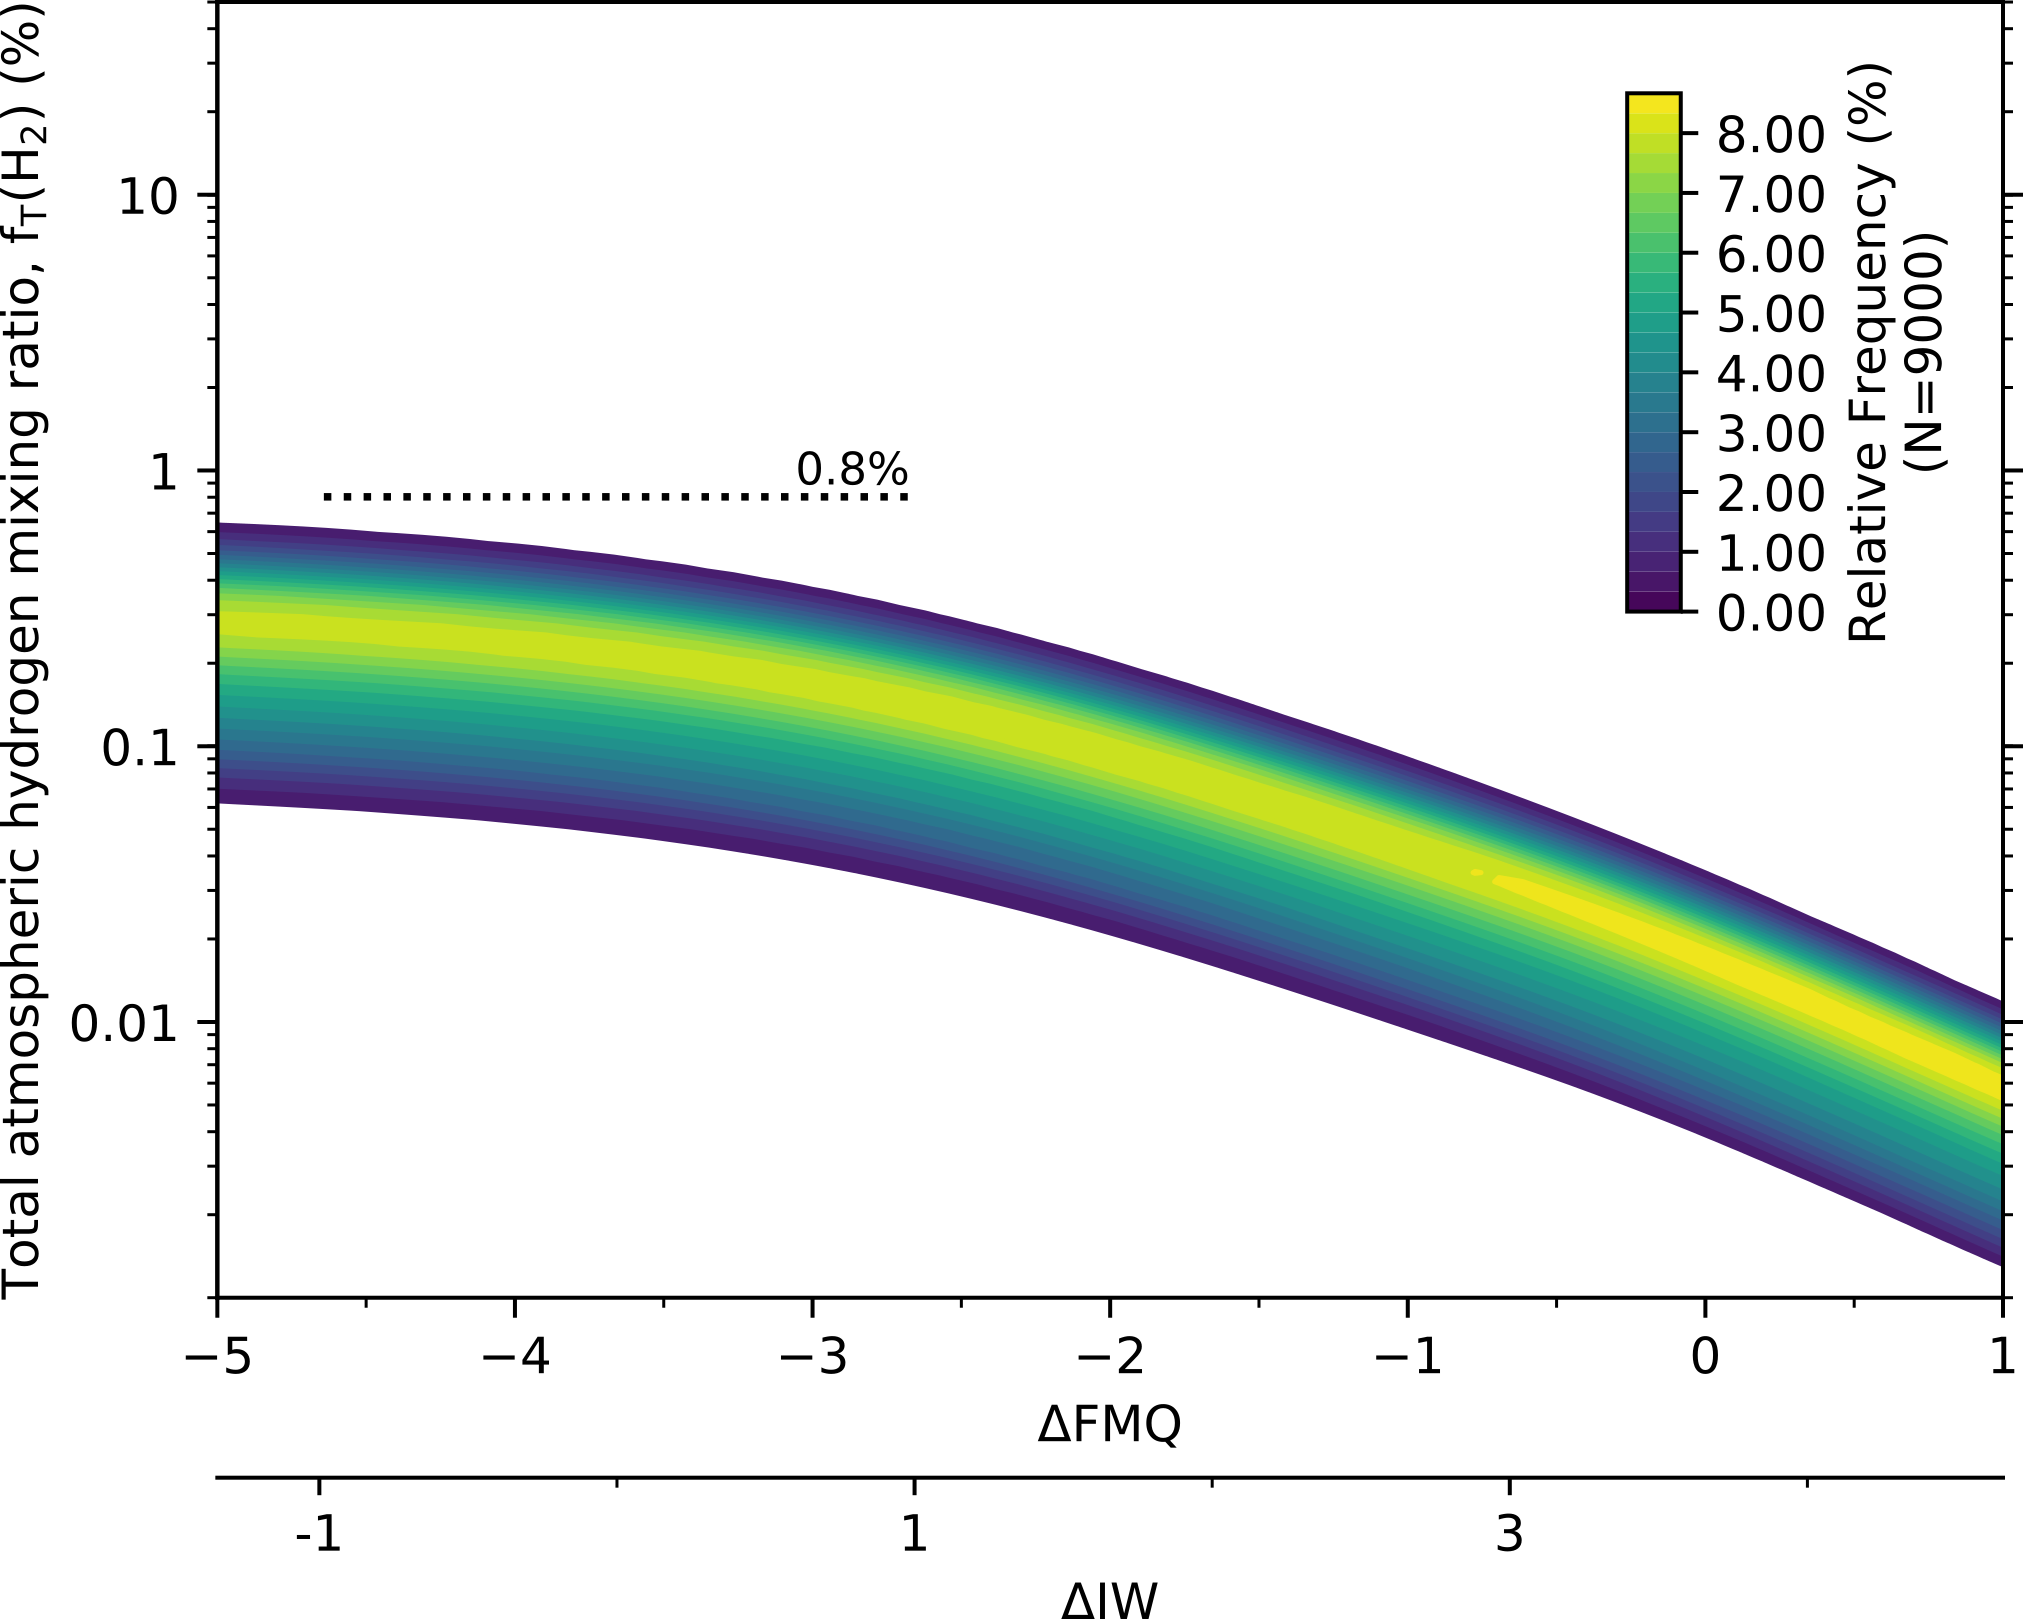
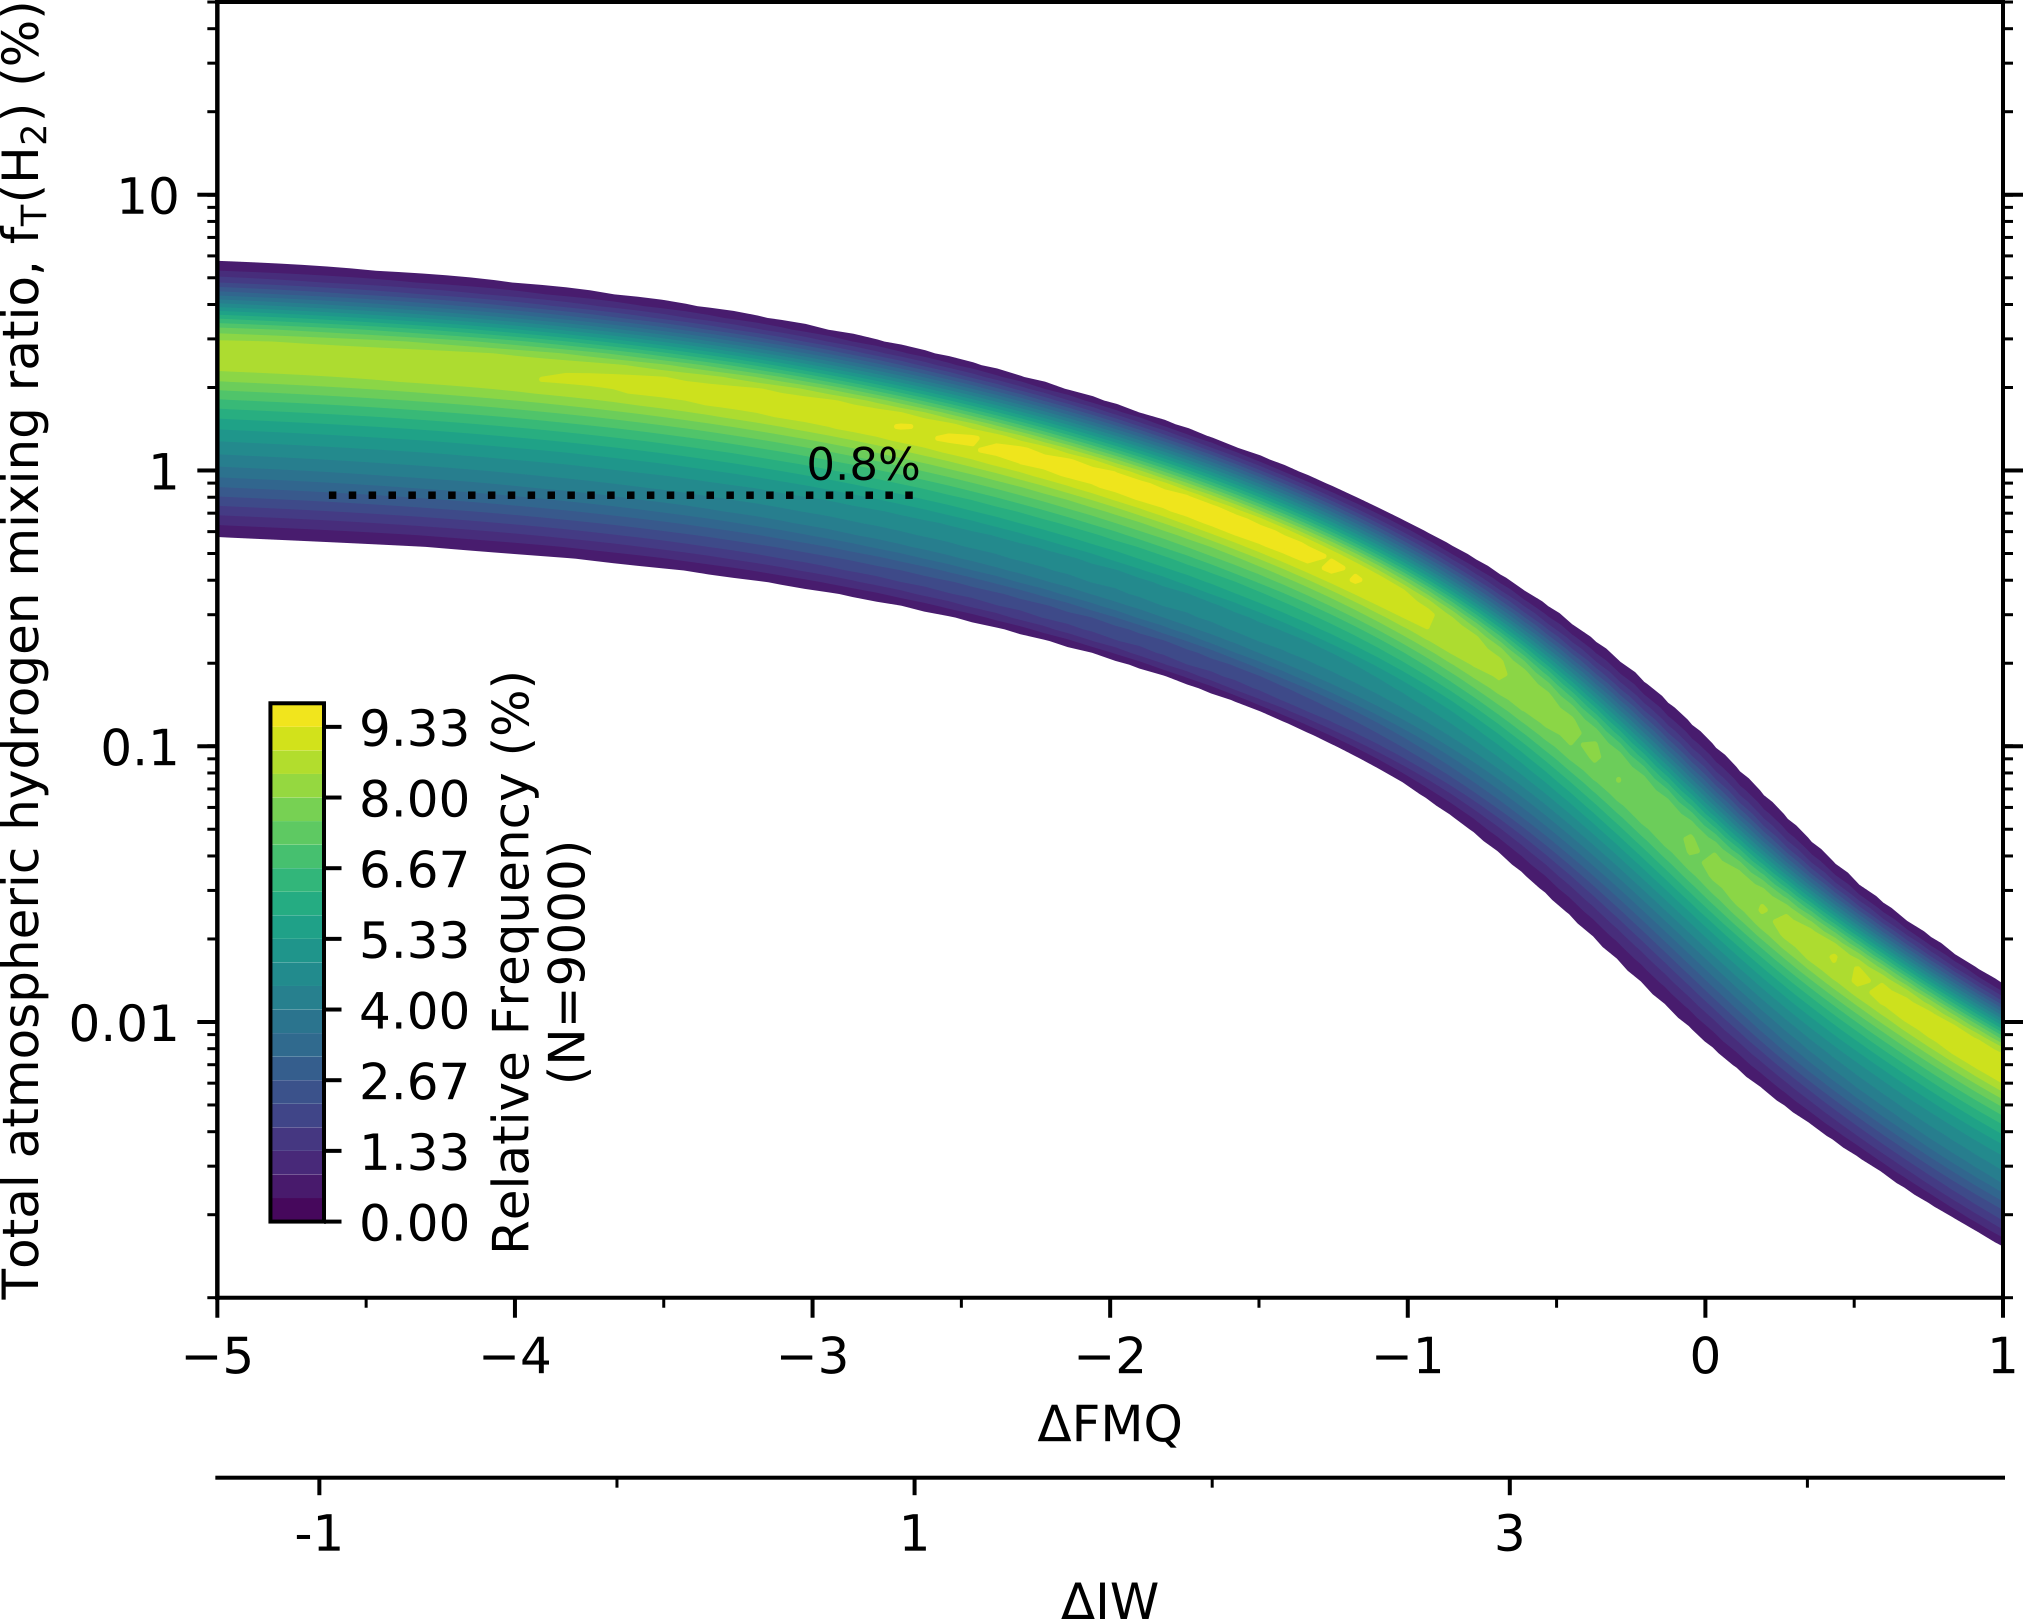
In the previous sections, we have demonstrated that varying both the volcanic flux and the atmospheric loss rate can result in significant variation in atmospheric at a given magmatic , compared to calculated with a modern volcanic flux and . Here, we explore the range of potentially achievable \ceH2 mixing ratios for a planet with similar stellar and volcanic flux parameters to those suggested for the early Earth, examined over a wide range of (Fig. 5).
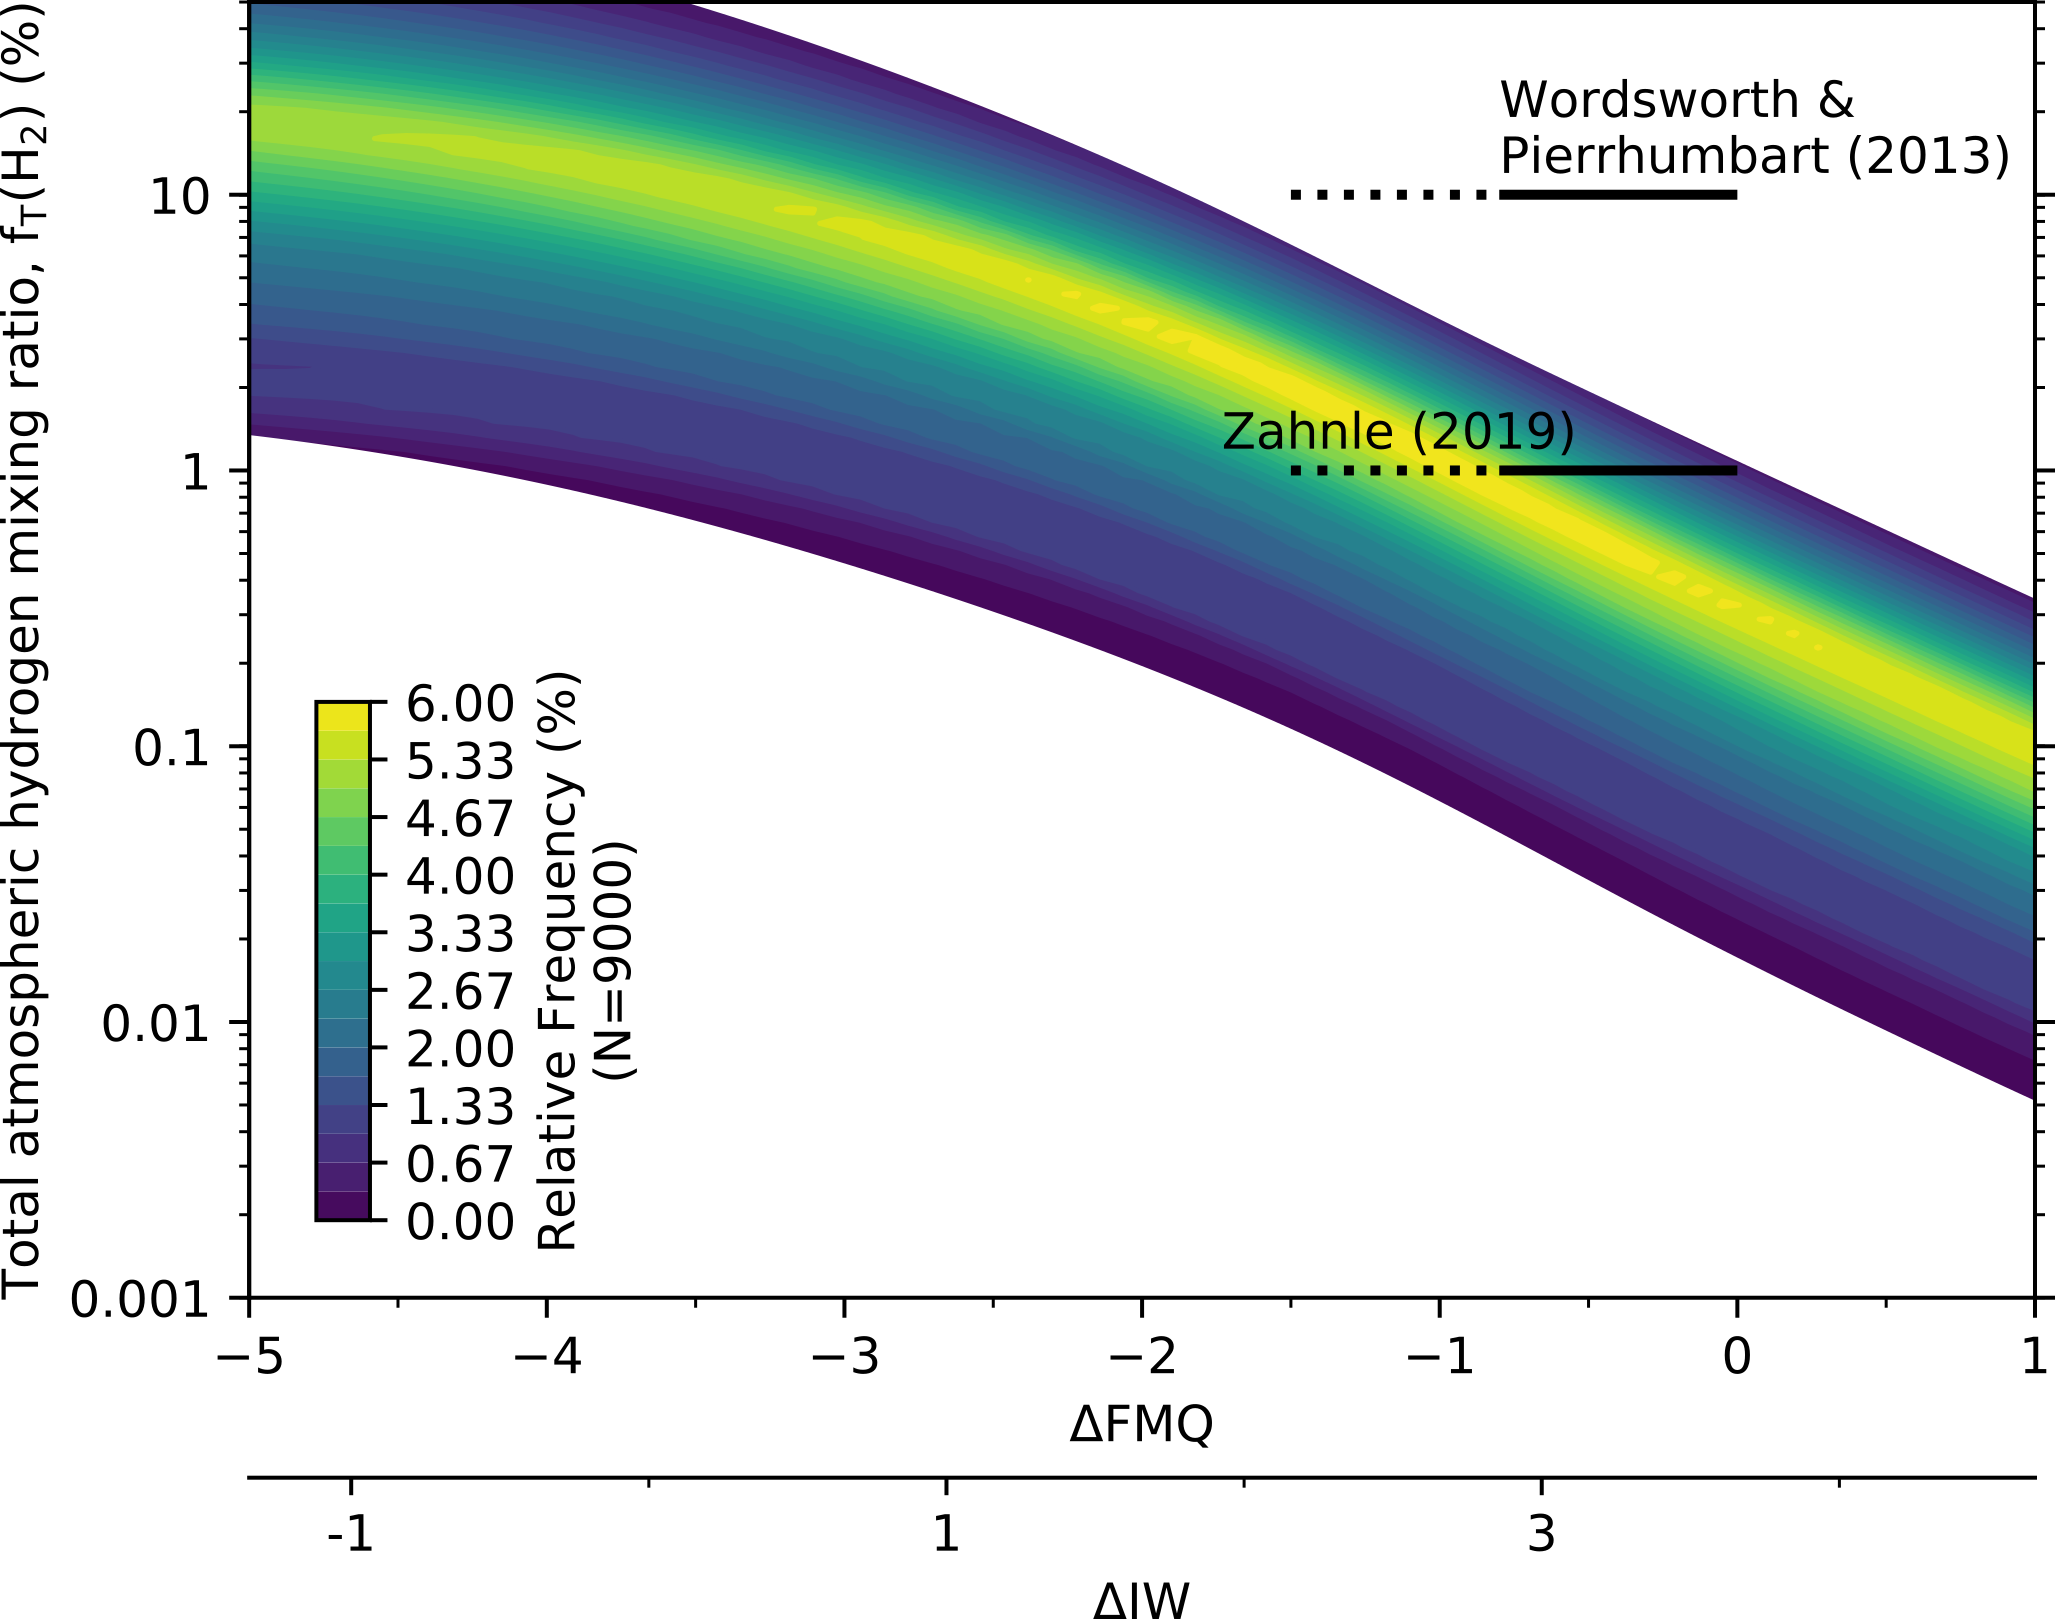
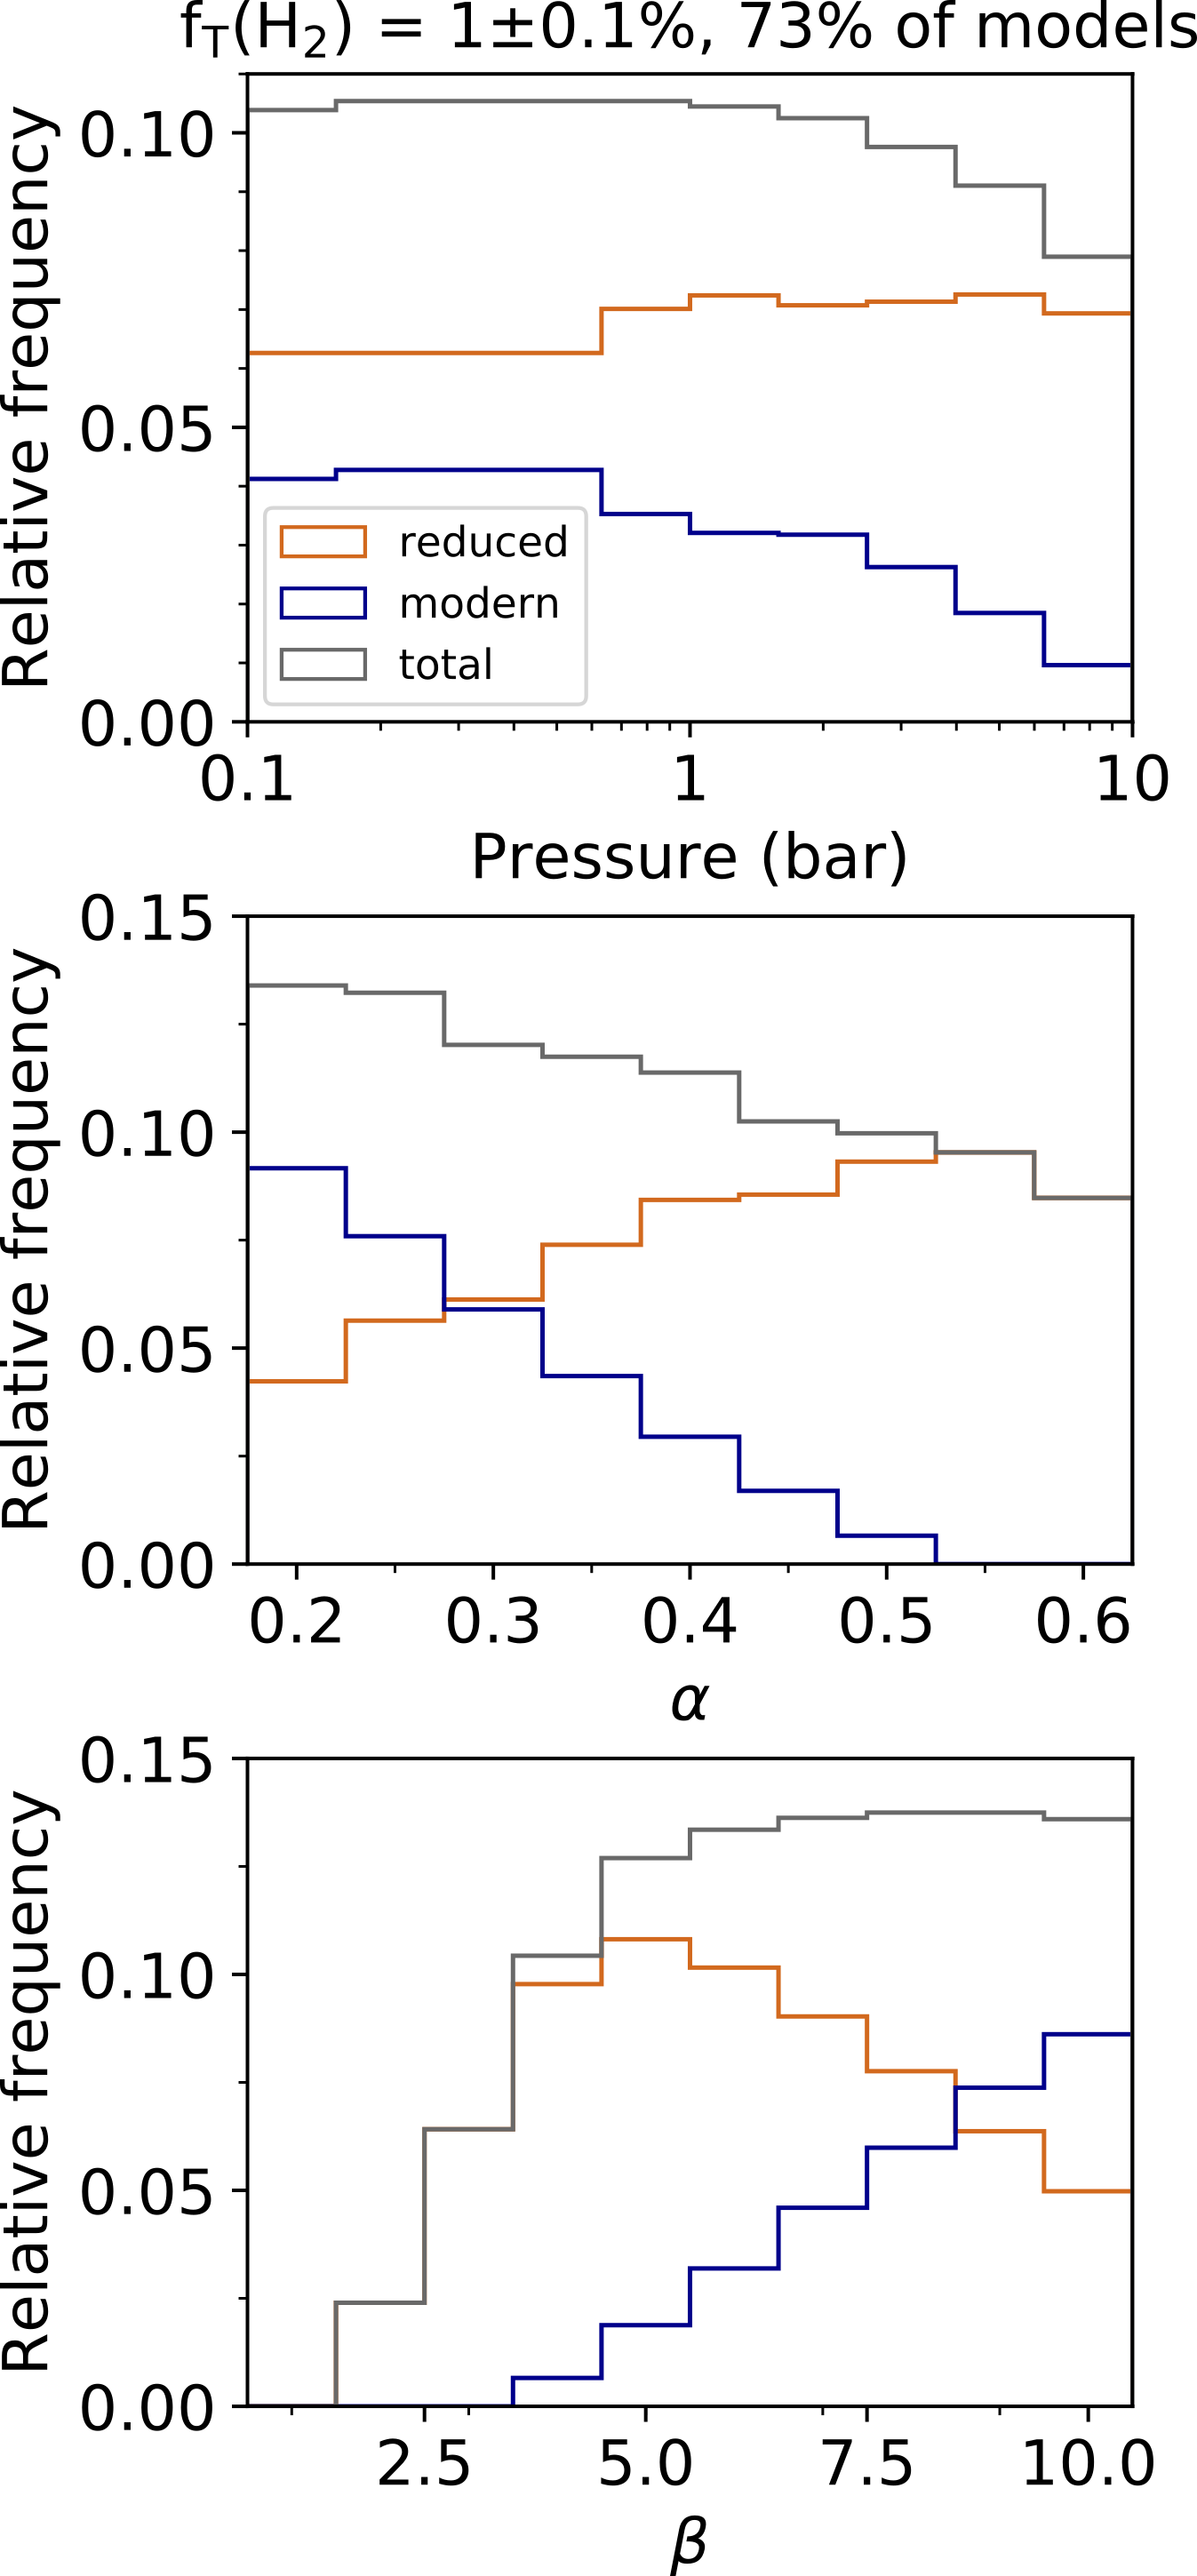
Fig. 5 suggests that for a single value of magma , varying surface pressure, volcanic flux and loss rate over plausible ranges can result in a change in the mixing ratio by around a factor of 100. Assuming an Archean magma between FMQ -1.5 and FMQ, a 2.5-10 increase in solar XUV (and therefore a range for of 0.2-0.6 for an atmosphere with less than 30 % ), a volcanic flux of 1-10 present and a vent pressure of 0.1-10 bar, the range of \ceH2 mixing ratios predicted for the Archean Earth is 0.02 - 7 % \ceH2, with most models falling in the range 0.2 to 3 % (0.18 - 4.5 % accounting for photochemical uncertainty, see B).
Results from Zahnle et al. (2019) have suggested \ceH2 mixing ratios on the early Earth of 1 %. Our parameter sweep shows that this can be achieved with a magmatic within the range proposed for the Archean, and with only a weak dependence on degassing pressure and a moderate dependence on volcanic flux and loss rate (Fig. 5(b)). Our results also show the trade offs between parameters which achieve this fit to = 1 %. Assuming an similar to modern, the number of model runs which achieve 1 % decreases with increasing pressure, strongly decreases as increases with no runs above , and increases when ; no model runs within the modern range meet =1 % using the modern value of . For a more reduced melt, the trends are more or less reversed, with a peak in model frequencies at around 5. The peak in the frequency distribution (Fig. 5) falls between FMQ -0.8 and FMQ -1, with a bias to the reduced range. Our model indicates that 1 % , which Zahnle et al. (2019) posit Xenon isotope fractionation is indicative of, is easily achievable for the early Earth (Fig. 5) with 73 % of models obtaining 1 % within Earth’s mantle range.
Wordsworth and Pierrehumbert (2013) suggest that for an Archean atmosphere with \ceCO2 levels similar to modern, 10 % \ceH2 and 3 modern \ceN2 would be needed to raise the surface temperature above freezing, given the faint young sun. However within our parameter ranges, 10 % cannot be achieved (Fig. 5). We therefore suggest that without alternative sources of \ceH2, or a large increase in the \ceN2 and \ceCO2/\ceCH4 atmospheric partial pressures compared to modern, it is unlikely that sufficient \ceH2-enhanced greenhouse warming was occurring to raise Archean surface temperatures above freezing.
7.3 Alternative \ceH2 sources on the early Earth
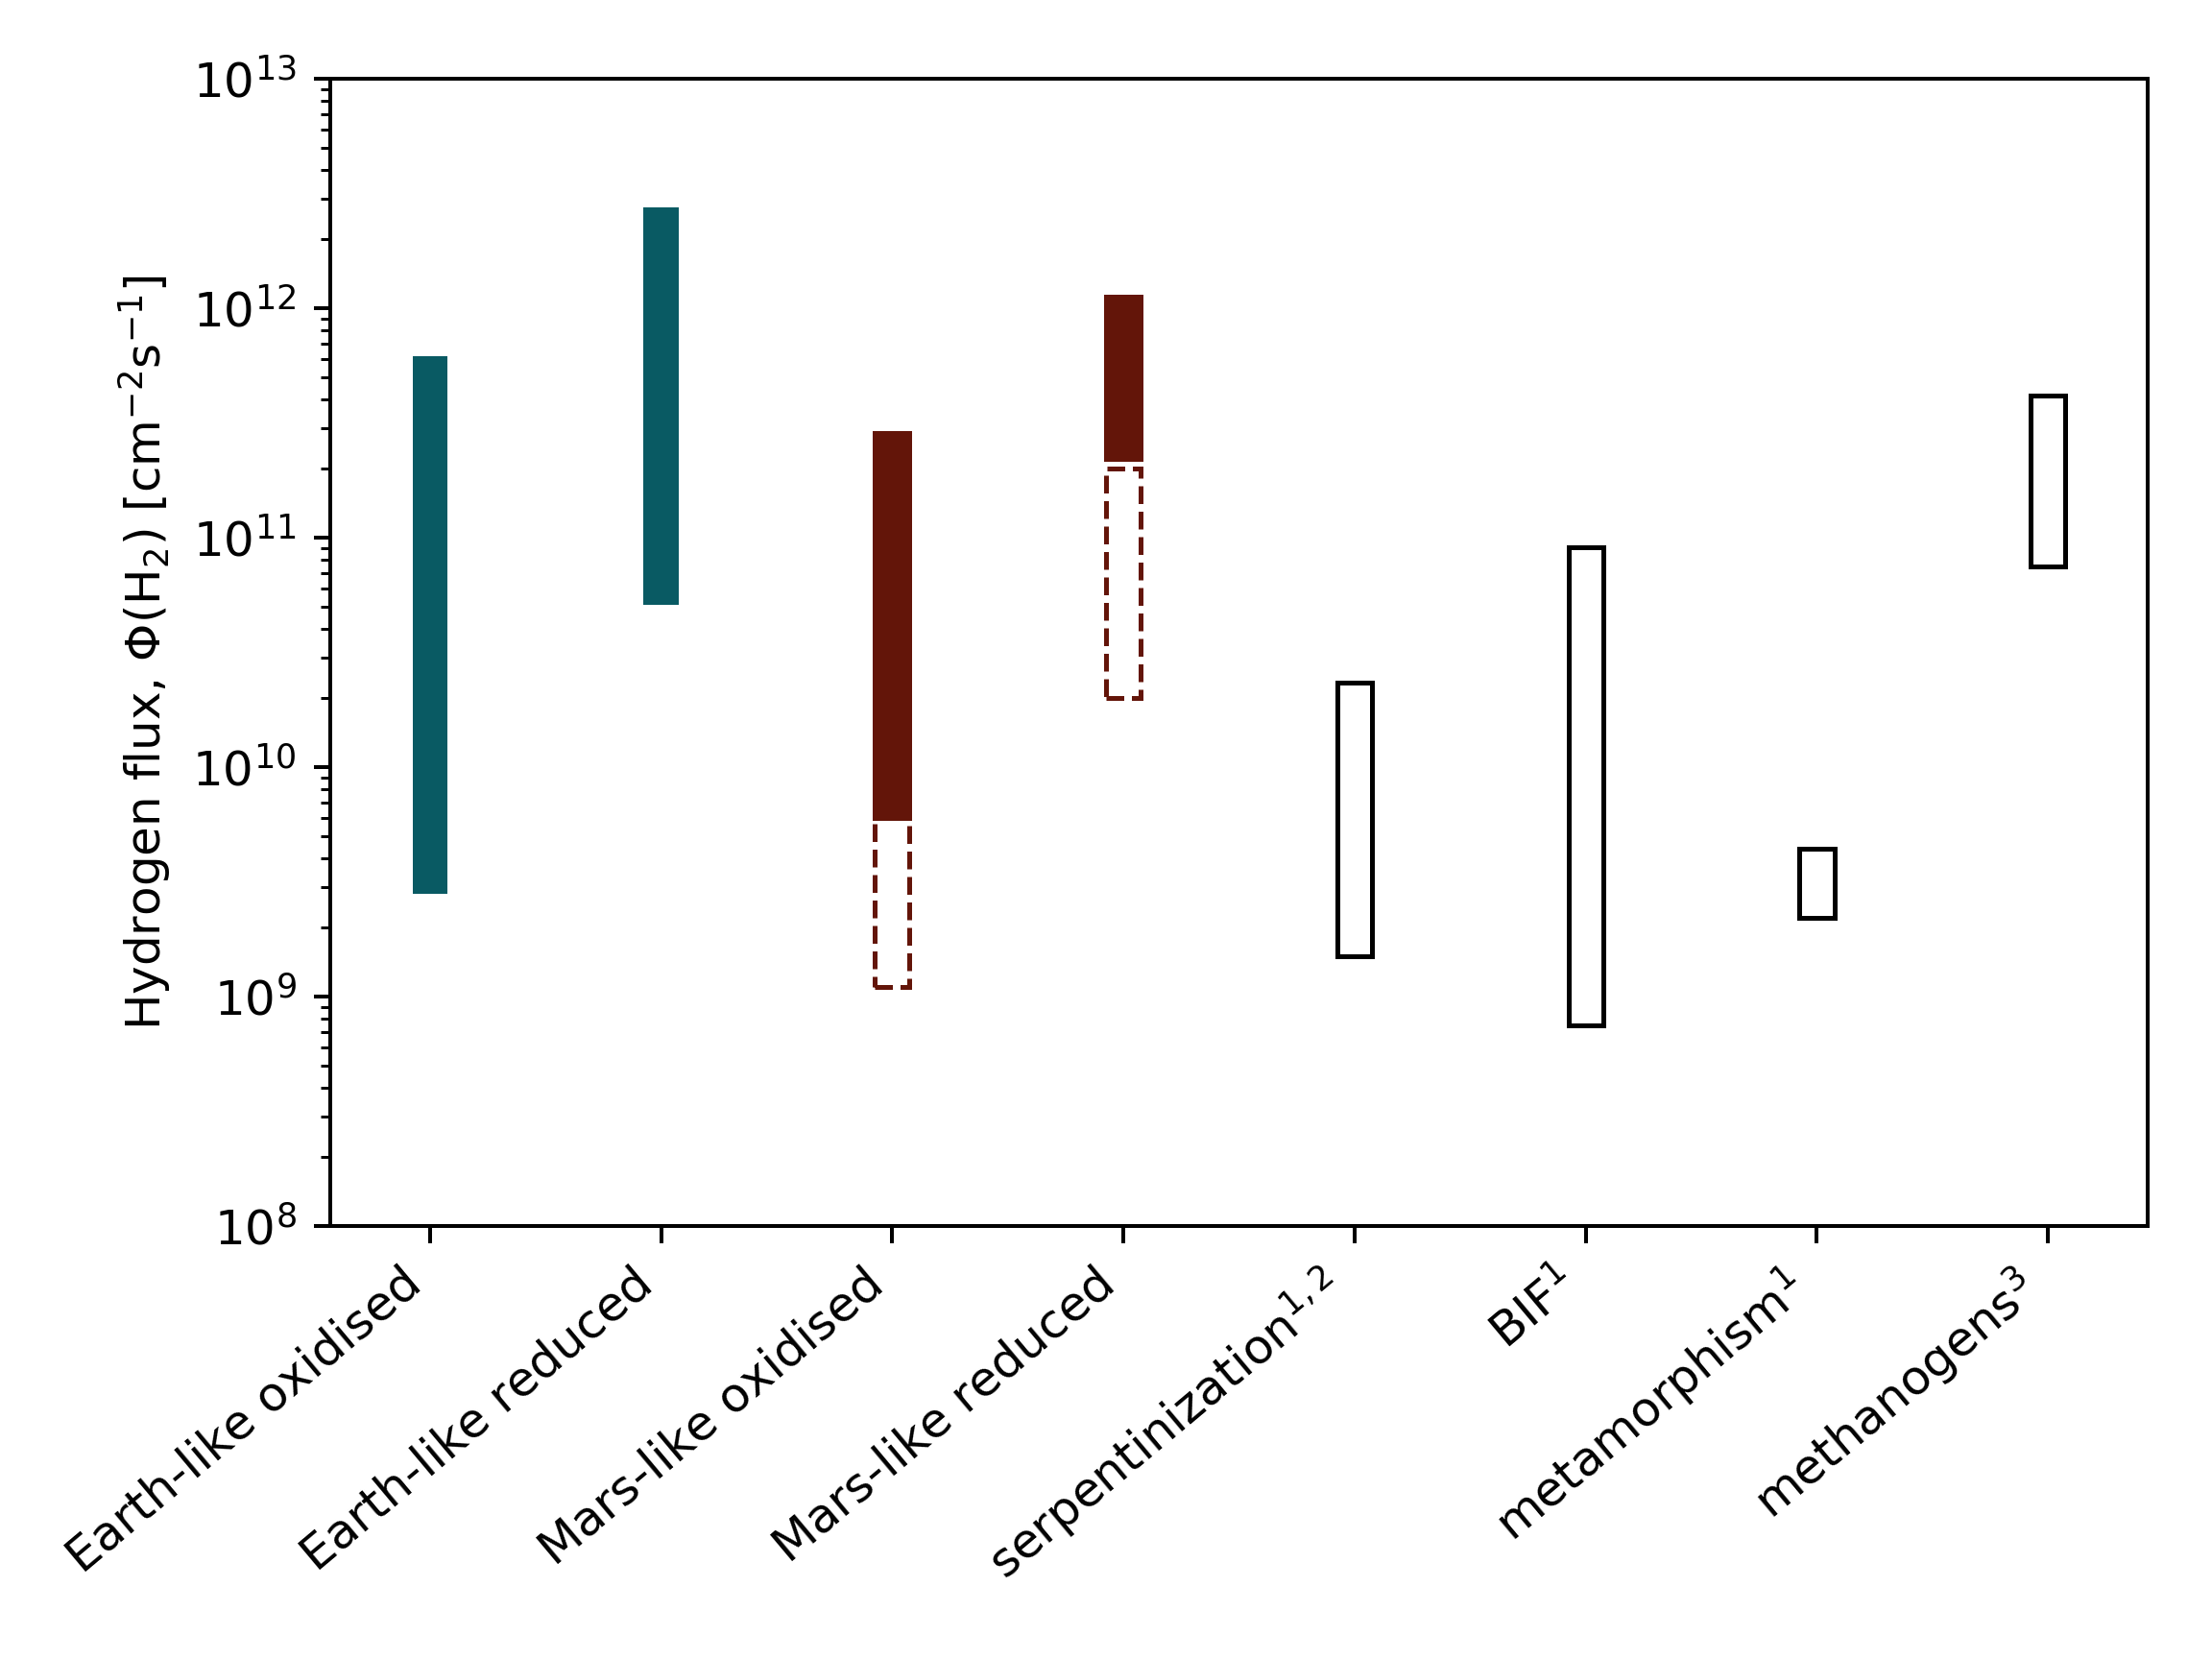
Our calculations so far have assumed that volcanic emissions are the only source of \ceH2 to the atmosphere in the Archean. However, while it may be true that the volcanic flux is likely to be the largest steady \ceH2 input, there are several other sources which may have contributed to the global \ceH2 budget, summarised in Fig. 6.
A particularly large source of uncertainty comes from the sources and sinks of hydrogen introduced by adding life into the model considerations. Kharecha et al. (2005) and Haqq-Misra et al. (2008) have suggested that up to 1000 ppmv \ceCH4 could be sustained by methanogenic biota in the late Archean. The \ceH2 flux this methane production is equivalent to, makes methanogens a potentially equal contributor to volcanism (at high volcanic fluxes) in sustaining atmospheric \ceH2. Methanogens could therefore potentially significantly increase both the total input of hydrogen to the atmosphere and therefore the . However, adding methanogens also produces a sink of hydrogen in the form of organic carbon burial, potentially between to molecules (Kasting, 2013). Although this is a fairly low flux compared to \ceH2 sources, it could become significant in cases where the volcanic hydrogen flux is low. Despite the important supply of \ceH2 life can provide to an atmosphere, methanogens of course cannot contribute to either a greenhouse atmosphere in a prebiotic system, nor to generating a reducing atmosphere required for prebiotic chemistry. If \ceH2 atmospheres are needed at this early stage of Earth’s history, other sources must be considered.
Other geological sources of hydrogen include the serpentinization of mafic and ultramafic oceanic crust, metamorphic outgassing, and release of \ceH2 during the formation of banded iron deposits (Kasting, 2013). Not included in Fig. 6 is the flux of hydrogen which could be delivered by a large impactor. This has been excluded as an impactor would provide a point source of hydrogen decaying over time, rather than a long-term steady flux, making this a significantly different proposition in comparison to other long term \ceH2 fluxes. However, the scale of the flux, a single point injection of possibly mols (assuming injection over the course of a year, this would be a point flux of molecules for a year; Zahnle et al., 2019), means that impactors could be important for transient high levels of hydrogen in the atmosphere.
8 Atmospheric Warming of Early Mars
At 3.8-3.6 Ga (during the Noachian period), Mars’ climate appears to have been warm enough to sustain liquid water at the surface (e.g., Hoke et al., 2011). However, a pure \ceCO2 Martian atmosphere provides insufficient warming under a faint young sun (Forget et al., 2013). To address this, Hayworth et al. (2020) suggest that a range of \ceH2 contents of 5 - 8%, in 1.2 to 3 bar \ceCO2 atmospheres, could be sufficient to deglaciate the Martian surface in a cyclical manner. We therefore perform a similar parameter sweep to that conducted above for Earth, adjusted to be suitable for an early Mars-like planet, to assess the plausibility of this occurring given volcanic constraints. Here we compare 8 % in a 1.25 bar atmosphere to the results of a parameter sweep similar to that conducted above. We account for the different scale height and diffusion rate of the Martian atmosphere by using a ratio taken from Ramirez et al. (2014), of cms-1, which applies for a homopause temperature of 160 K. Using values relevant to 3.8-3.6 Ga and accounting for the decay in XUV flux with orbital distance (irrandience at Mars is 36-53% weaker than at 1 AU Thiemann et al., 2017), the incident XUV flux at Mars would have been be in the range 2.2 - 9 that of the modern Earth, giving a similar range in to those used for Earth (see Fig. 4; Tu et al., 2015). We therefore adopt the same range of alpha as used above, accepting that the XUV flux might have a significantly different effect on the escape rate of Mars compared to Earth, with the escape rate possibly being much higher (and therefore a larger value of alpha closer to 1) after scaling for Mars’ lower gravity.
We account for the different scale height and diffusion rate of the Martian atmosphere by using a ratio taken from Ramirez et al. (2014), of cms-1, which applies for a homopause temperature of 160 K. Although the XUV flux at Mars is 36-53% weaker than at 1 AU (Thiemann et al., 2017), at 3.6-3.8 Ga the solar XUV flux is approximately double that of the period modelled for Earth. Both of these factors conspire to decrease the difference between the diffusion and energy limited flux regimes on Mars at the relevant time period, leading to increased . By comparing the diffusion limited flux with XUV-limited escape using Eq.10t and , we plot in Fig 7.
If we assume that the \ceH2 loss rate proceeds exactly at the XUV limited rate until it intersects the diffusion limit (Fig. 7), for the period 3.8-3.6 Ga would only be 1 when %, with the greatest reduction below the diffusion limit being =0.6 for = 10 %. However, this is not quite accurate; the true \ceH2 loss rate is likely to drop below the XUV limit as the flux asymptotes towards the diffusion limit, prolonging the period where = 0.7 - 0.9 beyond that seen in Fig. 7 (see Fig 4). We therefore use a range of 0.6 - 1 for in Fig. 8.
The volcanic fluxes considered are 0.5-2 the modern Earth, in keeping with the idea that the heat flux in the Noachian was probably similar to the modern Earth’s (Ramirez et al., 2014; Batalha et al., 2015). On this basis, we consider that the volume of magma reaching the surface per unit area should therefore be similar. However, this assumption relies on similar magmatic volatile contents between the two planets, and the primary volatile contents of early Martian magmas are very poorly constrained. Estimates of the pre-eruptive water contents of Martian magmas have ranged from nearly anhydrous through to around 2 wt % based on analysis of the SNC meteorites (e.g., McSween et al., 2001; Usui et al., 2012; McCubbin et al., 2012; Filiberto et al., 2016b), which sample magmas which were erupted at 2 Ga (Nyquist et al., 2009). While differences in analytical technique may explain some of this variation, there are a large number of unknowns for Mars which could contribute to this uncertainty, including the extent of volatile recycling (e.g., Magna et al., 2015; Batalha et al., 2015), heterogeneous distributions of water in the mantle (McCubbin et al., 2016), the potential for volatile enrichment in magmas via crustal assimilation (McCubbin et al., 2016), and the evolution of mantle (and therefore magmatic) water contents through time (e.g., Filiberto et al., 2016a).
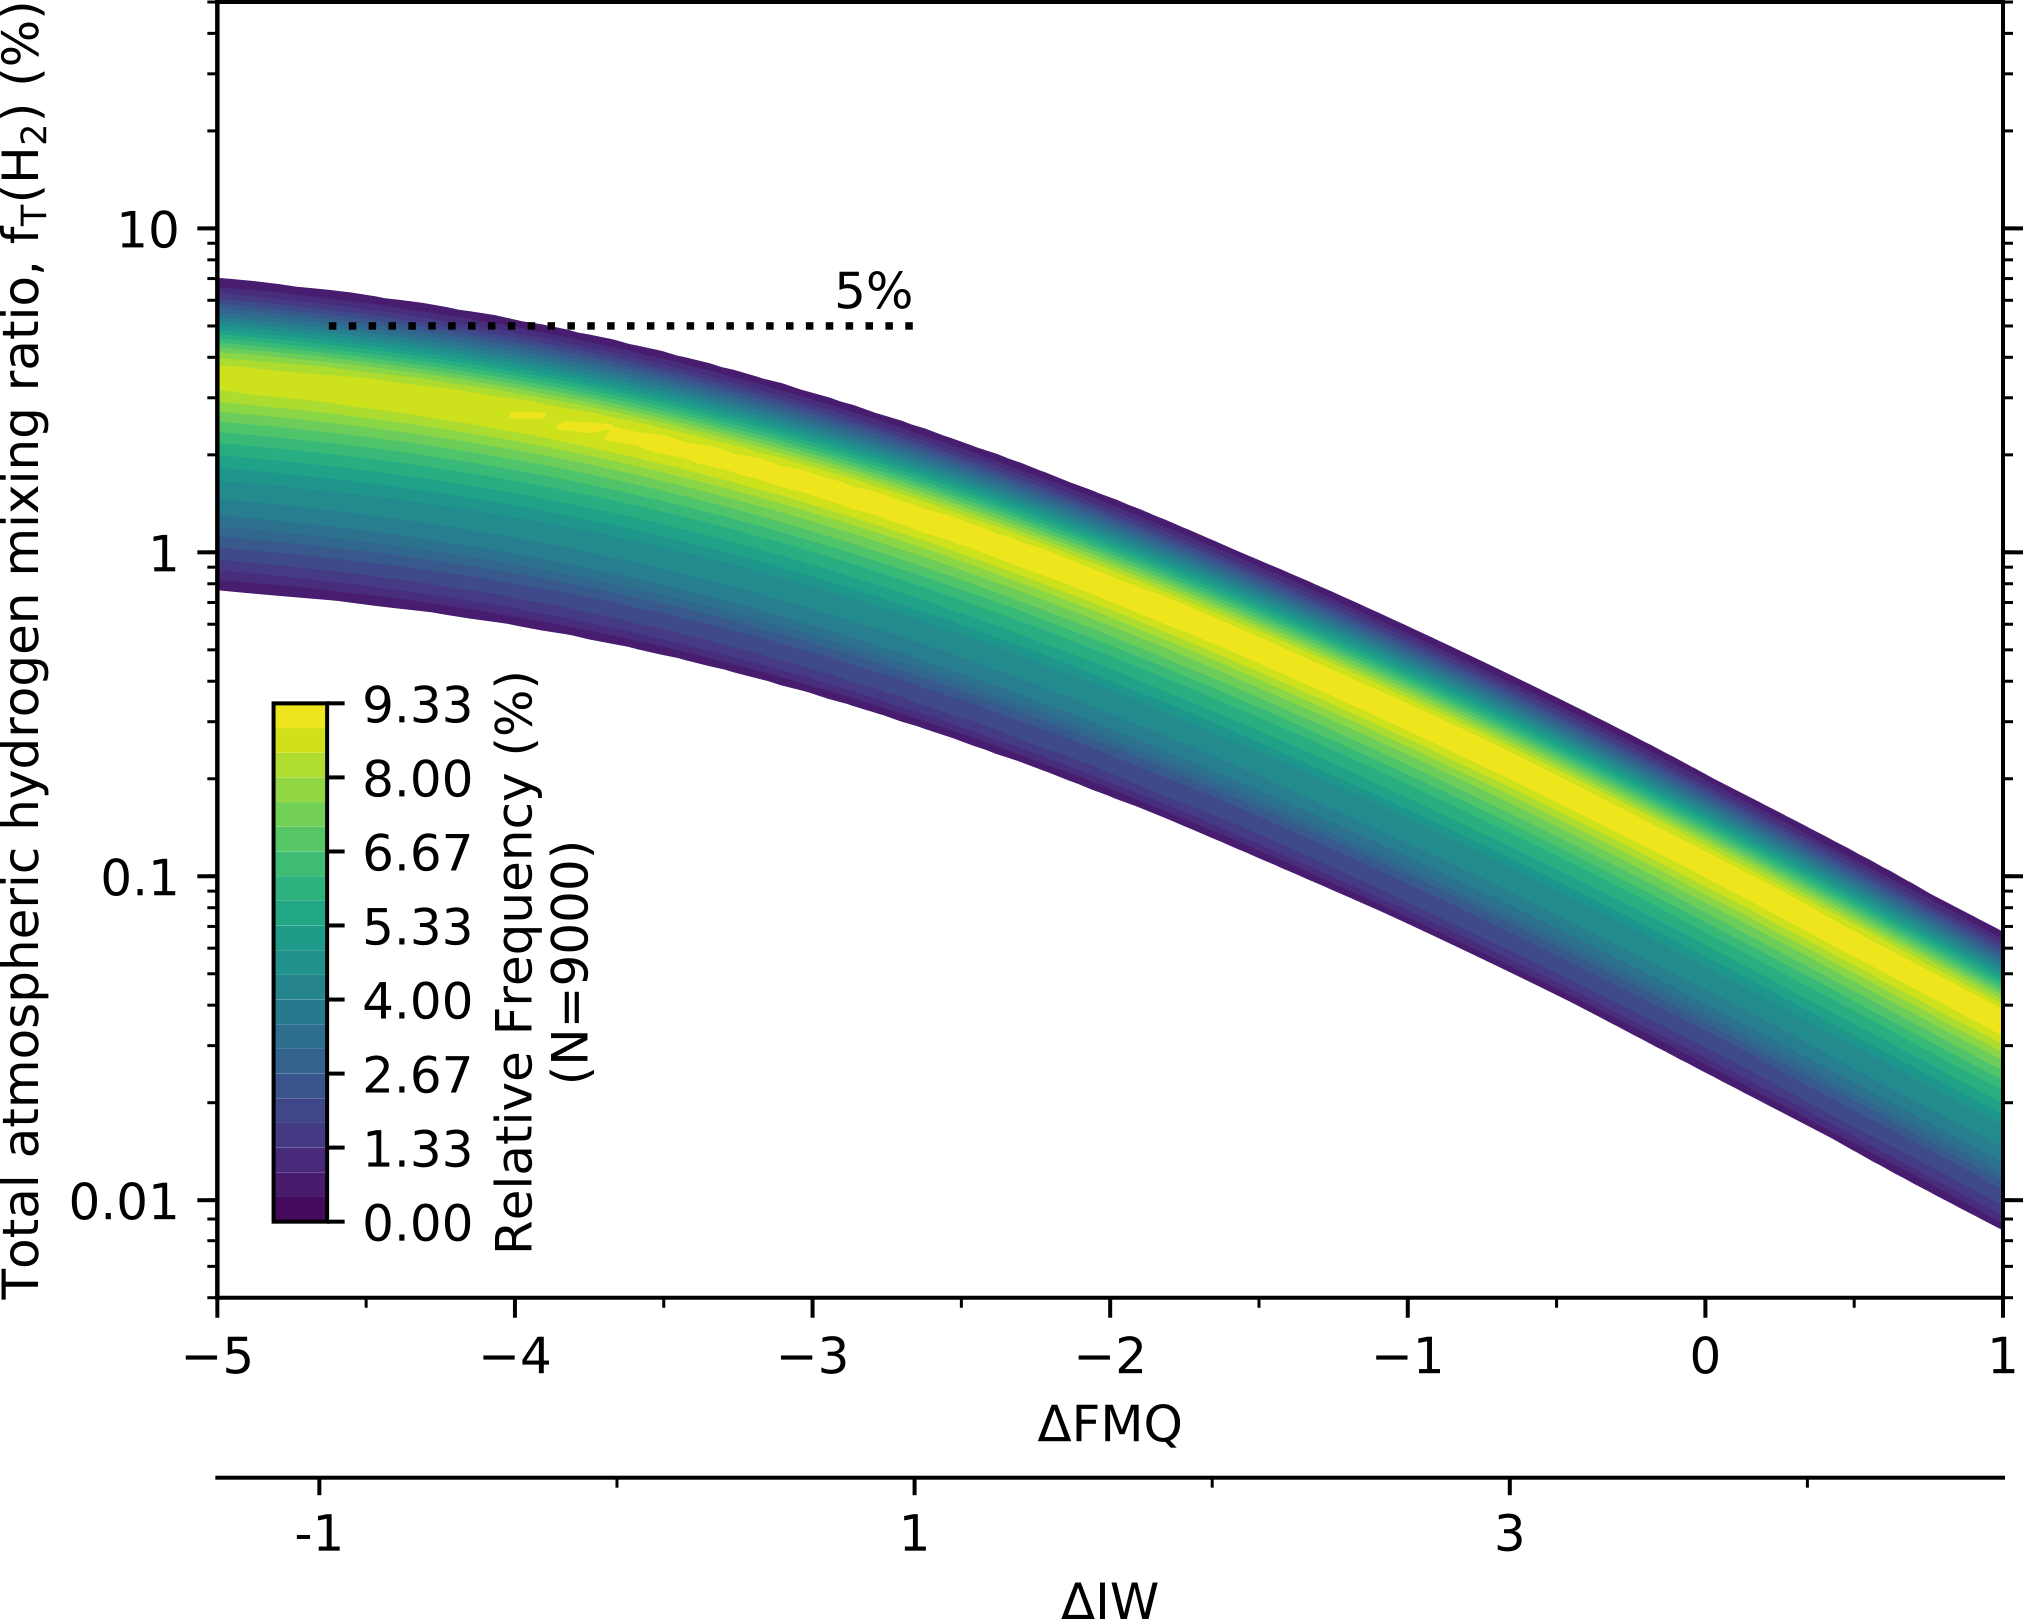
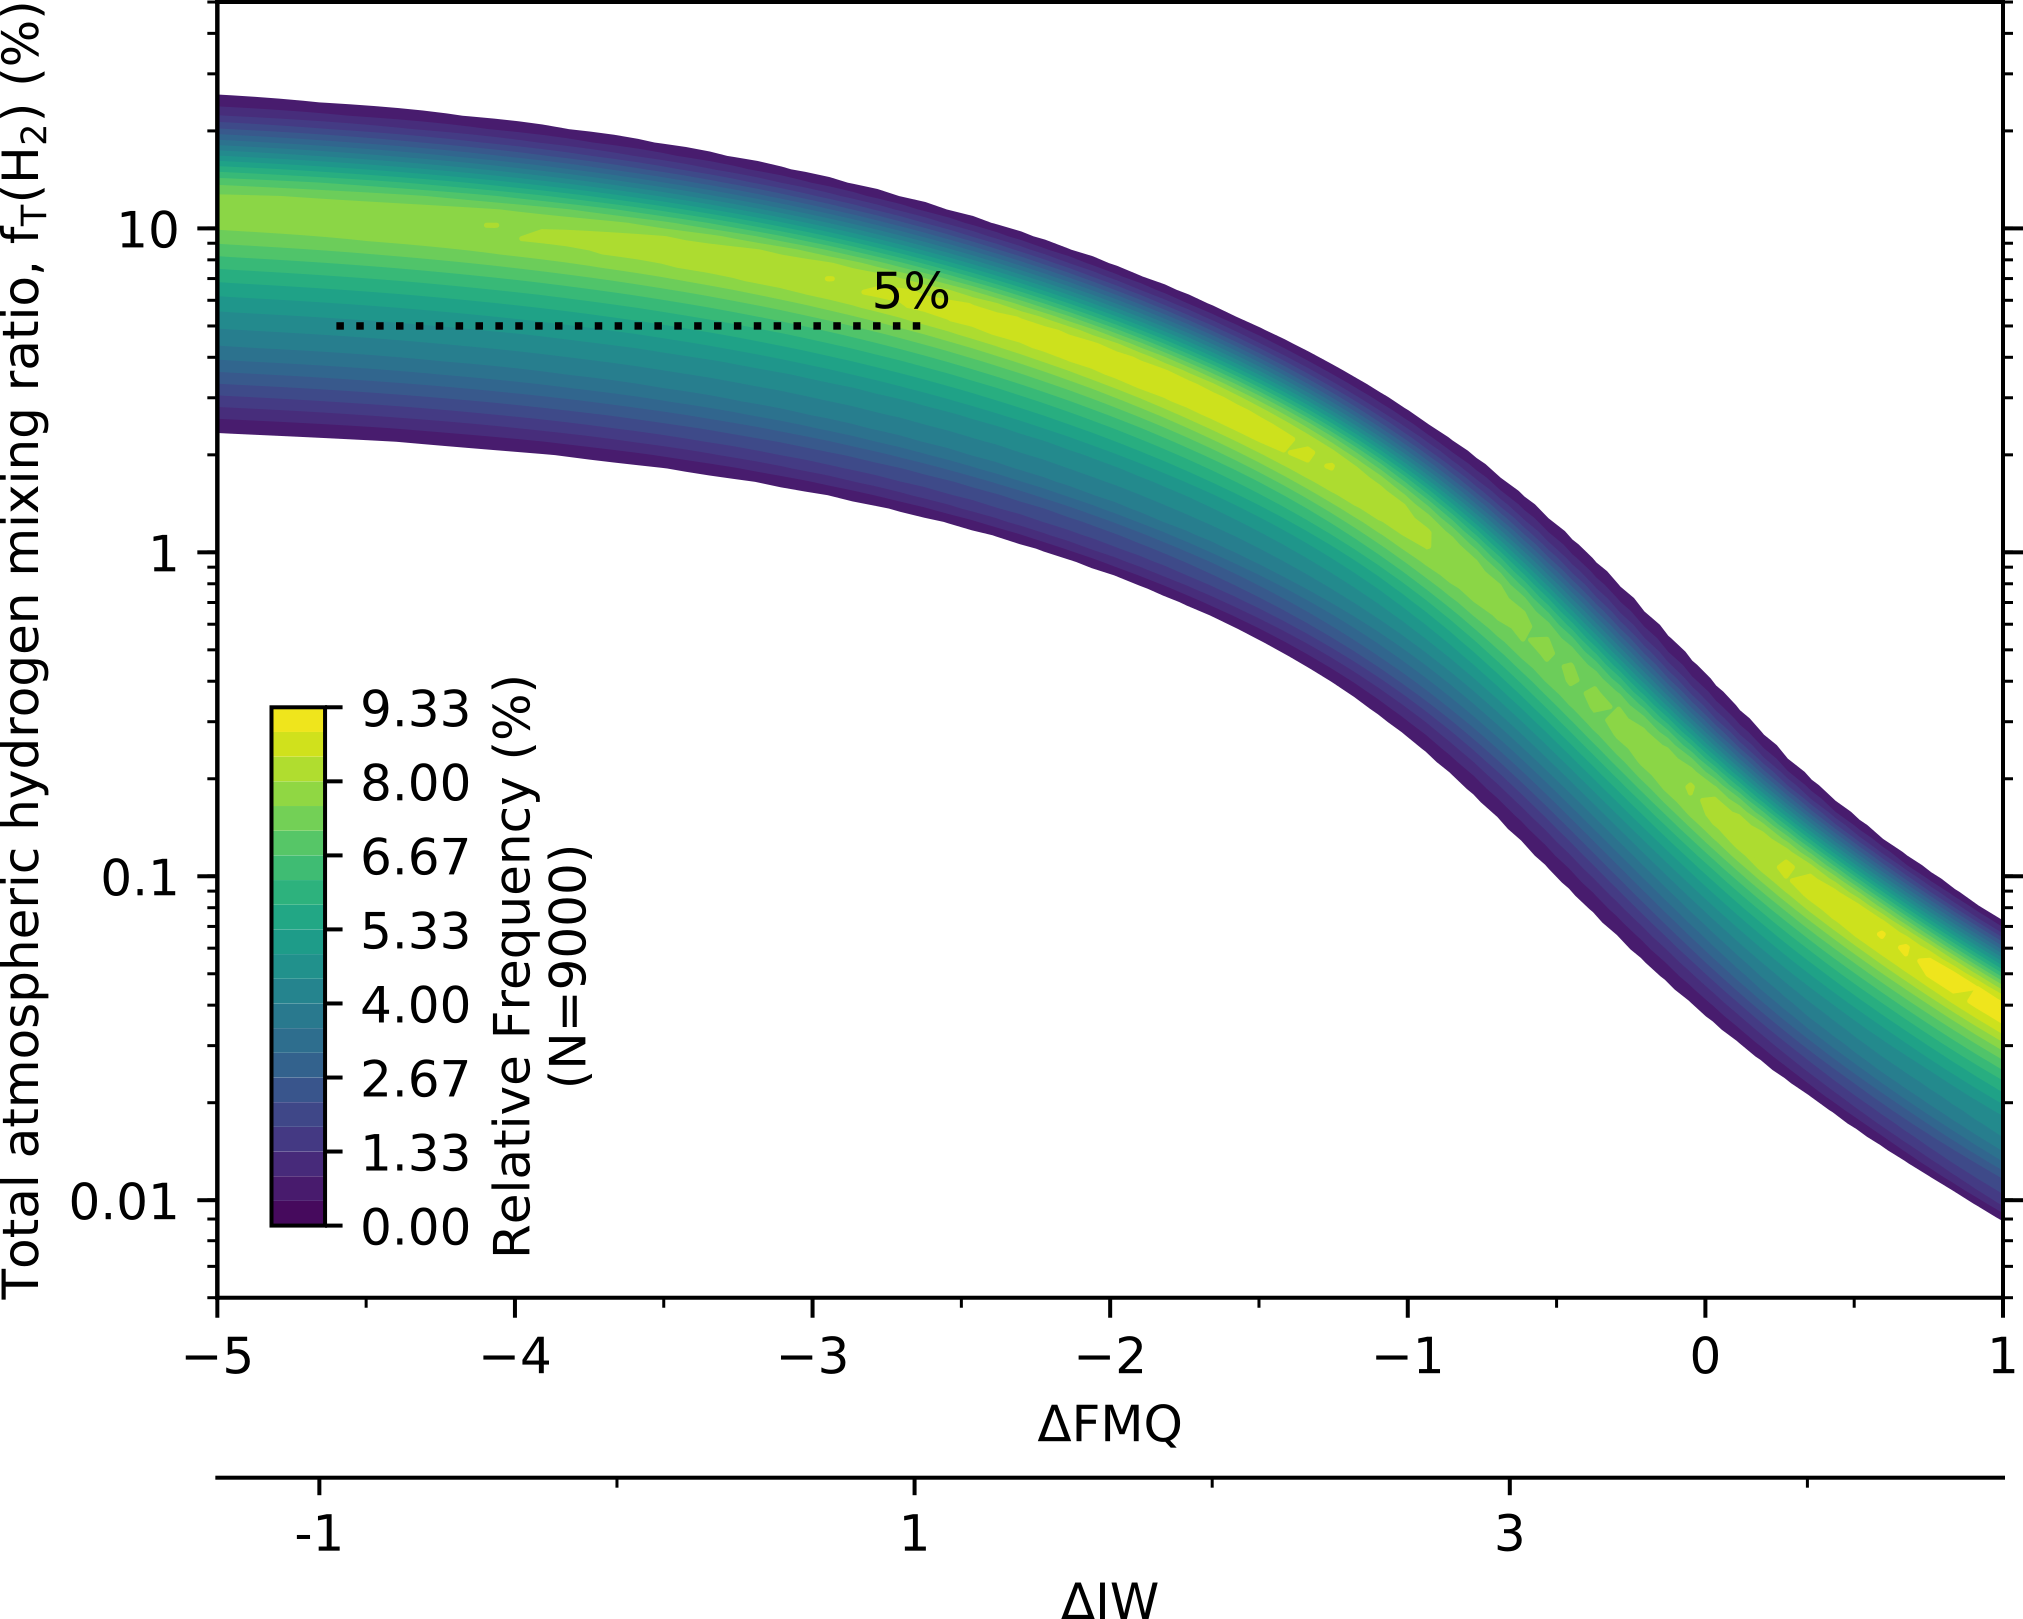
In light of the large uncertainty around the water contents of Martian magmas, we ran two parameter sweeps to find upper and lower limits on the potential atmospheric hydrogen content of Noachian Mars. The hydrous scenario, valid if volatile cycling (via crustal assimilation or other processes) or a large initial mantle water budget was present, is run with 550 ppm H, 200 ppm C, and 4000 ppm S, equivalent to 0.3 wt % \ceH2O and 600 ppm \ceCO2 dissolved prior to degassing at IW (e.g., upper limit of McCubbin et al., 2012). The dry scenario is run with equal C and S contents, and with 120 ppm H, equivalent to 0.03 wt % \ceH2O and 400 ppm \ceCO2 (McCubbin et al., 2016; Filiberto et al., 2016b). While the C content of Mars is equally uncertain, a variation in the magma carbon content of several hundred ppm would have a negligible effect on at 1 bar pressure (Fig. 1) so the C content between the two runs remains fixed. Our results are summarised in Fig. 8.
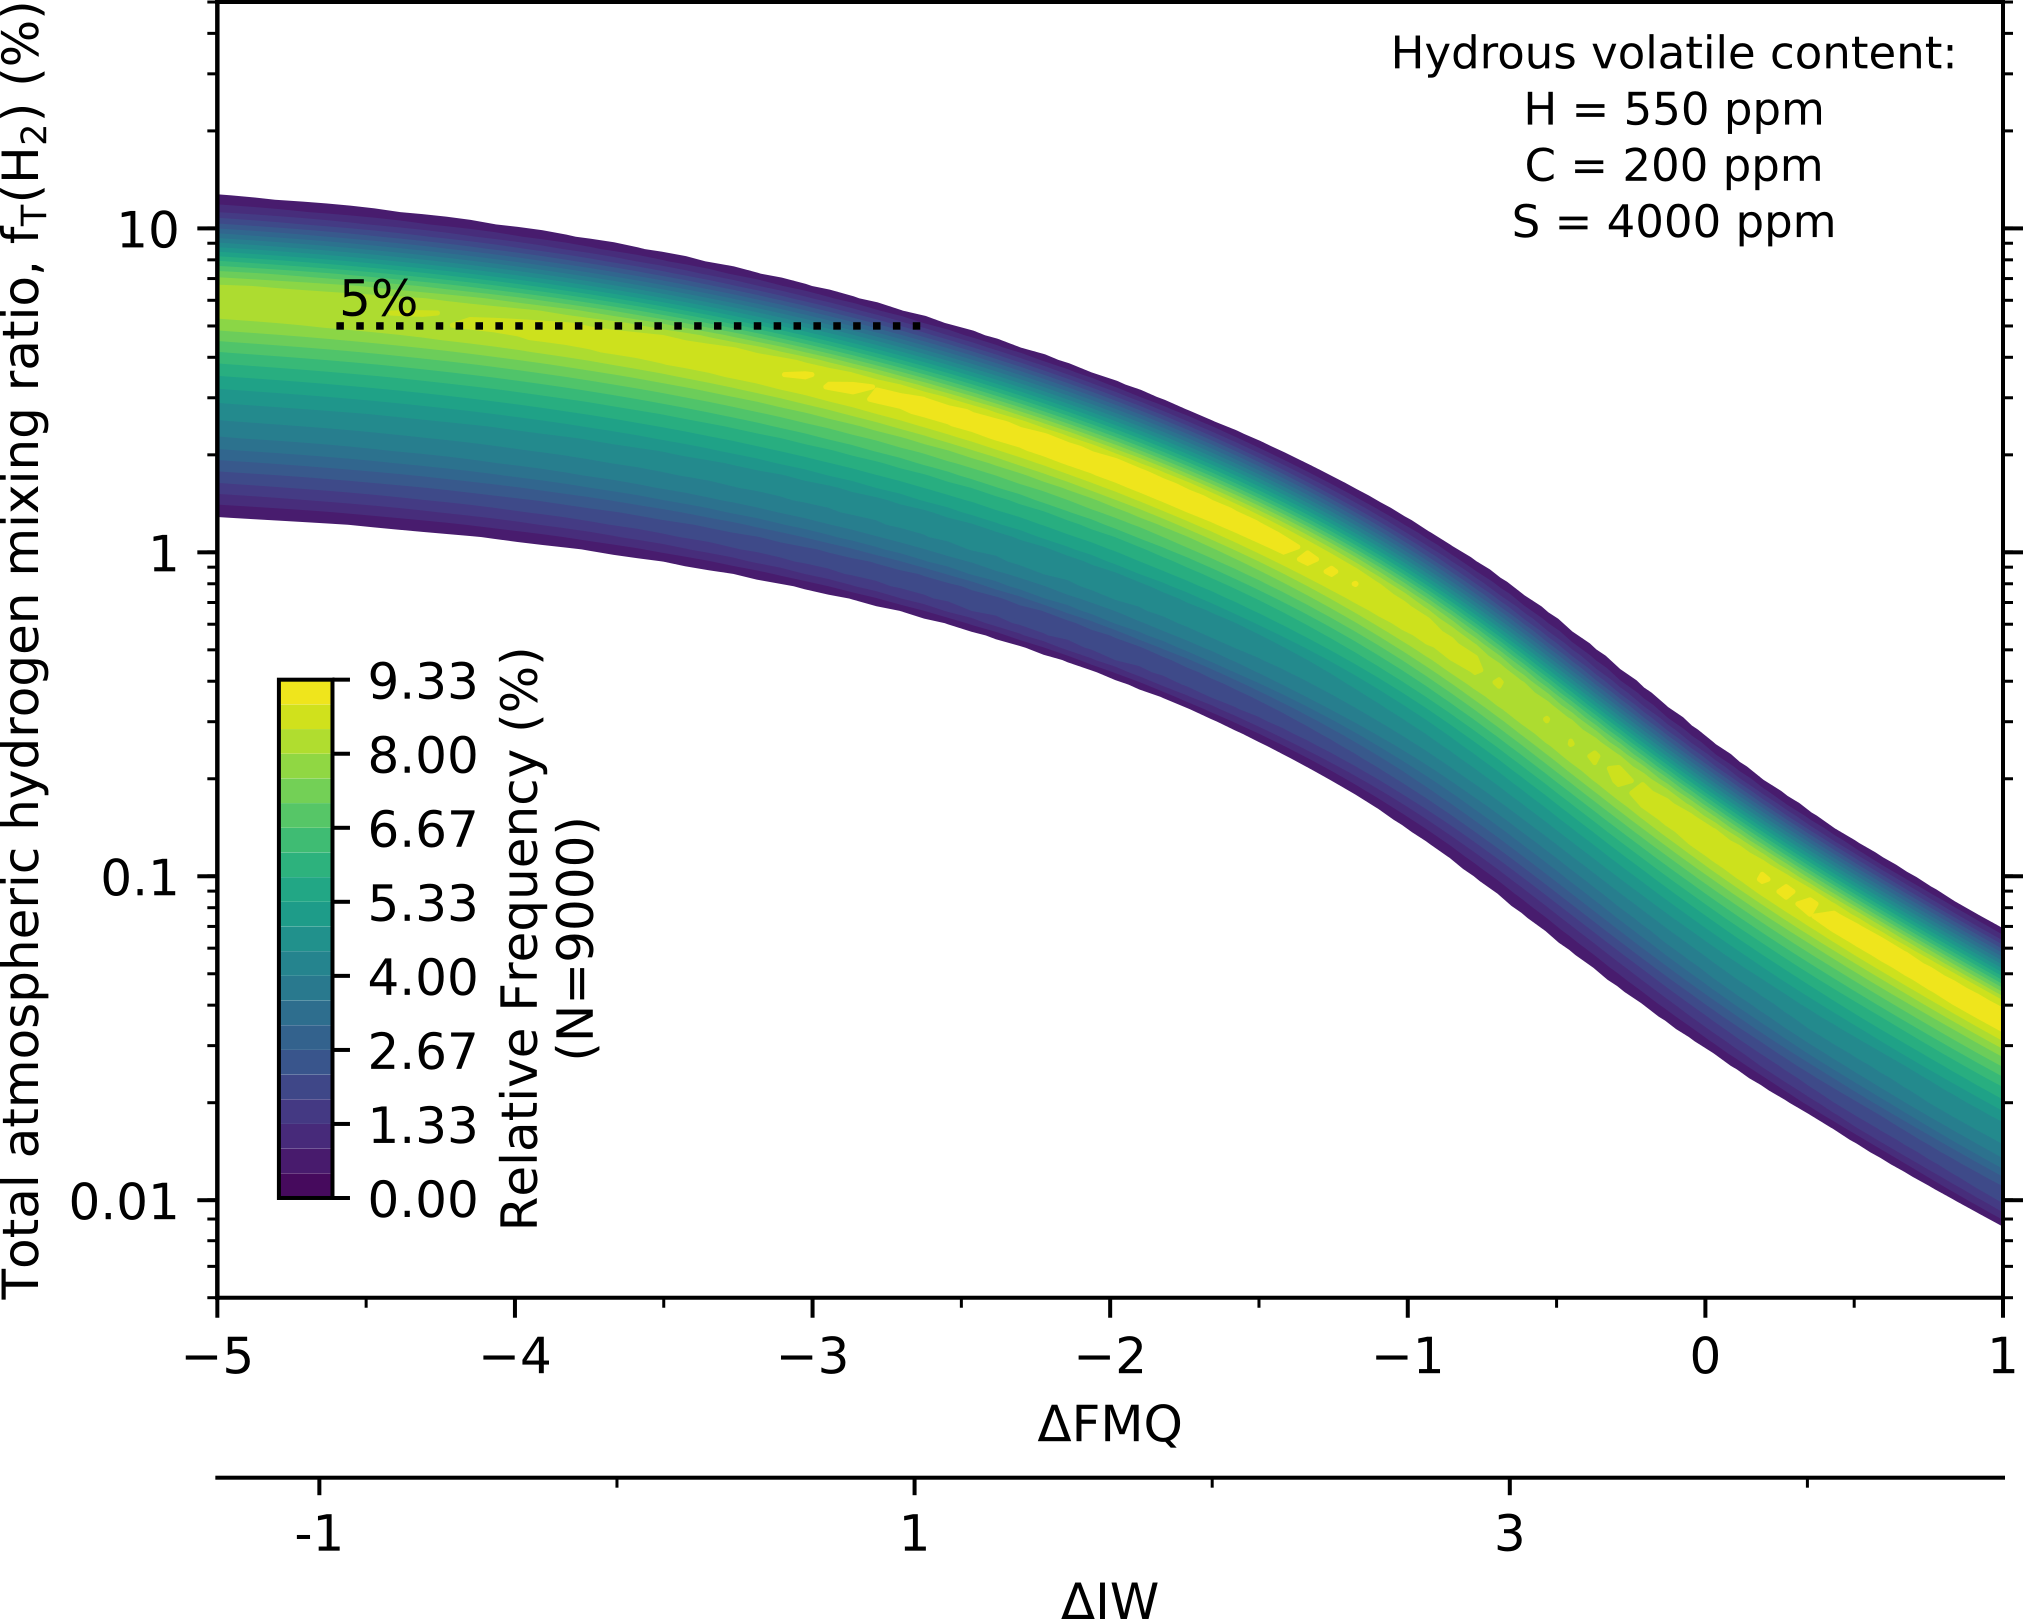
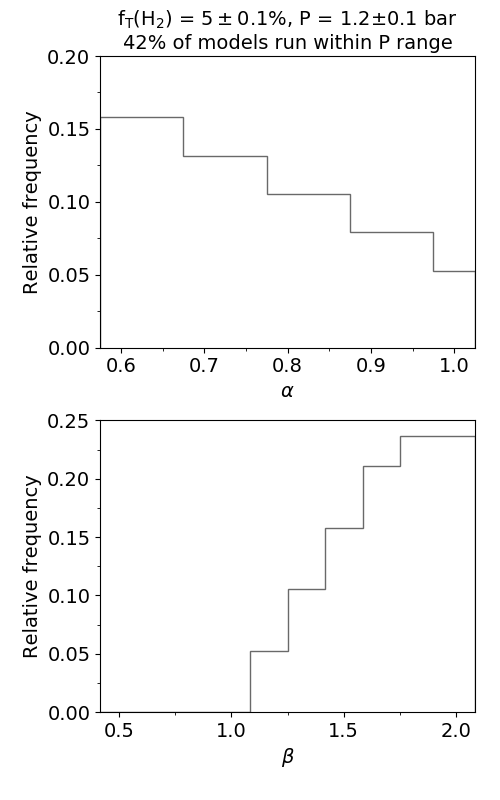
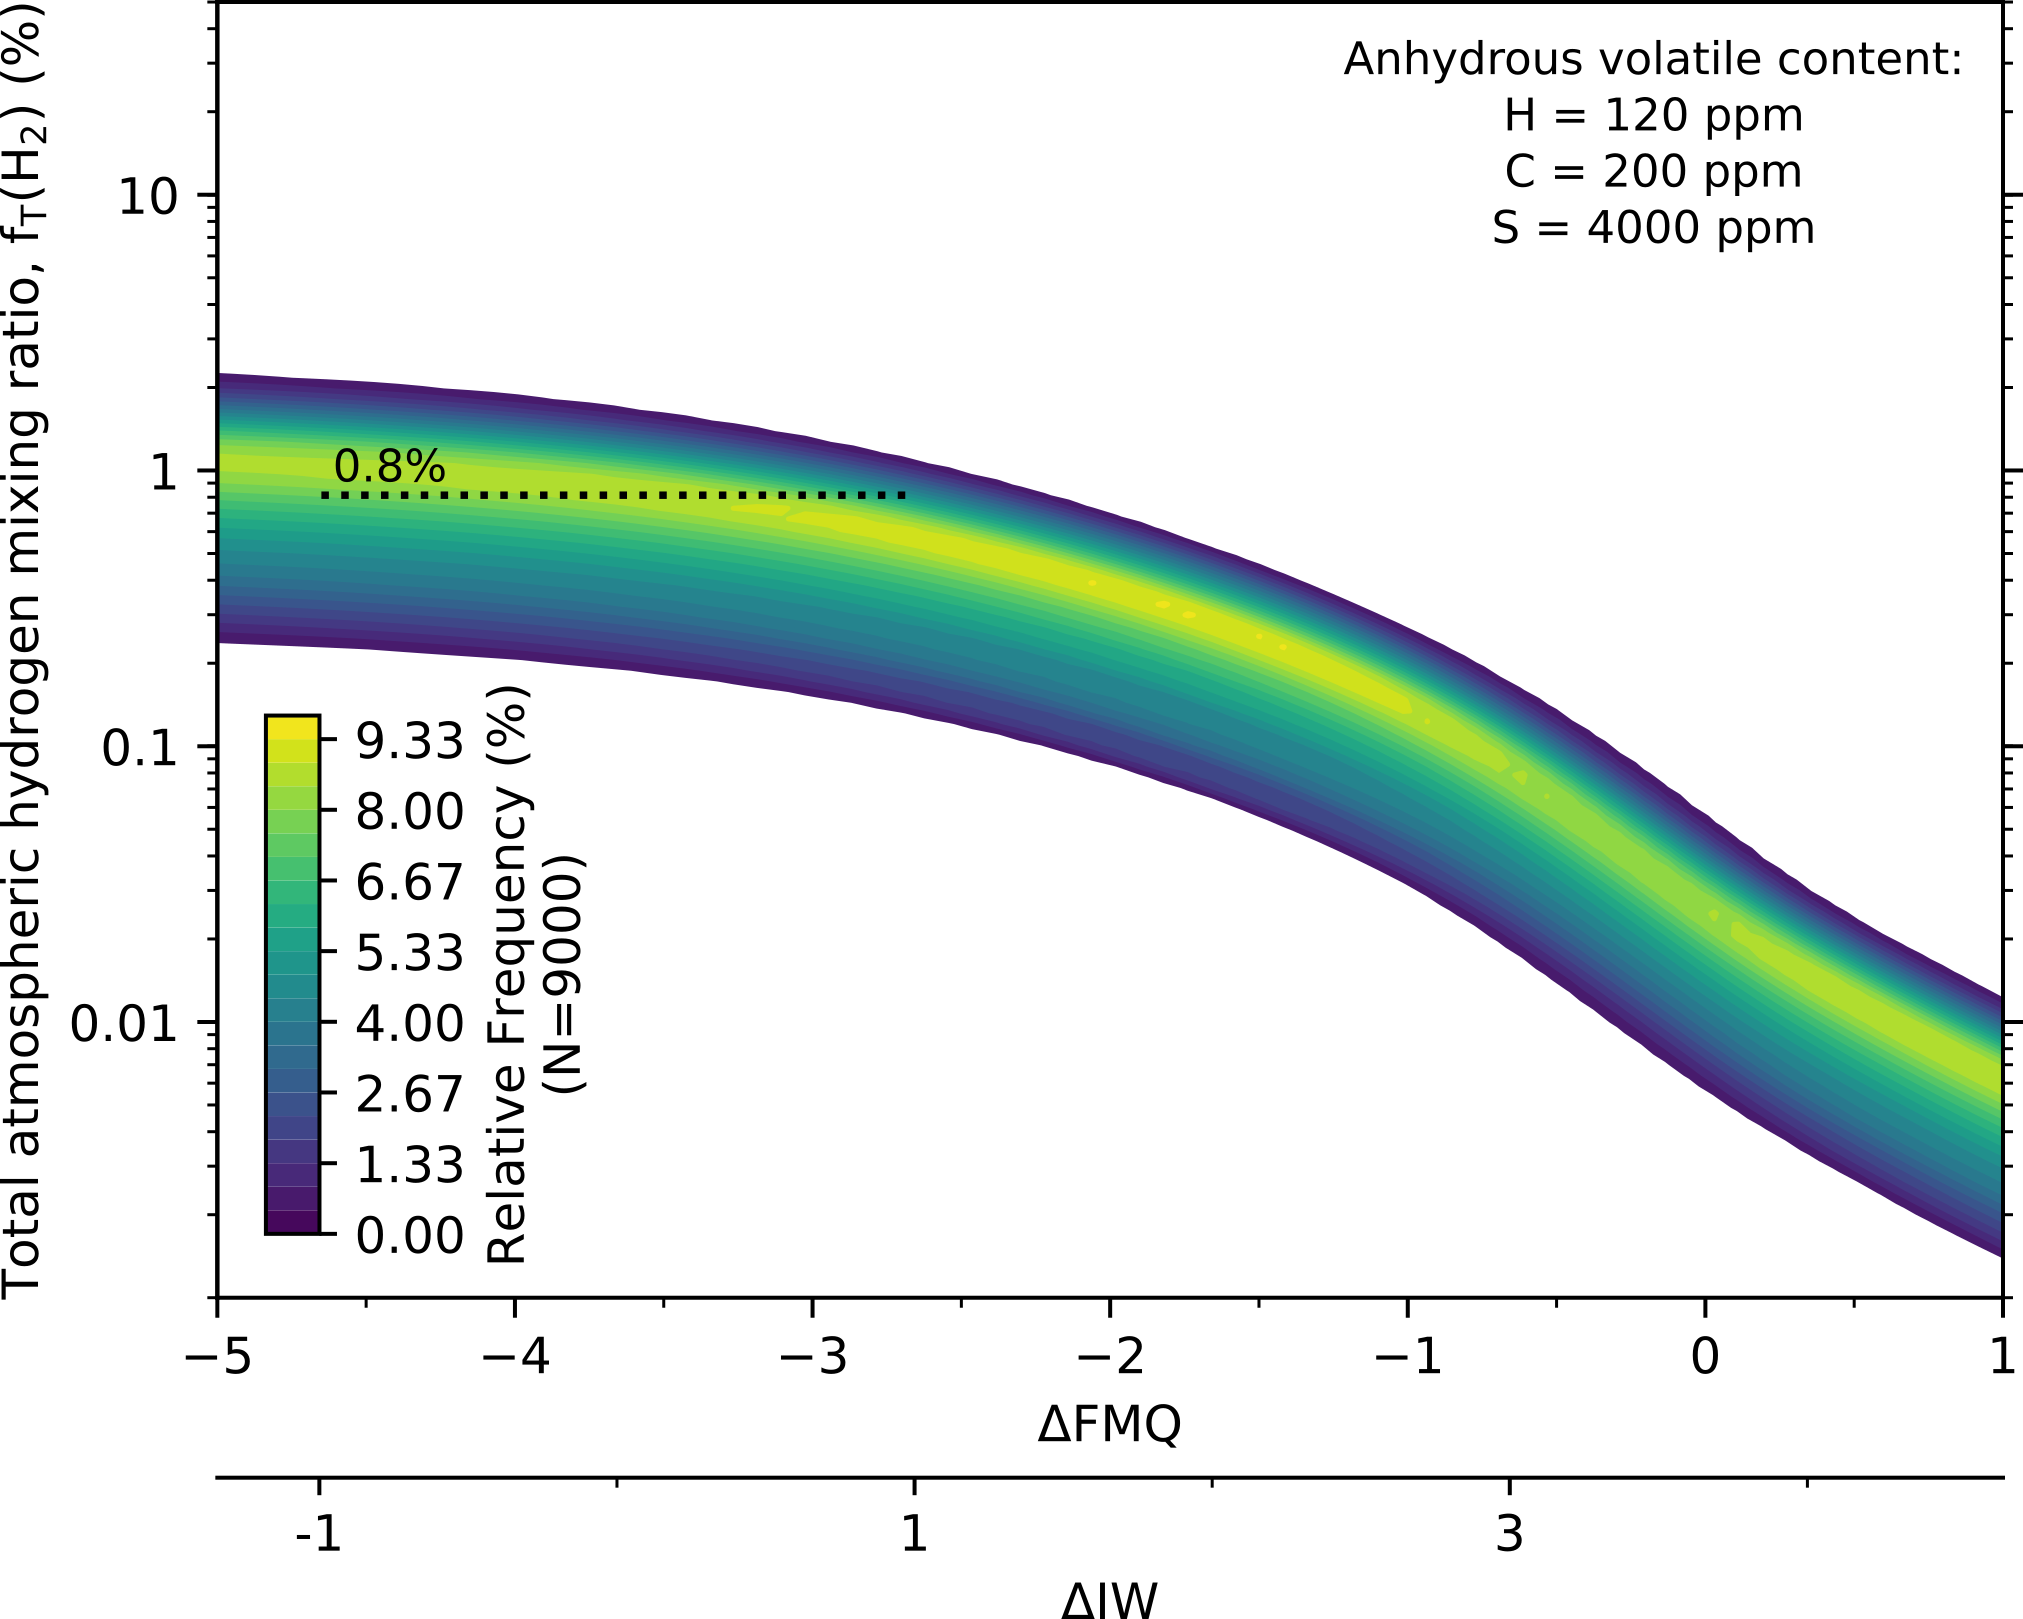
Fig. 8 indicates that across the likely range of magmatic on Mars, the range of \ceH2 mixing ratios predicted for the hydrous scenario is 0.6 - 11 % \ceH2, with most models falling in the range 2 to 8 % (0.9 - 15 % accounting for photochemical uncertainty, see B). We find that 42 % of models run at 1.2 0.1 bar achieve a 5 % within Mars’ likely magmatic range. The number of hydrous model runs which achieve 5 % decreases as increases, and Fig. 8 (b) shows a strong bias towards high values of ; no model runs within Mars’ range meet = 5 % with 1. Under a dry scenario, the most frequent results fall to 0.4 - 1.2 % (0.1 - 3 with photochemical uncertainty, see B). Given the relative frequency with which hydrous degassing models with Martian parameters can generate = 5 %, it is plausible that a volcanically-driven hydrogen greenhouse effect contributed to the warm and wet Noachian period on Mars, particularly if erupting magmas are at or below the IW buffer (Fig. 8 (a)). While under dry conditions this seems to be highly unlikely, as with Earth, there may also have been other geological sources of \ceH2 to the Martian atmosphere, such as weathering of white rust (\ceFe(OH)2, Tosca et al., 2018).
A key requirement of \ceH2-driven warming on Mars is that the atmosphere is dominantly \ceCO2. However, under reducing conditions with a high S content and a hydrous melt, most of the gas emission occurs as \ceH2 and \ceH2S, with C-bearing species only making up 5 % of the gas emitted (as a molar fraction). Ramirez et al. (2014) suggest that the \ceCO2 in the atmosphere could be sourced from volcanism through indirect \ceCO and \ceCH4 reactions, but if less than 5 % of the volcanic emissions are carbon-bearing species, then it may pose a challenge for a \ceCO2-\ceH2 atmosphere to be maintained solely through volcanism.
Ramirez et al. (2014) also suggest that the atmospheric \ceCO2 could have been sourced earlier in Mars’ history through the initial solidification of the upper 50 km of Mars’ crust. However, carbon in Mars’ atmosphere is thought to have been lost via hydrodynamic escape prior to 4.1 Ga, suggesting a \ceCO2-rich atmosphere from crustal solidification could not have been maintained (Tian et al., 2009). One possible solution to this is an intrinsically more carbon-rich martian mantle; this would have a minimal effect on the hydrogen fraction produced (Fig. 1), but could increase the flux of C-bearing species to the atmosphere. As the constraints on the volatile content of the Martian interior are very uncertain, it is difficult to rule this out.
9 Conclusions
We have investigated the possibility of volcanism sustaining secondary atmospheres with a high \ceH2 mixing ratio. We have found that values of several percent can be maintained, even with relatively oxidised magmatic sources such as those seen on Earth. As the magmatic decreases, the sustained increases, to the point where the assumption that \ceH2 is a minor species breaks down as approaches 50 %. These high \ceH2 fractions are very unlikely to be formed where the volcanic degassing occurs under high atmospheric pressure or underwater, and for more oxidising magmas a greater volcanic flux and/or a less efficient \ceH2 loss to space is necessary to maintain significant atmospheric \ceH2 fractions.
We have found that a sustained 1 % hydrogen atmosphere is plausible for the early Earth, given the likely range of magmatic and surface conditions, and does not require a mantle source reduced beyond that seen today. However, \ceH2 mixing ratios at the 10% level cannot be achieved given the likely conditions and magmatic on the early Earth, without supply from another source or suppression of escape beyond that which we consider is plausible. \ceH2-enhanced warming is therefore unlikely to have significantly contributed to counteracting the faint young sun. In the case of Mars, we suggest that sufficient \ceH2 could be degassed to carry out greenhouse warming if primary Martian magmas are relatively water-rich. However, the challenge under this scenario is that there may not have been a sufficient \ceCO2 source for this greenhouse mechanism to be viable; only 5 mol % of volcanically degassed species are carbon-bearing under hydrous conditions according to our model, and any \ceCO2 from early crustal solidification is likely to have already been lost. The sensitivity of these results to primary magmatic water contents shows the importance of improving constraints on the volatile content of Mars’ mantle, for understanding the planet’s early climate.
10 Acknowledgements
With thanks to an anonymous reviewer and Fabrice Gaillard for helpful comments. The authors would like to acknowledge C.E “Sonny” Harman and Mark Claire for helpful conversations. P. B. R thanks the Simons Foundation for support under SCOL awards 59963. Funding: This work was supported by the Embiricos Trust Scholarship from Jesus College, Cambridge.
References
- Abbot (2015) Abbot, D.S., 2015. A proposal for climate stability on H 2 -greenhouse planets. The Astrophysical Journal 815(1), L3. doi:10.1088/2041-8205/815/1/L3.
- Aulbach and Stagno (2016) Aulbach, S., Stagno, V., 2016. Evidence for a reducing Archean ambient mantle and its effects on the carbon cycle. Geology 44(9), 751–754. doi:10.1130/G38070.1.
- Avice et al. (2017) Avice, G., Marty, B., Burgess, R., 2017. The origin and degassing history of the Earth’s atmosphere revealed by Archean xenon. Nature Communications 8, 15455. doi:10.1038/ncomms15455.
- Batalha et al. (2015) Batalha, N., Domagal-Goldman, S.D., Ramirez, R., Kasting, J.F., 2015. Testing the early Mars H2–CO2 greenhouse hypothesis with a 1-D photochemical model. Icarus 258, 337–349. doi:10.1016/j.icarus.2015.06.016.
- Bézos and Humler (2005) Bézos, A., Humler, E., 2005. The Fe3+/Fe ratios of MORB glasses and their implications for mantle melting. Geochimica et Cosmochimica Acta 69(3), 711–725. doi:10.1016/j.gca.2004.07.026.
- Bourrier et al. (2017) Bourrier, V., de Wit, J., Bolmont, E., Stamenković, V., Wheatley, P.J., Burgasser, A.J., Delrez, L., Demory, B.O., Ehrenreich, D., Gillon, M., Jehin, E., Leconte, J., Lederer, S.M., Lewis, N., Triaud, A.H.M.J., Grootel, V.V., 2017. Temporal Evolution of the High-energy Irradiation and Water Content of TRAPPIST-1 Exoplanets. The Astronomical Journal 154(3), 121. doi:10.3847/1538-3881/aa859c.
- Burgisser et al. (2015) Burgisser, A., Alletti, M., Scaillet, B., 2015. Simulating the behavior of volatiles belonging to the C–O–H–S system in silicate melts under magmatic conditions with the software D-Compress. Computers & Geosciences 79, 1–14. doi:10.1016/j.cageo.2015.03.002.
- Catling (2006) Catling, D.C., 2006. Comment on ”A Hydrogen-Rich Early Earth Atmosphere”. Science 311(5757), 38–38. doi:10.1126/science.1117827.
- Catling and Kasting (2017) Catling, D.C., Kasting, J.F., 2017. Atmospheric Evolution Inhabited and Lifeless Worlds. Cambridge University Press, Cambridge.
- Deng et al. (2020) Deng, J., Du, Z., Karki, B.B., Ghosh, D.B., Lee, K.K.M., 2020. A magma ocean origin to divergent redox evolutions of rocky planetary bodies and early atmospheres. Nature Communications 11(1), 2007. doi:10.1038/s41467-020-15757-0.
- Dixon and Stolper (1995) Dixon, J.E., Stolper, E.M., 1995. An Experimental Study of Water and Carbon Dioxide Solubilities in Mid-Ocean Ridge Basaltic Liquids. Part II: Applications to Degassing. Journal of Petrology doi:10.1093/oxfordjournals.petrology.a037268.
- Doyle et al. (2019) Doyle, A.E., Young, E.D., Klein, B., Zuckerman, B., Schlichting, H.E., 2019. Oxygen fugacities of extrasolar rocks: Evidence for an Earth-like geochemistry of exoplanets. Science 366(6463), 356–359. doi:10.1126/science.aax3901.
- Filiberto et al. (2016a) Filiberto, J., Baratoux, D., Beaty, D., Breuer, D., Farcy, B.J., Grott, M., Jones, J.H., Kiefer, W.S., Mane, P., McCubbin, F.M., Schwenzer, S.P., 2016a. A review of volatiles in the Martian interior. Meteoritics & Planetary Science 51(11), 1935–1958. doi:10.1111/maps.12680.
- Filiberto et al. (2016b) Filiberto, J., Gross, J., McCubbin, F.M., 2016b. Constraints on the water, chlorine, and fluorine content of the Martian mantle. Meteoritics & Planetary Science 51(11), 2023–2035. doi:10.1111/maps.12624.
- Flament et al. (2008) Flament, N., Coltice, N., Rey, P.F., 2008. A case for late-Archaean continental emergence from thermal evolution models and hypsometry. Earth and Planetary Science Letters 275(3), 326–336. doi:10.1016/j.epsl.2008.08.029.
- Forget et al. (2013) Forget, F., Wordsworth, R., Millour, E., Madeleine, J.B., Kerber, L., Leconte, J., Marcq, E., Haberle, R.M., 2013. 3D modelling of the early martian climate under a denser CO2 atmosphere: Temperatures and CO2 ice clouds. Icarus 222(1), 81–99. doi:10.1016/j.icarus.2012.10.019.
- Gaillard and Scaillet (2014) Gaillard, F., Scaillet, B., 2014. A theoretical framework for volcanic degassing chemistry in a comparative planetology perspective and implications for planetary atmospheres. Earth and Planetary Science Letters 403, 307–316. doi:10.1016/j.epsl.2014.07.009.
- Gaillard et al. (2011) Gaillard, F., Scaillet, B., Arndt, N.T., 2011. Atmospheric oxygenation caused by a change in volcanic degassing pressure. Nature 478(7368), 229–232. doi:10.1038/nature10460.
- Goldblatt et al. (2009) Goldblatt, C., Claire, M.W., Lenton, T.M., Matthews, A.J., Watson, A.J., Zahnle, K.J., 2009. Nitrogen-enhanced greenhouse warming on early Earth. Nature Geoscience 2(12), 891–896. doi:10.1038/ngeo692.
- Haqq-Misra et al. (2008) Haqq-Misra, J.D., Domagal-Goldman, S.D., Kasting, P.J., Kasting, J.F., 2008. A Revised, Hazy Methane Greenhouse for the Archean Earth. Astrobiology 8(6), 1127–1137. doi:10.1089/ast.2007.0197.
- Hayworth et al. (2020) Hayworth, B.P.C., Kopparapu, R.K., Haqq-Misra, J., Batalha, N.E., Payne, R.C., Foley, B.J., Ikwut-Ukwa, M., Kasting, J.F., 2020. Warming early Mars with climate cycling: The effect of CO2-H2 collision-induced absorption. Icarus 345, 113770. doi:10.1016/j.icarus.2020.113770.
- Hoke et al. (2011) Hoke, M.R.T., Hynek, B.M., Tucker, G.E., 2011. Formation timescales of large Martian valley networks. Earth and Planetary Science Letters 312(1), 1–12. doi:10.1016/j.epsl.2011.09.053.
- Holland and Powell (1991) Holland, T., Powell, R., 1991. A Compensated-Redlich-Kwong (CORK) equation for volumes and fugacities of CO2 and H2O in the range 1 bar to 50 kbar and 100 - 1600 degrees C. Contributions to Mineralogy and Petrology 109(2), 265–273. doi:10.1007/BF00306484.
- Holloway (1987) Holloway, J.R., 1987. Igneous fluids. In Thermodynamic Modeling of Geological Materials : Minerals Fluids and Melts. Reviews in Mineralogy 17, 211–233.
- Kasting (1993) Kasting, J.F., 1993. Earth’s early atmosphere. Science 259(5097), 920–926. doi:10.1126/science.11536547.
- Kasting (2013) Kasting, J.F., 2013. What caused the rise of atmospheric O2? Chemical Geology 362, 13–25. doi:10.1016/j.chemgeo.2013.05.039.
- Kharecha et al. (2005) Kharecha, P., Kasting, J., Siefert, J., 2005. A coupled atmosphere–ecosystem model of the early Archean Earth. Geobiology 3(2), 53–76. doi:10.1111/j.1472-4669.2005.00049.x.
- Korenaga (2006) Korenaga, J., 2006. Archean Geodynamics and the Thermal Evolution of Earth. In Archean Geodynamics and Environments, 7–32. American Geophysical Union (AGU). doi:10.1029/164GM03.
- Kuramoto et al. (2013) Kuramoto, K., Umemoto, T., Ishiwatari, M., 2013. Effective hydrodynamic hydrogen escape from an early Earth atmosphere inferred from high-accuracy numerical simulation. Earth and Planetary Science Letters 375, 312–318. doi:10.1016/j.epsl.2013.05.050.
- Kurokawa et al. (2018) Kurokawa, H., Kurosawa, K., Usui, T., 2018. A lower limit of atmospheric pressure on early Mars inferred from nitrogen and argon isotopic compositions. Icarus 299, 443–459. doi:10.1016/j.icarus.2017.08.020.
- Lopez et al. (2012) Lopez, E.D., Fortney, J.J., Miller, N., 2012. How thermal evolution and mass-loss sculpt populations of Super-Earths and sub-Neptunes: Application to the KEPLER-11 system and beyond. The Astrophysical Journal 761(1), 59. doi:10.1088/0004-637X/761/1/59.
- Luger and Barnes (2015) Luger, R., Barnes, R., 2015. Extreme Water Loss and Abiotic O2 Buildup on Planets Throughout the Habitable Zones of M Dwarfs. Astrobiology 15(2), 119–143. doi:10.1089/ast.2014.1231.
- Magna et al. (2015) Magna, T., Gussone, N., Mezger, K., 2015. The calcium isotope systematics of Mars. Earth and Planetary Science Letters 430, 86–94. doi:10.1016/j.epsl.2015.08.016.
- McCubbin et al. (2016) McCubbin, F.M., Boyce, J.W., Srinivasan, P., Santos, A.R., Elardo, S.M., Filiberto, J., Steele, A., Shearer, C.K., 2016. Heterogeneous distribution of H2O in the Martian interior: Implications for the abundance of H2O in depleted and enriched mantle sources. Meteoritics & Planetary Science 51(11), 2036–2060. doi:10.1111/maps.12639.
- McCubbin et al. (2012) McCubbin, F.M., Hauri, E.H., Elardo, S.M., Kaaden, K.E.V., Wang, J., Shearer, C.K., 2012. Hydrous melting of the martian mantle produced both depleted and enriched shergottites. Geology 40(8), 683–686. doi:10.1130/G33242.1.
- McSween et al. (2001) McSween, H.Y., Grove, T.L., Lentz, R.C., Dann, J.C., Holzheid, A.H., Riciputi, L.R., Ryan, J.G., 2001. Geochemical evidence for magmatic water within Mars from pyroxenes in the Shergotty meteorite. Nature 409(6819), 487–490. doi:10.1038/35054011.
- Michael and Graham (2015) Michael, P.J., Graham, D.W., 2015. The behavior and concentration of CO2 in the suboceanic mantle: Inferences from undegassed ocean ridge and ocean island basalts. Lithos 236-237, 338–351. doi:10.1016/j.lithos.2015.08.020.
- Miller and Urey (1959) Miller, S.L., Urey, H.C., 1959. Organic Compound Synthesis on the Primitive Earth. Science 130(3370), 245–251.
- Moretti and Papale (2004) Moretti, R., Papale, P., 2004. On the oxidation state and volatile behavior in multicomponent gas–melt equilibria. Chemical Geology 213(1), 265–280. doi:10.1016/j.chemgeo.2004.08.048.
- Nicklas et al. (2019) Nicklas, R.W., Puchtel, I.S., Ash, R.D., Piccoli, P.M., Hanski, E., Nisbet, E.G., Waterton, P., Pearson, D.G., Anbar, A.D., 2019. Secular mantle oxidation across the Archean-Proterozoic boundary: Evidence from V partitioning in komatiites and picrites. Geochimica et Cosmochimica Acta 250, 49–75. doi:10.1016/j.gca.2019.01.037.
- Nyquist et al. (2009) Nyquist, L.E., Bogard, D.D., Shih, C.Y., Park, J., Reese, Y.D., Irving, A.J., 2009. Concordant Rb–Sr, Sm–Nd, and Ar–Ar ages for Northwest Africa 1460: A 346Ma old basaltic shergottite related to “lherzolitic” shergottites. Geochimica et Cosmochimica Acta 73(14), 4288–4309. doi:10.1016/j.gca.2009.04.008.
- Owen and Alvarez (2015) Owen, J.E., Alvarez, M.A., 2015. UV driven evaporation of close-in planets: Energy-limited, recombination-limited, and photon-limited flows. The Astrophysical Journal 816(1), 34. doi:10.3847/0004-637X/816/1/34.
- Pierrehumbert and Gaidos (2011) Pierrehumbert, R., Gaidos, E., 2011. Hydrogen greenhouse planets beyond the habitable zone. The Astrophysical Journal 734(1), L13. doi:10.1088/2041-8205/734/1/L13.
- Ramirez and Kaltenegger (2017) Ramirez, R.M., Kaltenegger, L., 2017. A Volcanic Hydrogen Habitable Zone. The Astrophysical Journal 837(1), L4. doi:10.3847/2041-8213/aa60c8.
- Ramirez et al. (2014) Ramirez, R.M., Kopparapu, R., Zugger, M.E., Robinson, T.D., Freedman, R., Kasting, J.F., 2014. Warming early Mars with CO2 and H2. Nature Geoscience 7(1), 59–63. doi:10.1038/ngeo2000.
- Ribas et al. (2005) Ribas, I., Guinan, E.F., Güdel, M., Audard, M., 2005. Evolution of the Solar Activity over Time and Effects on Planetary Atmospheres. I. High-Energy Irradiances (1-1700 Å). The Astrophysical Journal 622(1), 680. doi:10.1086/427977.
- Rimmer et al. (2019) Rimmer, P., Shorttle, O., Rugheimer, S., 2019. Oxidised micrometeorites as evidence for low atmospheric pressure on the early Earth. Geochemical Perspectives Letters 38–42. doi:10.7185/geochemlet.1903.
- Sagan (1977) Sagan, C., 1977. Reducing greenhouses and the temperature history of Earth and Mars. Nature 269(5625), 224–226. doi:10.1038/269224a0.
- Schaefer and Fegley (2007) Schaefer, L., Fegley, B., 2007. Outgassing of ordinary chondritic material and some of its implications for the chemistry of asteroids, planets, and satellites. Icarus 186(2), 462–483. doi:10.1016/j.icarus.2006.09.002.
- Schaefer and Fegley (2010) Schaefer, L., Fegley, B., 2010. Chemistry of atmospheres formed during accretion of the Earth and other terrestrial planets. Icarus 208(1), 438–448. doi:10.1016/j.icarus.2010.01.026.
- Shaw and Wones (1964) Shaw, H.R., Wones, D.R., 1964. Fugacity coefficients for hydrogen gas between O degrees and 1000 degrees C, for pressures to 3000 atm. American Journal of Science 262(7), 918–929. doi:10.2475/ajs.262.7.918.
- Shi and Saxena (1992) Shi, P., Saxena, S.K., 1992. Thermodynamic modeing of the C-H-O-S fluid system. American Mineralogist 77(9-10), 1038–1049.
- Sleep and Zahnle (2001) Sleep, N.H., Zahnle, K., 2001. Carbon dioxide cycling and implications for climate on ancient Earth. Journal of Geophysical Research: Planets 106(E1), 1373–1399. doi:10.1029/2000JE001247.
- Som et al. (2016) Som, S.M., Buick, R., Hagadorn, J.W., Blake, T.S., Perreault, J.M., Harnmeijer, J.P., Catling, D.C., 2016. Earth’s air pressure 2.7 billion years ago constrained to less than half of modern levels. Nature Geoscience 9(6), 448–451. doi:10.1038/ngeo2713.
- Stevenson (1999) Stevenson, D.J., 1999. Life-sustaining planets in interstellar space? Nature 400(6739), 32–32. doi:10.1038/21811.
- Thiemann et al. (2017) Thiemann, E.M.B., Chamberlin, P.C., Eparvier, F.G., Templeman, B., Woods, T.N., Bougher, S.W., Jakosky, B.M., 2017. The MAVEN EUVM model of solar spectral irradiance variability at Mars: Algorithms and results. Journal of Geophysical Research: Space Physics 122(3), 2748–2767. doi:10.1002/2016JA023512.
- Tian et al. (2009) Tian, F., Kasting, J.F., Solomon, S.C., 2009. Thermal escape of carbon from the early Martian atmosphere. Geophysical Research Letters 36(2). doi:10.1029/2008GL036513.
- Tian et al. (2005) Tian, F., Toon, O.B., Pavlov, A.A., Sterck, H.D., 2005. A Hydrogen-Rich Early Earth Atmosphere. Science 308(5724), 1014–1017. doi:10.1126/science.1106983.
- Tosca et al. (2018) Tosca, N.J., Ahmed, I.A.M., Tutolo, B.M., Ashpitel, A., Hurowitz, J.A., 2018. Magnetite authigenesis and the warming of early Mars. Nature Geoscience 11(9), 635–639. doi:10.1038/s41561-018-0203-8.
- Tu et al. (2015) Tu, L., Johnstone, C.P., Güdel, M., Lammer, H., 2015. The extreme ultraviolet and X-ray Sun in Time: High-energy evolutionary tracks of a solar-like star. Astronomy & Astrophysics 577, L3. doi:10.1051/0004-6361/201526146.
- Usui et al. (2012) Usui, T., Alexander, C.M.O., Wang, J., Simon, J.I., Jones, J.H., 2012. Origin of water and mantle–crust interactions on Mars inferred from hydrogen isotopes and volatile element abundances of olivine-hosted melt inclusions of primitive shergottites. Earth and Planetary Science Letters 357-358, 119–129. doi:10.1016/j.epsl.2012.09.008.
- Wadhwa (2008) Wadhwa, M., 2008. Redox Conditions on Small Bodies, the Moon and Mars. Reviews in Mineralogy and Geochemistry 68(1), 493–510. doi:10.2138/rmg.2008.68.17.
- Walker (1977) Walker, J.C.G., 1977. Evolution of the Atmosphere. Maxwell Macmillan Canada, Incorporated.
- Wallace et al. (2015) Wallace, P.J., Plank, T., Edmonds, M., Hauri, E.H., 2015. Chapter 7 - Volatiles in Magmas. In H. Sigurdsson (ed.), The Encyclopedia of Volcanoes (Second Edition), 163–183. Academic Press, Amsterdam. doi:10.1016/B978-0-12-385938-9.00007-9.
- Warren et al. (2019) Warren, A.O., Kite, E.S., Williams, J.P., Horgan, B., 2019. Through the Thick and Thin: New Constraints on Mars Paleopressure History 3.8 – 4 Ga from Small Exhumed Craters. Journal of Geophysical Research: Planets n/a(n/a). doi:10.1029/2019JE006178.
- Wordsworth (2012) Wordsworth, R., 2012. Transient conditions for biogenesis on low-mass exoplanets with escaping hydrogen atmospheres. Icarus 219(1), 267–273. doi:10.1016/j.icarus.2012.02.035.
- Wordsworth et al. (2017) Wordsworth, R., Kalugina, Y., Lokshtanov, S., Vigasin, A., Ehlmann, B., Head, J., Sanders, C., Wang, H., 2017. Transient reducing greenhouse warming on early Mars. Geophysical Research Letters 44(2), 665–671. doi:10.1002/2016GL071766.
- Wordsworth and Pierrehumbert (2013) Wordsworth, R., Pierrehumbert, R., 2013. Hydrogen-Nitrogen Greenhouse Warming in Earth’s Early Atmosphere. Science 339(6115), 64–67. doi:10.1126/science.1225759.
- Zahnle et al. (2019) Zahnle, K.J., Gacesa, M., Catling, D.C., 2019. Strange messenger: A new history of hydrogen on Earth, as told by Xenon. Geochimica et Cosmochimica Acta 244, 56–85. doi:10.1016/j.gca.2018.09.017.
- Zolotov et al. (2013) Zolotov, M.Y., Sprague, A.L., Hauck, S.A., Nittler, L.R., Solomon, S.C., Weider, S.Z., 2013. The redox state, FeO content, and origin of sulfur-rich magmas on Mercury. Journal of Geophysical Research: Planets 118(1), 138–146. doi:10.1029/2012JE004274.
Appendix A Effect of pressure and on volcanic gases and
The amount of gas released from a melt and it’s speciation varies with pressure (Figure 9(a, b)). As the pressure reduces, so does volatile solubility therefore increasing the volume of the gas phase. The volume of gas phase also increases according to the ideal gas law, so that Fig.9c shows both the increasing amount of volatile in the gas phase, and the expansion of the gas phase according to as the pressure decreases. Figure 9a shows how the speciation of a gas phase changes with depth, but it should be noted that this is for a fixed at all pressures, to isolate the pressure effect on speciation. If left to decompress naturally, a melt (particularly a sulphur rich one) will evolve through a slight change and the resulting speciation plot would be a combination of effect from Figures 9a and 10.
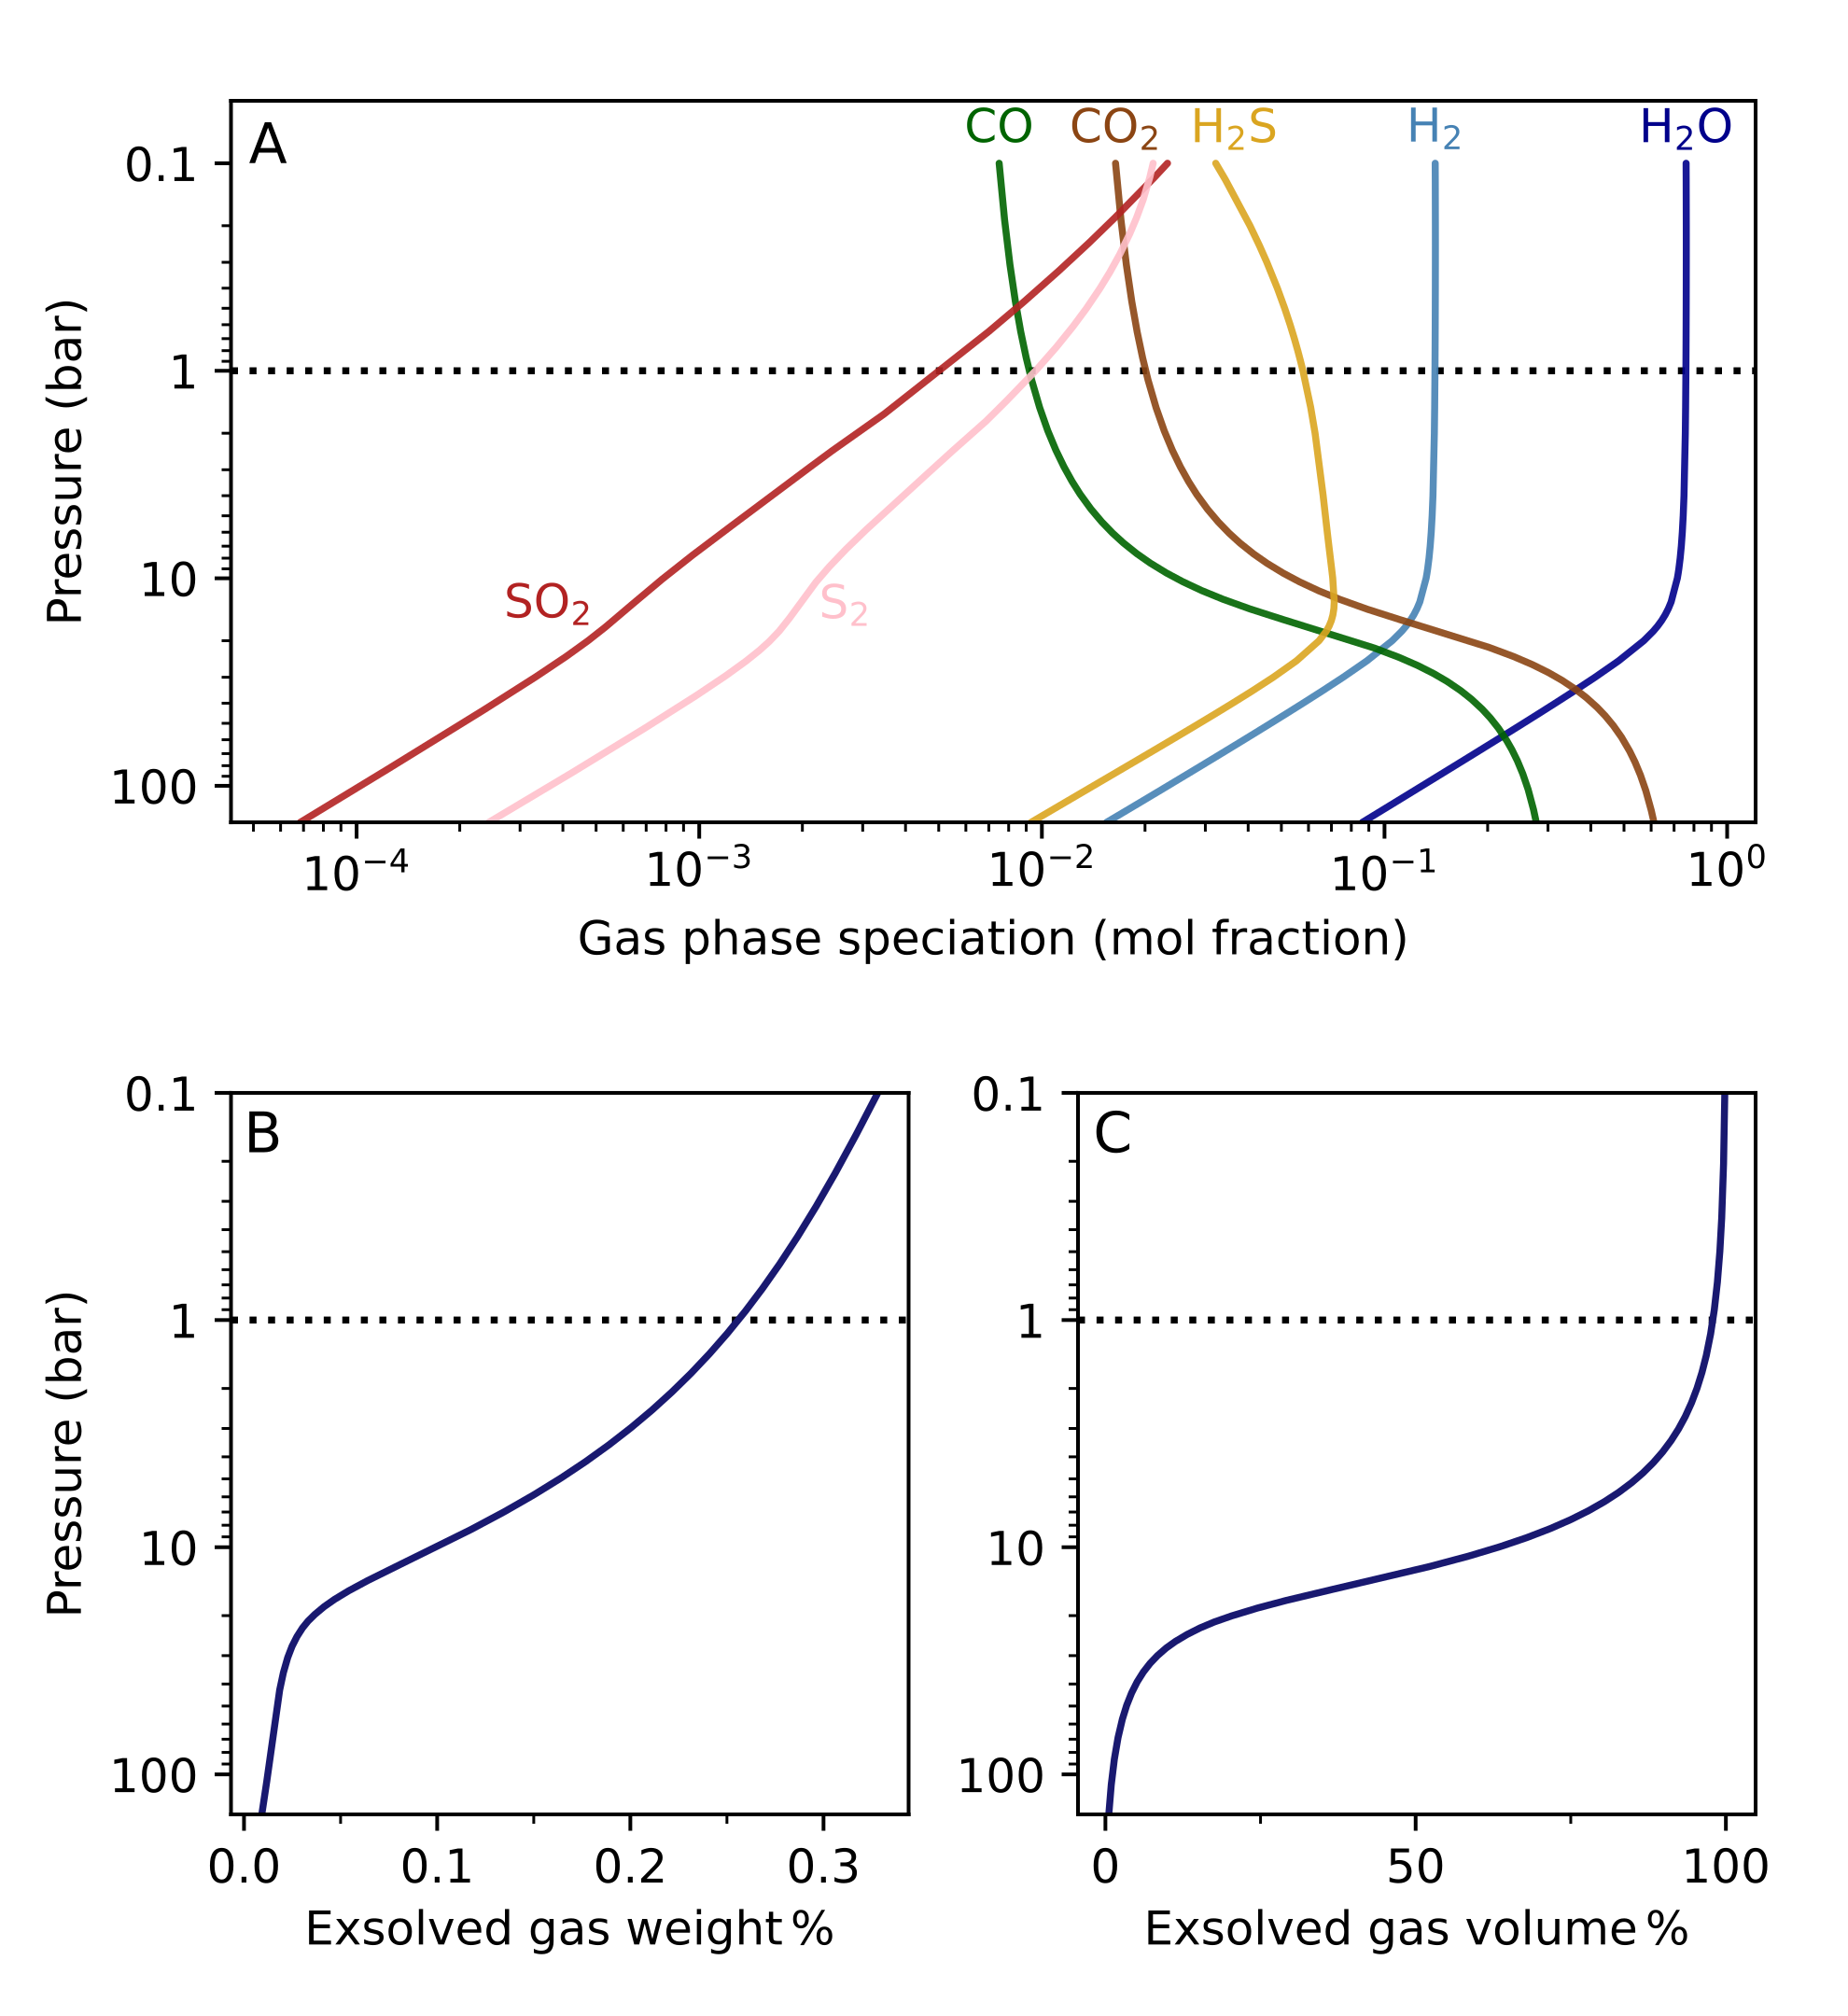
The exsolved fraction also varies with constant pressure and variable (Fig.10). As the decreases at low pressure, the weight fraction of gas exsolved decreases, while the gas volume remains almost constant. The decreasing weight fraction reflects oxygen in the gas phase reducing with . As oxygen is the second heaviest volatile element, reducing the system results in a gas phase which is dominated by lighter molecules and therefore has a much lower mean molecular mass. The decreasing weight fraction from oxygen loss is modulated by the presence of sulphur, which initially partitions slightly more into the melt, before increasing in the gas phase as it speciates into less soluble, reducing species (\ceS2 and \ceH2S) rather than \ceSO2.
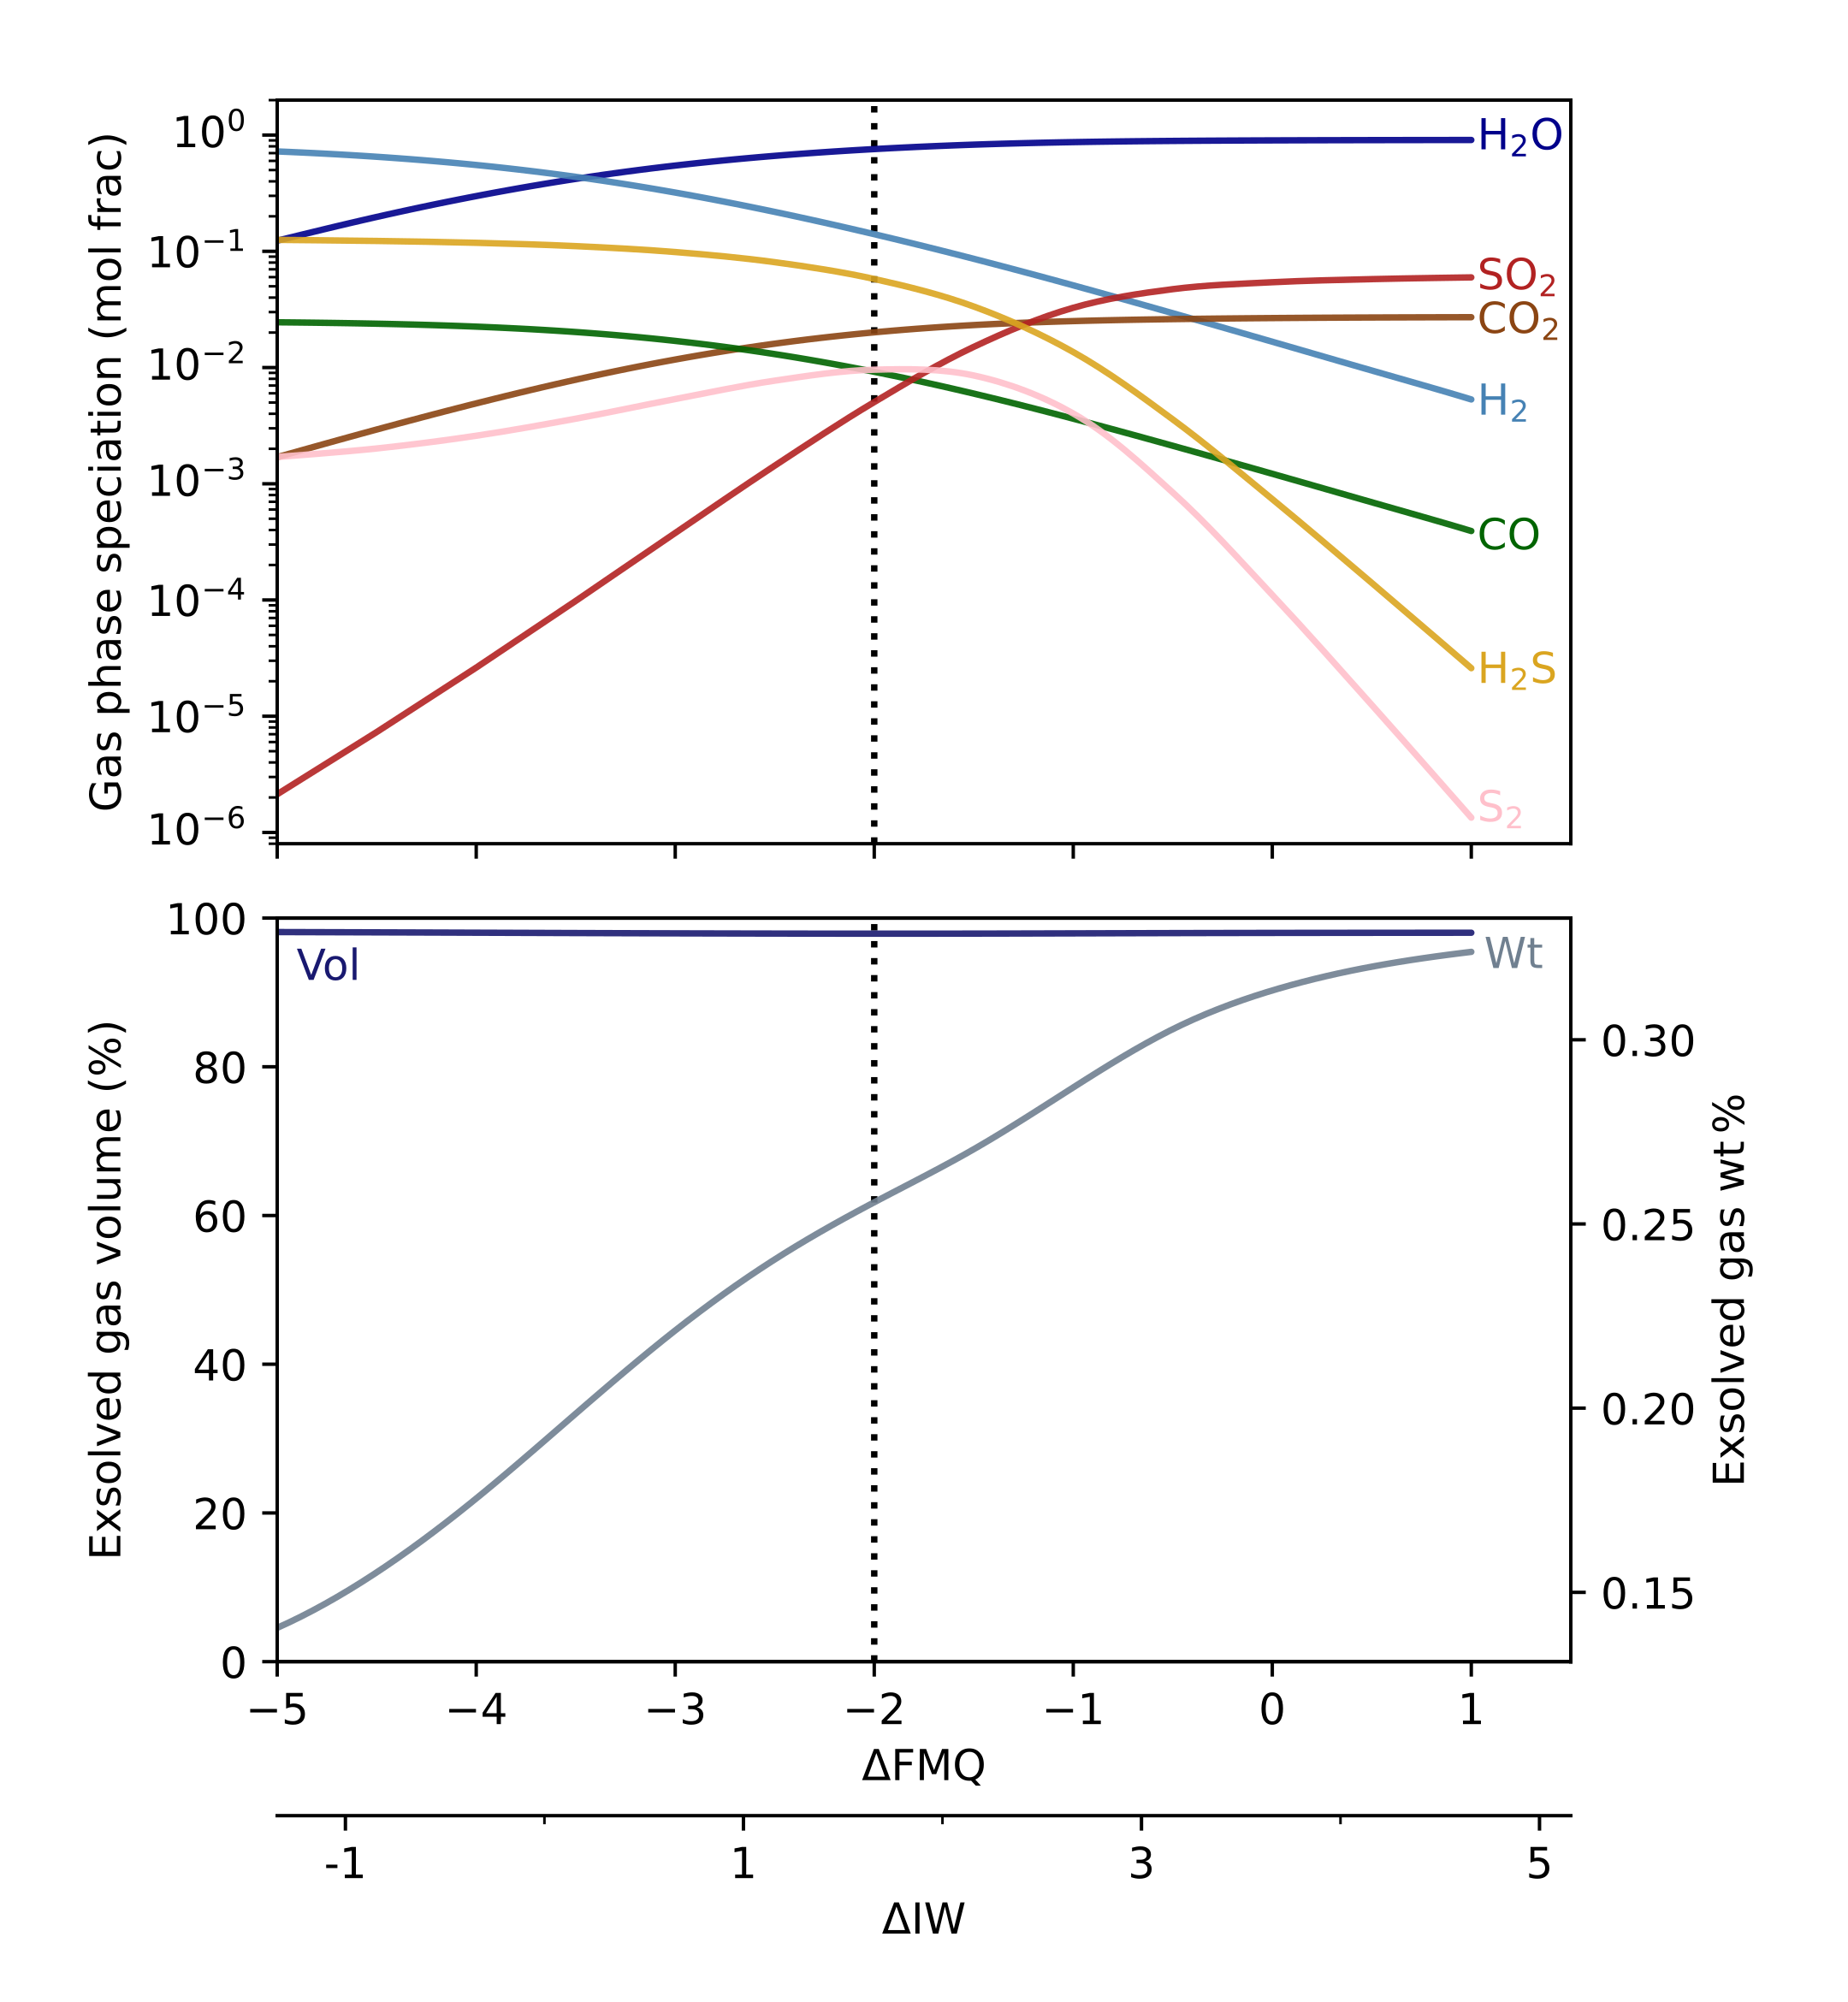
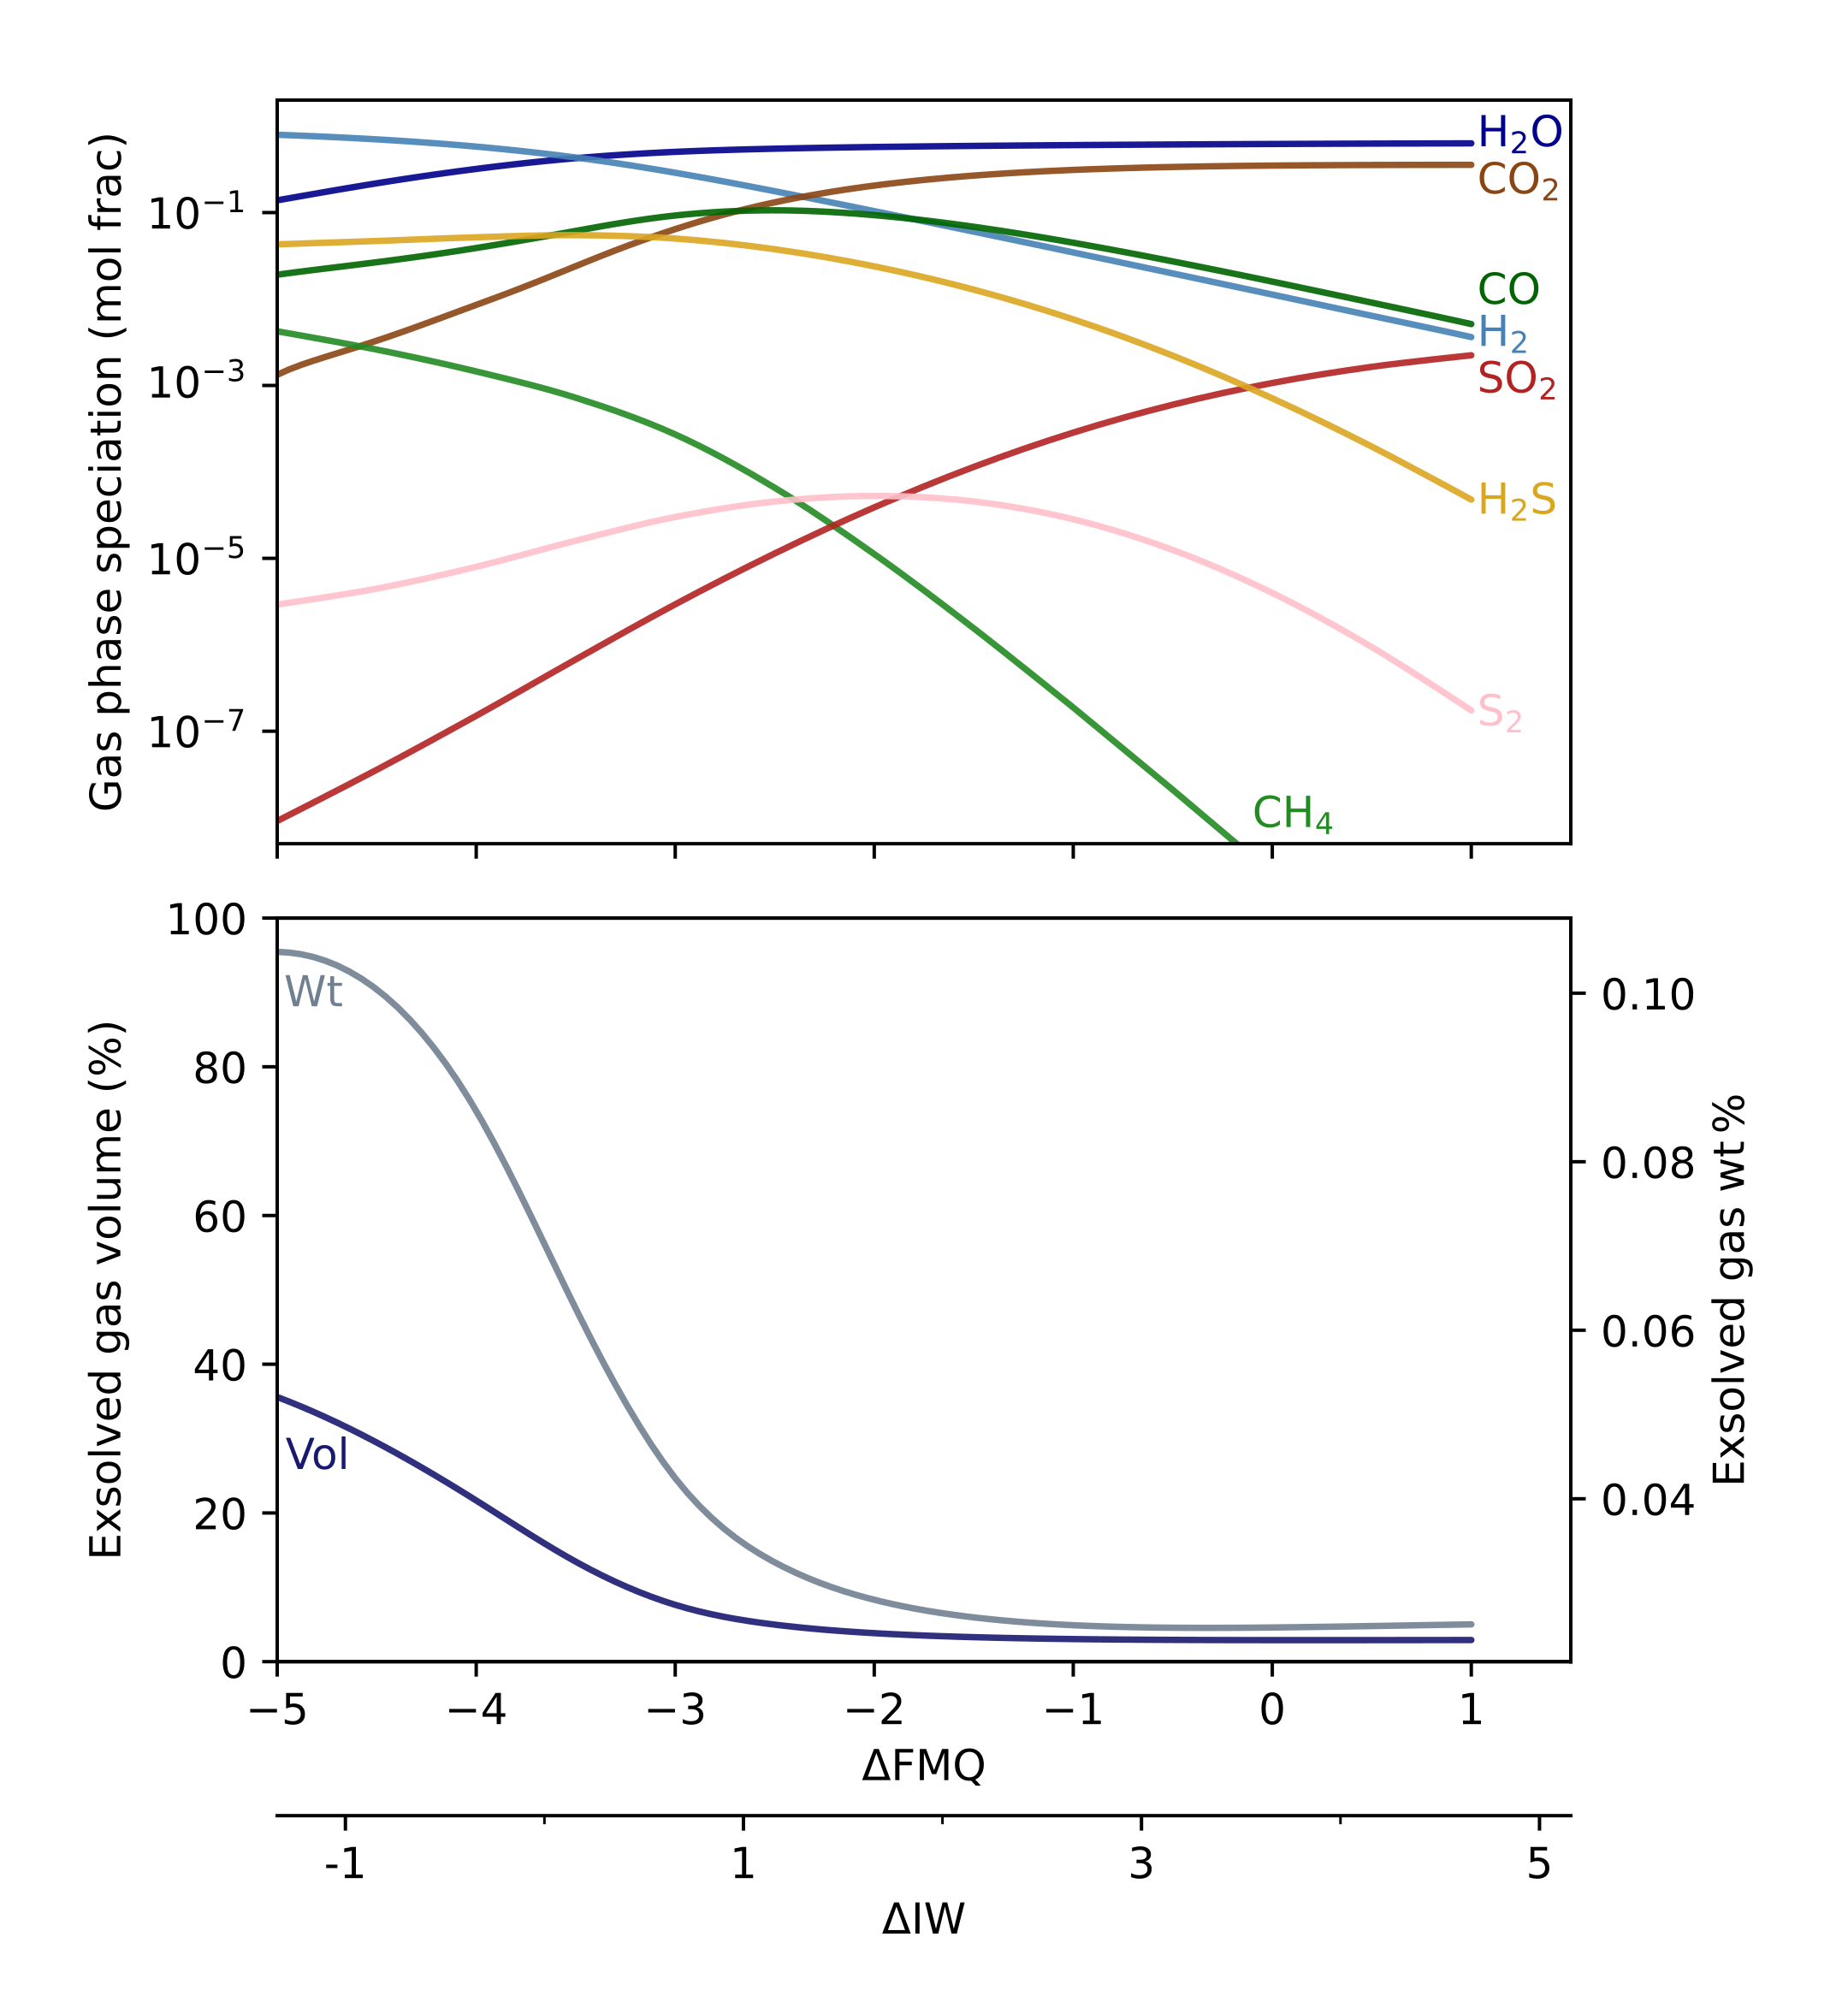
However at high pressures (Fig. 10(b)), the amount of volatile in the gas phase clearly increases from very low fractions with decreasing due to the solubility of a species being linked to it’s fugacity in the gas phase (Eq.7). As the decreases and water in the gas phase dissociates into \ceH2 (or is taken up as \ceH2S in H-poor systems), more water is drawn out of the melt to maintain the \ceH2Omelt ⇌H2Ogas equilibrium. The resulting hydrogen does not dissolve back into the melt, as \ceH2 and \ceH2S have a much lower solubility than water. Similarly, \ceCO2 is converted to insoluble \ceCO and \ceCH4 in the gas phase. The increase in the volatile fraction with decreasing is less obvious at low pressures (Fig. 10(a)), as almost all the volatile elements are already in the gas phase, so the absolute change in volume with is much smaller. With a H-rich magma such as in Fig. 10(b), the lower mean molecular mass of the gas phase is insignificant compared to the amount of volatile exsolving from the melt, so the trend for the weight fraction of gas to decrease is overridden.
There are therefore two factors (pressure and ) which can modulate the amount of volatile released from a magmatic system, independent of the initial volatile load. These two factors interact, so for any melt with a fixed H, C and S content and the same rate of magma flux (mantle heat flow) to the surface, it’s position in and pressure space once it erupts will control the volcanic gas flux (in mol s-1).
The mixing fraction of total hydrogen in a volcanic gas () emitted at 1 bar surface pressure can be seen to vary with the melts initial volatile content, along with the of the erupting melt with reference to the FMQ and IW buffers (Figure 11).
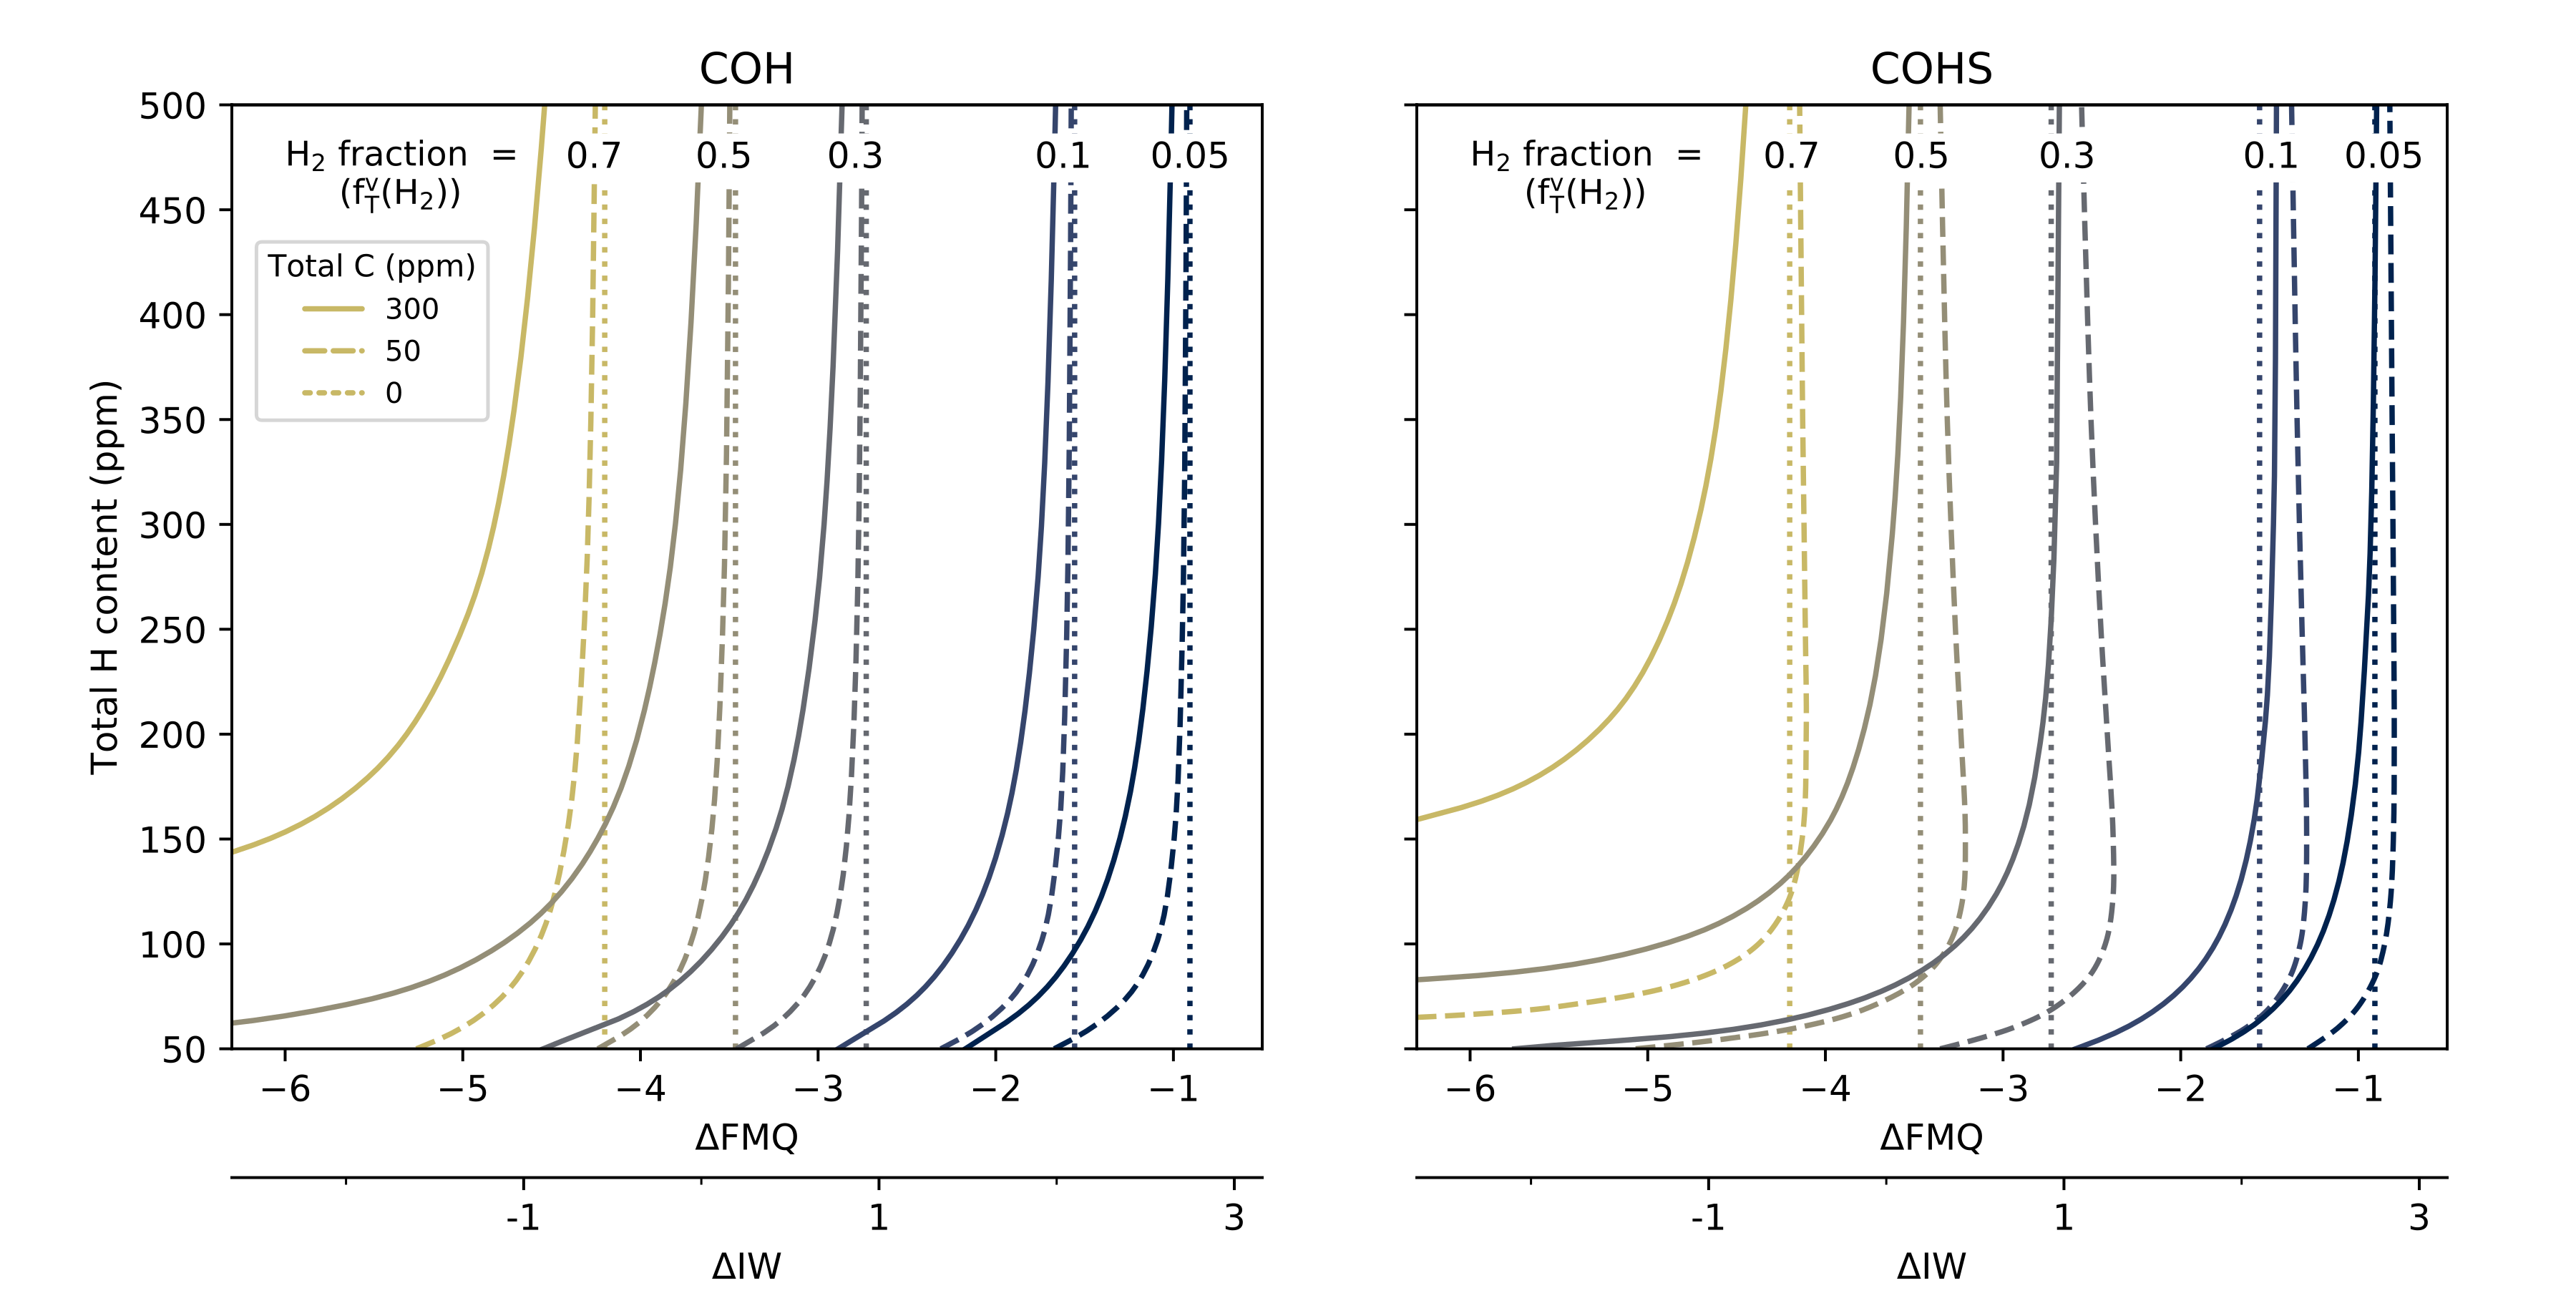
As the total carbon content of the melt increases, a progressively more reduced system is required to achieve the same . In these melts, a greater fraction of the gas volume is made up of carbon bearing species, mostly \ceCO2 and/or CO, which both have low to no solubility in magma at low pressures. Therefore, almost all of the volatile carbon in the system is in the gas phase at 1 bar (see Fig.9) and a greater C content means a larger absolute amount of reduced, H-bearing species are required to achieve the same .
In a H-rich COH system, the gas phase is predominantly \ceH2O (\ceH2 at very low ), whereas in H-poor systems with the same , \ceCO2 and \ceCO are much more dominant. Therefore, to achieve the same , a greater proportion of the water in the system has to be dissociated. With a large volume of water, this dissociation happens easily, but as the available water fraction decreases, a greater reduction in is required to drive the dissociation in eq.2, resulting in the curve towards a lower as the H fraction decreases. A reduced H content also means there is a lower volatile fraction in the system as a whole, and therefore the C-bearing species make up a greater proportion of the total gas phase. In H-poor magmas, the contours asymptote to the fraction of the gas phase made up of H-free, carbon bearing species; the gas phase is then almost entirely composed of \ceH2, \ceCO and at higher , \ceCO2. With higher C contents, this H-free fraction is larger and so the maximum achievable occurs at a correspondingly greater H content.
Adding sulphur to the system has the effect of shifting the contours to a slightly higher , and increasing the H-free gas fraction again to shift the point of maximum achievable to a higher H content. Whereas in the COH system the only species in the fraction are \ceH2 and \ceCH4, which are both present in low to very low fractions at high to moderate , in the COHS system the fraction includes \ceH2S. As \ceH2S can be present in significant fractions at all values discussed here, adding S to the system makes achieving a specific easier than in both the COH and OH systems. The effect of adding S to a system is greatest at around FMQ-3, where the fraction of \ceH2S approaches its maximum value before much of the \ceH2O has strongly dissociated into \ceH2 (Fig.10). This effect is particularly strong in H-poor systems, where \ceH2S becomes the dominant species (as opposed to \ceH2) at low .
Appendix B Outgassing parameterisation
Depending on how the volcanic hydrogen input is defined, the same volcanic conditions an generate a different atmospheric (Fig. 12).
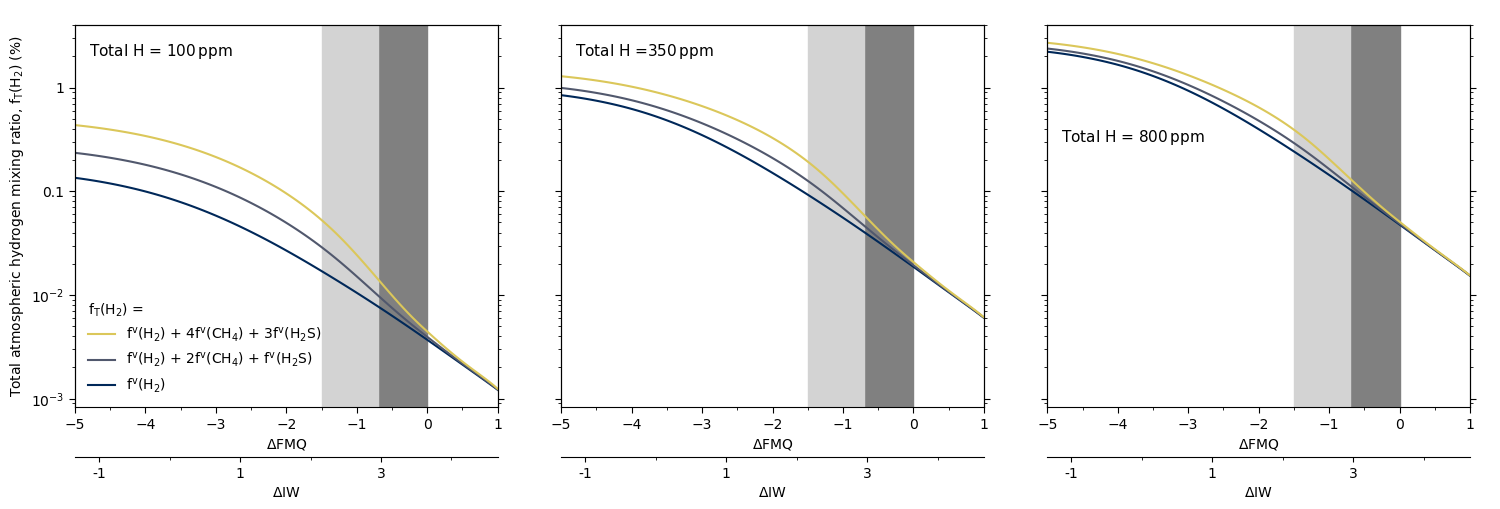
At the lower bound of , only hydrogen emitted as molecular \ceH2 is counted. This ignores any input from other hydrogen bearing species, and assumes they are all removed from the atmosphere via mechanisms which do not release \ceH2. This could be a result of either very efficient \ceH2S deposition, or a sufficiently oxidising atmosphere such that
| (10v) |
preserving atmospheric redox. However, the Archean atmosphere pre-GOE is very unlikely to have been oxidising enough to make this plausible.
On the other end of the scale, the upper bound for is where all the \ceCH4 and \ceH2S is included, weighted according to how much hydrogen will be emitted by an oxidation reaction with each molecule. I.e., one mol of volcanic \ceCH4 is equal to 4 mols of \ceH2 in the atmosphere as it reacts according to
| (10w) |
and \ceH2S produces 3 mols of \ceH2 according to
| (10x) |
This would suggest inefficient \ceH2S deposition and a neutral atmosphere so that \ceH2S and \ceCH4 react sufficiently quickly in the troposphere and lower stratosphere such that
| (10y) |
As seen in Figure 12, the middle ground can be represented by
| (10z) |
This is the same stoichiometry as is used to define above the tropopause weighting \ceCH4 and \ceH2S according to the number of H atoms they contain, and approximates the idea that a proportion of \ceCH4 and \ceH2S will react to \ceH2, with the rest being lost through alternative mechanisms such as an environment where \ceH2S and \ceCH4 deposition may be inefficient, but they are also less reactive in the atmosphere either because the atmosphere is neutral and there is insufficient stellar UV to convert to \ceSO2/\ceCO2 before reaching the homopause. Alternatively, species are photochemically restored as soon as they are reacted away in a reducing atmosphere. Changing the stoichiometry of has the greatest effect at low water contents, where there is a higher ratio of \ceH2S:\ceH2, where the greatest difference between the upper and lower bound is 3.5 at 100 ppm, to 1.3 at 800 ppm \ceH2.
To illustrate the effect of different photochemical regimes on our results for the Archean Earth and early Mars, we show in plots 13(a), 13(b) and 13(c) for Earth and 14(a), 14(b) and 14(c) for Mars the effect of using the three different photochemical regimes.
On Earth, a change in the photochemical regime makes very little difference for oxidised systems above FMQ = 0. The most frequent set of results for achieving 1 % fall in different areas according to the definition of , from low (Fig. 13(a), early range) to high (Fig. 13(c), modern range). However, the range in at FMQ-1.5 is significantly affected, so where in Fig. 13(a) at FMQ-1.5 the most frequent result is 1-3 % , in Fig 13(c) this range is 2-6 %.
For a Mars-like planet with a hydrous melt scenario, a much larger variation is seen over the relevant range. At IW+1, the low regime (Fig 14(a)) has the most frequent results falling into the range 2 - 3 % ; at the same with a high regime, this range is 8 - 12 % (Fig 14(c)). At IW-1, these ranges are 3 - 5 % and 10 - 18 % , for low and high regimes respectively.
Under anhydrous conditions, the ranges for Mars drop so at IW+1, the low regime (Fig 15(a)) has the most frequent results falling into the range 0.1 - 0.2 % ; at the same with a high regime, this range is 1 - 2 % (Fig 14(c)). At IW-1, these ranges are 0.2 - 0.35 % and 2 - 3 % , for low and high regimes respectively.