Constraints on a mixed model of dark matter particles and primordial black holes from the Galactic 511 keV line
Abstract
The galactic 511 keV gamma-ray line has been observed since 1970’s, and was identified as the result of electron-positron annihilation, but the origin of such positrons is still not clear. Apart from the astrophysical explanations, the possibilities that such positrons come from dark matter (DM) annihilation are also widely studied. Primordial black hole (PBH) is also an extensively studied candidate of DM. If PBHs exist, the DM particles may be gravitationally bound to the PBHs and form halo around PBHs with density spikes. DM annihilation in these density spikes can enhance the production rate of positrons from DM particles, but the signal morphology is similar to the decaying DM. We consider such a mixed model consisting of DM particles and PBHs and obtain the upper limit from the data of 511 keV gamma-ray line from INTEGRAL/SPI on the decaying component of DM particles and the constraint on the PBH abundance. These constraints are general and independent of particle DM models. For the mixed model consisting of excited DM and PBHs, the constraints on the PBH abundance can be down to for DM particle with mass around , which is more stringent than that obtained from the extragalactic gamma-ray background.
1 Introduction
In the standard cosmology model, the ordinary baryonic matter only contributes about 5% of the energy budget of the universe, while the rest of the universe, in which 26% is dark matter (DM) and 69% is dark energy (DE), is barely known [1]. There are many DM candidates, including astrophysical objects such as primordial black holes (PBHs), and particles beyond the standard model of particle physics [2].
The PBHs are formed from the gravitational collapse of the overdense regions in the early universe [3, 4, 5], and have recently attracted considerable attention (see review papers [6, 7], and references therein). There are plenty of scenarios that lead to PBH formation [8, 9], and most of them require a mechanism to generate large overdensities. These overdensities are often of inflationary origin, and will collapse if they are larger than a certain threshold when reentering the horizon [10, 11, 12, 13, 14, 15, 16]. Except for being candidate of DM, PBHs can also act as the seeds for galaxy formation [17, 18, 19, 20], and the sources of gravitational waves of LIGO/Virgo detection [21, 22].
In principle either PBH or DM particle can account for the total DM abundance, but there is no requirement that one of them must dominate the total abundance. Indeed, a mixed DM model consisting of DM particles and PBHs can lead to many interesting consequences compared with a single component DM model, even if PBHs only constitute a small fraction of the DM. Such a mixed DM model has been studied before, and has been constrained by the gamma-ray background observed by Fermi-LAT [23, 24, 25]. It can also be constrained by radio searches with the Square Kilometer Array (SKA) and gravitational wave searches with LIGO/Virgo and the future Einstein Telescope (ET) [26].
The 511 keV gamma-ray line was first detected at the galactic center and was identified as the result of electron-positron annihilation in 1970’s [27, 28, 29]. There are also many recent measurements such as the SPI spectrometer on the INTEGRAL observatory (INTEGRAL/SPI) [30] and the COSI balloon telescope [31]. This gamma-ray line is mostly due to parapositronium annihilation of thermal or near-thermal positrons [32, 33], and the absence of continuous high-energy spectrum from positron annihilation in flight implies that the initial energy of these positrons is less than a few MeV [34]. Most plausible sources of positrons are believed to be distributed in the disk of the Galaxy, but this gamma-ray line displays a puzzling morphology with bright emission from an extended bulge region and faint disk emission. Early analyses suggested the flux ratio of bulge-to-disk to be around [35], and more recent analyses give a smaller value around [36, 30]. Positrons injected from the decay of isotopes coming from nucleosynthesis in stars can tentatively explain the emission from the galactic disk [37, 38], but the origin of the emission in the bulge is still under debate.
Many sources have been proposed to explain the origin of the bulge 511 keV gamma-ray line, such as the decay of stellar nucleosynthesis products (e.g. 26Al, 44Ti and 56Ni) [39, 37, 40], the low-mass X-ray binaries [38] and the neutron star mergers [41]. Apart from those astrophysical explanation, given the existence of DM in our galaxy, scenarios that the bulge 511 keV gamma-ray line originated from DM have also been extensively investigated [42, 43, 44, 45, 46, 47, 48]. It is possible that the low-energy galactic positrons are produced by direct annihilation of light dark matter (LDM) (about few MeV) particles into electron-positron pairs [42], or by the excited dark matter (XDM) model. In the XDM model, the DM particles can be heavy, excited states of heavy DM are produced in collisions between DM particles in the ground state, and the electron-positron pairs are produced through the decay of the excited state into the ground state [44, 45]. It was shown that these DM models can be constrained by Cosmic Microwave Background (CMB) observations [49] and the light WIMP (lighter than around 10 MeV) explanation of the 511 keV line was claimed to be excluded [50]. However, there are still models of DM which can avoid these constraints [51, 48], and the recent refined analysis found that LDM with mass down to around 1 MeV can be made consistent with CMB and Big Bang Nucleosynthesis (BBN) observations [52, 53].
The DM scenarios that galactic low-energy positrons originated from the interaction of two DM particles such as direct annihilation or collision, will give a morphology of 511 keV gamma-ray line which depends on the squared density of DM particles , while the DM scenarios that positrons produced from processes like decay of DM particles will give a morphology which depends on the density . Therefore the decaying DM scenarios will lead to a more spread distribution of 511 keV signal than annihilating scenarios, and it was found that the data favor the annihilating DM scenarios [54, 55, 46]. However this dose not rule out subdominant decaying components, since the analyses of 511 keV data in earlier studies are performed only for single-component DM scenarios.
With the existence of PBHs, the DM particles may be gravitationally bound to the PBHs and form halos around PBHs with density spikes [23]. Since the interaction of DM particles is related to the particle density, the formation of density spikes can leave some imprints in the 511 keV gamma-ray line observations. Therefore, by analysing the data of 511 keV gamma-ray line, one can get constraints on both PBHs and DM particles.222We focus on relatively large mass PBHs, PBHs with small mass can also be constrained by 511 keV line as positrons can be produced by its Hawking radiation [56, 57, 58, 59]. As we will show, as to the contribution on the morphology of 511 keV signal, the halo of one PBH is equivalent to one decaying particle, thus the PBH abundance can be constrained stringently by the upper limit of the decaying components.
A DM model with both annihilating and decaying components should be considered. In this article we consider a mixed model consisting of PBHs and self-annihilating DM particles. The PBHs attract DM particles to create density spikes, and contribute to galactic gamma-ray production as a decaying like component. We use 511 keV gamma-ray data from INTEGRAL/SPI to constrain the contribution of such a component, and give an upper limit on the abundance of PBHs. These constraints are general and independent of particle DM models, which means that any particle DM model proposed to explain the 511 keV gamma-ray line observations will always give such constraints on the abundance of PBHs. For the mixed model consisting of XDM and PBHs, the constraints on PBH abundance for DM particle with mass around can be down to , which is much more stringent than that obtained from the extragalactic gamma-ray background.
This paper is organized as follows. In scetion 2, we introduce the DM model consisting of both particle DM and PBHs and explain how it can explain and be constrained by the 511 keV gamma-ray observation. Then we prepare the ingredient for such constrains by performing a bayesian inference on 511 keV gamma-ray data from INTEGRAL/SPI in section 3 and derive the DM halo profile around PBHs in section 4. Finally in section 5 we give the model independent constraints on the PBH abundance for various masses of DM particle and PBH. The final section is devoted to conclusions.
2 511 keV gamma-ray line from the mixed DM model
There are many DM scenarios proposed to explain the 511 keV gamma-ray line, which can be classified into annihilating and decaying scenario. In these scenarios low energy positrons are produced from the DM annihilation/decay in the DM halo, and annihilate with electrons into 511 keV gamma-rays. For a self-annihilating DM model, the positron production rate from the DM annihilation is given by
| (2.1) |
where and are the number densities of positrons and DM particles, respectively, is the thermally averaged cross-section for DM annihilating into positrons.333The factor should be instead of if the DM is not self-annihilating. In the decaying scenario, the positron production rate from the DM decay is given by
| (2.2) |
where is the decay rate.
Most of the annihilating elctron-positron pairs form positronium [60, 61, 32], with a positronium formation fraction [33]. In this process, of the annihilation take place in the parapositronium state yielding 2 photons with which accounts for the observations, while the remaining yield 3 photons with . For these positrons which do not form positronium, they annihilate directly into 2 photons with . Thus the total number density of 511 keV photons produced per unit time is related to the positron production rate,
| (2.3) |
Given a specific DM halo model for the Milky Way, one can compute the intensity distribution of 511 keV signature as a function of galactic longitude and latitude , by integrating the emissivity along the line of sight (l.o.s.), which is
| (2.4) |
with the distance to the Galactic center
| (2.5) |
where denotes the distance from the solar system along the integrated line of sight, and is the distance from the Sun to the Galactic center [62]. Thus the total flux of the 511 keV photons from DM is given by the integral of the intensity distribution,
| (2.6) |
Suppose the density profile of Milky Way DM halo is . For the annihilating DM scenarios, the intensity distribution of its 511 keV signature is
| (2.7) |
while for the decaying scenarios, it is
| (2.8) |
Note that the intensity distribution is for decaying scenarios, while for annihilating scenarios, thus the decaying scenarios will lead to a more spread distribution compared with the annihilating scenarios.
Except for particle DM, PBH is also an extensively studied candidate of DM. There are many experimental constraints on the fraction of PBHs in the DM, it is possible that PBHs with mass in the range constitute all the DM, but for the steller mass PBHs, the constraints suggest that PBHs are subdominant to the rest of DM [7]. The fraction of PBHs in DM is defined as
| (2.9) |
so the corresponding fraction of DM particles is . In this work, we consider a mixed DM model where the DM particle component is dominated, namely, .
Consider the PBH formation in the radiation-dominated era, once the DM particles have kinetically decoupled from the primordial plasma, they could be gravitationally bound to the PBHs and form halo with density spikes. Since we only need that PBHs are formed prior to the kinetic decoupling of DM particles from the primordial plasma, we are not assuming any specific formation mechanism of PBHs.
Denoting the number of positrons produced from the halo of one PBH per unit time by , then the positron production rate from all the halo around PBHs is given by
| (2.10) |
where is the number density of PBHs. Comparing eq. (2.10) with eq.(2.2), we can find that the halo of one PBH is equivalent to one decaying particle, this is the key point for constraining PBH abundance with 511 keV gamma-ray line data.
We consider the mixed model consisting of annihilating DM particles and PBHs, which will give a conservative constraint since if there are additional decaying particle components in DM, the PBH abundance will be constrained more stringently. In such a mixed DM model, the intensity distribution of 511 keV signature from unbounded DM particles and halo of PBHs are
| (2.11) |
and
| (2.12) |
respectively, where and are the mass of DM particles and PBHs, and
| (2.13) |
where is the density profile of DM halo around PBHs. Noticing that there are only annihilating particles and PBHs in the DM, however, as we have explained that the halo of one PBH is equivalent to one decaying particle, which can also be verified by comparing eq. (2.12) with eq. (2.8), therefore the notation means that it is equivalent to decaying DM when one only cares the morphology, but it is not the decaying DM.
Define
| (2.14) | |||
| (2.15) |
then we have
| (2.16) |
The ratio can be inferred from the morphology of 511 keV gamma-ray observations. Along with the density profile of DM halo around PBHs , eq. (2.16) gives constraints on the abundance of PBHs.
3 Fit to INTEGRAL/SPI data
It is found that the morphology of the observed 511 keV gamma-ray line distribution is concentrated in the galactic center, favoring an annihilating DM scenario. While the predicted flux distribution in a decaying DM scenario is too flat to be used to explain the observation [54, 55, 46]. However, this does not necessarily exclude the possibility where decaying DM components exist along with dominant annihilating DM components, and their existence can be constrained by the morphology of 511 keV gamma-ray line observation.
In addition to the DM produced positrons, we also consider the contribution of emission from radioactive isotopes including 26Al and 44Ti in the galactic disk. The distribution of such emissions can be described by Robin young stellar disk (YD) model [63, 35] as
| (3.1) |
with
| (3.2) |
where are coordinates with coordinate origin in galaxy center and - plane in galaxy disk, is the disk scale radius, is the truncation radius and is the vertical scale height. Therefore the intensity distribution of 511 keV signature in this analysis can be written as
| (3.3) |
We perform a bayesian inference over INTEGRAL/SPI data to determine the parameters appeared in eq. (3.3). The three free parameters (, and ) are set with uniform priors in linear space. The shape of the disk emission profile is fixed as , and , which matches the distribution of 1809 keV gamma-ray line from 26Al decay [64]. For , two DM halo profiles, Einasto [65] and NFW [66], are considered separately as
| (3.4) | ||||
| (3.5) |
where , and the local DM density . The INTEGRAL/SPI data of diffusive Galactic emission used in this analysis is extracted from [67], where the gamma-ray intensities are averaged over each latitude interval of each bin and over longitude . The flux is integrated over the energy range . The uncertainties of the data are treated as gaussian errors. Thus the likelihood can be related to the as
| (3.6) |
where and are the central values and uncertainties of gamma-ray intensity measured for each bin, and is the corresponding averaged intensity predicted by models described as eq. (3.3), e.g.,
| (3.7) |
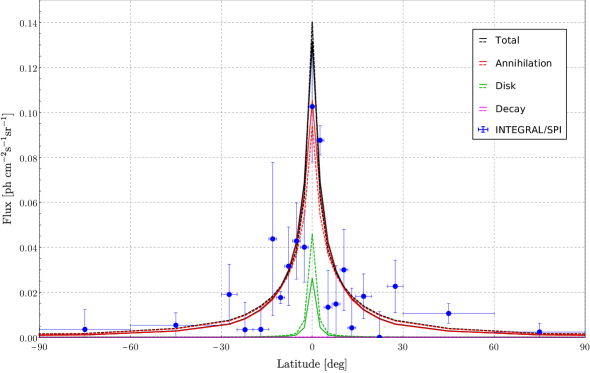
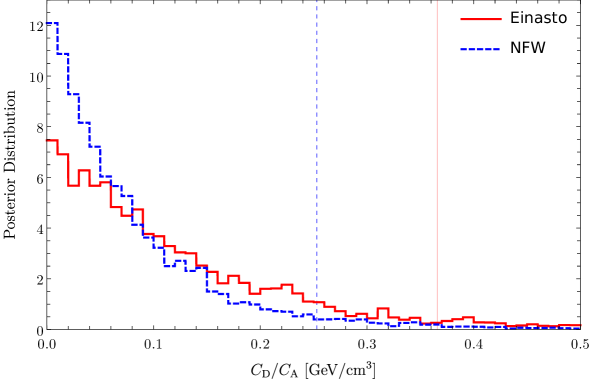
With the likelihood defined in eq. (3.6), the posterior distributions of the three-dimentional parameter space can be numerically sampled using MultiNest [68, 69, 70]. The marginalized 2D joint distributions and 1D posteriors are shown in figure 1. It can be seen that for both DM profiles and have gauss-like posteriors, while the most probable value for converges to zero, with a 95% upper limit of . The favored values for the parameters and their confidence intervals are briefly listed in table 1. With the best-fit model parameters, the predicted 511 keV fluxes are plotted in figure 2 along with data. We also show the ratio of and in table 1 and its posterior distribution as figure 3, which will be used to constrain the abundance of PBH in eq. (2.16).
| Profile | |||||
|---|---|---|---|---|---|
| Einasto | 6.26 | 1.39 | 0 | 0 | |
| NFW | 11.0 | 2.08 | 0 | 0 | |
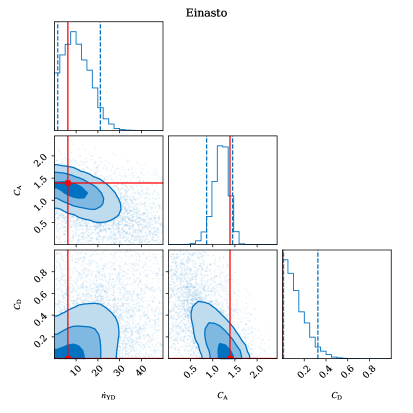
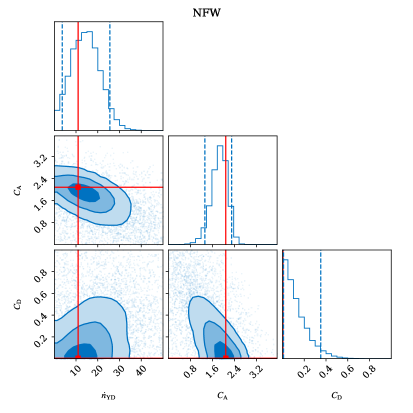
Comparing the two results for different DM profiles, the one with Einasto profile has a better goodness of fit than that with NFW profile, while their best-fit values and confidence regions are consistent without a significant divergence. In both cases, the value for converges to zero, which is consistent with the statement from earlier works [54, 46] that a decaying DM component is disfavored by the observed morphology of 511 keV gamma-ray.
We notice that the fitting result of is larger by about an order of magnitude than those given in [54, 46] which were obtained by fitting galactic 511 keV line with only annihilating DM. This discrepancy can be explained by the data used in our analysis. The integrated energy range of the data we used () are larger than that used in those works. This leads to a higher flux by about an order of magnitude, resulting in a larger estimated values of both and . However, it is that matters when one constrains the PBH abundance, where the discrepancy is canceled.
4 Density profile of halo around PBHs
For a DM particle at position with velocity , it would spend a fraction of its period at distances between and ,444Due to the symmetry of the orbit, the particle passes the same radius twice, which leads to the factor of 2 [23]. where is the period of the particle’s orbital motion around the PBH and is the time it takes for the particle to move from to . Suppose the PBH forms at time , given the initial density of DM particles , at later time , the density of DM particle halo around PBHs can be written as the relation [23, 24]
| (4.1) |
which follows from the Liouville equation and expresses the density conservation law in phase space integrated over the momenta by taking into account the volume transformation in momentum space, where the velocity distribution of DM particles is chosen to be Maxwell-Boltzmann distribution,
| (4.2) |
with and the temperature of the primordial plasma . Therefore, we have
| (4.3) |
In figure 4, we show the density profile of DM particles bound to a PBH as a function of the rescaled radius (where ) with DM particles whose mass and temperature of kinetic decoupling . The density profile for the lighter PBH constitutes an envelope to the profile for the heavier PBH, this is because the maximum rescaled radius that a PBH can gravitationally affect, i.e. (where is the energy density of the radiation-dominated universe), is smaller for the heavier PBH.
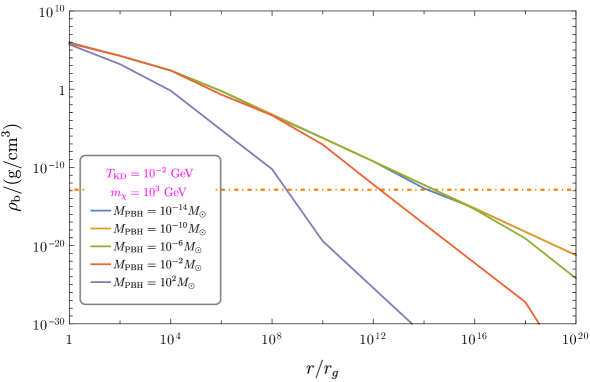
For the annihilating DM particles, their density will decrease with time, and there will be a maximum possible density at present time which is given by [72]
| (4.4) |
where is the age of the universe [1], and is the thermally averaged cross-section for annihilation of DM particles, which is chosen to be in order to match the observed relic density.555Note that is different from which only accounts for the channel of DM to positron. Therefore the density profile of DM particle halo around PBH is
| (4.5) |
with critical radius satisfying . As shown in figure 4, increases as decreases and when smaller than a certain value, will be about constant.
5 Constraints on PBHs
With the upper limit of obtained from 511 keV data in section 3 and the density profile of halo around PBHs eq. (4.5), the constraints on the abundance of PBHs in the total DM eq. (2.16) can be written as
| (5.1) | ||||
Since the density profile outside of decreases fastly, we neglect the contributions from the parts out of , which gives the last inequality of eq. (5.1) and make the constraint more conservative. And we apply the 95% upper limit of for Einasto profile as it gives a better goodness of fit. The constraints on the PBH abundance for different DM masses and DM kinetic decoupling temperatures are shown in figure 5.
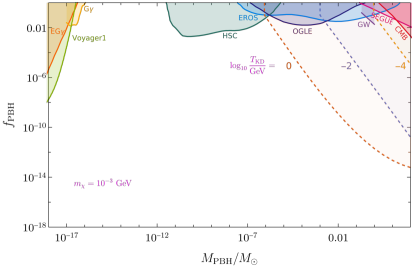
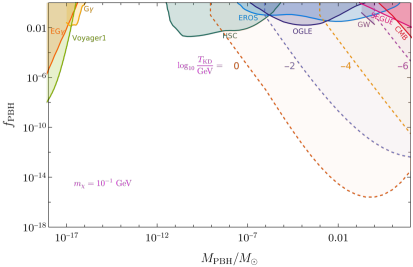
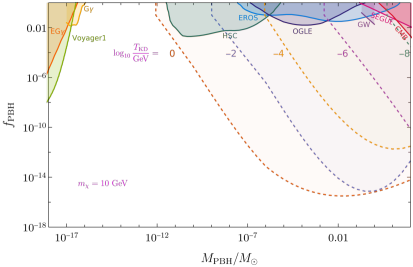
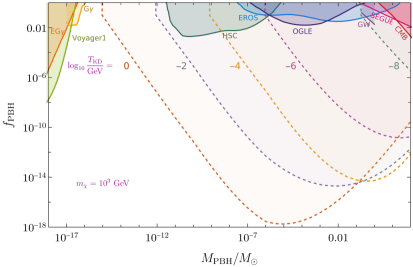
We cut the constraints at because we have assumed . One can find that DM particle with larger mass and higher kinetic decoupling temperature will give more stringent constraints, which is due to that such particles can form denser halo around the PBHs and lead more emissions of 511 keV photons. The constraints have slope in the relative small mass range which results from the fact that is about constant for PBHs with mass in the relatively small mass range as shown in figure 4.
Noticing that these constraints are general and independent of particle DM models, which means that any particle DM model proposed to explain the 511 keV gamma-ray line observations will give such constraints on the abundance of PBHs. For a given DM model, once one knows the mass and the kinetic decoupling temperature of DM particles, one can quickly get the constraints on the PBH abundance from figure 5.
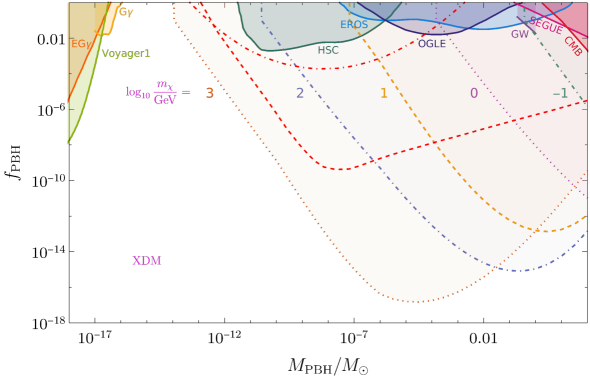
Among the scenarios proposed to explain the 511 keV gamma-ray line, there are two typical models, LDM and XDM. For the LDM scenario, the low-energy galactic positrons are produced by direct annihilation of the LDM (about few MeV) particles into electron-positron pairs [42]. For the XDM scenario, the DM particle has an excited state 1-2 MeV above the ground state, which may be collisionally excited and de-excited by positron-electron pair emission, which converts the kinetic energy of DM into positron-electron pairs [44, 45]. Although the positrons are not produced by directly annihilation in the XDM scenario, the positron production rate is also given by eq. (2.1) in such a scenario, thus the analyses for the mixed DM consisting of annihilating particles and PBHs can also be applied to the XDM scenario.
As a demonstration, we consider an XDM scenario and apply the relation between the kinetic decoupling temperature and mass for DM particles given by [81, 82, 83, 24]: , where is the gamma function, where is the effective number of relativistic degrees of freedom. Therefore the constraints on the PBH abundance in a mixed DM model with XDM and PBHs are dependent on the mass of DM particles. We show the constraints with different mass of DM particles in figure 6. One can find that the constraints from 511 keV gamma-ray line observations can be down to for XDM with , which are much more stringent than the constraints obtained from the extragalactic gamma-ray background (down to ) [24, 25], and one should remember that these constraints are still conservative since we neglected the contributions of halo out of and did not consider additional decaying particle components as mentioned before. On the other hand, such stringent constraints on PBHs means that the observation about PBHs can give a stringent constraint on DM explanations of 511 keV gamma-ray line observations and can help us to understand the origin of galactic 511 keV signal.
Considering the velocity dependence of the thermally averaged cross-section , we estimate the particle velocity distribution function of the Milky Way DM halo and the spike halo around PBHs, by using Eddington’s formula [84, 85]. The results show the average particle velocity of the spike halo around PBHs is larger than that of the Milky Way DM halo for particles with , which could lead to more stringent constraints, and more details should be studied in future.
In this work, we get constraints from the data of INTEGRAL/SPI. Assuming that the positrons annihilate close to their birth positions, then eq. (2.12) implies that there may be point sources of 511 keV emission. There is a study searching for the 511 keV gamma-ray line from galactic compact objects with the IBIS gamma ray telescope [86], which can also be used to constrain this mixed DM model. Due to the sensitivity of IBIS, current constraints from compact objects is looser than the one from INTEGRAL/SPI, but it has chance to give more stringent constraints in the future with the improvement of sensitivity.
6 Conclusions
The 511 keV gamma-ray line has been observed since 1970’s but its origin is still not yet clearly known. Apart from the astrophysical explanations, the possibilities that this signal comes from DM are also investigated extensively. Among these DM explanations, it was found that DM decaying scenarios are disfavored by data, but this statement was obtained from data analyses which only consider single component DM models. Since there is no evidence that DM is composed of only one component, we analyze the data of 511 keV gamma-ray line measured by INTEGRAL/SPI for the DM model consisting of both annihilating and decaying components. Our work confirms the statement in earlier studies, and what more important is that we obtain the upper limit of the decaying components.
Except for particle DM, PBH is also an extensively studied candidate of DM. With the existence of PBHs, the DM particles may be gravitationally bound to the PBHs and form halo around PBHs with density spikes. These density spikes can enhance the production rate of positrons from DM particles, thus they can be constrained by the observations of 511 keV line.
We consider a mixed model consisting of annihilating DM particles and PBHs, calculate the density profile of halo around PBHs, and get the constraints on the PBH abundance. These constraints are general and independent of particle DM models, which means that any particle DM model proposed to explain the 511 keV gamma-ray line observations will give such constraints on the abundance of PBHs. For a given DM model, once one knows the mass and the kinetic decoupling temperature of DM particles, one can quickly get the constraint on the PBH abundance from figure 5. For the mixed DM model consisting of XDM and PBHs, the constraints on the PBH abundance for DM particles with mass around can be down to , which is much more stringent than that obtained from the extragalactic gamma-ray background. These constraints are still conservative, and we expect the more stringent constraints can be obtained with more detailed studies and the improving sensitivity of experiments.
Acknowledgments
We thank Shao-Jiang Wang and Yong Zhou for useful discussions. RGC and XYY are supported in part by the National Natural Science Foundation of China Grants No. 11947302, No. 11991052, No. 11690022, No. 11821505 and No. 11851302, and by the Strategic Priority Research Program of CAS Grant No. XDB23030100, and by the Key Research Program of Frontier Sciences of CAS. YCD and YFZ are partly supported by the National Key R&D Program of China No. 2017YFA0402204 and by the National Natural Science Foundation of China (NSFC) No. 11825506, No. 11821505, No. U1738209, No. 11851303 and No. 11947302.
References
- [1] Planck collaboration, N. Aghanim et al., Planck 2018 results. VI. Cosmological parameters, 1807.06209.
- [2] G. Bertone and D. Hooper, History of dark matter, Rev. Mod. Phys. 90 (2018) 045002, [1605.04909].
- [3] Y. B. Zel’dovich and I. D. Novikov, The Hypothesis of Cores Retarded during Expansion and the Hot Cosmological Model, Sov. Astron. 10 (Feb., 1967) 602.
- [4] S. Hawking, Gravitationally collapsed objects of very low mass, Mon. Not. Roy. Astron. Soc. 152 (1971) 75.
- [5] B. J. Carr and S. W. Hawking, Black holes in the early Universe, Mon. Not. Roy. Astron. Soc. 168 (1974) 399–415.
- [6] M. Sasaki, T. Suyama, T. Tanaka and S. Yokoyama, Primordial black holes—perspectives in gravitational wave astronomy, Class. Quant. Grav. 35 (2018) 063001, [1801.05235].
- [7] B. Carr, K. Kohri, Y. Sendouda and J. Yokoyama, Constraints on Primordial Black Holes, 2002.12778.
- [8] J. Liu, Z.-K. Guo and R.-G. Cai, Primordial Black Holes from Cosmic Domain Walls, Phys. Rev. D 101 (2020) 023513, [1908.02662].
- [9] R.-G. Cai, Z.-K. Guo, J. Liu, L. Liu and X.-Y. Yang, Primordial black holes and gravitational waves from parametric amplification of curvature perturbations, JCAP 06 (2020) 013, [1912.10437].
- [10] E. D. Stewart, Flattening the inflaton’s potential with quantum corrections, Phys. Lett. B391 (1997) 34–38, [hep-ph/9606241].
- [11] E. D. Stewart, Flattening the inflaton’s potential with quantum corrections. 2., Phys. Rev. D56 (1997) 2019–2023, [hep-ph/9703232].
- [12] S. M. Leach, I. J. Grivell and A. R. Liddle, Black hole constraints on the running mass inflation model, Phys. Rev. D62 (2000) 043516, [astro-ph/0004296].
- [13] S.-L. Cheng, W. Lee and K.-W. Ng, Primordial black holes and associated gravitational waves in axion monodromy inflation, JCAP 1807 (2018) 001, [1801.09050].
- [14] T.-J. Gao and Z.-K. Guo, Primordial Black Hole Production in Inflationary Models of Supergravity with a Single Chiral Superfield, Phys. Rev. D98 (2018) 063526, [1806.09320].
- [15] C. Germani and T. Prokopec, On primordial black holes from an inflection point, Phys. Dark Univ. 18 (2017) 6–10, [1706.04226].
- [16] T. Nakama and Y. Wang, Do we need fine-tuning to create primordial black holes?, Phys. Rev. D99 (2019) 023504, [1811.01126].
- [17] R. Bean and J. Magueijo, Could supermassive black holes be quintessential primordial black holes?, Phys. Rev. D66 (2002) 063505, [astro-ph/0204486].
- [18] M. Kawasaki, A. Kusenko and T. T. Yanagida, Primordial seeds of supermassive black holes, Phys. Lett. B711 (2012) 1–5, [1202.3848].
- [19] T. Nakama, B. Carr and J. Silk, Limits on primordial black holes from distortions in cosmic microwave background, Phys. Rev. D97 (2018) 043525, [1710.06945].
- [20] B. Carr and J. Silk, Primordial Black Holes as Generators of Cosmic Structures, Mon. Not. Roy. Astron. Soc. 478 (2018) 3756–3775, [1801.00672].
- [21] S. Bird, I. Cholis, J. B. Muñoz, Y. Ali-Haïmoud, M. Kamionkowski, E. D. Kovetz et al., Did LIGO detect dark matter?, Phys. Rev. Lett. 116 (2016) 201301, [1603.00464].
- [22] M. Sasaki, T. Suyama, T. Tanaka and S. Yokoyama, Primordial Black Hole Scenario for the Gravitational-Wave Event GW150914, Phys. Rev. Lett. 117 (2016) 061101, [1603.08338].
- [23] Y. Eroshenko, Dark matter density spikes around primordial black holes, Astron. Lett. 42 (2016) 347–356, [1607.00612].
- [24] S. M. Boucenna, F. Kuhnel, T. Ohlsson and L. Visinelli, Novel Constraints on Mixed Dark-Matter Scenarios of Primordial Black Holes and WIMPs, JCAP 07 (2018) 003, [1712.06383].
- [25] J. Adamek, C. T. Byrnes, M. Gosenca and S. Hotchkiss, WIMPs and stellar-mass primordial black holes are incompatible, Phys. Rev. D 100 (2019) 023506, [1901.08528].
- [26] G. Bertone, A. M. Coogan, D. Gaggero, B. J. Kavanagh and C. Weniger, Primordial Black Holes as Silver Bullets for New Physics at the Weak Scale, Phys. Rev. D 100 (2019) 123013, [1905.01238].
- [27] I. Johnson, W. N., J. Harnden, F. R. and R. C. Haymes, The Spectrum of Low-Energy Gamma Radiation from the Galactic-Center Region., ApJ 172 (1972) L1.
- [28] R. C. Haymes, G. D. Walraven, C. A. Meegan, R. D. Hall, F. T. Djuth and D. H. Shelton, Detection of nuclear gamma rays from the galactic center region., ApJ 201 (1975) 593–602.
- [29] M. Leventhal, C. Maccallum and P. Stang, Detection of 511 kev positron annihilation radiation from the galactic center direction, ApJ 225 (1978) .
- [30] T. Siegert, R. Diehl, G. Khachatryan, M. G. Krause, F. Guglielmetti, J. Greiner et al., Gamma-ray spectroscopy of Positron Annihilation in the Milky Way, Astron. Astrophys. 586 (2016) A84, [1512.00325].
- [31] C. Kierans et al., Detection of the 511 keV Galactic positron annihilation line with COSI, Astrophys. J. 895 (2020) 44, [1912.00110].
- [32] E. Churazov, R. Sunyaev, S. Sazonov, M. Revnivtsev and D. Varshalovich, Positron annihilation spectrum from the Galactic Center region observed by SPI/INTEGRAL, Mon. Not. Roy. Astron. Soc. 357 (2005) 1377–1386, [astro-ph/0411351].
- [33] P. Jean, J. Knodlseder, W. Gillard, N. Guessoum, K. Ferriere, A. Marcowith et al., Spectral analysis of the galactic e+ e- annihilation emission, Astron. Astrophys. 445 (2006) 579–589, [astro-ph/0509298].
- [34] J. F. Beacom and H. Yuksel, Stringent constraint on galactic positron production, Phys. Rev. Lett. 97 (2006) 071102, [astro-ph/0512411].
- [35] J. Knodlseder et al., The All-sky distribution of 511 keV electron-positron annihilation emission, Astron. Astrophys. 441 (2005) 513–532, [astro-ph/0506026].
- [36] L. Bouchet, J.-P. Roques and E. Jourdain, On the morphology of the electron-positron annihilation emission as seen by SPI/INTEGRAL, Astrophys. J. 720 (2010) 1772–1780, [1007.4753].
- [37] N. Prantzos et al., The 511 keV emission from positron annihilation in the Galaxy, Rev. Mod. Phys. 83 (2011) 1001–1056, [1009.4620].
- [38] R. Bartels, F. Calore, E. Storm and C. Weniger, Galactic binaries can explain the Fermi Galactic centre excess and 511 keV emission, Mon. Not. Roy. Astron. Soc. 480 (2018) 3826–3841, [1803.04370].
- [39] P. Milne, L. The and M. Leising, Positron escape from type ia supernovae, Astrophys. J. Suppl. 124 (1999) 503–526, [astro-ph/9901206].
- [40] R. M. Crocker et al., Diffuse Galactic antimatter from faint thermonuclear supernovae in old stellar populations, 1607.03495.
- [41] G. M. Fuller, A. Kusenko, D. Radice and V. Takhistov, Positrons and 511 keV Radiation as Tracers of Recent Binary Neutron Star Mergers, Phys. Rev. Lett. 122 (2019) 121101, [1811.00133].
- [42] C. Boehm, D. Hooper, J. Silk, M. Casse and J. Paul, MeV dark matter: Has it been detected?, Phys. Rev. Lett. 92 (2004) 101301, [astro-ph/0309686].
- [43] C. Boehm and Y. Ascasibar, More evidence in favour of light dark matter particles?, Phys. Rev. D 70 (2004) 115013, [hep-ph/0408213].
- [44] D. P. Finkbeiner and N. Weiner, Exciting Dark Matter and the INTEGRAL/SPI 511 keV signal, Phys. Rev. D 76 (2007) 083519, [astro-ph/0702587].
- [45] M. Pospelov and A. Ritz, The galactic 511 keV line from electroweak scale WIMPs, Phys. Lett. B 651 (2007) 208–215, [hep-ph/0703128].
- [46] A. C. Vincent, P. Martin and J. M. Cline, Interacting dark matter contribution to the Galactic 511 keV gamma ray emission: constraining the morphology with INTEGRAL/SPI observations, JCAP 04 (2012) 022, [1201.0997].
- [47] J.-R. Cudell, M. Y. Khlopov and Q. Wallemacq, Dark atoms and the positron-annihilation-line excess in the galactic bulge, 1401.5228.
- [48] Y. Farzan and M. Rajaee, Pico-charged intermediate particles rescue dark matter interpretation of 511 keV signal, JHEP 12 (2017) 083, [1708.01137].
- [49] A. R. Frey and N. B. Reid, Cosmic microwave background constraints on dark matter models of the Galactic center 511 keV signal, Phys. Rev. D 87 (2013) 103508, [1301.0819].
- [50] R. J. Wilkinson, A. C. Vincent, C. Bœhm and C. McCabe, Ruling out the light weakly interacting massive particle explanation of the Galactic 511 keV line, Phys. Rev. D 94 (2016) 103525, [1602.01114].
- [51] K. Lawson and A. Zhitnitsky, Quark nugget dark matter: no contradiction with 511 keV line emission from dwarf galaxies, JCAP 02 (2017) 049, [1611.05900].
- [52] N. Sabti, J. Alvey, M. Escudero, M. Fairbairn and D. Blas, Refined Bounds on MeV-scale Thermal Dark Sectors from BBN and the CMB, JCAP 01 (2020) 004, [1910.01649].
- [53] Y. Ema, F. Sala and R. Sato, Dark matter models for the 511 keV galactic line predict keV electron recoils on Earth, 2007.09105.
- [54] Y. Ascasibar, P. Jean, C. Boehm and J. Knoedlseder, Constraints on dark matter and the shape of the Milky Way dark halo from the 511-keV line, Mon. Not. Roy. Astron. Soc. 368 (2006) 1695–1705, [astro-ph/0507142].
- [55] Z. Abidin, A. Afanasev and C. E. Carlson, Positron production scenarios and the angular profile of the galactic center 511-keV line, 1006.5444.
- [56] W. DeRocco and P. W. Graham, Constraining primordial black hole abundance with the Galactic 511 keV line, Phys. Rev. Lett. 123 (2019) 251102, [1906.07740].
- [57] R. Laha, Primordial black holes as a dark matter candidate are severely constrained by the Galactic Center 511 keV gamma-ray line, Phys. Rev. Lett. 123 (2019) 251101, [1906.09994].
- [58] B. Dasgupta, R. Laha and A. Ray, Neutrino and positron constraints on spinning primordial black hole dark matter, 1912.01014.
- [59] R. Laha, J. B. Muñoz and T. R. Slatyer, INTEGRAL constraints on primordial black holes and particle dark matter, Phys. Rev. D 101 (2020) 123514, [2004.00627].
- [60] M. Harris, B. Teegarden, T. Cline, N. Gehrels, D. Palmer, R. Ramaty et al., Transient Gamma-Ray Spectrometer Measurements of the Positron Annihilation Spectrum from the Galactic Center, Astrophys. J. 501 (1998) L55, [astro-ph/9803247].
- [61] R. Kinzer, P. Milne, J. Kurfess, M. Strickman, W. Johnson and W. Purcell, Positron annihilation radiation from the inner galaxy, Astrophys. J. 559 (2001) 282–295.
- [62] T. Camarillo, V. Mathur, T. Mitchell and B. Ratra, Median Statistics Estimate of the Distance to the Galactic Center, Publ. Astron. Soc. Pac. 130 (2018) 024101, [1708.01310].
- [63] A. C. Robin, C. Reyle, S. Derriere and S. Picaud, A Synthetic view on structure and evolution of the Milky Way, Astron. Astrophys. 409 (2003) 523, [astro-ph/0401052].
- [64] R. Diehl et al., 26al in the inner galaxy, Astron. Astrophys. 449 (2006) 1025–1031, [astro-ph/0512334].
- [65] J. Einasto, Dark Matter, 1, 2009. 0901.0632.
- [66] J. F. Navarro, C. S. Frenk and S. D. White, A Universal density profile from hierarchical clustering, Astrophys. J. 490 (1997) 493–508, [astro-ph/9611107].
- [67] L. Bouchet, A. W. Strong, T. A. Porter, I. V. Moskalenko, E. Jourdain and J.-P. Roques, Diffuse emission measurement with INTEGRAL/SPI as indirect probe of cosmic-ray electrons and positrons, Astrophys. J. 739 (2011) 29, [1107.0200].
- [68] F. Feroz, M. Hobson, E. Cameron and A. Pettitt, Importance Nested Sampling and the MultiNest Algorithm, 1306.2144.
- [69] F. Feroz, M. Hobson and M. Bridges, MultiNest: an efficient and robust Bayesian inference tool for cosmology and particle physics, Mon. Not. Roy. Astron. Soc. 398 (2009) 1601–1614, [0809.3437].
- [70] F. Feroz and M. Hobson, Multimodal nested sampling: an efficient and robust alternative to MCMC methods for astronomical data analysis, Mon. Not. Roy. Astron. Soc. 384 (2008) 449, [0704.3704].
- [71] D. Foreman-Mackey, corner.py: Scatterplot matrices in python, The Journal of Open Source Software 1 (jun, 2016) 24.
- [72] T. Bringmann, P. Scott and Y. Akrami, Improved constraints on the primordial power spectrum at small scales from ultracompact minihalos, Phys. Rev. D 85 (2012) 125027, [1110.2484].
- [73] B. J. Carr, K. Kohri, Y. Sendouda and J. Yokoyama, New cosmological constraints on primordial black holes, Phys. Rev. D81 (2010) 104019, [0912.5297].
- [74] M. Boudaud and M. Cirelli, Voyager 1 Further Constrain Primordial Black Holes as Dark Matter, Phys. Rev. Lett. 122 (2019) 041104, [1807.03075].
- [75] H. Niikura et al., Microlensing constraints on primordial black holes with Subaru/HSC Andromeda observations, Nat. Astron. 3 (2019) 524–534, [1701.02151].
- [76] EROS-2 collaboration, P. Tisserand et al., Limits on the Macho Content of the Galactic Halo from the EROS-2 Survey of the Magellanic Clouds, Astron. Astrophys. 469 (2007) 387–404, [astro-ph/0607207].
- [77] H. Niikura, M. Takada, S. Yokoyama, T. Sumi and S. Masaki, Constraints on Earth-mass primordial black holes from OGLE 5-year microlensing events, Phys. Rev. D99 (2019) 083503, [1901.07120].
- [78] LIGO Scientific, Virgo collaboration, B. P. Abbott et al., Search for sub-solar mass ultracompact binaries in Advanced LIGO’s second observing run, Phys. Rev. Lett. 123 (2019) 161102, [1904.08976].
- [79] S. M. Koushiappas and A. Loeb, Dynamics of Dwarf Galaxies Disfavor Stellar-Mass Black Holes as Dark Matter, Phys. Rev. Lett. 119 (2017) 041102, [1704.01668].
- [80] V. Poulin, P. D. Serpico, F. Calore, S. Clesse and K. Kohri, CMB bounds on disk-accreting massive primordial black holes, Phys. Rev. D96 (2017) 083524, [1707.04206].
- [81] T. Bringmann and S. Hofmann, Thermal decoupling of WIMPs from first principles, JCAP 04 (2007) 016, [hep-ph/0612238].
- [82] T. Bringmann, Particle Models and the Small-Scale Structure of Dark Matter, New J. Phys. 11 (2009) 105027, [0903.0189].
- [83] L. Visinelli and P. Gondolo, Kinetic decoupling of WIMPs: analytic expressions, Phys. Rev. D 91 (2015) 083526, [1501.02233].
- [84] B.-Q. Lu, Y.-L. Wu, W.-H. Zhang and Y.-F. Zhou, Constraints on the Sommerfeld-enhanced dark matter annihilation from the gamma rays of subhalos and dwarf galaxies, JCAP 04 (2018) 035, [1711.00749].
- [85] J. Binney and S. Tremaine, Galactic Dynamics: Second Edition. 2008.
- [86] G. De Cesare, Searching for the 511 keV annihilation line from galactic compact objects with the IBIS gamma ray telescope, Astron. Astrophys. 531 (2011) A56, [1105.0367].