Optical Mass Spectrometry of Cold and
Abstract
We present an all-optical mass spectrometry technique to identify trapped ions. The new method uses laser-cooled ions to determine the mass of a cotrapped dark ion with a sub-dalton resolution within a few seconds. We apply the method to identify the first controlled synthesis of cold, trapped and . These molecules are promising for their sensitivity to time and parity violations that could constrain sources of new physics beyond the standard model. The nondestructive nature of the mass spectrometry technique may help identify molecular ions or highly charged ions prior to optical spectroscopy. Unlike previous mass spectrometry techniques for small ion crystals that rely on scanning, the method uses a Fourier transform that is inherently broadband and comparatively fast. The technique’s speed provides new opportunities for studying state-resolved chemical reactions in ion traps.
Introduction.—Ion traps are powerful tools because their ability to trap only depends on two properties: the mass and charge of a particle. Therefore they can trap ionic species with rich internal structures that preclude laser cooling or fluorescence. Such dark ions include molecules, highly charged ions, and atoms with transitions that are deep in the UV. These ions can be sympathetically cooled by cotrapped laser-cooled ions, where they appear as dark ion defects in a Coulomb crystal. Dark ions have seen great successes in optical clocks, e.g., \ceAl+[1], constraining new physics, e.g., \ceHfF+[2] and studying state-resolved chemical reactions, e.g., \ceBaCl+[3] and \ceRbSr+[4]. There has also been much progress with highly charged ions, which generally lack strong fluorescence transitions, for metrology and tests of fundamental constant variations [5, 6, 7]. In this work we have synthesized a pair of molecular ions that are promising for probing new physics: \ceRaOH+ and \ceRaOCH3+.
Recent measurements of parity () and time-reversal () violating moments are now probing physics at energy scales beyond the direct reach of the Large Hadron Collider [8]. Radium-based molecules are promising for constraining hadronic , -odd forces [9, 10, 11]. The heavy and octupole-deformed radium nucleus enhances sensitivity to new physics in the hadronic sector [12, 13]. This sensitivity is further enhanced when radium is incorporated into molecules such as \ceRaOH+ or \ceRaOCH3+ [14, 10, 9] that have large effective electric fields and molecular structure that is critical for reducing systematic uncertainties. An ion trap is advantageous for working with radioactive molecules as high measurement sensitivity can be achieved with small sample sizes due to long measurement times [2, 15]. For example, the long trap times combined with the high sensitivity of \ce^225RaOCH3+ are sufficient for an experiment with even a single trapped molecule to set new bounds on hadronic , violations [16].
Because dark ions do not fluoresce, mass spectrometry techniques are commonly used for species identification. We present a new nondestructive optical mass spectrometry (OMS) technique to identify a trapped dark ion in a Coulomb crystal by measuring a motional frequency of the crystal. In this work, we use cotrapped laser-cooled ions to amplify the secular (normal mode) motion of the crystal by using coherent population trapping (CPT) in the - - -level system [17] common to Ca+, Sr+, Ba+, and Ra+. For these ions, it is fast and straightforward to realize CPT by changing the frequency and power of the repump laser from the laser cooling values with an acousto-optical modulator. With CPT, the optical spectrum of the cooling transition can be modified so the ion’s motion is coherently amplified [18], which modulates the scattered light at the motional frequency and its harmonics, which can then be measured with a Fourier transform. Because the motional modes of the ion crystal are set by the charge and mass of the trapped particles, motional frequencies can be used to determine the ion’s mass. The OMS technique can be used with any laser-cooled ion, even without using a structure, e.g., Be+, Mg+, or Yb+, via “phonon lasing” with bichromatic light [19].
Many techniques have been used to identify trapped dark ions in Paul traps. The best technique for large Coulomb crystals (hundreds to thousands of ions) with multiple dark ion species is time-of-flight mass spectrometry, but it is inherently destructive and requires a purpose-built trap and custom electronics [20, 21, 22]. In the regime of small ion crystals with a few dark ions, multiple techniques have been developed that rely on measuring a trap secular frequency, including secular motion excitation by applied electric fields (tickle scans) [23, 24, 25], optical sideband spectroscopy [26], and ion crystal phase transitions [27]. Optical sideband spectroscopy requires a narrow linewidth laser and is also slow ( minute). Measuring phase transitions has limited performance due to the large mass uncertainties ( daltons [27]). A tickle scan typically requires a minute measurement where an electrical drive is scanned over the secular frequency, which results in a broad resonance peak due to the damping from the laser cooling that is required by the technique. The applied electric field can also destructively drive ions out of the trap. Despite these drawbacks and the need for additional electrical connections (which are a noise conduit), for small crystals the tickle scan has been the most widely used technique. A variation of the tickle scan method modulates the cooling light intensity instead of modulating an electrical drive [28]. This removes some drawbacks but with an increase in technical overhead. In order for any of these techniques to achieve reasonable measurement times (1 minute), a priori knowledge of the trapped dark ions is required to reduce the secular frequency scan range. In comparison to these small ion crystal mass spectrometry techniques, the reported OMS technique is faster, does not require knowledge of the dark ion’s mass, is less invasive, and is a simple extension to Doppler cooling.
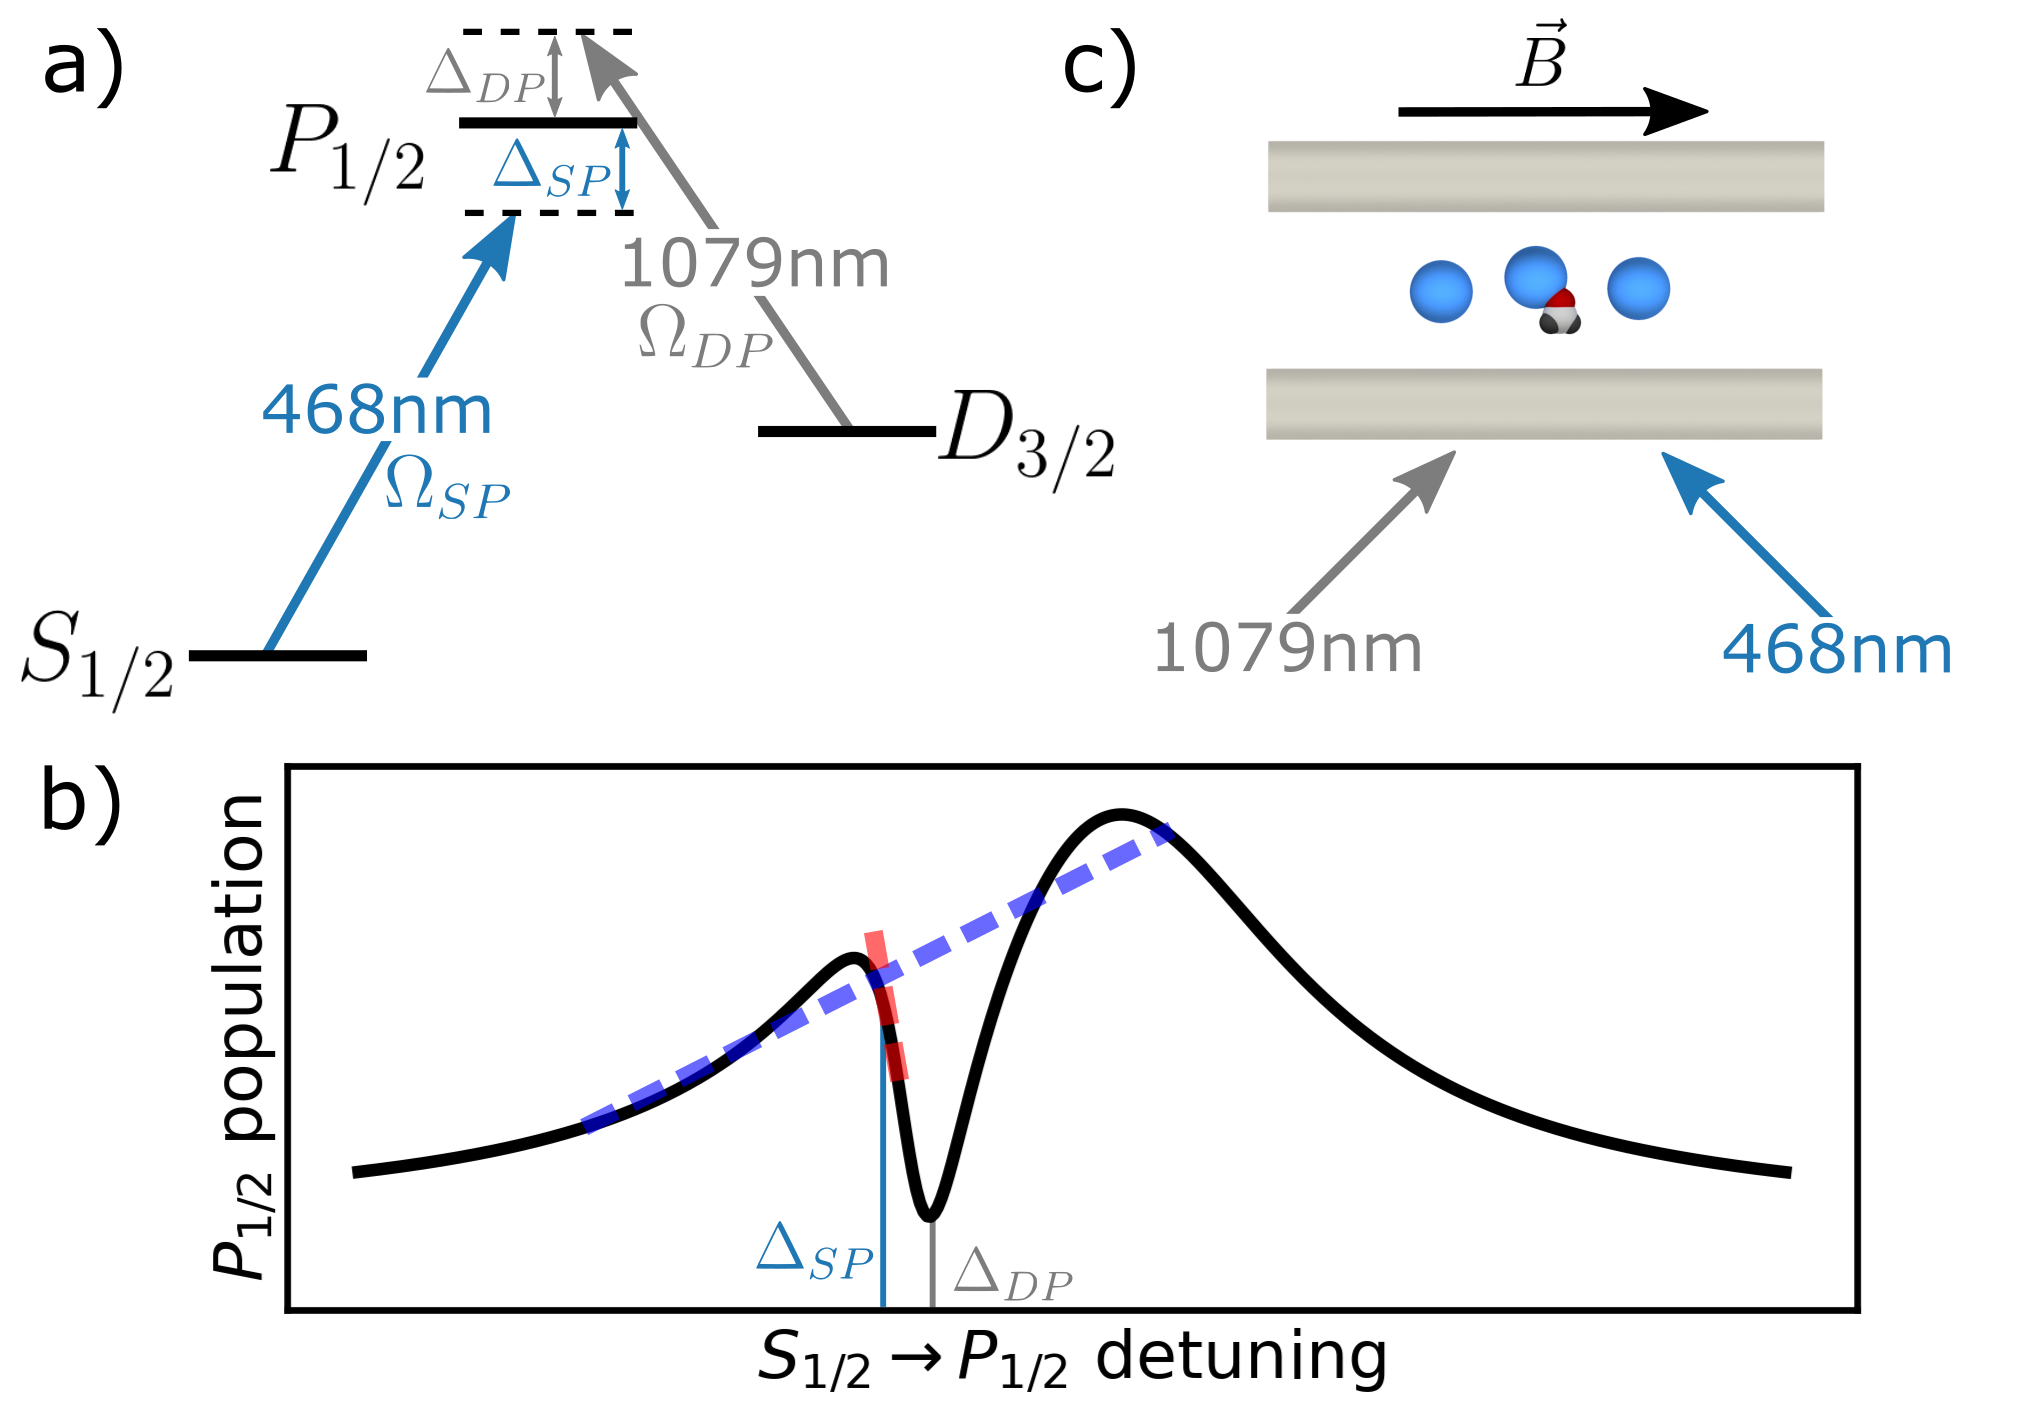
Secular motion amplification by coherent population trapping—We use CPT in \ceRa+ to amplify the ion crystal’s motion. For Doppler cooling, the cooling laser at 468 nm is red-detuned, , from the transition, and a repump laser at 1079 nm is blue-detuned, , from the transition that brings the population back into the cooling cycle [18], see Fig. 1. The high scattering rate of laser cooling can be significantly reduced by the CPT that occurs when [29]. For CPT motional amplification the condition is less stringent as setting (see Fig. 1), heats the ion crystal because the 468 nm spectrum has a local slope that is negative due to the excitation suppression from CPT at . However, the heating is bounded by the 468 nm global spectrum which has a positive slope for , that cools the heated ion’s motion once it reaches a sufficient amplitude where the global cooling spectrum is Doppler shifted into resonance. The trapped ions then maintain an amplified equilibrium orbit when the optically induced “local heating” and “global cooling” effects balance [30, 31].


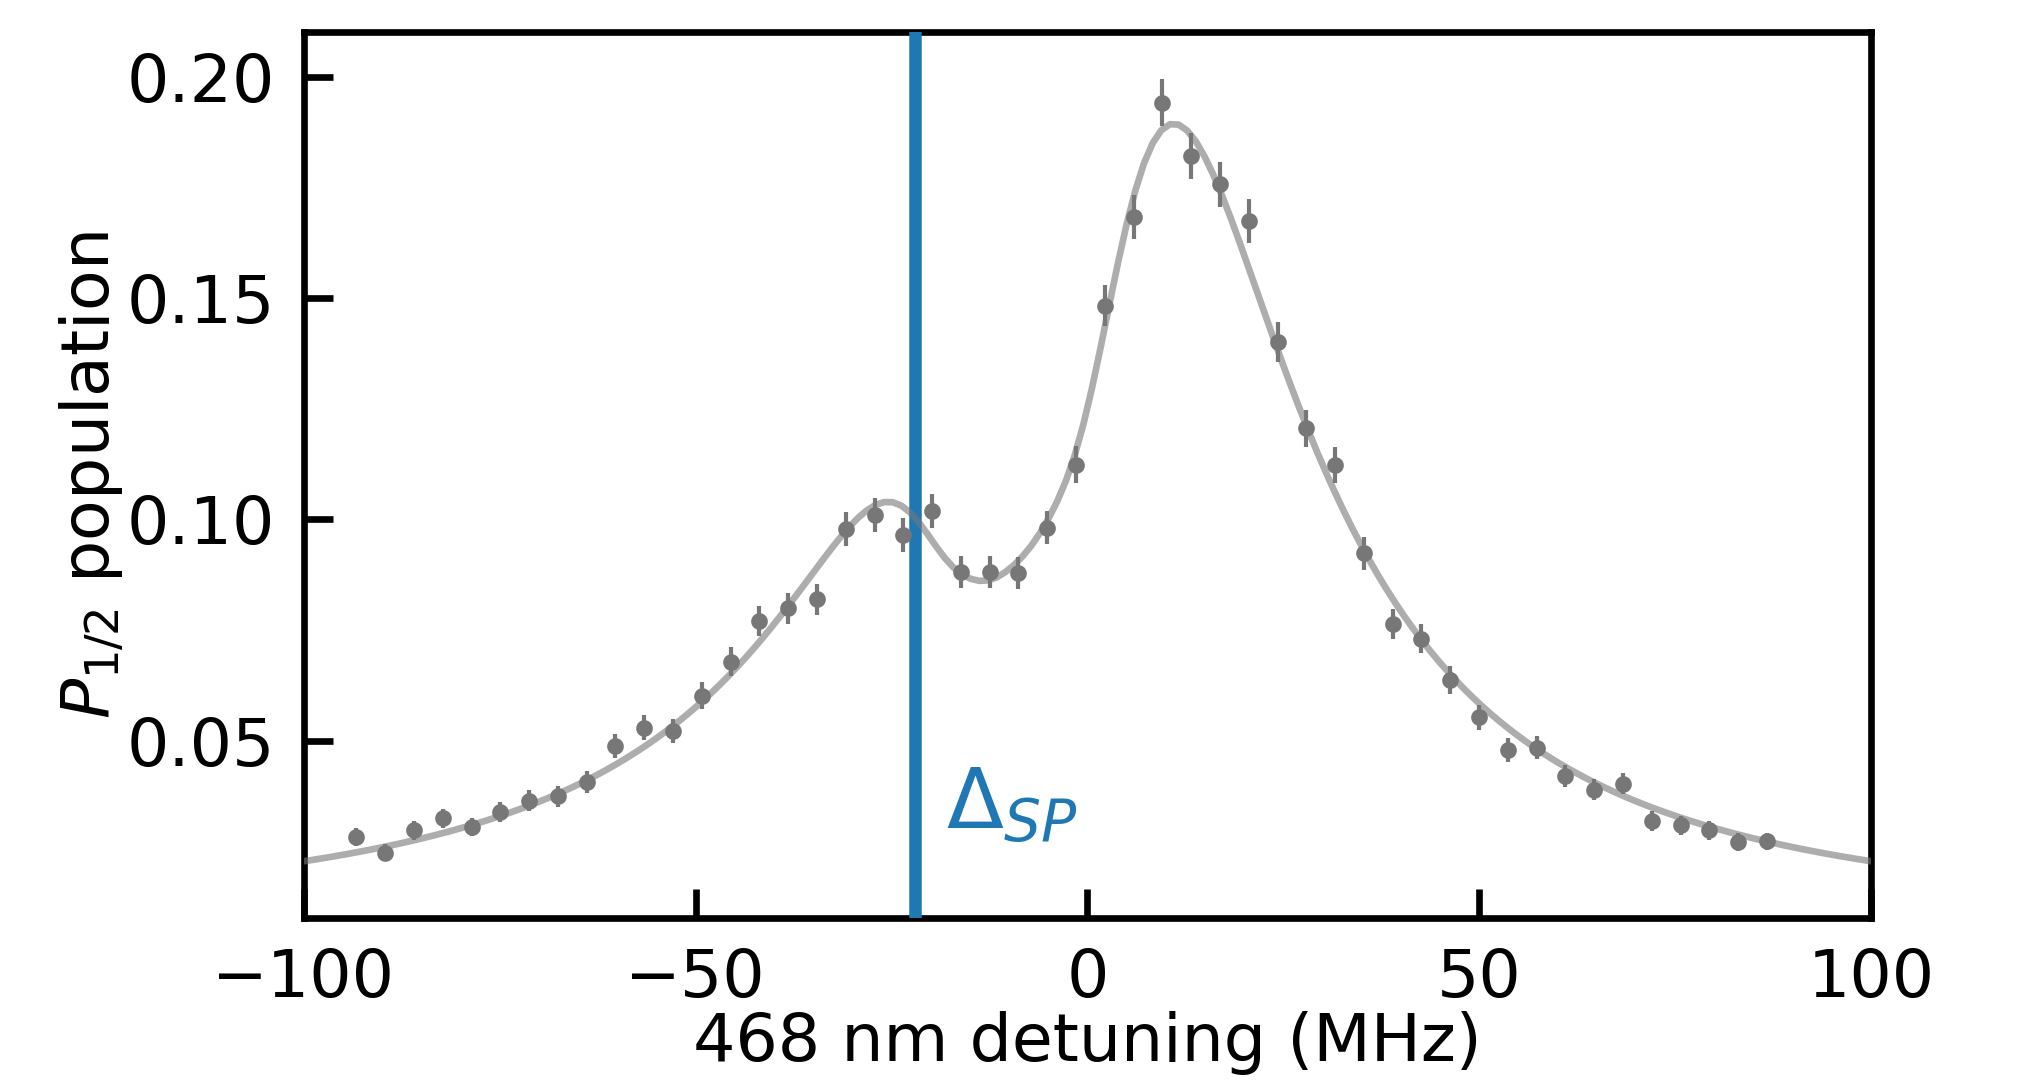
For OMS identification of \ceRaOH+ and \ceRaOCH3+, we apply a 2.5 gauss magnetic field along the trap axial direction. The vectors of both lasers are at with respect to all trap axes and are linearly polarized perpendicular to the magnetic field direction (see Fig. 1). Each laser’s frequency and amplitude is controlled with an acousto-optical modulator. The multipeak spectrum of the cooling laser (see Fig. 2), enables “local heating, global cooling” that amplifies the ion motion up to a fixed value. The 1079 nm light, with a vector perpendicular to the 468 nm light, see Fig. 1 (c), breaks the degeneracy between the axial and radial directions so that the CPT only amplifies motion along the axial direction, see [30]. To switch from CPT amplification to Doppler cooling, we detune positive so the CPT excitation suppression is far from .
OMS of radium-based molecular ions—We trap \ce^226Ra+ ions in a linear Paul trap with a radio frequency (rf) drive of , radial electrode to trap center distance and axial electrode to trap center distance (for details see [34]). For a single \ceRa+, the axial secular frequency is . The 468 nm fluorescent photons are collected and sent to a camera and a photomultiplier tube (PMT), and the counts are time-tagged using a field-programmable gate array [35].

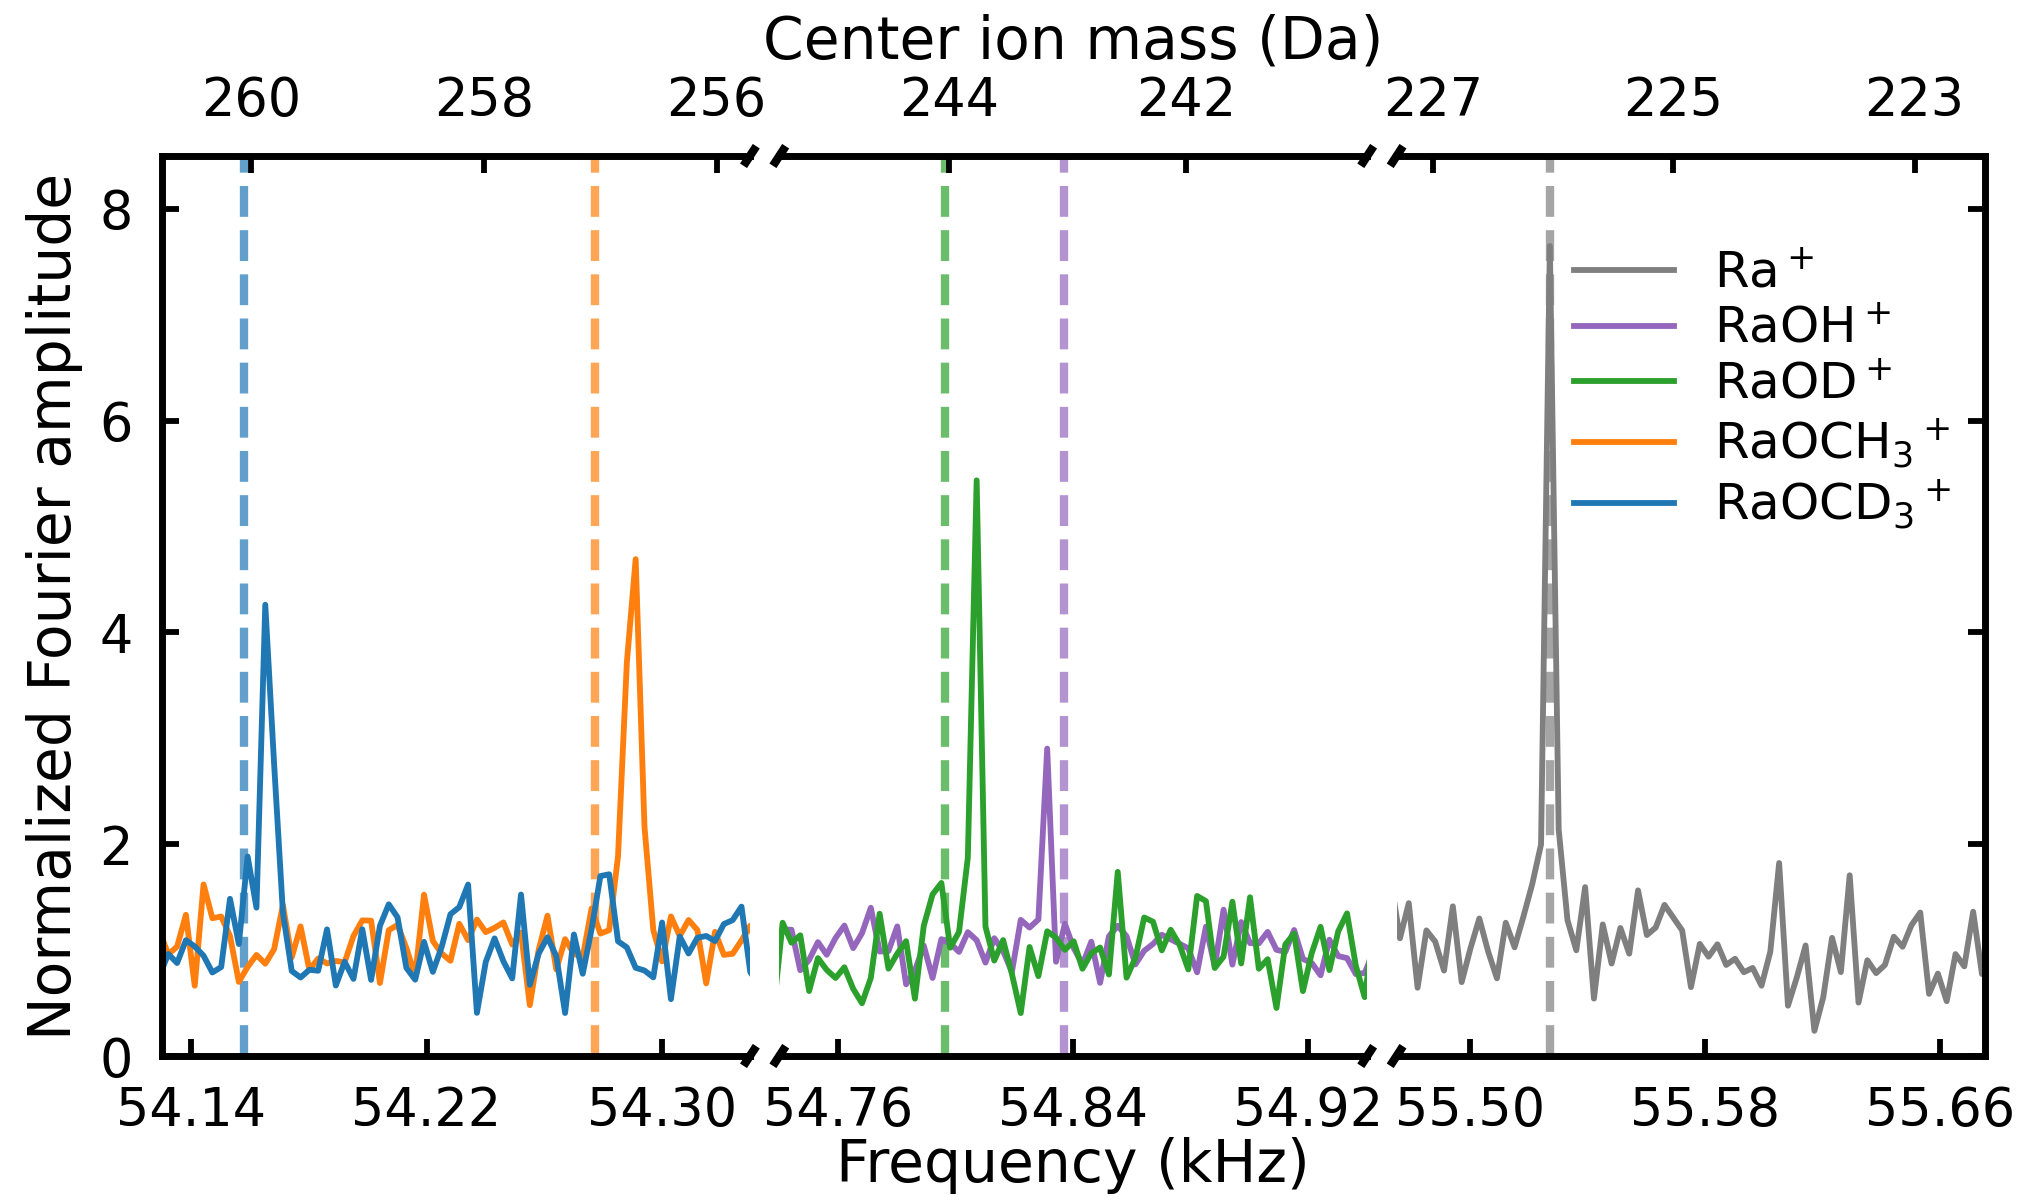
We laser cool three \ceRa+ ions and apply CPT amplification to increase the secular motion amplitude on the axial center-of-mass (COM) mode to . A Fourier transform of the PMT counts while the ion motion is CPT amplified gives the OMS signal. The signal is calibrated by using known (fluorescing) ions. In this case three \ceRa+ ions are used for calibration (see Fig. 3). Next, either methanol vapor or the deuterated equivalent is introduced to react with the laser-cooled \ceRa+. A chemical reaction produces a dark ion defect in the crystal and drops the PMT counts by roughly 1/3. If the dark ion is not in the middle of the crystal we re-order the ions to meet this condition by blue-detuning the 468 nm light, , for , which heats the trapped ions. We apply OMS to find the secular frequency and with the calibration measurement we can calculate the center ion’s mass [30], see Fig. 3. Each trace is an average of ten s long measurements. The second harmonics of the secular frequencies are used because in our experimental setup they are the strongest Fourier components.
The difference in the mass spectrum of molecules when the trapped ions are exposed to methanol versus deuterated methanol confirms that we are producing the molecular ions identified by mass. When methanol is introduced only \ceRaOCH3+ [36, 37, 38] and \ceRaOH+ [39] are created, while \ceRaOCD3+ and \ceRaOD+ are only formed with deuterated methanol. The differences between the measured and calculated second harmonics of the secular frequencies are all within , corresponding to a fractional mass difference of in a 3 s measurement. We observe that with a methanol (deuterated) background pressure of torr, \ceRaOH+ (\ceRaOD+) is not chemically stable and typically reacts in a few minutes to form \ceRaOCH3+ (\ceRaOCD3+), which is easily detected because the OMS technique is fast, precise, and broadband.
| \ceRaOH+ | \ceRaOD+ | \ceRaOCH3+ | \ceRaOCD3+ | |
|---|---|---|---|---|
| Stat. | 243.19(7) | 243.79(7) | 256.72(8) | 259.85(8) |
| Syst. | 0.01(11) | 0.21(11) | 0.34(11) | 0.22(11) |
| Final | 243.20(14) | 244.01(14) | 257.06(14) | 260.07(14) |
| Calc. | 243.03 | 244.03 | 257.04 | 260.06 |
The OMS statistical uncertainty of 3 Hz was set by the Fourier transform resolution, which in turn comes from a data acquisition memory limit. The line center is found with a Lorentzian fit, which has an uncertainty ( Hz) that is much less than the Fourier frequency resolution. We also consider systematic effects including trap potential drift, secular motion amplitude shifts, and micromotion shifts [30]. Both the statistical and systematic effects contribute to the ion mass uncertainty or shift by much less than 1 dalton, as summarized in Table 1.
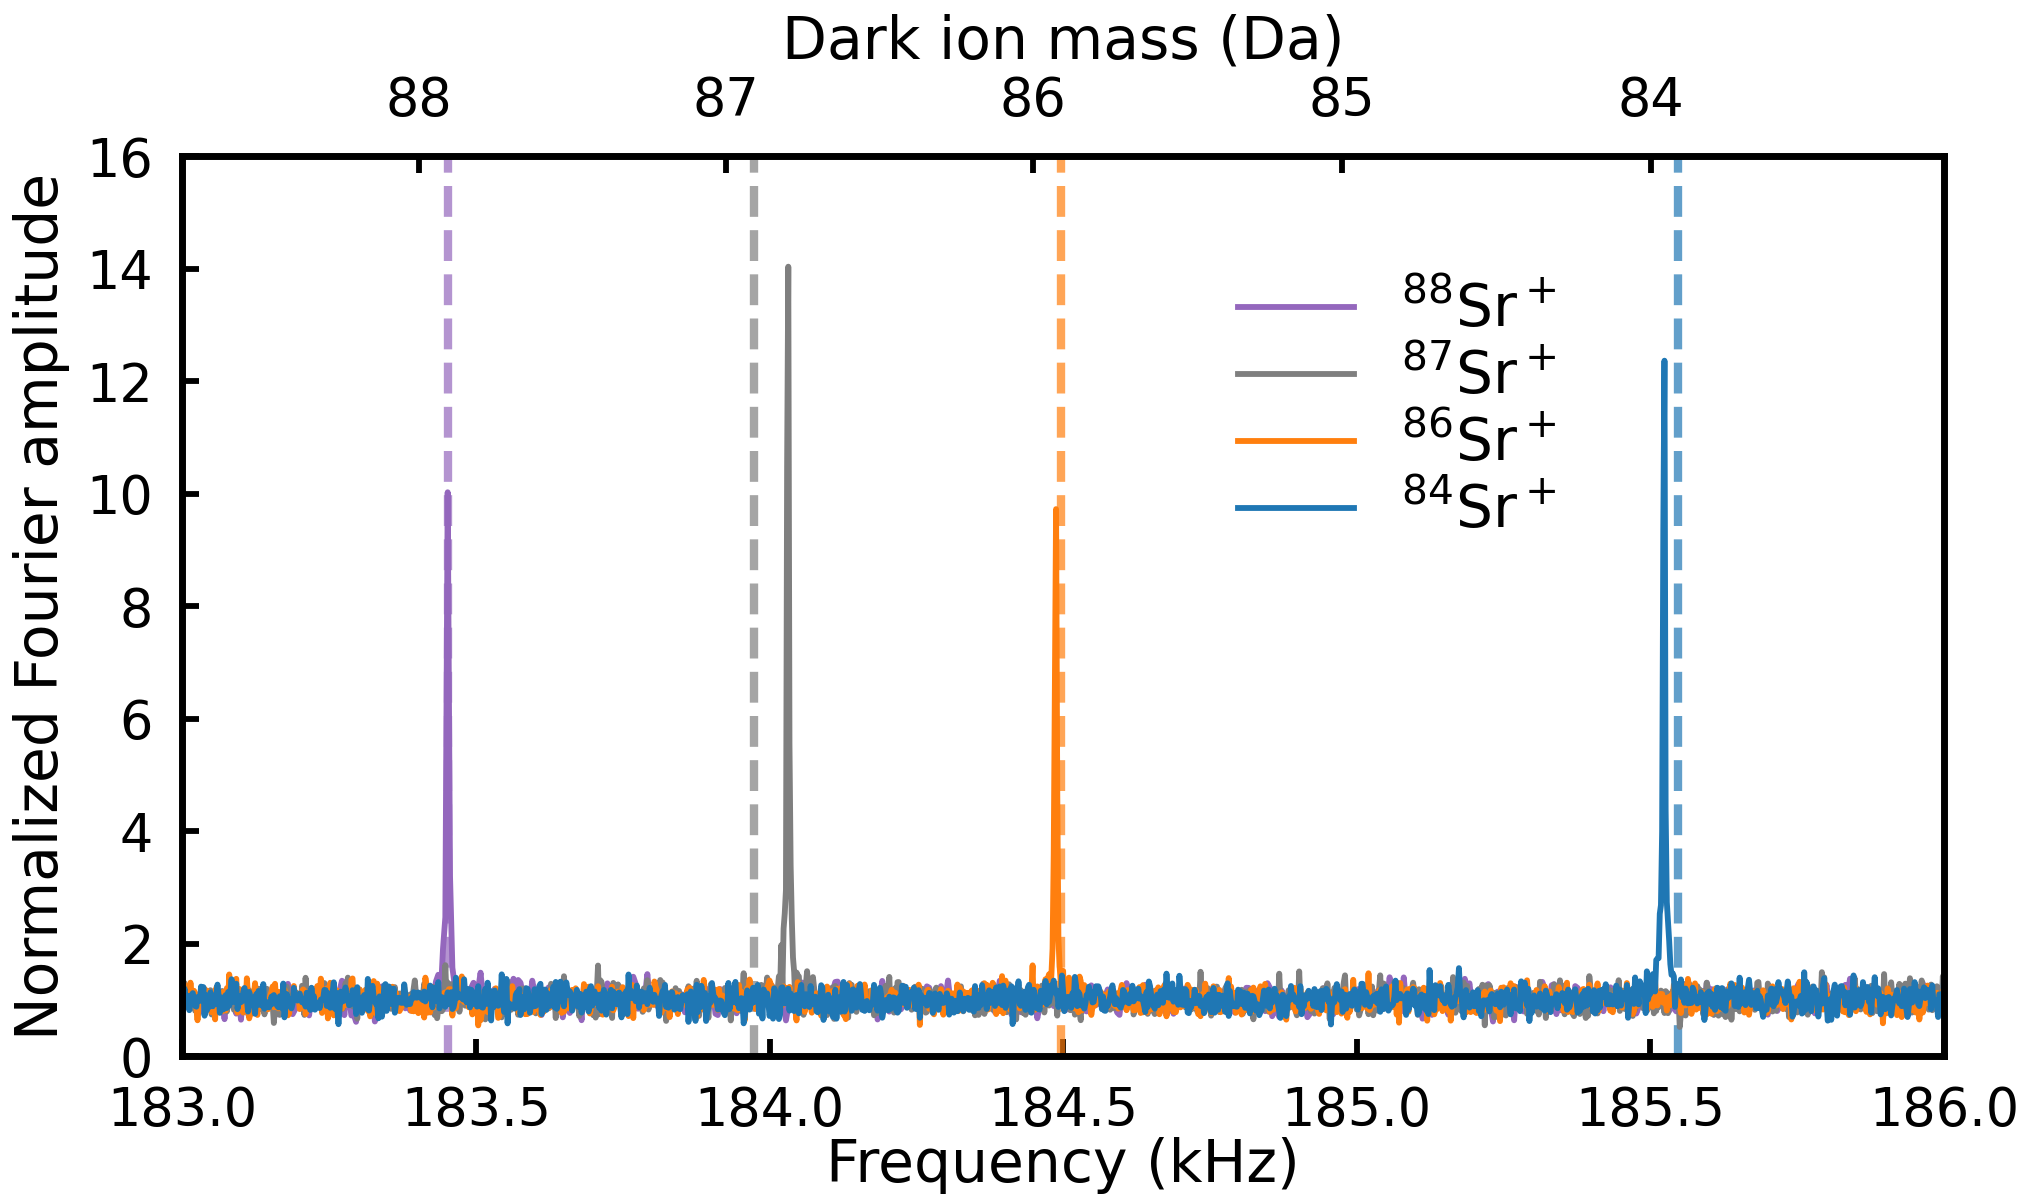
OMS in a high frequency ion trap—In a separate experimental apparatus, we confirm the OMS technique with strontium isotopes 88, 86, and 84, which we also identify with fluorescence. We demonstrate that the statistical mass sensitivity can be enhanced with a higher frequency ion trap (, , ). The axial secular frequency for a single \ce^88Sr+ is . We trap two-ion crystals with one \ce^88Sr+ and one \ce^88, 87, 86, 84Sr+, and measure the axial COM secular frequencies of the crystal by OMS with CPT amplification applied to the \ce^88Sr+. \ce^87Sr+ is identified only with OMS.
The Fourier spectra of second harmonics of the axial COM secular frequency are shown in Fig. 4. The mass labels are calibrated using two ions [30]. Each trace is an average of ten 0.5 s measurements. The corresponding statistical mass resolution is . The sub 1 dalton discrepancies between measured and calculated masses are primarily due to temporal drift of the trap potential.

Conclusion—We have produced \ce^226RaOH+ and \ce^226RaOCH3+ molecules in this work. Their isotopologues \ce^225RaOH+ and \ce^225RaOCH3+ are proposed for nuclear Schiff moment measurements [10, 9], and can be produced with trapped \ce^225Ra+ and methanol. The production, sympathetic cooling, and fast nondestructive identification of these radioactive polyatomic molecular ions enables studying their internal structure with techniques such as photodissociation spectroscopy [41] or quantum logic spectroscopy [42, 43].
The short measurement time and sub-dalton mass resolution could enable detection of short-lived molecular ions, as demonstrated in this Letter using \ceRaOH+ and \ceRaOD+ which are metastable when in the presence of a methanol background. We note that the measurement time can be further reduced to or less with an iris to selectively collect ion fluorescence on one end of the amplified ion motion. With such a short measurement time it is possible to apply this technique to study the dissociation channels of radium-based molecular ions. For example, \ceRa+ in the state (lifetime [44]) is optically indistinguishable from a radium-based molecular ion as neither of them fluoresce during \ceRa+ Doppler cooling, but can be distinguished with mass spectrometry. This provides a new tool to study the electronic states of chemical reaction products. The simultaneous determination of product and reactant states can be achieved by combining this method with optical pumping, which will help investigate full reaction pathways with single particles [4, 45]. The technique may also be used to rapidly characterize the motional frequencies of an ion trap. For example, it could be incorporated into a feedback loop for the long-term stabilization of trap motional frequencies [46].
We thank W. Campbell, N. Hutzler and D. Patterson for helpful discussions. This research was performed under the sponsorship of the NSF Grant No. PHY-1912665, and the University of California Office of the President (Grant No. MRP-19-601445).
References
- Brewer et al. [2019] S. M. Brewer, J.-S. Chen, A. M. Hankin, E. R. Clements, C. W. Chou, D. J. Wineland, D. B. Hume, and D. R. Leibrandt, Phys. Rev. Lett. 123, 033201 (2019).
- Cairncross et al. [2017] W. B. Cairncross, D. N. Gresh, M. Grau, K. C. Cossel, T. S. Roussy, Y. Ni, Y. Zhou, J. Ye, and E. A. Cornell, Phys. Rev. Lett. 119, 153001 (2017).
- Puri et al. [2019] P. Puri, M. Mills, I. Simbotin, J. A. Montgomery, R. Côté, C. Schneider, A. G. Suits, and E. R. Hudson, Nat. Chem. 11, 615 (2019).
- Sikorsky et al. [2018] T. Sikorsky, Z. Meir, R. Ben-shlomi, N. Akerman, and R. Ozeri, Nature Communications 9, 920 (2018).
- Safronova et al. [2014] M. S. Safronova, V. A. Dzuba, V. V. Flambaum, U. I. Safronova, S. G. Porsev, and M. G. Kozlov, Phys. Rev. Lett. 113, 030801 (2014).
- Kozlov et al. [2018] M. G. Kozlov, M. S. Safronova, J. R. Crespo López-Urrutia, and P. O. Schmidt, Rev. Mod. Phys. 90, 045005 (2018).
- Micke et al. [2020] P. Micke, T. Leopold, S. A. King, E. Benkler, L. J. Spieß, L. Schmöger, M. Schwarz, J. R. Crespo López-Urrutia, and P. O. Schmidt, Nature 578, 60 (2020).
- Andreev et al. [2018] V. Andreev, D. G. Ang, D. DeMille, J. M. Doyle, G. Gabrielse, J. Haefner, N. R. Hutzler, Z. Lasner, C. Meisenhelder, B. R. O’Leary, C. D. Panda, A. D. West, E. P. West, X. Wu, and A. C. M. E. Collaboration, Nature 562, 355 (2018).
- Flambaum [2019] V. V. Flambaum, Phys. Rev. C 99, 035501 (2019).
- Kozyryev and Hutzler [2017] I. Kozyryev and N. R. Hutzler, Phys. Rev. Lett. 119, 133002 (2017).
- Garcia Ruiz et al. [2020] R. F. Garcia Ruiz, R. Berger, J. Billowes, C. L. Binnersley, M. L. Bissell, A. A. Breier, A. J. Brinson, K. Chrysalidis, T. E. Cocolios, B. S. Cooper, K. T. Flanagan, T. F. Giesen, R. P. de Groote, S. Franchoo, F. P. Gustafsson, T. A. Isaev, Á. Koszorús, G. Neyens, H. A. Perrett, C. M. Ricketts, S. Rothe, L. Schweikhard, A. R. Vernon, K. D. A. Wendt, F. Wienholtz, S. G. Wilkins, and X. F. Yang, Nature 581, 396 (2020).
- Gaffney et al. [2013] L. P. Gaffney, P. A. Butler, M. Scheck, A. B. Hayes, F. Wenander, M. Albers, B. Bastin, C. Bauer, A. Blazhev, S. Bonig, N. Bree, J. Cederkall, T. Chupp, D. Cline, T. E. Cocolios, T. Davinson, H. De Witte, J. Diriken, T. Grahn, A. Herzan, M. Huyse, D. G. Jenkins, D. T. Joss, N. Kesteloot, J. Konki, M. Kowalczyk, T. Kroll, E. Kwan, R. Lutter, K. Moschner, P. Napiorkowski, J. Pakarinen, M. Pfeiffer, D. Radeck, P. Reiter, K. Reynders, S. V. Rigby, L. M. Robledo, M. Rudigier, S. Sambi, M. Seidlitz, B. Siebeck, T. Stora, P. Thoele, P. Van Duppen, M. J. Vermeulen, M. von Schmid, D. Voulot, N. Warr, K. Wimmer, K. Wrzosek-Lipska, C. Y. Wu, and M. Zielinska, Nature 497, 199 (2013).
- Graner et al. [2016] B. Graner, Y. Chen, E. G. Lindahl, and B. R. Heckel, Phys. Rev. Lett. 116, 161601 (2016).
- Kudashov et al. [2014] A. D. Kudashov, A. N. Petrov, L. V. Skripnikov, N. S. Mosyagin, T. A. Isaev, R. Berger, and A. V. Titov, Phys. Rev. A 90, 052513 (2014).
- Zhou et al. [2020] Y. Zhou, Y. Shagam, W. B. Cairncross, K. B. Ng, T. S. Roussy, T. Grogan, K. Boyce, A. Vigil, M. Pettine, T. Zelevinsky, J. Ye, and E. A. Cornell, Phys. Rev. Lett. 124, 053201 (2020).
- Yu and Hutzler [2021] P. Yu and N. R. Hutzler, Phys. Rev. Lett. 126, 023003 (2021).
- Chen et al. [2015] X. Chen, Y.-W. Lin, and B. C. Odom, New J. Phys. 17, 043037 (2015).
- Berkeland and Boshier [2002] D. J. Berkeland and M. G. Boshier, Phys. Rev. A 65, 033413 (2002).
- Vahala et al. [2009] K. Vahala, M. Herrmann, S. Knünz, V. Batteiger, G. Saathoff, T. W. Hänsch, and T. Udem, Nat. Phys. 5, 682 (2009).
- Schneider et al. [2014] C. Schneider, S. J. Schowalter, K. Chen, S. T. Sullivan, and E. R. Hudson, Phys. Rev. Applied 2, 034013 (2014).
- Deb et al. [2015] N. Deb, L. L. Pollum, A. D. Smith, M. Keller, C. J. Rennick, B. R. Heazlewood, and T. P. Softley, Phys. Rev. A 91, 033408 (2015).
- Schmid et al. [2017] P. C. Schmid, J. Greenberg, M. I. Miller, K. Loeffler, and H. J. Lewandowski, Rev. Sci. Instrum. 88, 123107 (2017).
- Staanum et al. [2008] P. F. Staanum, K. Højbjerre, R. Wester, and M. Drewsen, Phys. Rev. Lett. 100, 243003 (2008).
- Willitsch et al. [2008] S. Willitsch, M. T. Bell, A. D. Gingell, S. R. Procter, and T. P. Softley, Phys. Rev. Lett. 100, 043203 (2008).
- Gingell et al. [2010] A. D. Gingell, M. T. Bell, J. M. Oldham, T. P. Softley, and J. N. Harvey, J. Chem. Phys. 133, 194302 (2010), https://doi.org/10.1063/1.3505142 .
- Goeders et al. [2013] J. E. Goeders, C. R. Clark, G. Vittorini, K. Wright, C. R. Viteri, and K. R. Brown, J. Phys. Chem. A 117, 9725 (2013).
- Groot-Berning et al. [2019] K. Groot-Berning, F. Stopp, G. Jacob, D. Budker, R. Haas, D. Renisch, J. Runke, P. Thörle-Pospiech, C. E. Düllmann, and F. Schmidt-Kaler, Phys. Rev. A 99, 023420 (2019).
- Drewsen et al. [2004] M. Drewsen, A. Mortensen, R. Martinussen, P. Staanum, and J. L. Sørensen, Phys. Rev. Lett. 93, 243201 (2004).
- Janik et al. [1985] G. Janik, W. Nagourney, and H. Dehmelt, J. Opt. Soc. Am. B 2, 1251 (1985).
- [30] See Supplemental Material, which includes Refs. [47, 48, 49, 50, 51, 52], for further discussion of ion motional amplification, secular frequency calculations, and OMS systematic effects.
- Blümel et al. [1989] R. Blümel, C. Kappler, W. Quint, and H. Walther, Phys. Rev. A 40, 808 (1989).
- Oberst [1999] H. Oberst, Resonance fluorescence of single Barium ions, Master’s thesis, University of Innsbruck (1999).
- Roßnagel et al. [2015] J. Roßnagel, K. N. Tolazzi, F. Schmidt-Kaler, and K. Singer, New J. Phys. 17, 045004 (2015).
- Fan et al. [2019] M. Fan, C. A. Holliman, A. L. Wang, and A. M. Jayich, Phys. Rev. Lett. 122, 223001 (2019).
- Pruttivarasin and Katori [2015] T. Pruttivarasin and H. Katori, Rev. Sci. Instrum. 86, 115106 (2015).
- Lu and Yang [1998] W. Lu and S. Yang, J. Phys. Chem. A 102, 825 (1998).
- Lee and Farrar [2002] J. I. Lee and J. M. Farrar, J. Phys. Chem. A 106, 11882 (2002).
- Puri et al. [2017] P. Puri, M. Mills, C. Schneider, I. Simbotin, J. A. Montgomery, R. Côté, A. G. Suits, and E. R. Hudson, Science (2017).
- Augenbraun et al. [2020] B. L. Augenbraun, Z. D. Lasner, A. Frenett, H. Sawaoka, C. Miller, T. C. Steimle, and J. M. Doyle, New J. Phys. 22, 022003 (2020).
- [40] Coursey, J.S., Schwab, D.J., Tsai, J.J., and Dragoset, R.A. (2015), Atomic Weights and Isotopic Compositions (version 4.1). [Online] Available: http://physics.nist.gov/Comp [2020 Mar 11]. National Institute of Standards and Technology, Gaithersburg, MD.
- Khanyile et al. [2015] N. B. Khanyile, G. Shu, and K. R. Brown, Nat. Commun. 6, 7825 (2015).
- Schmidt et al. [2005] P. O. Schmidt, T. Rosenband, C. Langer, W. M. Itano, J. C. Bergquist, and D. J. Wineland, Science 309, 749 (2005).
- Wolf et al. [2016] F. Wolf, Y. Wan, J. C. Heip, F. Gebert, C. Shi, and P. O. Schmidt, Nature 530, 457 (2016).
- Pal et al. [2009] R. Pal, D. Jiang, M. S. Safronova, and U. I. Safronova, Phys. Rev. A 79, 062505 (2009).
- Ratschbacher et al. [2012] L. Ratschbacher, C. Zipkes, C. Sias, and M. Köhl, Nat. Phys. 8, 649 (2012).
- Johnson et al. [2016] K. G. Johnson, J. D. Wong-Campos, A. Restelli, K. A. Landsman, B. Neyenhuis, J. Mizrahi, and C. Monroe, Rev. Sci. Instrum. (2016).
- Lett et al. [1989] P. D. Lett, W. D. Phillips, S. L. Rolston, C. E. Tanner, R. N. Watts, and C. I. Westbrook, J. Opt. Soc. Am. B 6, 2084 (1989).
- Kemiktarak et al. [2014] U. Kemiktarak, M. Durand, M. Metcalfe, and J. Lawall, Phys. Rev. Lett. 113, 030802 (2014).
- Berkeland et al. [1998] D. J. Berkeland, J. D. Miller, J. C. Bergquist, W. M. Itano, and D. J. Wineland, J. Appl. Phys. 83, 5025 (1998).
- Morigi and Walther [2001] G. Morigi and H. Walther, Eur. Phys. J. D 13, 261 (2001).
- Kielpinski et al. [2000] D. Kielpinski, B. E. King, C. J. Myatt, C. A. Sackett, Q. A. Turchette, W. M. Itano, C. Monroe, D. J. Wineland, and W. H. Zurek, Phys. Rev. A 61, 032310 (2000).
- Akerman et al. [2010] N. Akerman, S. Kotler, Y. Glickman, Y. Dallal, A. Keselman, and R. Ozeri, Phys. Rev. A 82, 061402(R) (2010).