11email: enrichetta.iodice@inaf.it 22institutetext: European Southern Observatory, Karl-Schwarzschild-Strasse 2, D-85748 Garching bei Muenchen, Germany33institutetext: INAF-Astronomical Abruzzo Observatory, Via Maggini, 64100, Teramo, Italy44institutetext: INAF Osservatorio Astronomico di Padova, Vicolo dell’Osservatorio 5, I-35122 Padova, Italy55institutetext: Centre for Astrophysics and Supercomputing, Swinburne University of Technology, Hawthorn, Victoria 3122, Australia 66institutetext: Instituto de Astrofísica, Facultad de Física, Pontificia Universidad Católica de Chile, Av. Vicuña Mackenna 4860, 7820436 Macul, Santiago, Chile 77institutetext: European Southern Observatory, Alonso de Cordova 3107, Vitacura, Santiago, Chile88institutetext: Department of Physics, University of Oxford, Denys Wilkinson Building, Keble Road, Oxford OX1 3RH, UK99institutetext: University of Naples “Federico II”, C.U. Monte Sant’Angelo, Via Cinthia, 80126, Naples, Italy1010institutetext: INAF Astronomical Observatory of Padova, Via dell’Osservatorio 8 , I-36012, Asiago (VI), Italy1111institutetext: INFN, Sezione di Napoli, Napoli 80126, Italy
The first detection of ultra-diffuse galaxies in the Hydra I cluster from VEGAS survey
In this paper we report on the discovery of 27 low-surface brightness galaxies, of which 12 are candidate ultra-diffuse galaxy (UDG) in the Hydra I cluster, based on deep observations taken as part of the VST Early-type Galaxy Survey (VEGAS). This first sample of UDG candidates in the Hydra I cluster represents an important step in our project that aims to enlarge the number of confirmed UDGs and, through study of statistically relevant samples, constrain the nature and formation of UDGs. This study presents the main properties of this class of galaxies in the Hydra I cluster. For all UDGs, we analyse the light and colour distribution, and provide a census of the globular cluster (GC) systems around them. Given the limitations of a reliable GC selection based on two relatively close optical bands only, we find that half of the UDG candidates have a total GC population consistent with zero. Of the other half, two galaxies have a total population larger than zero at 2 level. We estimate the stellar mass, the total number of GCs and the GC specific frequency (). Most of the candidates span a range of stellar masses of M⊙. Based on the GC population of these newly discovered UDGs, we conclude that most of these galaxies have a standard or low dark matter content, with a halo mass of M⊙.
Key Words.:
Galaxies: clusters: individual: Hydra I - Galaxies: photometry - Galaxies: dwarf - Galaxies: formation1 Introduction
Ultra-diffuse galaxies (UDGs) are extreme low-surface brightness (LSB) objects ( mag arcsec-2) with effective radii comparable to that of large spirals, but stellar masses similar to dwarf galaxies ( M⊙). Renewed interest in the LSB objects and the definition of a new class of galaxies as UDGs comes from the discovery of a significant population of these rather extreme objets in the Coma cluster (van Dokkum et al., 2015; Koda et al., 2015). Recent works report the discovery of UDGs also in less dense environments as groups of galaxies and in the field (Román & Trujillo, 2017; van der Burg et al., 2017; Shi et al., 2017; Müller et al., 2018; Prole et al., 2019b; Forbes et al., 2019, 2020b).
The nature and origin of the UDGs are still debated.
UDGs could be “failed” galaxies, which lost their gas supply at early epochs. If so, the UDG should posses a massive dark matter (DM) halo to survive in dense environments like galaxy clusters (van Dokkum et al., 2015).
Some theoretical models explain UDGs as extreme dwarf galaxies, whose large size could be due to high spins in DM halos
(Amorisco & Loeb, 2016; Rong et al., 2017; Tremmel et al., 2019) or to tidal interactions (e.g. Yozin & Bekki, 2015).
Di Cintio et al. (2017) proposed that very extended UDGs-like systems could have formed by the
kinematical heating of their stars as consequence of internal processes
(i.e. gas outflows associated with feedback).
Populations of UDGs have been reproduced in cosmological galaxy simulations both in galaxy clusters (e.g. Sales et al., 2020) and in low-density environments (e.g. Wright et al., 2020).
They suggested that two classes of UDGs might exist: one, found in the field, defined as normal LSB galaxies,
and a second class of UDGs, near cluster centres, which shaped their large size and low surface brightness
by the cluster tidal forces.
From the observational side, given the very low surface brightness, the detection and analysis of UDGs is challenging. Some UDGs in Coma and Virgo clusters appear to host a large number of globular clusters (GCs) for their luminosity, indicating that they may be DM-dominated. This might support the failed galaxies hypothesis (Beasley et al., 2016; Peng & Lim, 2016; van Dokkum et al., 2016, 2019b; Forbes et al., 2020a). On the other hand, other works showed that UDGs can have stellar masses and DM content consistent with dwarf galaxies, suggesting that they could be extremely extended dwarfs (Beasley & Trujillo, 2016; Amorisco, 2018; Alabi et al., 2018; Ferré-Mateu et al., 2018). Furthermore, some UDGs are found with very low DM content (van Dokkum et al., 2016, 2019a; Danieli et al., 2019; Prole et al., 2019a).
From the analysis of the average colours, two populations of UDGs were identified: red and quenched UDGs, which occupy the red sequence (van Dokkum et al., 2015; van der Burg et al., 2017), and a blue population of UDGs, which are mostly found in the field (e.g. Leisman et al., 2017; Román & Trujillo, 2017; Prole et al., 2019b). The spatial distribution of UDGs inside their host environment seems to be asymmetric, i.e. over-densities of UDGs are found close to substructures, as sub-groups of galaxies, which are falling into the cluster (van der Burg et al., 2017; Janssens et al., 2019).
The few spectroscopic data acquired for UDGs find both metal poor () and old systems ( Gyr, e.g. Fensch et al., 2019; Ferré-Mateu et al., 2018; Gu et al., 2018; Ruiz-Lara et al., 2018), as well as younger UDGs with an extended star formation history and massive DM halo (Martín-Navarro et al., 2019).
The available data show that UDGs span a wide range of properties, which do not fit in a unique formation scenario, and clearly indicate that, to date, our knowledge of UDGs is still poorly constrained. The main issues that need to be tackled are i) whether or not two classes of UDGs exist, one as extreme case of dwarf galaxies and the other as pure UDGs, with distinct formation scenarios, structural parameters and photometric properties; and ii) what is the fraction of baryonic versus DM content in UDGs, and whether this fraction differes for the two putative classes. if the majority of UDGS turns out to be without DM, then the current paradigm of galaxy formation should be revised and better understood in the specific parameter space occupied these galaxy systems.
In this letter we report the discovery of 12 UDG candidates in the Hydra I cluster. This is a rich environment of galaxies located at Mpc (Christlein & Zabludoff, 2003), with a virial mass of M⊙ (Girardi et al., 1998), from which we derived a virial radius Mpc. The cluster core is dominated by the two brightest early-type galaxies, NGC 3309 and NGC 3311, embedded in an extended diffuse stellar halo (Arnaboldi et al., 2012). Most of the recent studies of Hydra I focused on the light distribution and kinematics in the cluster core, which showed the presence of ongoing interactions and traced the extended mass assembly around NGC 3311 (Ventimiglia et al., 2011; Richtler et al., 2011; Coccato et al., 2011; Misgeld et al., 2008, 2011; Arnaboldi et al., 2012; Koch et al., 2012; Barbosa et al., 2018; Hilker et al., 2018). We carry out here the first search for UDGs enabled by a new wide area and deep imaging dataset.
2 Observations, data analysis and UDGs identification
The Hydra I cluster is a target of the VST Early-type Galaxy Survey (VEGAS111see http://www.na.astro.it/vegas/VEGAS/Welcome.html), a multi-band (u,g,r,i), deep imaging survey carried out with the European Southern Observatory (ESO) VLT Survey Telescope (VST). VST is a 2.6 m wide field optical telescope (Schipani et al., 2012), equipped with OmegaCAM, a camera with a resolution of arcsec pixel-1. The imaging data for the Hydra I cluster, presented in this work, were collected in the and bands, in dark time, with a total integration times of 2.8 and 3.22 hours, respectively. The measured image quality had an average FWHM arcsec. Data were acquired with the step dither observing strategy, consisting of a cycle of short exposures ( sec) on the science target and on an adjacent field (close in space and time) to the science frame. This strategy was adopted also for other VEGAS targets (Spavone et al., 2018; Iodice et al., 2020) and for the Fornax Deep Survey (FDS, Iodice et al., 2016; Venhola et al., 2018; Iodice et al., 2019). It certifies a very accurate estimate of the sky background. For the Hydra I dataset, a 7-magnitude bright star falls on the NE side of the cluster core, and was always put in one of the two wide OmegaCAM gaps during observations, to reduce the scattered light.
The data reduction was performed using VST-Tube, which is one of the dedicated pipelines to process OmegaCAM observations (Grado et al., 2012; Capaccioli et al., 2015). For the final stacked images we estimated surface brightness depths222Derived as the flux corresponding to , with estimated over an empty area of 1 arcsec. of mag and mag in the and bands, respectively. The light of the two bright stars close to the cluster core has been modelled and subtracted from the reduced images.
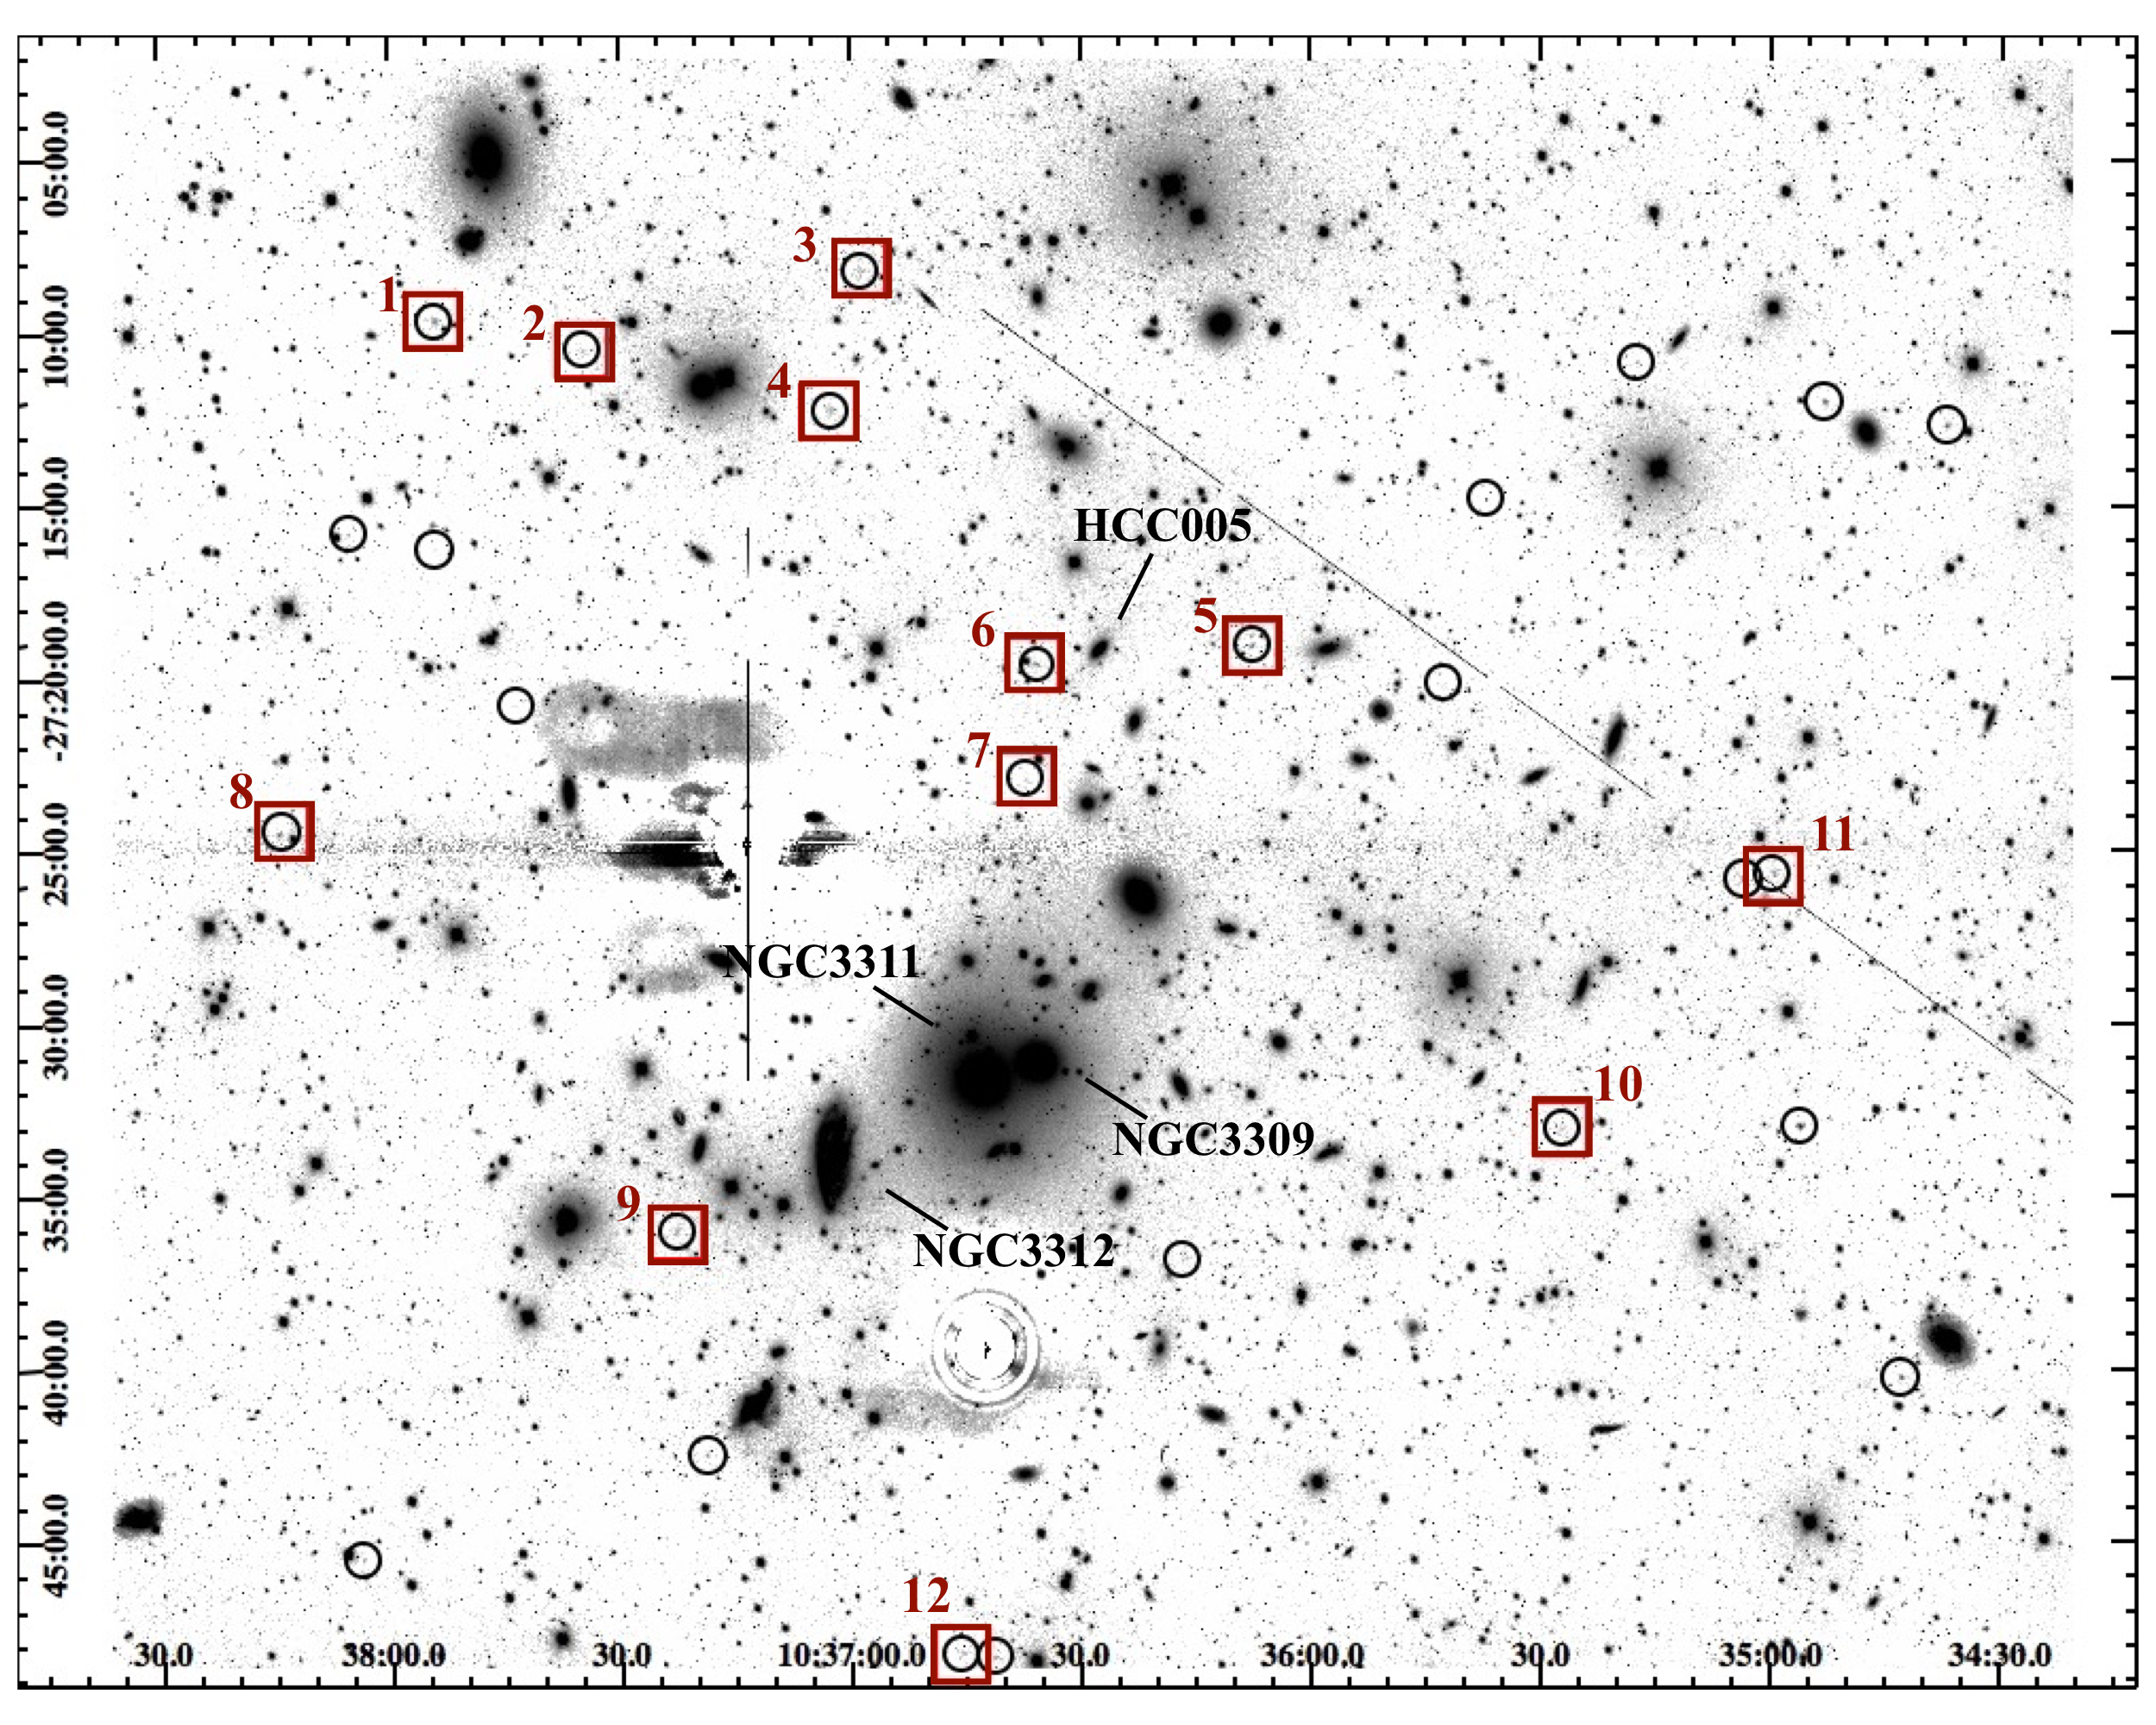
The final VST mosaic extends over ( Mpc), which covers the cluster out to the virial radius ( Mpc). A portion of the mosaic centred on the cluster core is shown in Fig. 1. By visual inspection of this area, looking for faint, diffuse and extended objects, we identified 27 LSB galaxies that are not included in previous catalogues (Christlein & Zabludoff, 2003; Misgeld et al., 2008), since they are below the detection limits of such studies (see Sec. 3). All 27 identified LSB candidates are marked with black circles in Fig. 1.
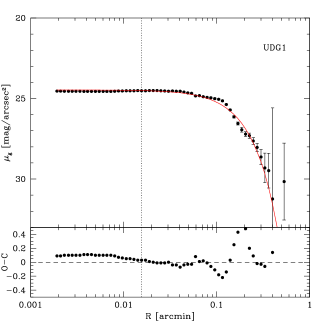
For each LSB candidate we i) extracted a thumbnail from the mosaic (three times more extended than the target) where all bright stars are modelled and subtracted, while the remaining fainter sources are masked, and a residual local background is subtracted; ii) performed the isophote fitting, by using the IRAF task ELLIPSE, to obtain the azimuthally averaged and -band surface brightness profiles, the total magnitudes and the average colours; iii) derived the 2-dimensional (2D) fit of the galaxy light, in the band, by using GALFIT (Peng et al., 2010) and adopting a single Sersic function, with all structural parameters left free. All LSB galaxies are on average 10 to 100 times more extended than the FWHM of the point-spread function, therefore we discarded the convolution step in the modelling and simply excluded the central regions affected by the seeing disk ( arcsec).
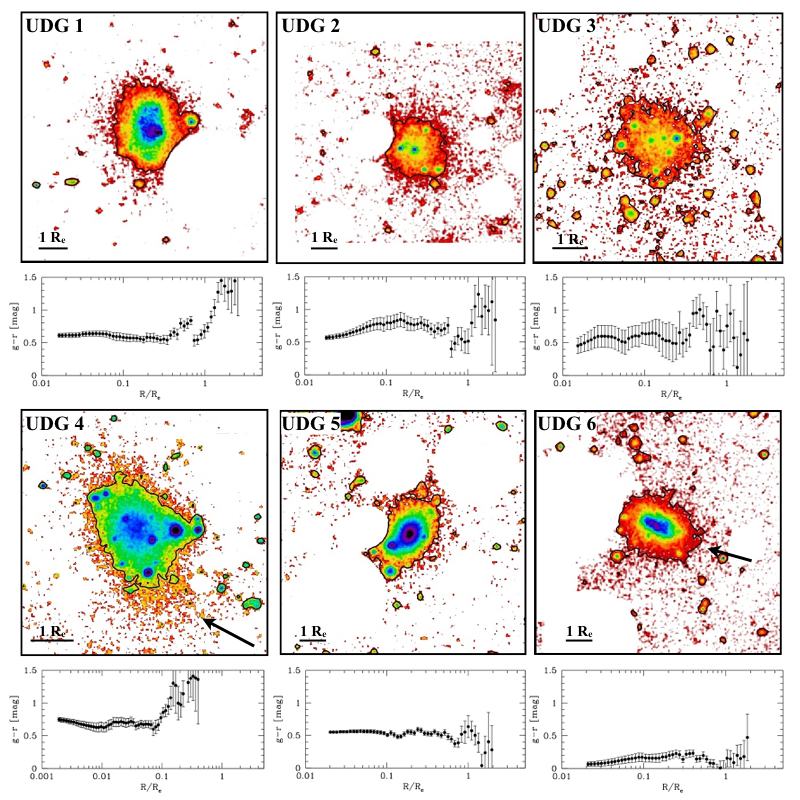
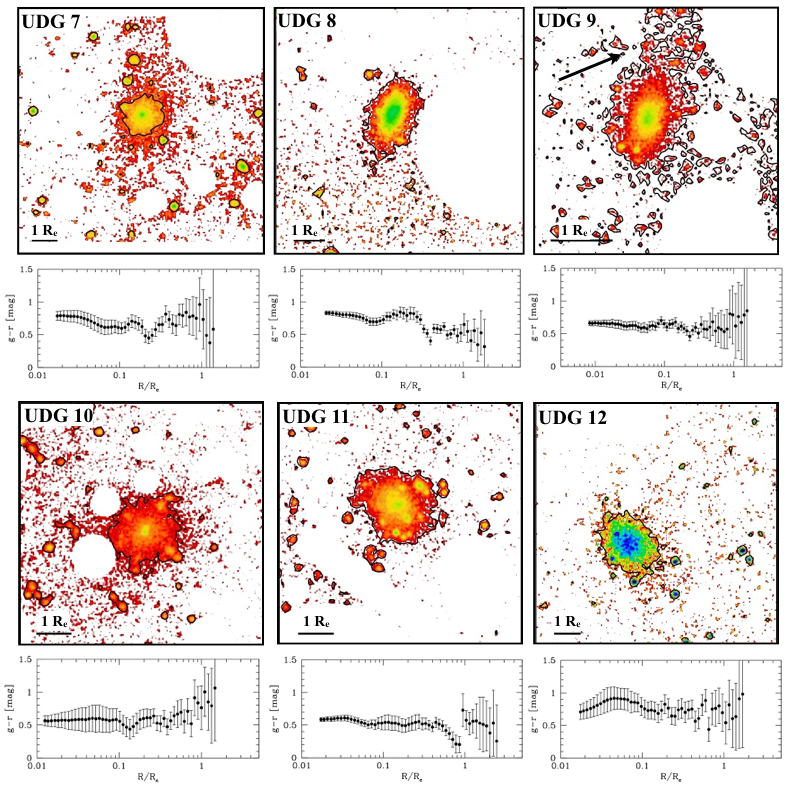
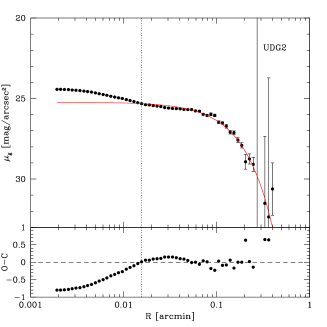
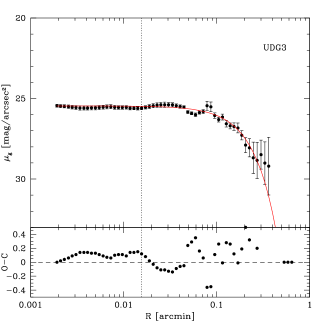
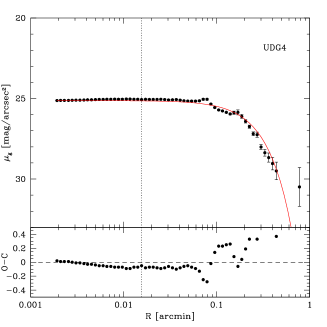
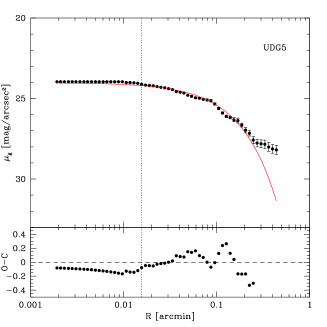
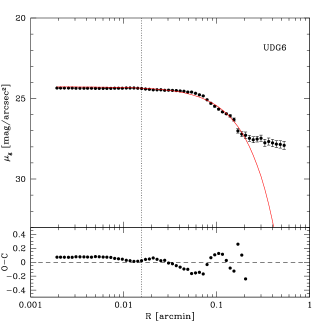
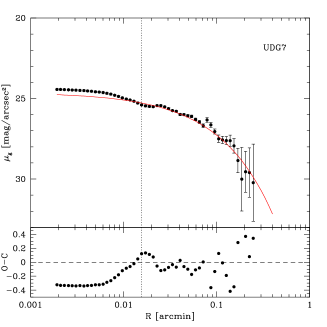
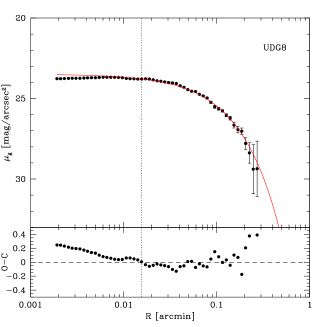
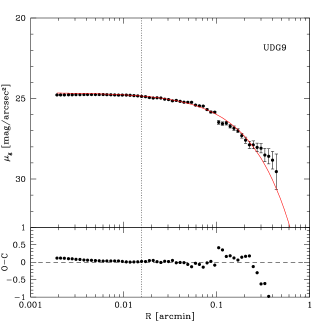
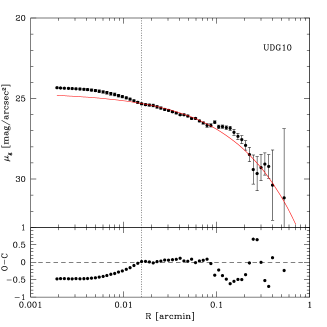
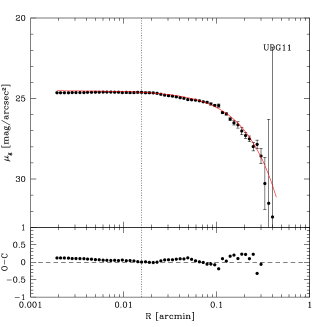
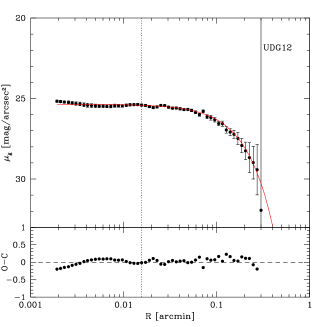
Assuming a distance of Mpc (Christlein & Zabludoff, 2003), we adopted the van Dokkum et al. (2015) selection criteria (i.e. kpc and mag/arcsec2 in band) to identify UDG candidates from the list of 27 LSB galaxies. Taking into account the error estimates333The error estimates on and take into account the uncertainties on the fitting, which are about 0.2% and 6%, respectively, and on the sky removal for () and on the distance () for . for and , we found nine objects falling in the region consistent with UDGs, and additional three galaxies that cross the lower limit for the value, considering the uncertainty on the distance ( kpc). To be as complete as possible, we also include these objects since they are consistent with the selection criteria within the uncertainties. Therefore, the final list is made of 12 UDG candidates and is given in Tab. 1. All remaining LSB galaxies are listed in Tab. 2. In both tables we include the total luminosity, colours and structural parameters. The location of the selected UDGs inside the cluster is displayed in Fig. 1 with red boxes, and the cutout of each UDG is shown in Figs. 2 and 3. The azimuthally averaged surface brightness profiles for the UDG candidates and the relative best fits are shown in Fig. 4.
2.1 Detection of the globular clusters in UDGs
To identify GCs around the UDGs we applied the same strategy already used in other works based on VST data, where a combination of the detected sources’ magnitude, colours, and shape parameters is adopted to identify GC candidates (Cantiello et al., 2015, 2018a, 2020). Briefly, we proceeded as follows. We first ran SExtractor (Bertin & Arnouts, 1996) on image cutouts centred on UDG, with size on each side. To improve source detection and deblending down to the faintest magnitude level, the galaxy model derived from GALFIT was subtracted from both the and frames. For each source we derived the automated aperture magnitude based on Kron (1980) first moment algorithms (SExtractor , where refers to the - or the -band), and the aperture magnitude within 4 and 6 pixels diameters (). We used to estimate the total magnitude of the source, while the aperture magnitudes is adopted for the colour of the source, and the concentration index (), which is an indicator of source compactness (Peng et al., 2011).
At the adopted distance of Hydra I, the turn-over magnitude (TOM) of the GC luminosity function (GCLF) is mag (e.g. Villegas et al., 2010), and mag, based on a median (mag) for the GC population (Cantiello et al., 2018b). The TOM in both bands roughly matches with the image limiting magnitude, defined as the AB magnitude, determined from the median S/N estimated as .
To identify GC candidates, we selected sources with the following characteristics: i) band magnitude between 23.5 and 26 mag, i.e. the expected range between the TOM and 3 mag brighter (Villegas et al., 2010); ii) colour within the interval mag; iii) SExtractor ; v) elongation, i.e. major-to-minor axis ratio in both bands; iv) concentration index within mag of the sequence of local point sources (see Cantiello et al., 2020, for more details).
In order to select the GC members of each UDG we need to correct for the contamination of the sample due to foreground stars, background compact galaxies and possible intra-cluster GCs. This is most effectively achieved by estimating the local contamination in the spatial regions between around each UDG candidate. The number of contaminants subtracted from the sample of GCs selected in each galaxy is on average arcmin-2.
We obtained two different estimates of the total number of GCs (). Adopting the approach suggested by van Dokkum et al. (2016), we estimated the total population within 1.5 . In addition, the total number of GCs within , which is the upper limit for bound systems (Kartha et al., 2014; Forbes, 2017; Caso et al., 2019), is also derived. Since the photometry reaches roughly the TOM peak and assuming that the GCLF is a Gaussian also for the UDGs (e.g. Hanes, 1977; Rejkuba, 2012; van Dokkum et al., 2016), we derived as twice the background corrected GC density over the area of the UDG, times the area. The only difference with the within 1.5 is that it is assumed that only half of the GC population is within 1.5 , hence the total population is estimated as four times the background corrected GC density over 1.5 area, times the area.
We also estimated the GCs background level in three independent fields located outside the virial radius of the cluster, wide on each side, by running the same detection and selection procedures outlined above. The estimated GC background density obtained is arcmin-2, a value either consistent with the background around the UDGs, or lower than that, indicating the presence of GCs contaminants from close GC systems of major galaxies or due to intra-cluster GCs. We verified that the level of foreground contamination by Milky Way stars in the direction of Hydra I is of the number we estimated from real data, by using both the TRILEGAL and Besancon models (Girardi et al., 2005; Robin et al., 2003).
The uncertainty on is derived by propagating a error on the adopted scaling factors (i.e., two for at 5 , and four at , respectively), a 10% for the error on the density of background sources (slightly larger than the from the three background fields outside the cluster core), and a contamination on the density of GC candidates over the UDG area. The two estimates agree within the adopted uncertainties and they are listed in Tab. 3. We found that six UDGs have consistent with zero, independently from the approach adopted to estimate it. Two out of the 12 galaxies (UDG 3 and UDG 11) have different from zero at level. One object (UDG 4) has different from zero at only for both estimates. All other UDGs in the sample have between 1 and 2 different than zero, depending on the approach used (UDG 2, UDG 7, UDG 9).
is used to estimate i) the total halo mass for those UDGs with a significant number of GCs, by using the empirical relation (Burkert & Forbes, 2020), and ii) the GCs specific frequency444 The V-magnitude and, therefore, the colour transformation from to V-I are derived by assuming the equations given by Kostov & Bonev (2018). . Values for both quantities are given in Tab. 3. The level of uncertainty on and the number of GC systems consistent with for half of UDGs in the sample imply that our estimated and suffer from correspondingly large uncertainties, and are in most cases formally consistent with zero. In future works, with more detailed characterisation of the GCs population extended over the survey area, we will be able to perform a more refined analysis of the GC numbers.
3 Results: UDGs structure and mass content
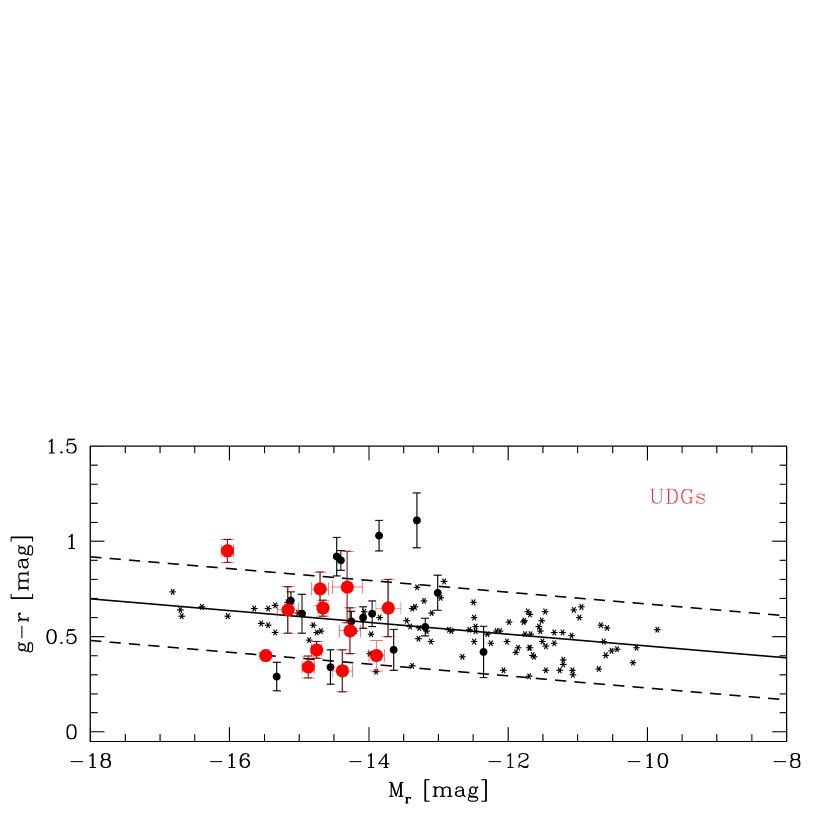
The colour-magnitude diagram (CMD) of the full sample of LSB galaxies and UDGs visually identified is shown in Figure 5. The figure also includes the colour-magnitude relations derived by Misgeld et al. (2008) for giant and dwarf galaxies in Hydra I. In this plane, based on the error estimates, 25 out of 27 LSB galaxies match with the plotted sequence.
In the range of magnitudes mag to mag, the colours of UDGs are consistent with the known early-type dwarf galaxy population in Hydra I, with mag. Similar colours, in the same range of luminosity, were found for the dwarf galaxies in the Fornax cluster (Venhola et al., 2019), as well as for the UDGs in the Abell 186 cluster (Román & Trujillo, 2017), i.e. mag.
UDG 4, the reddest and brightest LSB galaxy in the sample ( mag, mag, Tab. 1), being mag beyond the boundary of the CMD, might rather be a background galaxy. Unfortunately, the distance for this galaxy is unknown. However, even though we cannot derive any definitive conclusion on its membership, since this is one of the most extended and diffuse galaxies of the whole LSB sample (with kpc, mag/arcsec2, see Tab. 1), it remains an interesting object to include in our analysis.
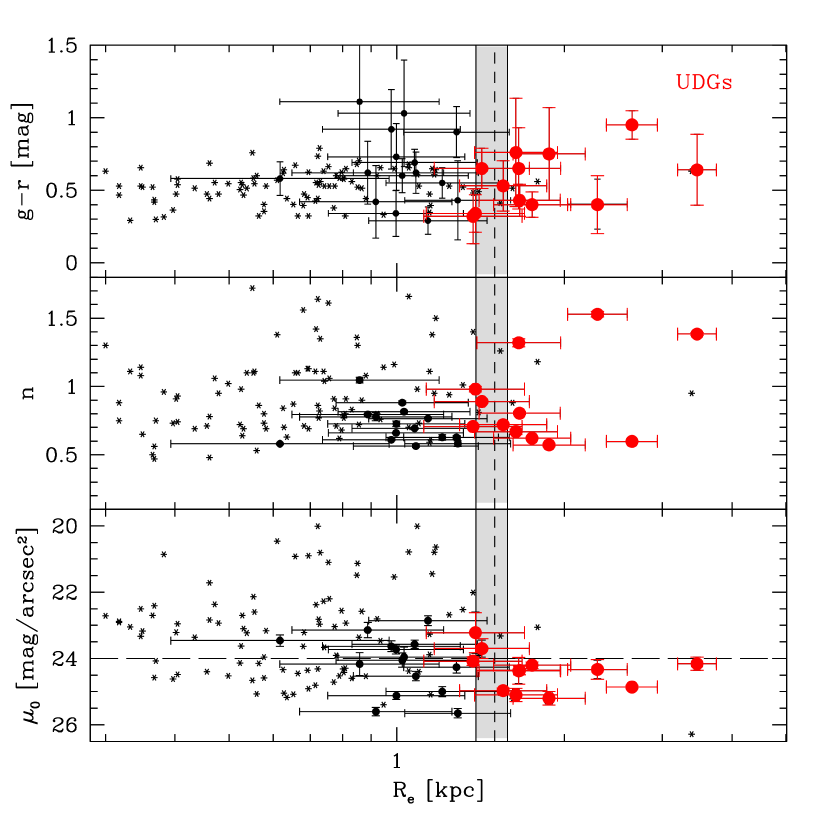
The detected LSB candidates and the selected UDGs are plotted on the plane, in Fig. 6. In this figure we also plot the dwarf galaxies from the Misgeld et al. (2008) catalogue. All our LSB galaxies are new candidates, fainter and more extended, with respect to the objects in that catalogue. Only one LSB galaxy in Misgeld et al. (2008) catalogue, HCC 087, falls in the selection region of UDGs. However, it was described as a faint ( mag/arcsec2 in the band) tidally disrupted dwarf because of its peculiar S-shape (Koch et al., 2012).
In Fig. 6 (middle and upper panels) we examine the correlations between the Sersic -exponent and average colours as a function of , for both the new LSB galaxies (including UDGs) and the dwarf galaxies from Misgeld et al. (2008). Most of the LSB galaxies and UDGs have comparable colours with those observed for cluster dwarfs, in the range mag. The Sersic -exponents derived for galaxies in the sample presented here are consistent with the values for dwarfs ().
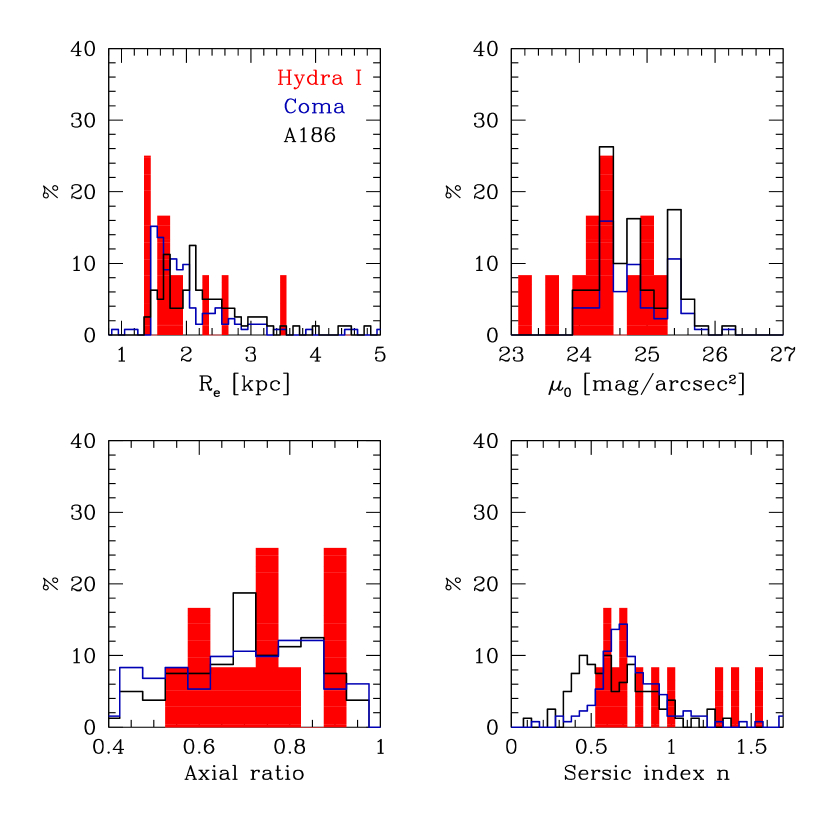
In Fig. 7 we show the distributions of the structural parameters (axial ratio , Sersic index , effective radius and central surface brightness ) derived for the UDG candidates in Hydra I cluster. They are consistent with those obtained for the UDGs in the Coma and Abell 168 clusters (Yagi et al., 2016; Román & Trujillo, 2017), as well as with the results from more recent studies on UDGs in clusters of galaxies (Lee et al., 2020). As observed in other clusters, UDGs in Hydra I seem to be quite round systems, with in the range 0.6-0.8, and most of them have a Sersic index , with an average value , and only a few UDGs have larger values for the -exponent.
3.1 Structure and colour distribution
The deep VST images allow us to map the surface brightness distribution of the UDGs down to mag/arcsec2 (see Figs. 2 and 3). At these depths, we are able to study the galaxy outskirts and detect any signs of tidal features.
This seems to be the case of UDG 4, UDG 6 and UDG 9. The structure of UDG 4 is quite irregular in the outskirts, showing a clear over-density of light on the SW side. UDG 6 and UDG 9 have more regular spheroidal-like shapes, however they present tidal features in the outskirts and are located towards the central part of the Hydra I cluster, as shown by the brighter X-ray emission (Hayakawa et al., 2004, 2006). We describe their outer morphologies hereafter: UDG 6 has spiral-like tails on the SW side. It is located North of the cluster core (see Fig. 1), where tidal forces might be acting on the galaxies: on the west there is HCC 005, an S0 galaxy with a prominent tidal tail, and it is near the tidally disrupted dwarf galaxy HCC 087 (Koch et al., 2012). UDG 9 has an extended tail ( arcmin) on the NW side that protrudes from the elongated isophotes of this galaxy in this direction. UDG 9 is projected on the SE region of the cluster core, inside the infalling subgroup dominated by the bright spiral galaxy NGC 3312, where the effect of ram pressure is visible in the form of several extended blue filaments. Tidal features around UDGs have also been observed in other clusters for objects that are close to major galaxies (Mihos et al., 2015; Lee et al., 2017). Such features would support the tidal interaction formation scenario (Amorisco, 2018; van Dokkum et al., 2016; Di Cintio et al., 2017; Carleton et al., 2019; Sales et al., 2020).
Close to the centres of UDG 1 and UDG 5 the are signs of an ongoing interaction. In UDG 1 we detected a spiral-like feature that ends with a bright nucleus on the west. In UDG 5 there is a small system on the SE side that seems to be merging into the galaxy core.
The colour profiles are on average flat inside for most of the UDGs, in the range mag (see Fig. 2 and Fig. 3). UDG 4, UDG 7, and UDG 8 show redder colours toward the centre, reaching mag. Some other UDGs (UDG 2, UDG 3, UDG 6 and UDG 12) have instead bluer colours in the centre, decreasing by mag with respect to the outer regions.
3.2 Compact sources in UDGs
For most of the UDGs we were able to to identify compact sources in their surroundings. (see Sec. 2.1). Overall, we found that most of the UDGs host only a few GCs, with for six out of 12 UDG candidates inside (see Tab. 3). UDG 3 and UDG 9 are the two objects with the largest number of GCs, having and inside , respectively. For six UDGs, the predicted number of GCs is consistent with zero, within both and .
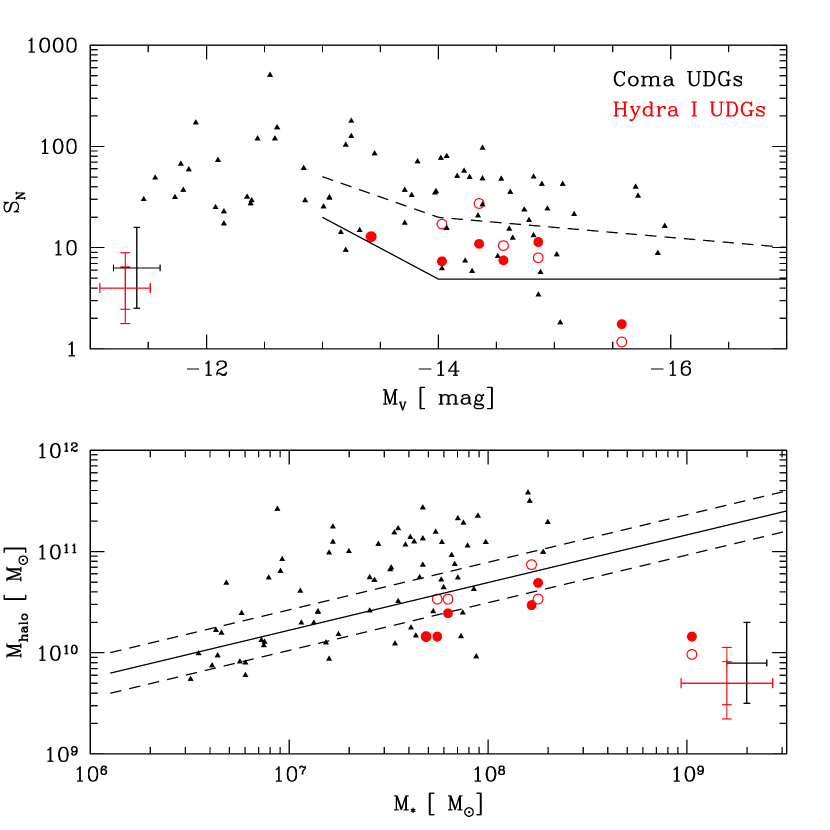
As observed in previous studies with larger samples, we found that for most of the UDGs in Hydra I, the GCs specific frequency is consistent with the upper limits derived for dwarf galaxies of comparable luminosity (see top panel of Fig. 8), and it is fully consistent with values derived for UDGs in the Coma cluster (see van Dokkum et al., 2017; Amorisco et al., 2018; Lim et al., 2018; Forbes et al., 2020a). UDG 3, UDG 7 and UDG 9 are the galaxies with the largest (). Two of them, UDG 7 and UDG 9, are close in projection to the cluster core. While the actual for our targets needs to be confirmed through follow-up studies, this appears in agreement with suggestions from Lim et al. (2018), who reported, although with a large scatter, a trend between and environment, where UDGs with higher are located in the densest cluster regions.
Consistent with previous results, about 30% of the UDGs in our sample shows a nuclear star cluster (NSC) candidate, which are the brightest ’GCs’ in their respective GC systems and are located very close to the galaxy centre. As a comparison, the nucleation fraction is about 23% for UDGs in Coma (Lim et al., 2018). The two NSC candidates in UDG 2 are very close to the galaxy centre ( arcsec) and have a and mag. UDG 3 hosts a NSC candidate inside 1 arcsec from the centre, with mag, though also a second, brighter mag, source is consistent with a star cluster located at arcsec from the galaxy centre (see also Fig. 2). The candidate NSC in UDG 7 is in the galaxy centre and has a relatively faint g-band magnitude of mag. In UDG 10 there are two close sources within the galaxy centre that could be also classified as NSCs.
3.3 Stellar mass versus DM content
The colours and absolute magnitudes in the band (Mr) are used to derive the stellar mass for all UDG candidates, using the relation given by Into & Portinari (2013). Values are listed in Tab. 1. Most of the UDGs have stellar masses in the range M⊙. The halo mass range, estimated from the total number of GCs (see Sec. 2.1) for half of the UDGs in the sample, is M⊙ (see Tab. 3). By propagating the large uncertainties on , the error estimate on is quite large, ranging from 40% to 80%. The mass-to-light ratio derived for these six UDGs is in the range . UDG 3, which is one of the galaxies with the highest (see Tab. 1 and Tab. 3), has the largest . The lowest is derived for UDG 4, which is also the system with the lowest . Therefore, if UDG 4 is confirmed as Hydra I member in future investigations, it might have a low amount of DM compared to what is expected for its total luminosity. However, the estimated in this case is consistent with zero within , therefore, given its high luminosity, the absence of GCs would point toward this galaxy being a background object.
In the halo mass versus stellar mass relation, within the uncertainties, the UDGs in Hydra I have halo masses consistent with normal galaxies of comparable luminosity, as well as with UDGs in the Coma cluster (see lower panel of Fig. 8).
4 Summary and Concluding remarks
From the visual inspection of a new mosaic image obtained for the Hydra I cluster, with VST and imaging, we identified a sample of 27 LSB galaxies, which are not included in any previous catalogue. 12 LSB galaxies are selected as UDG candidates. This is the first sample of UDGs in the Hydra I cluster.
Since the nature and formation of the UDGs is still poorly constrained, even from works based on larger samples, this study aims at extending such studies to the Hydra I cluster, which had so far limited studies in the low surface brightness regime.
We have found that most of the UDGs have stellar masses in the range M⊙. Given the limitations of a reliable GC selection based on two relatively close optical bands only, we find that half the UDG candidates have a total population of GCs consistent with zero (). The other half of UDGs, seem to have a standard or low DM content, with halo mass M⊙, comparable with dwarf galaxies of similar luminosity.
In conclusion, even considering the small number of UDGs, the analysis presented in this work might suggest that most of the UDGs in Hydra I cluster resemble diffuse dwarf-like galaxies in terms of their stellar mass and DM content, with comparable colours to those of dwarf galaxies in the same range of luminosity. This result, however, suffers from the large uncertainties coming from the estimates. In particular, due to the low number of tracers and large contamination from fore- and background objects, the DM estimate from GCs is quite uncertain. Follow-up studies, which include both deep multi-band imaging data, preferably including near-IR bands, coupled with a more detailed analysis over the entire area surveyed (which is in progress), and integral field spectroscopy, will substantially help in reducing such uncertainty. Future systematic searches for UDGs and their analysis in this cluster, will be fundamental to check whether DM-dominated systems are also present and, therefore, to put further observational constraints on the existence of two distinct formation channels for this class of galaxies.
Taking into account the virial mass of the Hydra I cluster ( M⊙, Girardi et al., 1998), from the abundance-halo mass relation (Janssens et al., 2019) we expect up to 100 UDGs inside the cluster virial radius. A follow up study, where the UDG detection is not carried out visually, but using automated tools already tested on the Fornax galaxy cluster (Venhola et al., 2019), is in progress.
This work is part of a large program to study the internal structure, formation history, evolution and DM fraction in UDGs across different environments identified from the deep, wide-field imaging data of VEGAS. By using automatic LSB detection tools on the entire VEGAS sample, which includes about 30 groups and 10 clusters of galaxies for a total covered area of more than deg2, we aim at identifying and studying a large number (1300) of UDGs. The new sample will almost double the number of studied UDGs and will have a legacy value for future follow-up imaging and spectroscopic observations.
Acknowledgements.
This work is based on visitor mode observations taken at the ESO La Silla Paranal Observatory within the VST Guaranteed Time Observations, Programme ID: 099.B-0560(A). We thank the anonymous referee for his/her useful suggestions that helped to improve the paper. EI acknowledge financial support from the ESO during the science visit at the Garching HQ, from September 1st, 2019 up to August 2020. MS and EI acknowledge finacial support from the VST project (P.I. P. Schipani). Authors wish to thank ESO for the financial contribution given for the visitor mode runs at the ESO La Silla Paranal Observatory. GD acknowledges support from CONICYT project Basal AFB-170002.References
- Alabi et al. (2018) Alabi, A., Ferré-Mateu, A., Romanowsky, A. J., et al. 2018, MNRAS, 479, 3308
- Amorisco (2018) Amorisco, N. C. 2018, MNRAS, 475, L116
- Amorisco & Loeb (2016) Amorisco, N. C. & Loeb, A. 2016, MNRAS, 459, L51
- Amorisco et al. (2018) Amorisco, N. C., Monachesi, A., Agnello, A., & White, S. D. M. 2018, MNRAS, 475, 4235
- Arnaboldi et al. (2012) Arnaboldi, M., Ventimiglia, G., Iodice, E., Gerhard, O., & Coccato, L. 2012, A&A, 545, A37
- Barbosa et al. (2018) Barbosa, C. E., Arnaboldi, M., Coccato, L., et al. 2018, A&A, 609, A78
- Beasley et al. (2016) Beasley, M. A., Romanowsky, A. J., Pota, V., et al. 2016, ApJ, 819, L20
- Beasley & Trujillo (2016) Beasley, M. A. & Trujillo, I. 2016, ApJ, 830, 23
- Bertin & Arnouts (1996) Bertin, E. & Arnouts, S. 1996, A&AS, 117, 393
- Burkert & Forbes (2020) Burkert, A. & Forbes, D. A. 2020, AJ, 159, 56
- Cantiello et al. (2015) Cantiello, M., Capaccioli, M., Napolitano, N., et al. 2015, A&A, 576, A14
- Cantiello et al. (2018a) Cantiello, M., D’Abrusco, R., Spavone, M., et al. 2018a, A&A, 611, A93
- Cantiello et al. (2018b) Cantiello, M., Grado, A., Rejkuba, M., et al. 2018b, A&A, 611, A21
- Cantiello et al. (2020) Cantiello, M., Venhola, A., Grado, A., et al. 2020, arXiv e-prints, arXiv:2005.12085
- Capaccioli et al. (2015) Capaccioli, M., Spavone, M., Grado, A., et al. 2015, A&A, 581, A10
- Carleton et al. (2019) Carleton, T., Errani, R., Cooper, M., et al. 2019, MNRAS, 485, 382
- Caso et al. (2019) Caso, J. P., De Bórtoli, B. J., Ennis, A. I., & Bassino, L. P. 2019, MNRAS, 488, 4504
- Christlein & Zabludoff (2003) Christlein, D. & Zabludoff, A. I. 2003, ApJ, 591, 764
- Coccato et al. (2011) Coccato, L., Gerhard, O., Arnaboldi, M., & Ventimiglia, G. 2011, A&A, 533, A138
- Danieli et al. (2019) Danieli, S., van Dokkum, P., Conroy, C., Abraham, R., & Romanowsky, A. J. 2019, ApJ, 874, L12
- Di Cintio et al. (2017) Di Cintio, A., Brook, C. B., Dutton, A. A., et al. 2017, MNRAS, 466, L1
- Fensch et al. (2019) Fensch, J., van der Burg, R. F. J., Jeřábková, T., et al. 2019, A&A, 625, A77
- Ferré-Mateu et al. (2018) Ferré-Mateu, A., Alabi, A., Forbes, D. A., et al. 2018, MNRAS, 479, 4891
- Forbes (2017) Forbes, D. A. 2017, MNRAS, 472, L104
- Forbes et al. (2020a) Forbes, D. A., Alabi, A., Romanowsky, A. J., Brodie, J. P., & Arimoto, N. 2020a, MNRAS, 492, 4874
- Forbes et al. (2020b) Forbes, D. A., Dullo, B. T., Gannon, J., et al. 2020b, MNRAS[arXiv:2004.10855]
- Forbes et al. (2019) Forbes, D. A., Gannon, J., Couch, W. J., et al. 2019, A&A, 626, A66
- Girardi et al. (2005) Girardi, L., Groenewegen, M. A. T., Hatziminaoglou, E., & da Costa, L. 2005, A&A, 436, 895
- Girardi et al. (1998) Girardi, M., Borgani, S., Giuricin, G., Mardirossian, F., & Mezzetti, M. 1998, ApJ, 506, 45
- Grado et al. (2012) Grado, A., Capaccioli, M., Limatola, L., & Getman, F. 2012, Memorie della Societa Astronomica Italiana Supplementi, 19, 362
- Gu et al. (2018) Gu, M., Conroy, C., Law, D., et al. 2018, ApJ, 859, 37
- Hanes (1977) Hanes, D. A. 1977, MNRAS, 180, 309
- Hayakawa et al. (2004) Hayakawa, A., Furusho, T., Yamasaki, N. Y., Ishida, M., & Ohashi, T. 2004, PASJ, 56, 743
- Hayakawa et al. (2006) Hayakawa, A., Hoshino, A., Ishida, M., et al. 2006, PASJ, 58, 695
- Hilker et al. (2018) Hilker, M., Richtler, T., Barbosa, C. E., et al. 2018, A&A, 619, A70
- Into & Portinari (2013) Into, T. & Portinari, L. 2013, MNRAS, 430, 2715
- Iodice et al. (2016) Iodice, E., Capaccioli, M., Grado, A., et al. 2016, ApJ, 820, 42
- Iodice et al. (2019) Iodice, E., Spavone, M., Capaccioli, M., et al. 2019, A&A, 623, A1
- Iodice et al. (2020) Iodice, E., Spavone, M., Cattapan, A., et al. 2020, A&A, 635, A3
- Janssens et al. (2019) Janssens, S. R., Abraham, R., Brodie, J., Forbes, D. A., & Romanowsky, A. J. 2019, ApJ, 887, 92
- Kartha et al. (2014) Kartha, S. S., Forbes, D. A., Spitler, L. R., et al. 2014, MNRAS, 437, 273
- Koch et al. (2012) Koch, A., Burkert, A., Rich, R. M., et al. 2012, ApJ, 755, L13
- Koda et al. (2015) Koda, J., Yagi, M., Yamanoi, H., & Komiyama, Y. 2015, ApJ, 807, L2
- Kostov & Bonev (2018) Kostov, A. & Bonev, T. 2018, Bulgarian Astronomical Journal, 28, 3
- Kron (1980) Kron, R. G. 1980, ApJS, 43, 305
- Lee et al. (2020) Lee, J. H., Kang, J., Lee, M. G., & Jang, I. S. 2020, arXiv e-prints, arXiv:2004.01340
- Lee et al. (2017) Lee, M. G., Kang, J., Lee, J. H., & Jang, I. S. 2017, ApJ, 844, 157
- Leisman et al. (2017) Leisman, L., Haynes, M. P., Janowiecki, S., et al. 2017, ApJ, 842, 133
- Lim et al. (2018) Lim, S., Peng, E. W., Côté, P., et al. 2018, ApJ, 862, 82
- Martín-Navarro et al. (2019) Martín-Navarro, I., Romanowsky, A. J., Brodie, J. P., et al. 2019, MNRAS, 484, 3425
- Mihos et al. (2015) Mihos, J. C., Durrell, P. R., Ferrarese, L., et al. 2015, ApJ, 809, L21
- Misgeld et al. (2008) Misgeld, I., Mieske, S., & Hilker, M. 2008, A&A, 486, 697
- Misgeld et al. (2011) Misgeld, I., Mieske, S., Hilker, M., et al. 2011, A&A, 531, A4
- Müller et al. (2018) Müller, O., Jerjen, H., & Binggeli, B. 2018, A&A, 615, A105
- Peng et al. (2011) Peng, E. W., Ferguson, H. C., Goudfrooij, P., et al. 2011, ApJ, 730, 23
- Peng & Lim (2016) Peng, E. W. & Lim, S. 2016, ApJ, 822, L31
- Peng et al. (2010) Peng, Y.-j., Lilly, S. J., Kovač, K., et al. 2010, ApJ, 721, 193
- Prole et al. (2019a) Prole, D. J., Hilker, M., van der Burg, R. F. J., et al. 2019a, MNRAS, 484, 4865
- Prole et al. (2019b) Prole, D. J., van der Burg, R. F. J., Hilker, M., & Davies, J. I. 2019b, MNRAS, 488, 2143
- Rejkuba (2012) Rejkuba, M. 2012, Ap&SS, 341, 195
- Richtler et al. (2011) Richtler, T., Salinas, R., Misgeld, I., et al. 2011, A&A, 531, A119
- Robin et al. (2003) Robin, A. C., Reylé, C., Derrière, S., & Picaud, S. 2003, A&A, 409, 523
- Rodríguez-Puebla et al. (2017) Rodríguez-Puebla, A., Primack, J. R., Avila-Reese, V., & Faber, S. M. 2017, MNRAS, 470, 651
- Román & Trujillo (2017) Román, J. & Trujillo, I. 2017, MNRAS, 468, 703
- Rong et al. (2017) Rong, Y., Guo, Q., Gao, L., et al. 2017, MNRAS, 470, 4231
- Ruiz-Lara et al. (2018) Ruiz-Lara, T., Beasley, M. A., Falcón-Barroso, J., et al. 2018, MNRAS, 478, 2034
- Sales et al. (2020) Sales, L. V., Navarro, J. F., Peñafiel, L., et al. 2020, MNRAS, 494, 1848
- Schipani et al. (2012) Schipani, P., Noethe, L., Arcidiacono, C., et al. 2012, Journal of the Optical Society of America A, 29, 1359
- Schlegel et al. (1998) Schlegel, D. J., Finkbeiner, D. P., & Davis, M. 1998, ApJ, 500, 525
- Shi et al. (2017) Shi, D. D., Zheng, X. Z., Zhao, H. B., et al. 2017, ApJ, 846, 26
- Spavone et al. (2018) Spavone, M., Iodice, E., Capaccioli, M., et al. 2018, ApJ, 864, 149
- Tremmel et al. (2019) Tremmel, M. J., Wright, A., Munshi, F., et al. 2019, in American Astronomical Society Meeting Abstracts, Vol. 233, American Astronomical Society Meeting Abstracts #233, 416.04
- van der Burg et al. (2017) van der Burg, R. F. J., Hoekstra, H., Muzzin, A., et al. 2017, A&A, 607, A79
- van Dokkum et al. (2016) van Dokkum, P., Abraham, R., Brodie, J., et al. 2016, ApJ, 828, L6
- van Dokkum et al. (2017) van Dokkum, P., Abraham, R., Romanowsky, A. J., et al. 2017, ApJ, 844, L11
- van Dokkum et al. (2019a) van Dokkum, P., Danieli, S., Abraham, R., Conroy, C., & Romanowsky, A. J. 2019a, ApJ, 874, L5
- van Dokkum et al. (2019b) van Dokkum, P., Wasserman, A., Danieli, S., et al. 2019b, ApJ, 880, 91
- van Dokkum et al. (2015) van Dokkum, P. G., Romanowsky, A. J., Abraham, R., et al. 2015, ApJ, 804, L26
- Venhola et al. (2018) Venhola, A., Peletier, R., Laurikainen, E., et al. 2018, A&A, 620, A165
- Venhola et al. (2019) Venhola, A., Peletier, R., Laurikainen, E., et al. 2019, A&A, 625, A143
- Ventimiglia et al. (2011) Ventimiglia, G., Arnaboldi, M., & Gerhard, O. 2011, A&A, 528, A24
- Villegas et al. (2010) Villegas, D., Jordán, A., Peng, E. W., et al. 2010, ApJ, 717, 603
- Wright et al. (2020) Wright, A. C., Tremmel, M., Brooks, A. M., et al. 2020, arXiv e-prints, arXiv:2005.07634
- Yagi et al. (2016) Yagi, M., Koda, J., Komiyama, Y., & Yamanoi, H. 2016, ApJS, 225, 11
- Yozin & Bekki (2015) Yozin, C. & Bekki, K. 2015, MNRAS, 452, 937
| Object | R.A. | DEC | M/L | M∗ | ||||||
|---|---|---|---|---|---|---|---|---|---|---|
| J2000 | J2000 | [mag] | [mag] | [ M | [mag/arcsec2] | [kpc] | ||||
| Hydra I-UDG 1 | 10:37:54.12 | -27:09:37.50 | -15.48 0.07 | 0.40 0.09 | 0.90 | 1.12 | 24.200.10 | 1.750.12 | 0.6210.005 | 0.7660.003 |
| Hydra I-UDG 2 | 10:37:34.89 | -27:10:29.94 | -14.27 0.05 | 0.53 0.2 | 1.35 | 0.55 | 24.970.08 | 1.550.12 | 0.720.01 | 0.8770.007 |
| Hydra I-UDG 3 | 10:36:58.63 | -27:08:10.21 | -14.7 0.2 | 0.75 0.3 | 2.71 | 1.65 | 25.20.2 | 1.880.12 | 0.5720.013 | 0.790.01 |
| Hydra I-UDG 4 | 10:37:02.64 | -27:12:15.01 | -16.03 0.04 | 0.95 0.10 | 5.11 | 10.6 | 24.860.05 | 2.640.12 | 0.5970.006 | 0.7480.003 |
| Hydra I-UDG 5 | 10:36:07.68 | -27:19:03.26 | -14.66 0.09 | 0.65 0.14 | 1.98 | 1.16 | 23.70.3 | 1.420.12 | 0.890.01 | 0.5820.004 |
| Hydra I-UDG 6 | 10:36:35.80 | -27:19:36.12 | -14.38 0.08 | 0.32 0.2 | 0.70 | 0.32 | 24.080.13 | 1.370.12 | 0.7060.006 | 0.6290.002 |
| Hydra I-UDG 7 | 10:36:37.16 | -27:22:54.93 | -13.72 0.13 | 0.6 0.3 | 1.98 | 0.49 | 24.370.4 | 1.660.12 | 1.320.03 | 0.730.01 |
| Hydra I-UDG 8 | 10:38:14.59 | -27:24:27.07 | -14.87 0.07 | 0.34 0.13 | 0.74 | 0.53 | 23.220.6 | 1.400.12 | 0.980.02 | 0.5780.005 |
| Hydra I-UDG 9 | 10:37:22.85 | -27:36:02.80 | -15.16 0.12 | 0.6 0.2 | 1.92 | 1.78 | 24.20.2 | 3.460.12 | 1.380.01 | 0.540.01 |
| Hydra I-UDG 10 | 10:35:27.32 | -27:33:03.86 | -13.89 0.08 | 0.4 0.2 | 0.90 | 0.26 | 24.330.3 | 2.290.10 | 1.530.02 | 0.900.01 |
| Hydra I-UDG 11 | 10:35:04.16 | -27:26:17.26 | -14.75 0.07 | 0.43 0.11 | 0.99 | 0.63 | 24.360.13 | 1.660.12 | 0.800.01 | 0.920.01 |
| Hydra I-UDG 12 | 10:34:59.55 | -27:25:37.95 | -14.3 0.2 | 0.8 0.4 | 2.8 | 1.19 | 25.10.2 | 1.640.12 | 0.670.02 | 0.720.01 |
| Object | R.A. | DEC | ||||||
|---|---|---|---|---|---|---|---|---|
| J2000 | J2000 | [mag] | [mag] | [mag/arcsec2] | [kpc] | |||
| Hydra I-LSB 1 | 10:35:17.540 | -27:10:51.96 | -13.31 0.14 | 1.1 0.4 | 24.20.3 | 0.860.12 | 1.050.02 | 0.7130.009 |
| Hydra I-LSB 2 | 10:34:53.099 | -27:12:00.06 | -15.12 0.04 | 0.69 0.09 | 23.570.13 | 1.080.12 | 0.690.004 | 0.9030.003 |
| Hydra I-LSB 3 | 10:34:37.181 | -27:12:41.14 | -14.55 0.09 | 0.34 0.15 | 23.730.14 | 0.9970.12 | 0.6600.004 | 0.9790.003 |
| Hydra I-LSB 4 | 10:35:37.232 | -27:14:50.14 | -14.25 0.05 | 0.58 0.12 | 23.50.2 | 0.620.12 | 0.5800.005 | 0.9250.003 |
| Hydra I-LSB 5 | 10:37:54.147 | -27:16:15.31 | -13.64 0.11 | 0.4 0.2 | 25.650.14 | 1.290.12 | 0.580.02 | 0.8580.013 |
| Hydra I-LSB 6 | 10:38:05.430 | -27:15:46.89 | -14.08 0.06 | 0.60 0.11 | 24.00.2 | 1.020.12 | 0.8820.012 | 0.7630.006 |
| Hydra I-LSB 7 | 10:37:43.555 | -27:20:44.73 | -13.19 0.05 | 0.55 0.11 | 25.000.15 | 1.210.12 | 0.630.02 | 0.550.01 |
| Hydra I-LSB 8 | 10:35:42.806 | -27:20:09.61 | -12.35 0.13 | 0.4 0.2 | 25.600.13 | 0.920.13 | 0.780.03 | 0.940.02 |
| Hydra I-LSB 9 | 10:36:16.856 | -27:36:50.83 | -13.01 0.09 | 0.7 0.2 | 25.120.12 | 1.000.12 | 0.730.02 | 0.630.01 |
| Hydra I-LSB 10 | 10:35:03.551 | -27:25:50.07 | -14.46 0.10 | 0.9 0.3 | 23.60.2 | 0.980.12 | 0.6090.006 | 0.6750.003 |
| Hydra I-LSB 11 | 10:34:56.212 | -27:32:57.79 | -15.32 0.07 | 0.29 0.09 | 22.860.15 | 1.140.12 | 0.7650.003 | 0.8340.001 |
| Hydra I-LSB 12 | 10:38:03.959 | -27:45:28.18 | -14.40 0.05 | 0.9 0.2 | 24.30.2 | 1.280.12 | 0.6270.011 | 0.4840.004 |
| Hydra I-LSB 13 | 10:37:19.034 | -27:42:29.29 | -13.95 0.07 | 0.62 0.14 | 24.530.14 | 1.080.12 | 0.560.01 | 0.6530.006 |
| Hydra I-LSB 14 | 10:36:41.231 | -27:48:20.04 | -13.85 0.08 | 1.0 0.4 | 24.00.3 | 1.030.12 | 0.810.01 | 0.5460.005 |
| Hydra I-LSB 15 | 10:34:42.961 | -27:40:14.42 | -14.96 0.10 | 0.6 0.2 | 23.10.2 | 0.890.12 | 0.7950.004 | 0.9200.003 |
| ID | Nuclear star cluster candidates | |||||
|---|---|---|---|---|---|---|
| ( ) | ( ) | M⊙ | ||||
| Hydra I-UDG 1 | 01 | 0 2 | … | … | … | … |
| Hydra I-UDG 2 | 7 3 | 3 2 | 1.4 0.9 | 0.43 | 75 | , and , both within arcsec |
| Hydra I-UDG 3 | 156 | 62 | 31 | 0.96 | 114 | at arcsec, at arcsec |
| Hydra I-UDG 4 | 21 | 34 | 11 | 0.034 | 22 | … |
| Hydra I-UDG 5 | 0 1 | 0 1 | … | … | … | … |
| Hydra I-UDG 6 | 0 1 | 0 1 | … | … | … | … |
| Hydra I-UDG 7 | 3 1 | 32 | 1.40.9 | 0.25 | 138 | at |
| Hydra I-UDG 8 | 0 1 | 0 0 | … | … | … | … |
| Hydra I-UDG 9 | 73 | 108 | 54 | 0.40 | 119 | … |
| Hydra I-UDG 10 | 01 | 0 3 | … | … | … | Two partially blended sources at arcsec |
| Hydra I-UDG 11 | 73 | 52 | 2.40.9 | 0.35 | 73 | Diffuse nuclear source |
| Hydra I-UDG 12 | 01 | 01 | … | … | … | … |