Phase cycling of extreme ultraviolet pulse sequences generated in rare gases
Abstract
The development of schemes for coherent nonlinear time-domain spectroscopy in the extreme-ultraviolet regime (XUV) has so far been impeded by experimental difficulties that arise at these short wavelengths. In this work we present a novel experimental approach, which facilitates the timing control and phase cycling of XUV pulse sequences produced by harmonic generation in rare gases. The method is demonstrated for the generation and high spectral resolution characterization of narrow-bandwidth harmonics (14 eV) in argon and krypton. Our technique simultaneously provides high phase stability and a pathway-selective detection scheme for nonlinear signals - both necessary prerequisites for all types of coherent nonlinear spectroscopy.
I Introduction
Coherent nonlinear spectroscopy in the time domain is a powerful tool to study photoinduced dynamics in complex quantum systems on their natural time scale Mukamel (1999). An extension to the XUV spectral regime is highly desirable, as it would in principle foster studies with attosecond temporal resolution and site or chemical selectivity Mukamel et al. (2013); Kraus et al. (2018). In coherent nonlinear spectroscopy, sequences of phase-locked ultrashort laser pulses interact with a system, simultaneously exciting many quantum pathways. Subsequently, observables are measured as a function of the time delay between the pulses, which in combination with Fourier-transform allows to observe spectral signatures. Therefore these methods require generation of phase-locked pulse sequences and highly sensitive pathway-selective detection methods Mukamel (1999); Hamm and Zanni (2011). While this is readily achieved in the visible regime, the simultaneous experimental realization of both ingredients constitutes a major challenge at XUV wavelengths.
Phase-locking in the visible regime is typically achieved using a passively or actively stabilized interferometric setup, which splits, delays and recombines the pulses. At XUV wavelengths fundamental mechanical constraints limit the phase stability of most implementations and technical difficulties (for example the lack of transmissive optics and absorption of XUV light in air) impede the experimental realization. Therefore only few studies have demonstrated phase-locked XUV pulses. Among those, at free-electron lasers (FELs) phase-locking was achieved using double-pulse seeding with phase-locked pulses Gauthier et al. (2016), by manipulating the trajectory of the relativistic electron bunch used for generation of the XUV radiation Prince et al. (2016), or by elaborate interferometric setups directly in the XUV Usenko et al. (2017). Ultimately phase-locking of several harmonics of a FEL, has led to generation of attosecond pulses at the µJ level Maroju et al. (2020). In the case of tabletop High Harmonic Generation (HHG), phase-locked XUV pulse-sequences were generated using phase-locked double-pulse pumping Cavalieri et al. (2002); Jansen et al. (2016), direct manipulation in a monolithic interferometric setup Okino et al. (2015), in actively stabilized XUV Michelson-type interferometers with wavefront splitting optics Yost et al. (2009), and by placing two movable gas targets within the Rayleigh-range of the pump laser Laban et al. (2012). A particularly sophisticated implementation uses separately amplified pulses from a frequency comb Witte (2005). However, none of the mentioned examples has facilitated pathway-selective detection in parallel.
Pathway-selective detection in the XUV regime has been achieved in four-wave mixing (FWM) geometries. In FWM multiple pulses with individual timing are directed non-collinearly at the sample Hamm and Zanni (2011). The nonlinear mixing signals are then radiated in specific directions and can be isolated by spatial filtering, yielding sensitive, background-free detection. Examples are the FWM beamline at the FERMI FEL Foglia et al. (2018); Bencivenga et al. (2015) and experiments exploiting the inherent synchronization between the NIR driving pulse and the resulting XUV pulse in HHG schemes Marroux et al. (2018); Warrick et al. (2018). However, owing to the complex geometries of the FWM setup, the phase stability is limited and the overall sensitivity is constrained by straylight since FWM is restricted to detection of photons.
In a recent study we have simultaneously implemented XUV phase-locking and pathway-selective detection using double-pulse pumping of a FEL with phase-modulated pulse sequences Wituschek et al. (2020). This enabled tracking of inner-subshell valence-shell electronic coherences spanning over 28 eV and efficient background suppression. The phase-modulation technique is a highly sensitive technique to record electronic wave-packet interferences. It was originally developed in the visible regime Tekavec et al. (2006), but extensions to UV wavelengths Widom et al. (2013); Bruder et al. (2017); Wituschek et al. (2019) and to an XUV FEL have been demonstrated Wituschek et al. (2020). In a nutshell, the relative phase of the excitation pulses is cycled on a shot-to-shot basis, leading to distinct modulation patterns in the (non)linear response of the system, which are monitored using incoherent ’action’-signals like fluorescence Tekavec et al. (2006) or photoionization yields Bruder et al. (2015). These distinct modulations are readily demodulated using a lock-in amplifier, allowing for isolation of specific excitation pathways (i.e. pathway-selective detection). Due to the lock-in detection the method is highly sensitive. For example, it enabled isolation of dipole interactions in extremely dilute atomic vapors Bruder et al. (2019). Furthermore, a straightforward extension allows for two-dimensional electronic spectroscopy Tekavec et al. (2007); Bruder et al. (2018a), which is a powerful technique to follow electronic dynamics in real-time.
In this work, we combine the phase-modulation technique for the first time with harmonic generation in rare gases, yielding high phase stability and pathway selectivity in a single setup. Our results imply that the shot-to-shot phase cycling in the pump pulses is coherently transferred to the XUV pulses. By performing high-resolution linear interferometric cross correlations (CCs) of the XUV pulses, we find that the resulting XUV radiation is extremely narrowband. Calculations show that this is a consequence of enhanced phase matching on the high energy side of atomic resonances. Our method provides high phase stability and the necessary pathway-selective detection scheme to isolate the weak CC signals, which upon Fourier-transform, provides spectral information about the XUV light. In the present case, the high resolution of the Fourier-transform approach allows us to identify the contribution of closely spaced individual resonances to the overall spectrum.
II Methods
II.1 Experimental setup
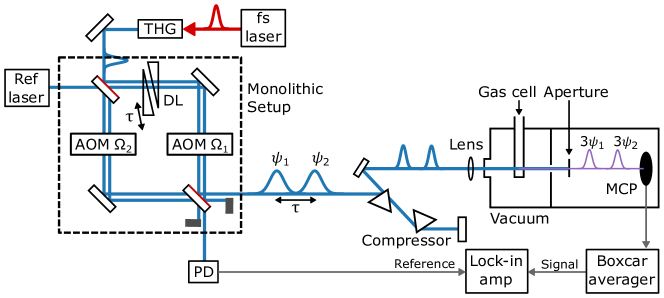
The experimental setup is shown in figure 1. The laser system (Amplitude Technologies) provides 24 fs pulses centered at 790-800 nm at a repetition rate of 1 kHz with pulse energies up to 6 mJ. For timing control and phase modulation of the intense femtosecond pulses, we employ a specialized monolithic setup that can handle high pulse energies at wavelengths of nm, i.e. the third harmonic of the fundamental wavelength of the laser. The setup was previously introduced in Ref. Wituschek et al. (2019). The 266 nm pulses are generated by a commercial third-harmonic generation (THG) kit (Eksma Optics). The residual near-infrared (NIR) and second harmonic light are removed using dichroic mirrors. Wavelength tuning of the resulting ultraviolet (UV) pulses between 264 - 268 nm is achieved by tuning of the fundamental NIR wavelength and simultaneously adjusting the phase-matching angles of the THG crystals. In the phase-modulation setup (see figure 1) the UV beam is split by a 50/50 beamsplitter and the relative phase between both arms is modulated with acousto-optical modulators (AOMs). The delay between the two pulses is controlled by a pair of fused-silica wedges. The position of one of the wedges is motorized, which allows to scan the delay from -1 ps to 11 ps. To balance the optical path introduced by the wedges, the beam in the arm without the wedges passes through the glass of each beamsplitter, while the other beam is reflected from each beamsplitter (see figure 1). The delay was calibrated in an earlier work using the known transition frequency of an atomic resonance and the known reference laser frequency Wituschek et al. (2019).
Unless otherwise stated, the pulses are recombined in a collinear fashion. Note that the beam path in the interferometer is not actively stabilized, in contrast to other double-pulse pumping studies Corsi et al. (2015). The total path-length in the bulk of the optics of the interferometer (AOMs, beamsplitters, wedges) is 27 mm and therefore material dispersion temporally stretches the UV pulses. The setup is designed in a way that dispersion in both arms is balanced at fs. A prism-compressor is used to recompress the UV pulses close to their transform-limited duration of fs, which is larger than the duration of the NIR pulses due to phase-matching bandwidth limitations in the THG setup.
The compressed UV pulses are focused into a gas cell using an mm CaF2 lens mounted in vacuum. Due to the onset of filamentation in the bulk material of the optics the energy per pump pulse is limited to µJ. The gas cell used to generate the XUV light has a length of 6 mm and the focus is placed right at the entrance of the cell. The third harmonic (14 eV) of the 266 nm light is generated either in argon or krypton. The intensity of the XUV pulses is monitored with a microchannel plate (MCP) whose boxcar-averaged output is fed into the lock-in amplifier. Note that the XUV pulses are not separated from the driving UV pulses optically. Only an aperture in the XUV beamline is used to block some of the UV pump light by exploiting the smaller divergence of the XUV light. Instead, the phase-modulation scheme described in the next section is used to filter the XUV contribution from the total MCP signal electronically. However, care was taken that the MCP was not saturated by the total light intensity.
II.2 Phase modulation scheme
The signals are detected using a phase modulation technique in combination with lock-in detection, which is described in detail in Refs. Tekavec et al. (2006); Bruder et al. (2017). We outline the principle here only briefly. A detailed calculation of the signals can be found in the Supplementary Information. The AOMs are driven at distinct radio frequencies in phase-locked mode ( MHz, Hz). Bragg-diffraction in the AOM crystal shifts the optical frequency by the AOM frequency: . Hence, the interference of photons from both interferometer arms exhibits a low-frequency beating at a frequency of Hz (i.e. linear shot-to-shot phase cycling).
To track the relative phase of the two interferometer arms a second continuous wave (CW) UV laser beam (Crylas FQCW 266) co-propagates with UV pulses through the interferometer. We record the interference after the interferometer with a photodiode and the intensity beating of the CW light serves as a reference signal:
| (1) |
For the UV fs pulses traveling through the interferometer, the beating is sampled by the repetition rate of the fs laser. Upon third-harmonic generation by the UV pulses in the gas cell, the frequency of the fs pulses is up-converted, leading to an up-conversion of the beat frequency between the XUV pulses to , respectively. The modulation frequency is chosen such, that the Nyquist sampling criterion is fullfilled: , but also the frequency is high enough to efficiently suppress -noise Bruder et al. (2018b).
We record the interfereometric CC of these modulated XUV pulse pairs:
| (2) |
Here, denotes the pulse energy and the spectral amplitude of the XUV pulses (). denotes the spectral phase difference between both pulses.
This signal is demodulated with a lock-in amplifier (Zurich Instruments MFLI), referenced to the continuous reference signal of equation 1. Note that the modulation frequencies are different in the CC signal (equation 2): , and reference signal (equation 1): . We therefore use third harmonic lock-in detection, which extracts the amplitude and the phase of the CC signal oscillating at the frequency and thus yields the complex demodulated CC signal:
| (3) |
This detection scheme has several advantages. The retrieved signal oscillates at a reduced frequency of with respect to the pulse delay (rotating frame detection) Tan (2008). Accordingly, signal frequencies are reduced in our experiment by a factor of , which permits sampling with much larger delay increments and thus reduces data acquisition times. Furthermore, phase noise from the interferometer appears correlated in the reference and fs laser signals. In the lock-in detection, the phase difference between the third-harmonic reference and the CC signal is computed upon which correlated phase noise cancels out to a large extent. This has the effect of efficient passive phase stabilization of the interferometer. In addition, the lock-in amplifier acts as a very steep bandpass filter combined with high amplification, extracting only signals modulated at a frequency of . This efficiently suppresses signals e.g. from fundamental light or non-interference signals, providing a background-free output of XUV interference signals.
III Results
III.1 Phase modulation of XUV pulses
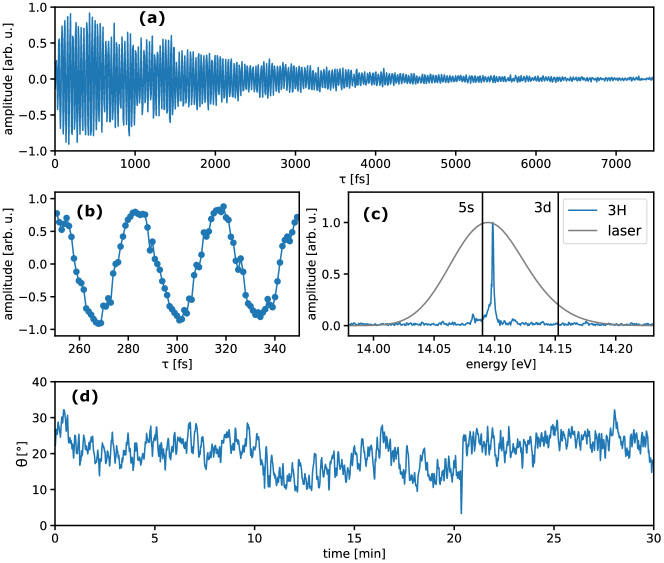
Third harmonic XUV pulses are generated in argon below the ionization threshold at a pressure of 89 mbar in the gas cell. The UV pulse energy is 12 µJ per pulse and the spectrum is centered at 264.8 nm. Note that under these conditions no higher-order harmonics () are observed. Linear interferometric CCs of the resulting XUV pulses, are recorded by scanning the delay between the two UV pump pulses (see figure 1). Consequently, the Fourier transform of the CC trace yields the XUV spectrum.
Figure 2 (a) shows the real part of the signal as obtained by third-harmonic lock-in detection (only positive delays are shown). The data shows clear interference fringes over a range of 7 ps. Due to the rotating frame sampling the oscillation period is fs instead of as that would be expected for eV. This allowed us to record the data shown in figure 2 (a) in only 17 min using a step size of 7 fs for the delay scan. Averaging over 660 laser shots was performed at each delay step using a lock-in filter bandwidth of Hz. In figure 2 (b) a fine-scan from 250-350 fs with a step size of 1 fs is shown. The data points follow a clean oscillation.
The effective phase stability of our experiment is determined using the procedure outlined in Ref. Wituschek et al. (2019). Here, the phase , obtained by the lock-in amplifier is recorded at a fixed delay of fs for 30 min, using a lock-in filter bandwidth of Hz. The result is shown in figure 2 (d). The standard deviation from the mean value is only over 30 min, which is a remarkable result, considering the high photon energy of 14 eV. Assuming that the phase drift is caused by a delay drift, we can calculate the corresponding delay drift as, for . This is equivalent to a path-length drift of 137 nm. However, the path-length drifts of the interferometer on the timescale of 30 min are on the order of 6.3 nm (see Supplementary Information). Therefore, the effective phase stability is limited by amplitude fluctuations in the signal, rather than by the stability of the interferometer.
By taking the Fourier transform of the time-domain interferogram the spectrum of the XUV pulses is obtained with a spectral resolution of 0.65 meV (FWHM) [figure 2 (c)]. One can clearly see a well-resolved, narrow spectral peak (FWHM = 1.7 meV) appearing between the and resonances. The frequency axis is calibrated by the known reference laser frequency rad s-1 and the spectrum is corrected for the -shift due to rotating frame sampling. The obtained XUV spectrum is much narrower than what would be expected from a non-resonant process, i.e. by scaling the UV spectrum with the harmonic order according to [see grey curve in figure 2 (c)]. is measured with a fiber spectrometer.
The narrow spectrum can be explained by enhanced phase matching occurring on the high-energy side of an atomic resonance Mahon et al. (1979). In a simple model, the phase mismatch between the generated harmonic and the laser-induced polarization is given by , where is the phase mismatch of the neutral atomic medium and is the Gouy-phase shift:
| (4) | |||||
| (5) |
Here and are the refractive indexes of the neutral generation medium in the XUV and the UV, respectively, is the photon energy, is the Planck constant, is the speed of light, is the order of the harmonic, the position along the propagation axis of the laser relative to the focus position and is the Rayleigh-range in the focus. The pressure-dependent refractive index can be calculated with Sellmeier’s equation Mahon et al. (1979), using the state energies and transition dipole moments reported in Refs. Kramida et al. (2019); Chan et al. (1992). If are the resonances of the medium, then for , can be negative and therefore compensates the phase mismatch induced by the Gouy-phase shift. The spectrum of the generated XUV light is determined by Mahon et al. (1979)
| (6) |
where is the third-order nonlinear susceptibility, is the power of the fundamental and cm is the confocal parameter of the UV laser, determined by the waist size and the UV laser carrier-wavelength .
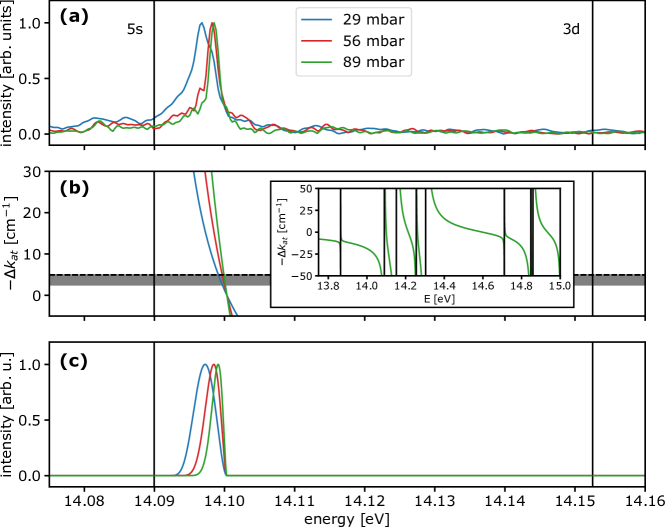
In figure 3 (a) we show spectra of the generated XUV pulses acquired for different pressures in the gas cell. We observe a blue-shift and a narrowing of the spectrum with increasing pressure. This is consistent with calculations of the atomic phase-mismatch and the resulting XUV spectrum, which are shown in figure 3 (b) and (c). For the calculations, we assume a flat between the resonances, where the generated XUV light appears. Furthermore, the Rayleigh range is used as a parameter in the calculations. It coincides with the Rayleigh range which can be determined from the experimental parameters. From the calculations one can see that phase-matching shifts to higher energies when the pressure increases. In addition, the spectral width of the phase-matching region depends on the gradient of within the Rayleigh range. The gradient increases with increasing pressure, hence the spectral width of the XUV decreases. The experimental data and the calculations agree very well, which is remarkable considering the high spectral resolution, exceeding other studies on resonance-enhanced phase matching by a factor of Chini et al. (2014).
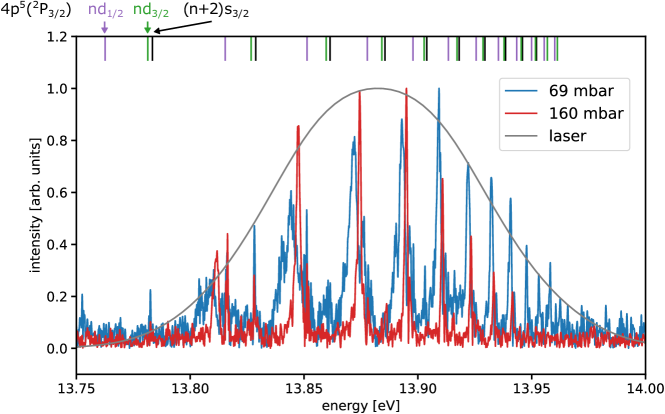
The measurement was repeated using krypton as the generation medium. The UV pulse energy was set to 20 µJ per pulse and the spectrum was centered around 268.1 nm. In contrast to the argon experiment not only two resonances but several resonances of a Rydberg-series, converging to the limit, occurr within the bandwidth of the UV laser. Consequently, phase-matching is achieved at several frequencies between the neighboring resonances, resulting in a complex spectral structure Drescher et al. (2020) (see figure 4). Similar to the argon experiment a blue-shift of the peak positions and a spectral narrowing is observed when increasing the pressure in the gas cell. By scanning the delay from 0 ps to 9 ps a resolution of 0.5 meV FWHM is obtained by the Fourier-transform.
III.2 Double pump-pulse effects
So far, we analyzed the data for pulse delays larger than the pulse duration of the UV driving pulses. This was sufficient to analyze the spectral shape of the generated narrow-band XUV pulses. We now turn our focus on effects occurring when the two driving UV pulses overlap temporally and spatially in the harmonic generation medium.
The perspective of generating phase-locked pulse pairs with collinear pulse sequences is appealing due to the simplicity of such setups. However, a shortcoming is the issue that the perturbation of the harmonic generation medium by the leading pulse (optical excitation and ionization of the medium), may change the amplitude and phase of the XUV radiation generated by the trailing pulse. This issue plays also an important role in HHG at high repetition rates MHz Porat et al. (2018). Previous studies investigated this effect by analyzing the contrast of interference fringes detected with XUV spectrometers Bellini et al. (2001); Salières et al. (1999). Here, we study this effect in the time domain for the case of phase-matching enhanced harmonic generation near atomic resonances. As shown in the Supplementary Information, our CC measurements provide direct access to the relative phase between the XUV pulses without the need of theoretical assumptions. Yet, information about the individual amplitude of the pulses cannot be obtained due to the intrinsic symmetry of CC measurements (cf. Supplementary Information). We therefore concentrate on the relative phase shift induced by the perturbation of the harmonic generation medium.
To this end, we systematically attenuate the pulse energy of one of the two UV pump-pulses ( 2 µ-12 µJ) while keeping the energy of the other pulse fixed ( 12 µJ) and record interferometric CCs (figure 5).
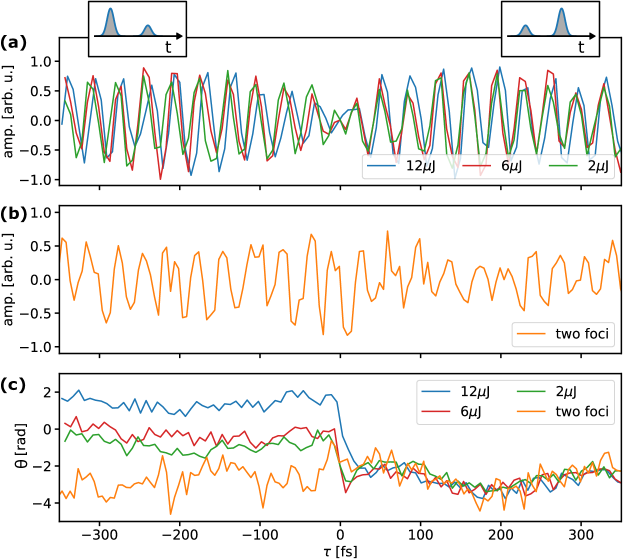
The power is adjusted by reducing the RF driving power of one of the AOMs. All other XUV generation parameters are the same as for the argon study at a gas cell pressure of 89 mbar. At positive delays, the pulse with fixed energy interacts with the harmonic generation medium first. Hence, for positive delays, the amount of perturbation induced by the leading pulse is the same for all measurements and a constant phase shift between the XUV pulses is expected. This is in agreement with our data, where all CC interferograms are in phase for positive delays [figure 5(a, c)]. Note, that in these considerations, phase shifts introduced by the trailing pulse itself when changing its intensity can be neglected. In contrast, for negative delays, where the variable-energy pulse comes first, the perturbation of the generation medium by the leading pulse changes between the measurements. Therefore the second pulse experiences different conditions, leading to systematic phase-shifts depending on , as observed in our data for negative delays [figure 5 (a, c)] The phase shift is expected to vanish for large negative delays on timescales given by the decay of the excitation/ionization in the generation medium.
The influence of the leading pulse on the harmonic generation from the trailing pulse can be omitted when the harmonic generation takes place in two spatially separated volumes of the generation medium, as previously demonstrated Jansen et al. (2016); Bellini et al. (1998); Descamps et al. (2000); Kovačev et al. (2005). However, this leads to a reduced spatial overlap of both beams in the far field, making it more challenging to achieve good signal-to-noise performance. Here, the phase modulation scheme is of advantage in maintaining the signal interference contrast as it suppresses non-interfering signal contributions. In figure 5 (b) results are shown that were obtained under conditions where the foci are separated by 100 µm and both pulses have equal energy. The separation of the two foci is realized by slightly misaligning the interferometer. In this case no phase shifts occur in the interferogram [see figure 5 (c)], when going from negative to positive delays. The lower signal quality in this data originates mainly from the reduced signal amplitude due to the reduced spatial overlap of the beams.
Note that the different temporal position of the phase jump in figure 5 (c) around zero delay stems from different discretization of the delay axis in the measurements, and that the magnitude of the phase jump is measured modulo . Furthermore, has an offset-calibration uncertainty due to the different phase-transfer functions of the electronics (for example photo-diodes, amplifiers) used in the signal and reference pathways (remember that the lock-in amplifier measures the phase-difference between the signal and reference inputs). This explains why the curve in figure 5 (b) is not symmetric with respect to . We did not perform a phase calibration in this study, however with a straightforward calibration also the absolute phase scale could be retrieved Bruder et al. (2019).
IV Discussion and conclusion
We successfully generated phase-locked XUV pulse-pairs and gained independent control over the delay and relative phase of the XUV pulses through manipulation of the pump pulses. This novel level of control was reached by implementing a phase-cycling scheme for the XUV pulses, which allowed for pathway-selective detection of individual signal contributions and rotating frame detection, efficiently reducing data acquisition times. Here, the pathway-selective detection selects a single harmonic and isolates the interference signals from non-modulated background signals. This is especially beneficial for photoion/-electron spectroscopy in the XUV-regime, where many background events due to one-photon XUV ionization are present.
In addition, due to the phase modulation technique the majority of the phase jitter originating from the interferometric pump-pulse setup is efficiently removed in the lock-in demodulation process, yielding a phase-stability of 4.5∘ over 30 min. Note that this stabilization method is passive and therefore requires no active stabilization of the interferometer optics.
Due to the high resolution of the Fourier-transform approach (0.5 meV FWHM in the krypton study) we were able to measure gas-pressure dependent spectral widths and shifts of narrow-band XUV light generated in argon and krypton. This is a much higher resolution than achieved in typical XUV Fourier transform spectroscopy studies. Our data is in good agreement with a theoretical model, showing that the narrow-bandwidth generation is a consequence of enhanced phase-matching at the high-energy side of atomic resonances in the generation medium. In the argon study a single peak emerged in the spectrum that is much narrower than the bandwidth that would be anticipated from the pump laser spectrum. In the krypton study phase matching enhanced the generation of several narrow bandwidth features that appear between the closely spaced resonances of a Rydberg series. We note that in contrast to this study, intense narrow bandwidth XUV pulses can also be generated by resonance-enhanced harmonic generation exploiting Stark-shifted multi photon resonances Ackermann et al. (2012).
The high spectral resolution of our work, resolving peak positions, widths and shapes may foster and challenge detailed theoretical studies including quantum models. Note that in the Fourier-transform approach, the resolution limit is given by the inter-pulse delay range. With XUV Ramsey-comb spectroscopy even higher resolution in the MHz range may be achieved Kandula et al. (2010).
By looking at pump-intensity dependent phase-shifts in the CC measurements it was found that in our experimental conditions the XUV generation from the individual UV pulses was not independent and leads to phase-shifts in the XUV pulse generated by the trailing UV pulse. These intensity dependent phase-shifts were directly measured by our all-optical approach. Furthermore, we could confirm that perturbations in the harmonic generation medium by leading pulses can be omitted using spatially well-separated foci for both driving pulses Bellini et al. (2001).
Our results significantly extend and improve existing XUV time-domain spectroscopy schemes Cavalieri et al. (2002); Mang et al. (2018) by uniquely combining pathway-selective detection with high phase-stability and high spectral resolution. As such, this work may pave the way for many applications of (non)linear coherent time-domain spectroscopy in the XUV spectral range. A straightforward extension to higher harmonics will provide access to higher photon energies and shorter pulse durations, and in combination with additional probe pulses, dynamics may be probed with high spectro-temporal resolution.
Funding
Funding by the Bundesministerium für Bildung und Forschung (BMBF) STAR (05K19VF3), by the European Research Council (ERC) Advanced Grant COCONIS (694965), and by the Deutsche Forschungsgemeinschaft (DFG) GRK 2079 and STI 125/24-1 is acknowledged.
Acknowledgments
We gratefully acknowledge the support of Ahmet Akin Uenal and Evgenii Ikonnikov in preparing the laser system and setting up the XUV-beamline.
References
References
- Mukamel (1999) S. Mukamel, Principles of Nonlinear Optical Spectroscopy, revised. ed. (Oxford University Press, New York, 1999).
- Mukamel et al. (2013) S. Mukamel, D. Healion, Y. Zhang, and J. D. Biggs, Annual Review of Physical Chemistry 64, 101 (2013).
- Kraus et al. (2018) P. M. Kraus, M. Zürch, S. K. Cushing, D. M. Neumark, and S. R. Leone, Nature Reviews Chemistry 2, 82 (2018).
- Hamm and Zanni (2011) P. Hamm and M. Zanni, Concepts and Methods of 2D Infrared Spectroscopy (Cambridge University Press, Cambridge, 2011).
- Gauthier et al. (2016) D. Gauthier, P. R. Ribič, G. De Ninno, E. Allaria, P. Cinquegrana, M. B. Danailov, A. Demidovich, E. Ferrari, and L. Giannessi, Physical Review Letters 116, 024801 (2016).
- Prince et al. (2016) K. C. Prince, E. Allaria, C. Callegari, R. Cucini, G. De Ninno, S. Di Mitri, B. Diviacco, E. Ferrari, P. Finetti, D. Gauthier, L. Giannessi, N. Mahne, G. Penco, O. Plekan, L. Raimondi, P. Rebernik, E. Roussel, C. Svetina, M. Trovò, M. Zangrando, M. Negro, P. Carpeggiani, M. Reduzzi, G. Sansone, A. N. Grum-Grzhimailo, E. V. Gryzlova, S. I. Strakhova, K. Bartschat, N. Douguet, J. Venzke, D. Iablonskyi, Y. Kumagai, T. Takanashi, K. Ueda, A. Fischer, M. Coreno, F. Stienkemeier, Y. Ovcharenko, T. Mazza, and M. Meyer, Nature Photonics 10, 176 (2016).
- Usenko et al. (2017) S. Usenko, A. Przystawik, M. A. Jakob, L. L. Lazzarino, G. Brenner, S. Toleikis, C. Haunhorst, D. Kip, and T. Laarmann, Nature Communications 8, 15626 (2017).
- Maroju et al. (2020) P. K. Maroju, C. Grazioli, M. D. Fraia, M. Moioli, D. Ertel, H. Ahmadi, O. Plekan, P. Finetti, E. Allaria, L. Giannessi, G. D. Ninno, C. Spezzani, G. Penco, S. Spampinati, A. Demidovich, M. B. Danailov, R. Borghes, G. Kourousias, C. E. S. D. Reis, F. Billé, A. A. Lutman, R. J. Squibb, R. Feifel, P. Carpeggiani, M. Reduzzi, T. Mazza, M. Meyer, S. Bengtsson, N. Ibrakovic, E. R. Simpson, J. Mauritsson, T. Csizmadia, M. Dumergue, S. Kühn, H. N. Gopalakrishna, D. You, K. Ueda, M. Labeye, J. E. Bækhøj, K. J. Schafer, E. V. Gryzlova, A. N. Grum-Grzhimailo, K. C. Prince, C. Callegari, and G. Sansone, Nature 578, 386 (2020).
- Cavalieri et al. (2002) S. Cavalieri, R. Eramo, M. Materazzi, C. Corsi, and M. Bellini, Physical Review Letters 89, 133002 (2002).
- Jansen et al. (2016) G. S. M. Jansen, D. Rudolf, L. Freisem, K. S. E. Eikema, and S. Witte, Optica 3, 1122 (2016).
- Okino et al. (2015) T. Okino, Y. Furukawa, Y. Nabekawa, S. Miyabe, A. A. Eilanlou, E. J. Takahashi, K. Yamanouchi, and K. Midorikawa, Science Advances 1, e1500356 (2015).
- Yost et al. (2009) D. C. Yost, T. R. Schibli, J. Ye, J. L. Tate, J. Hostetter, M. B. Gaarde, and K. J. Schafer, Nature Physics 5, 815 (2009).
- Laban et al. (2012) D. E. Laban, A. J. Palmer, W. C. Wallace, N. S. Gaffney, R. P. M. J. W. Notermans, T. T. J. Clevis, M. G. Pullen, D. Jiang, H. M. Quiney, I. V. Litvinyuk, D. Kielpinski, and R. T. Sang, Physical Review Letters 109, 263902 (2012).
- Witte (2005) S. Witte, Science 307, 400 (2005).
- Foglia et al. (2018) L. Foglia, F. Capotondi, R. Mincigrucci, D. Naumenko, E. Pedersoli, A. Simoncig, G. Kurdi, A. Calvi, M. Manfredda, L. Raimondi, N. Mahne, M. Zangrando, C. Masciovecchio, and F. Bencivenga, Phys. Rev. Lett. 120, 263901 (2018).
- Bencivenga et al. (2015) F. Bencivenga, R. Cucini, F. Capotondi, A. Battistoni, R. Mincigrucci, E. Giangrisostomi, A. Gessini, M. Manfredda, I. P. Nikolov, E. Pedersoli, E. Principi, C. Svetina, P. Parisse, F. Casolari, M. B. Danailov, M. Kiskinova, and C. Masciovecchio, Nature 520, 205 (2015).
- Marroux et al. (2018) H. J. B. Marroux, A. P. Fidler, D. M. Neumark, and S. R. Leone, Science Advances 4, eaau3783 (2018).
- Warrick et al. (2018) E. R. Warrick, A. P. Fidler, W. Cao, E. Bloch, D. M. Neumark, and S. R. Leone, Faraday Discussions 212, 157 (2018).
- Wituschek et al. (2020) A. Wituschek, L. Bruder, E. Allaria, U. Bangert, M. Binz, R. Borghes, C. Callegari, G. Cerullo, P. Cinquegrana, L. Giannessi, M. Danailov, A. Demidovich, M. D. Fraia, M. Drabbels, R. Feifel, T. Laarmann, R. Michiels, N. S. Mirian, M. Mudrich, I. Nikolov, F. H. O’Shea, G. Penco, P. Piseri, O. Plekan, K. C. Prince, A. Przystawik, P. R. Ribič, G. Sansone, P. Sigalotti, S. Spampinati, C. Spezzani, R. J. Squibb, S. Stranges, D. Uhl, and F. Stienkemeier, Nature Communications 11, 1 (2020).
- Tekavec et al. (2006) P. F. Tekavec, T. R. Dyke, and A. H. Marcus, The Journal of Chemical Physics 125, 194303 (2006).
- Widom et al. (2013) J. R. Widom, N. P. Johnson, P. H. von Hippel, and A. H. Marcus, New Journal of Physics 15, 025028 (2013).
- Bruder et al. (2017) L. Bruder, U. Bangert, and F. Stienkemeier, Optics Express 25, 5302 (2017).
- Wituschek et al. (2019) A. Wituschek, L. Bruder, L.-S. Klein, J. Strucka, A. Demidovich, M. B. Danailov, and F. Stienkemeier, Optics Letters 44, 943 (2019).
- Bruder et al. (2015) L. Bruder, M. Mudrich, and F. Stienkemeier, Physical Chemistry Chemical Physics 17, 23877 (2015).
- Bruder et al. (2019) L. Bruder, A. Eisfeld, U. Bangert, M. Binz, M. Jakob, D. Uhl, M. Schulz-Weiling, E. R. Grant, and F. Stienkemeier, Physical Chemistry Chemical Physics 21, 2276 (2019).
- Tekavec et al. (2007) P. F. Tekavec, G. A. Lott, and A. H. Marcus, The Journal of Chemical Physics 127, 214307 (2007).
- Bruder et al. (2018a) L. Bruder, U. Bangert, M. Binz, D. Uhl, R. Vexiau, N. Bouloufa-Maafa, O. Dulieu, and F. Stienkemeier, Nature Communications 9, 4823 (2018a).
- Corsi et al. (2015) C. Corsi, I. Liontos, S. Cavalieri, M. Bellini, G. Venturi, and R. Eramo, Optics Express 23, 4106 (2015).
- Bruder et al. (2018b) L. Bruder, M. Binz, and F. Stienkemeier, Optics Letters 43, 875 (2018b).
- Tan (2008) H.-S. Tan, The Journal of Chemical Physics 129, 124501 (2008).
- Mahon et al. (1979) R. Mahon, T. McIlrath, V. Myerscough, and D. Koopman, IEEE Journal of Quantum Electronics 15, 444 (1979).
- Kramida et al. (2019) A. Kramida, Y. Ralchenko, and J. Reader, NIST Atomic Spectra Database (2019).
- Chan et al. (1992) W. F. Chan, G. Cooper, X. Guo, G. R. Burton, and C. E. Brion, Physical Review A 46, 149 (1992).
- Chini et al. (2014) M. Chini, X. Wang, Y. Cheng, H. Wang, Y. Wu, E. Cunningham, P.-C. Li, J. Heslar, D. A. Telnov, S.-I. Chu, and Z. Chang, Nature Photonics 8, 437 (2014).
- Drescher et al. (2020) L. Drescher, V. Shokeen, T. Witting, O. Kornilov, M. J. J. Vrakking, and B. Schütte, arXiv:2002.11552 (2020).
- Porat et al. (2018) G. Porat, C. M. Heyl, S. B. Schoun, C. Benko, N. Dörre, K. L. Corwin, and J. Ye, Nature Photonics 12, 387 (2018).
- Bellini et al. (2001) M. Bellini, S. Cavalieri, C. Corsi, and M. Materazzi, Optics Letters 26, 1010 (2001).
- Salières et al. (1999) P. Salières, L. Le Déroff, T. Auguste, P. Monot, P. d’Oliveira, D. Campo, J.-F. Hergott, H. Merdji, and B. Carré, Phys. Rev. Lett. 83, 5483 (1999).
- Bellini et al. (1998) M. Bellini, C. Lyngå, A. Tozzi, M. B. Gaarde, T. W. Hänsch, A. L’Huillier, and C.-G. Wahlström, Phys. Rev. Lett. 81, 297 (1998).
- Descamps et al. (2000) D. Descamps, C. Lyngå, J. Norin, A. L’Huillier, C.-G. Wahlström, J.-F. Hergott, H. Merdji, P. Salières, M. Bellini, and T. W. Hänsch, Optics Letters 25, 135 (2000).
- Kovačev et al. (2005) M. Kovačev, S. V. Fomichev, E. Priori, Y. Mairesse, H. Merdji, P. Monchicourt, P. Breger, J. Norin, A. Persson, A. L’Huillier, C.-G. Wahlström, B. Carré, and P. Salières, Physical Review Letters 95, 223903 (2005).
- Ackermann et al. (2012) P. Ackermann, H. Münch, and T. Halfmann, Optics Express 20, 13824 (2012), publisher: Optical Society of America.
- Kandula et al. (2010) D. Z. Kandula, C. Gohle, T. J. Pinkert, W. Ubachs, and K. S. E. Eikema, Physical Review Letters 105, 063001 (2010).
- Mang et al. (2018) M. M. Mang, D. T. Lloyd, P. N. Anderson, D. Treacher, A. S. Wyatt, S. M. Hooker, I. A. Walmsley, and K. O’Keeffe, Optics Letters 43, 5275 (2018).