Thermal compaction of disordered and elastin-like polypeptides: a temperature-dependent, sequence-specific coarse-grained simulation model
Abstract
Elastin-like polypeptides (ELPs) undergo a sharp solubility transition from low temperature solvated phases to coacervates at elevated temperatures, driven by the increased strength of hydrophobic interactions at higher temperatures. The transition temperature, or ‘cloud point’, critically depends on sequence composition, sequence length, and concentration of the ELPs. In this work, we present a temperature-dependent, implicit solvent, sequence-specific coarse-grained (CG) simulation model that reproduces the transition temperatures as a function of sequence length and guest residue identity of various experimentally probed ELPs to appreciable accuracy. Our model builds upon the self-organized polymer model introduced recently for intrinsically disordered polypeptides (SOP-IDP), and introduces a semi-empirical functional form for the temperature-dependence of hydrophobic interactions. In addition to the fine performance for various ELPs, we demonstrate the ability of our model to capture the thermal compactions in dominantly hydrophobic intrinsically disordered polypeptides (IDPs), consistent with experimental scattering data. With the high computational efficiency afforded by the CG representation, we envisage that the model will be ideally suited for simulations of large-scale structures such as ELP networks and hydrogels, as well as agglomerates of IDPs.
I Introduction
Stimuli-responsive polymers are key ingredients in switchable smart soft materials design – materials whose physiochemical, and hence assembly properties can be critically altered by local environmental stimuli Koetting et al. (2015); Gil and Hudson (2004); Liechty et al. (2010); Roth and Lowe (2017); Wei et al. (2017); Walther (2020). A characteristic generic to responsive polymers is that they undergo a sharp and reversible conformational change over a relatively small window of the stimulus. Thermoresponsive polymers are a representative class of such stimuli-responsive polymers, and respond to temperature as the external stimulus. These polymers are diverse in composition, both biotic and abiotic, and have found wide-spread applications in the design of targeted switchable materials. Such applications include for example the design of surfaces with controllable wettability and stiffness, hydrogels, drug carriers and micellar nano-materials, controllers of gene expression and enzyme function, and tissue repair Klouda and Mikos (2008); Costa et al. (2018); Mano (2008); Ganta et al. (2008); Gibson and O’Reilly (2013); Alarcón et al. (2005); Khutoryanskiy and Georgiou (2018); Kim and Matsunaga (2017); Meco and Lampe (2019).
Elastin-like polypeptides (ELPs) are a special class of bio-inspired peptide-based thermoresponsive polymers, characterized by variants of the pentameric repeat motif (VPGXG). The guest residue X can in principle be any amino acid but proline Roberts et al. (2015). The most commonly studied or the canonical ELP (VPGVG)n derives from the evolutionarily conserved hydrophobic domains of tropoelastin, the precursor to extracellular matrix protein elastin Vrhovski and Weiss (1998). ELPs undergo a sharp solubility transition at lower critical solution temperature (LCST) from solvated phases at temperatures below to coacervates at temperatures above. The transition temperature, often referred to and measured as the cloud point , depends most notably on sequence length (molecular weight), concentration of ELPs, and the identity of the guest residue X Urry (1997); Urry et al. (1991, 1985, 1992); MacEwan and Chilkoti (2010); Meyer and Chilkoti (2002, 2004); Tatsubo et al. (2018); Ribeiro et al. (2009); Condon et al. (2017); Prhashanna et al. (2019). Strongly hydrophobic guest residues result in typically low Urry et al. (1992). The same trend is observed upon increasing the sequence length, and concentration Meyer and Chilkoti (2004).
The modulators of for ELPs are not limited to the physical attributes listed above, which are also the primary stimuli for synthetic responsive polymers such as PNIPAM Tong et al. (1999); Furyk et al. (2006). Several other external stimuli Urry (1997); Chilkoti et al. (2006), such as ion concentration and specificity Cho et al. (2008), pH Ribeiro et al. (2009), and the presence of denaturants, co-solvents and co-solutes, Zhang et al. (2006); Mills et al. (2019); Luan and Urry (1991) etc., can appreciably change the for ELP sequences, imparting them with substantially higher, and also more tunable responsiveness to changes in local environment MacEwan and Chilkoti (2010). It should be noted that polymers such as PNIPAM and corresponding synthetic co-polymers can also be responsive to the above stimuli, albeit to a lesser degree of tunability Zhang et al. (2007, 2005); Karg et al. (2008); Zhang et al. (2007). This heightened receptivity together with additional advantages such as bio-compatibility, precise control over molecular weight in production Meyer and Chilkoti (2002); Kurihara et al. (2005); McMillan et al. (1999), recombinant peptide synthesis Petitdemange et al. (2017), tunable co-polymerization Wright and Conticello (2002); Chilkoti et al. (2002); Zhou et al. (2017); Anaya et al. (2020); Luo and Kiick (2015), and complex self assembled structures MacEwan and Chilkoti (2010); MacEwan et al. (2017); Jang et al. (2019); Suyama et al. (2018), makes ELPs ideally suited for applications such as protein sorting, tissue repair, and drug carrier design Anaya et al. (2020); MacEwan and Chilkoti (2010); Le and Sugawara-Narutaki (2019); Despanie et al. (2016).
In addition to their potential for industrial and therapeutic applications, ELPs, owing to their low sequence complexity, have historically been used as templates for studying the temperature-dependence of inter-amino acid interactions. In notable early studies, Urry et al. systematically investigated the influence of the guest residue identity on , hence the overall hydrophobicity of ELP sequences Urry et al. (1985, 1991, 1992). The different amino acids were accordingly ranked based upon their observed hydrophobicities Urry et al. (1992). Subsequent experimental studies spanning over two decades have elucidated the influence of diverse stimuli on the LCST behavior of diverse ELP sequences Urry (1997); Chilkoti et al. (2006); Cho et al. (2008); Ribeiro et al. (2009); Zhang et al. (2006); Luan and Urry (1991). A mechanistic understanding of the LCST in ELPs, however, is difficult to ascertain from experimental measurements alone. At the heart of the problem lies the inability of conventional experimental techniques to probe the conformational ensembles of disordered polypeptides at high spatial resolution Delaforge et al. (2018); Ferreon et al. (2010). In experimental studies is conventionally obtained using macroscopic measurements of turbidity profiles through the ‘cloud-point’ of ELP solutions Zong et al. (2018); Zhou et al. (2017).
Computer simulations using all-atom resolution and state-of-the-art force fields have been instrumental in studying the room-temperature, as well as temperature-dependent structure, and mechanism of LCST transition in ELPs Rauscher and Pomès (2017); Li et al. (2018); Zhao et al. (2016); Li et al. (2014); Rousseau et al. (2004); Glaves et al. (2008); Zhao et al. (2020). For example, simulations have revealed that contrary to Urry et al’s -spiral model Urry et al. (1981), the high temperature phases of ELPs are substantially disordered, and resemble the molten ‘collapsed globule’ states observed in proteins Rauscher and Pomès (2017). Insights have been gained on the significance of desolvation-mediated-attraction among hydrophobic amino acid side chains Li et al. (2014), transient hydrogen bonding interactions along the polypeptide backbone Zhao et al. (2016); Rousseau et al. (2004), and the disorder-promoting influence of proline residues Glaves et al. (2008), etc. Owing to the inherent computational cost associated with explicit-solvent simulations, the length (and time) scales that can be studied by all-atom simulations is limited. These simulations accordingly cover smaller sequence lengths than studied experimentally. In order to study larger length scale structures such as ELP networks and hydrogels, it is rewarding to use more coarse-grained (CG) simulation models Zhao et al. (2020); Dignon et al. (2019), while also retaining the sequence-specific and temperature-dependent properties pertaining to the different ELP sequences. The development of such an explicitly temperature-dependent, i.e., temperature-transferable CG model Qian et al. (2008); Krishna et al. (2009); Rosenberger and van der Vegt (2018); Dignon et al. (2019) is the primary objective of the present study.
Temperature-dependence of the dimension and phase behavior of natively disordered polypeptides is not specific to ELPs alone. It depends strongly on sequence composition and directionality, as demonstrated in recent years by studies on phase demixing in biological systems Martin and Mittag (2018); Molliex et al. (2015); Lin et al. (2015); Martin et al. (2016); Brangwynne et al. (2009); Li et al. (2012); Velichko et al. (2008); McCarty et al. (2019). Predominantly polar sequences remain expanded, or under good-solvent conditions irrespective of the solution temperature. A high content of charged and aromatic amino acids is observed to promote coacervation below upper critical solution temperatures (UCST), signifying the role of multivalent electrostatic and - or cation- interactions in the UCST behavior Martin and Mittag (2018); Quiroz and Chilkoti (2015); Lin et al. (2015); Molliex et al. (2015); Ryan et al. (2018). LCST behavior, or compaction at high temperatures can be mapped to the abundance of hydrophobic (and hydrophobic aromatic) residues, but with low charge content in the sequences Martin and Mittag (2018); Quiroz and Chilkoti (2015). It is, however, intriguing to observe that even after accounting for the (expected) temperature-dependences of the above mentioned interactions using theory and detailed molecular simulations, accounting for the temperature-dependent compaction of IDP sequences to quantitative agreements with experimental observations still remains elusive Wuttke et al. (2014). This conundrum was highlighted by Skepö et al., phrased through the highly pertinent question,– “Is it possible for the currently available simulation methods to accurately mimic the experimental temperature induced structural changes in IDPs?” Jephthah et al. (2019). Recent work by Mittal et al. provides a viable strategy to a temperature - dependent parameterization of a CG model of IDPs, where the authors suggest refinements of the strength of pairwise Lennard-Jones interactions among all amino acids using parabolic functions in temperature Dignon et al. (2019). The empirical parabolic form is motivated by statistical mining of protein structures by Abeln et al van Dijk et al. (2015).
With the focus of the current study being LCST transitions in long ELP chains, the temperature-dependence in our model is dedicated primarily to interactions among hydrophobic residues. To this end, we propose and systematically parameterize in this report a simple, semi-empirical functional form for the strength of pairwise interactions among hydrophobic moieties as a function of temperature. We demonstrate that our functional form results in quantitative reproduction of in hydrophobic ELPs for the first time in CG simulations, and also reflects the high temperature compactions of more complex IDP sequences. Explicit parameters are reported for use with the self-organized polymer model for intrinsically disordered polypeptides (SOP-IDP) Baul et al. (2019); Chakraborty et al. (2020), but the generic applicability of the functional form to other CG models holds by construction. When applicable, we also consider the temperature-dependence of the dielectric constant of water, and inverse Debye screening length of salt solutions to account for the temperature-dependence of electrostatic interactions to a first approximation Malmberg and Maryott (1956).
The rest of the manuscript is organized as follows. The methods section starts with a brief description of the temperature-independent SOP-IDP model Baul et al. (2019), followed by a detailed description of the incorporation of temperature-dependence into the energy function. All computational observables used in the manuscript are also outlined, together with simulation protocols. In the results section, we first describe the parameterization of the model using only two sequence lengths of the canonical ELP sequence (VPGVG)n. The model is then applied to a detailed study of the temperature induced structural changes in diverse uncharged ELP sequences. In the final section of the results, we test our simulation model against reported experimental results for two IDPs well known for their complex transient structure forming propensities.
II Methods
In order to incorporate temperature-dependence of inter-residue interactions in a CG model, it is practical and convenient to develop a model that describes the ambient-temperature phases of disordered polypeptides for diverse sequence compositions. The recently developed SOP-IDP model has been shown to reproduce the radii of gyration (), as well as the small angle X-ray scattering (SAXS) profiles at room temperatures for diverse sequence compositions, including highly charged, fully polar, and predominantly hydrophobic sequences Baul et al. (2019). We thus chose the SOP-IDP model, devoid of any explicit temperature-dependence of inter-residue interactions, as the template to build the temperature-dependence upon.
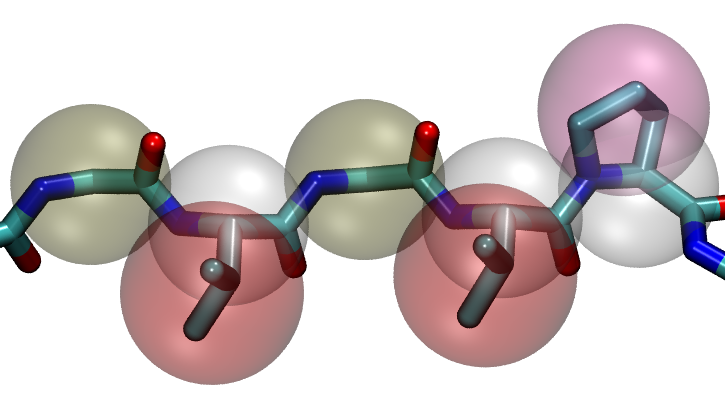
In the current implementation of the SOP-IDP model an amino acid residue is represented by two beads, a backbone bead and a side-chain bead. Glycine, with its side chain comprising of only a single H-atom, is the only exception to this rule, and is described using a single bead. Figure 1 shows a schematic representation of the mapping of a peptide segment onto the CG SOP-IDP model.
The energy function for the SOP-IDP model is given by the equation
| (1) | |||||
The first term represents bonded interactions described by finite non-linear elastic (FENE) potential, where is the total number of bonds in the system. The second, purely repulsive term is only active between bead pairs that are not covalently bonded, but belong to residues separated by 2 along the sequence. The total number of such bead pairs is denoted by . The third term is a screened Coulomb potential accounting for electrostatic interactions among charged beads. The parameters and in this term stand for the inverse Debye length, and the dielectric constant, respectively. The charge of an amino acid is assigned to the side-chain bead. Details on the significance these terms, in the context of both folded proteins and disordered sequences, can be found elsewhere Baul et al. (2019); Chakraborty et al. (2020); Liu et al. (2012); Reddy and Thirumalai (2015).
The final three terms in eq 1 account for the inter-bead Lennard-Jones (LJ) interactions in the model, and incorporate sequence-specificity beyond electrostatic interactions. These interactions are only active among bead pairs that do not interact through the first two terms in eq 1. In order of appearance, they represent the pairwise interactions among backbone - backbone, backbone - side-chain, and side-chain - side-chain beads (total , , and such pairs respectively). The van der Waals (vdW) radius for a bead pair () is the sum of the vdW radii of the interacting beads. To avoid any ambiguity with notations, it is worth noting that in our notation represents the separation corresponding to the minimum of the pairwise LJ interaction, often denoted by in conventional notation for LJ interactions (). The term has the further explicit form , where the amino acid pair specific parameter is obtained from the knowledge-based Betancourt-Thirumalai statistical potential, and is used to reweight the inter-residue interactions at ambient temperature ( K) Betancourt and Thirumalai (1999). The energy scales of these interactions are set by parameters , , and , parameterized to describe disordered polypeptide sequences at ambient temperatures Baul et al. (2019). Description of the individual bead properties and numerical values of parameters in eq 1 can be found in Tables S1-S3 in the Supplementary Information (SI).
II.1 Temperature-dependence of hydrophobic inter-residue interactions
Experiments, theory, and simulations have shown that the solvation of hydrophobes in water has a strong dependence on both temperature and size Kauzmann (1959); Huang and Chandler (2000, 2002); Rajamani et al. (2005); Athawale et al. (2007); Garde and Patel (2011). For isolated hydrophobic moieties having dimensions similar to amino acids, within the temperature range of 273 K to 400 K the hydrophobicities first increase with temperature, and then decrease. This temperature-dependence has origins in the changes in structural dynamics of the solvating water molecules, and the entropy of solvation changes sign over the temperature interval Huang and Chandler (2000); Murphy (1994); Athawale et al. (2007). Similar behavior has recently been evidenced from statistical mining of protein structures at different temperatures van Dijk et al. (2015). However, while the temperature-dependence of hydrophobic interactions is widely acknowledged to be of critical importance in the phase behavior of both folded and disordered polypeptide sequences, and generally for thermoresponsive hydrophobic polymers Schellman (1997); Reinhardt et al. (2013); Zhu and Elcock (2010), explicit temperature-dependence of pairwise hydrophobic interactions is not conventionally used in CG models Schulz et al. (2015); Tozzini (2005, 2010, 2010); Monticelli et al. (2008); Stark et al. (2013) because of the challenges in the consistent thermodynamic mapping of the atomistic degrees of freedom to the CG representation Qian et al. (2008); Krishna et al. (2009); Rosenberger and van der Vegt (2018).
For our knowledge-based SOP-IDP Hamiltonian (eq 1), we now construct a semi-empirical functional form for incorporating the temperature-dependence into the LJ potential as used here. Starting point is the observation that the hydrophobic attraction increases with temperature and thus the dimensionless second virial coefficient of hydrophobic pair potentials (note the explicit dependence on ) between two monomers is negative and a decreasing function of temperature Lüdemann et al. (1997); Chaudhari et al. (2013). Indeed for a thermosensitive polymer, it was observed that is simply linear in over a sufficiently large temperature interval (ca. 30 K) covering the transition temperature () Reinhardt et al. (2013). The increase of the hydrophobic pair (monomer-monomer) attraction with was also observed in explicit-water simulations of the thermosensitive polymer polyethylene-glycol (PEG), for which also an explicitly temperature-dependent CG model was devised recently Chudoba et al. (2017). Hence, we assume that over a small temperature window it can be approximated by an expansion in powers of around some reference temperature, where we truncate the expansion after second order
| (2) |
The coefficient we assume is a universal constant for water as solvent and not dependent on the type of hydrophobic monomer Reinhardt et al. (2013). For , being parameterized as a LJ pair potential, we seek now to obtain a functional form for the temperature-dependence of the pairwise interactions among hydrophobic amino acids. Analytical treatment of for the LJ potential, however, poses its own challenges Vargas et al. (2001). For simplicity, we use the Mayer function definition
| (3) |
and solve it using a shifted square well potential with a temperature-dependent well depth , thus arriving at a simple, functional form for the LJ attraction energy between the CG beads, given by (see SI for derivation)
| (4) |
This differs from the parabolic forms suggested in previous studies using empirical means van Dijk et al. (2015); Dignon et al. (2019). Through physical justifications alone, constraints apply to the possible values of and , pertaining to pairwise hydrophobic bead interactions. First, , and to account for increase in hydrophobicity with , followed by decrease. Moreover, the envisaged universality of in eq 2 dictates that should also be universal, with as a free parameter specific to a pair of hydrophobes. However, considering also the length-scale dependence of hydrophobic interactions, it is more reasonable to expect that should be universal to the extent of only small differences in the dimensions of hydrophobic species.
To incorporate temperature-dependence in our Hamiltonian (eq 1), we use the functional form of eq 4 to obtain for pairwise interactions among hydrophobic side chains. Specifically, temperature-dependence is considered in pairwise interactions among the side-chain beads corresponding to residues valine (Val, V), proline (Pro, P), leucine (Leu, L), isoleucine (Ile, I), methionine (Met, M), alanine (Ala, A), phenylalanine (Phe, F), tyrosine (Tyr, Y), tryptophan (Trp, W), and neutral histidine (His, H). With the original SOP-IDP model parameterized at K, the specific to pairwise interactions, , are estimated using the linear relation
| (5) |
where is the corresponding interactions strength between the pair in the temperature-independent SOP-IDP model Baul et al. (2019). Numerical values for pairwise are listed in Table S4 in the SI.
For the electrostatic interaction term in eq 1, the dielectric constant () and the Debye screening length () are considered temperature-dependent. This term only contributes in simulations of IDPs in the manuscript, where charged amino acids are present along the sequence. Specifically, for a monovalent salt solution, , where is the permittivity of free space, is electronic charge, is Avogadro number, and is molar concentration of salt. Specific values for simulations at given temperatures were calculated using an online tool Kocherbitov (2019 (accessed 01 Apr 2019), using temperature-dependent Malmberg and Maryott (1956) values, and assuming a physiological monovalent salt concentration of 0.15 M. The values at select simulation temperatures are noted in Table S3 in the SI, and ranges between 7.89 Å and 7.54 Å in the temperature interval 288 K to 353 K.
II.2 Definitions of observables
Hydrodynamic radius () and radius of gyration (): The of a polymer chain is defined as the radius of an effective hard sphere, that has the same effective center of mass diffusivity as the polymer. From the simulated trajectories, we calculated using the conventionally used Kirkwood double-sum formula Doi and Edwards (1988),
| (6) |
known to reproduce the experimental Stoke’s radius (as measured, for example, using DLS experiments Stetefeld et al. (2016)) to within 10% accuracy Mansfield et al. (2007). Additionally, in the SI, we also report calculated using a relation proposed recently by Nygaard and co-workers Nygaard et al. (2017) for estimating the of disordered polypeptides from and sequence length. This we refer to as , and the calculation of it is described in the SI.
The values were calculated using Doi and Edwards (1988)
| (7) |
In equations 6 and 7, represents the total number of beads in the polymer. The pairwise distances are denoted by , and position vectors for individual beads and the center of mass are denoted by and , respectively.
Definition of :
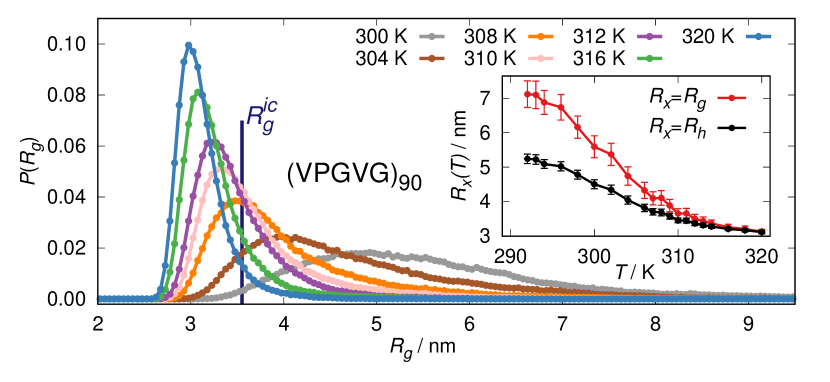
The cloud point temperature is typically used as a measure of the CST of a polymer solution Urry (1997); Meyer and Chilkoti (2002). Note that a first-order CST is only defined for polymer solutions in the thermodynamic limit Ivanov et al. (1998); Schnabel et al. (2011). The quantification of the transition of a large, many chain system is out of our computational reach, even using a coarse-grained model. We thus use the fact that the coil-to-globule transition temperature of a single polymer chain is a good marker for the LCST of polymer solutions, which has been experimentally justified, for example, for the thermoresponsive PNIPAM polymer Wu and Wang (1998). The transition from low-temperature expanded coil-like states to the high-temperature collapsed globular states is reflected in the probability distributions of , denoted by (Figure 2). The coil-to-globule transition for simple and highly flexible single polymer chains is known to be continuous, i.e., no explicitly bimodal two-state behavior can be observed for it. Two-state behavior can only be observed in polymer models by accounting for sufficient internal degrees of freedom Maffi et al. (2012), or by increasing stiffness Grosberg and Kuznetsov (1992). Using the calculated distributions for a polymer with bonds forming the backbone chain at simulated temperature , , it is possible to estimate the probabilities of globular- (), and coil-like () states at the given temperature using
| (8) |
Here is a threshold value separating collapsed (globule-like) and swollen (coil-like) states, which we choose to be the theoretical radius of gyration of an equivalent ideal chain (or Gaussian chain), . The choice ensures that we have the correct limiting behavior of the transition for infinitely long chains, where the -point coincides with the the critical point for the phase separation of the polymer solution Wang and Wang (2014); de Gennes (1979); Rubinstein and Colby (2003). We calculated from our simulations that the average bond length, , has only a weak dependence on ( nm), and is well described by nm. The transition temperature is then naturally defined by the equality of the two states . Similar definitions have also been used in the experimental studies of thermal denaturation of folded proteins Aznauryan et al. (2013).
Polymer ensemble shape parameters: The effective shape of a polymer conformation, as well as the distribution of shapes in a polymer conformational ensemble, can be characterized using distributions of variables and , defined as Hyeon et al. (2006); Dima and Thirumalai (2004)
| (9a) | ||||
| (9b) | ||||
where are the eigenvalues of the gyration tensor, and Hyeon et al. (2006). The parameter is a measure for the asphericity of conformations, and takes values between 0 (spherical) and 1 (linear). The parameter is negative for oblate ellipsoids and positive for prolate ellipsoids. The allowed values of follow the bound Aronovitz and Nelson (1986).
Simulated SAXS profiles: SAXS profiles for the scattering intensity for wave-vector from the simulated trajectories were computed using the Debye formula Putnam et al. (2013)
| (10) |
where is the total number of beads in the polymer and are pairwise distances. Optimized -dependent form factors derived using electron-density matching for two bead per residue CG representations of amino acids are available in literature Tong et al. (2016). The same (Table S1 in the reference Tong et al. (2016)) were used in our analysis. For dilute solution, the calculated using eq 10 is identical to the single chain form factor.
II.3 Simulations and data analyses
Underdamped Langevin dynamics simulations in the canonical (NVT) ensemble were carried out using the LAMMPS molecular dynamics simulator Plimpton (1995); Schneider and Stoll (1978). All simulations were carried out at vanishingly small concentrations by assigning very large box dimensions, such that the simulated molecule can not interact with its periodic images. Simulation time-step was chosen to be 30 fs. Unless specified otherwise, each simulation trajectory was equilibrated for timesteps, followed by production simulations for timesteps during which conformations were stored at equal intervals for analysis. For all systems a minimum of six independent simulations were performed. The software Visual Molecular Dynamics (VMD) was used for visualization and rendering of representative conformations Humphrey et al. (1996). Truncation and shift was used for all non-bonded interactions described in eq 1. The cut-off distance for LJ interactions was 2.4 nm. The screened Coulomb interaction cut-off was chosen to be .
In the manuscript, quantitative comparisons of simulated and experimental data have been attempted with four experimental reports. In the following, we briefly outline the key experimental conditions such as pH, ionic strength and buffer conditions from the respective reports when available. The simulated for (VPGVG)n is compared to turbidity profile measurements by Meyer and Chilkoti Meyer and Chilkoti (2004). The publication does not report any of the above conditions. Our simulations for these chains, which contain no charged amino acids, are also unaffected by salt concentration and pH through construction. For IDP p53-IDR, the SAXS profile at 293 K is compared with experiments by Fersht et al. Wells et al. (2008) (25 mM phosphate, pH 7.2, 0.15 M NaCl, 5 mM DTT, 5% (vol/vol) glycerol), and is compared with dynamic light scattering (DLS) measurements by Whitten et al. Langridge et al. (2014). The latter does not report DLS experiment conditions explicitly, whence physiological conditions are assumed. For IDP hTau40, and profiles are compared with SAXS measurements by Tenenbaum et al Battisti et al. (2017); Ciasca et al. (2012). The authors reported that protein powder was reconstituted in 50 mM MES, pH 6.8, 0.1 M NaCl and 0.5 mM EGTA, concentrated at 2 mg/ml in 0.1 phosphate buffered saline solution of ionic strength 0.02 M at pH 7.4 (among other conditions), and finally centrifuged and filtered Battisti et al. (2017). Owing to the simplicity of our energy function and simulation protocol, experimental conditions such as buffer and denaturants can not be accounted for in the simulations. Consistent with all reported pH values, histidine was considered to be neutral in simulations. Charges for other amino acids are reported in the SI. All simulations were performed considering 0.15 M monovalent salt concentrations to evaluate Debye screening lengths . In our simple protocol of using screened electrostatic interactions, the accounting for charged bead interactions is only approximate.
III Results and discussion
III.1 Assignment of universal parameters in the model: LCST in (VPGVG)n
In notable experiments, Meyer and Chilkoti studied the LCST transitions for the canonical ELP sequence (VPGVG)n (along with other sequences of lower hydrophobicities) for various sequence lengths () Meyer and Chilkoti (2004). The observed values at the very low experimental solution concentrations are ideally suited for parameterization of our model, allowing direct comparisons of simulated and experimental results, as also done previously Zhao et al. (2016). We used the values at the lowest reported ELP concentration of 1 M from the aforementioned study (see supplementary figure B therein) for (VPGVG)60 and (VPGVG)90 to determine the universal parameters and (eq 4) in our model.
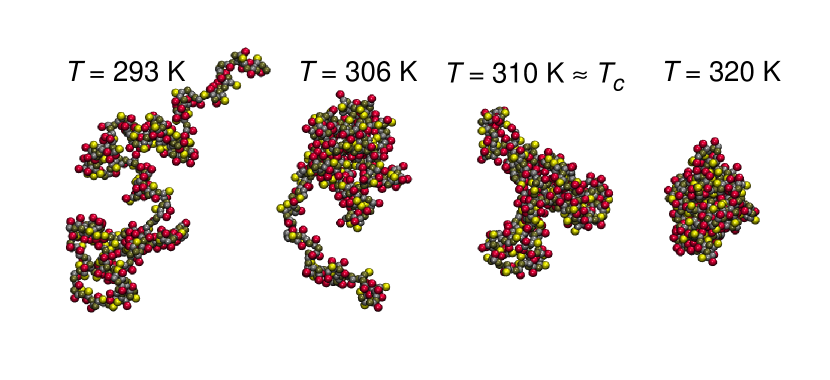
Initial estimates of reasonable ranges for and were aided by (i) the constraints on and discussed in the Methods section, (ii) novel insights from simulations Moghaddam et al. (2005), and theoretical results on length-scale dependence of temperature-dependent hydrophobicity Huang and Chandler (2000, 2002). Details are included in the SI. Note that for justified choices of and , progressive compaction of a hydrophobic ELP sequence at elevated temperatures between (290 K - 330 K) is a naturally emergent property of the functional form of (cf. eq 4). This is highlighted in the normalized probability distributions of , , shown at different values of simulation temperature in Figure 2. A visual examination of the plots shown for (VPGVG)90 already makes it apparent that at low temperatures of 300 K the conformational ensemble results in a broad distribution of values with almost all conformations contributing to values greater than the ideal chain , . As temperature is increased, the distribution as well as the mean value (shown in inset of Figure 2) shifts to smaller values of , ultimately resulting in the reverse scenario where almost all conformations are compact, having . The progressive compaction is highlighted in Figure 3 using representative snapshots of polymer conformations. We used such simulated distributions, together with the definitions of from eq 8 to estimate the LCST from our simulations for different values of and . Simultaneously comparing the from simulations with the experimental cloud points () for (VPGVG)60 and (VPGVG)90 ( 317 K and 310 K respectively Meyer and Chilkoti (2004), see discussion above), we arrived at the final parameterized values for and , given by 0.04 K-1 and -0.00037 K-2 respectively (for details on the strategy for parameterization, refer to the SI). As discussed in the Methods section, these values are kept unchanged for all results shown in the rest of the manuscript.
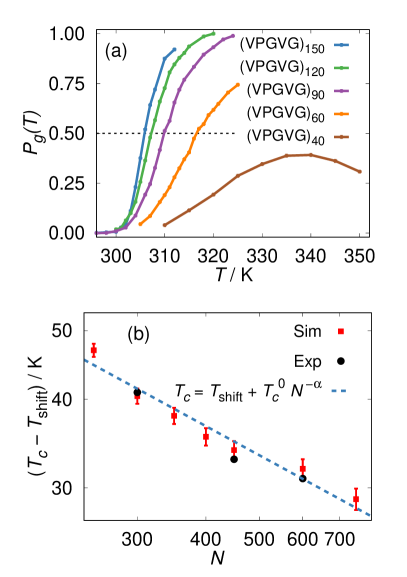
Following the parameterization of the temperature-dependence of our model using (VPGVG)60 and (VPGVG)90, we applied the model to (VPGVG)n sequences with pentameric repeats () in the broad range of 20-150. As is to be expected, the LCST transition occurs at progressively lower temperatures for larger . This is shown in Figure 4(a) through the fraction of globular conformations in the ensembles (, eq 8) as a function of . In Figure 4(a), defines the for a given sequence length. As can be seen from Figure 4(b), 308 K from simulations for (VPGVG)120 is in excellent agreement with the experimental value of 307 K at 1 M concentration obtained by Meyer and Chilkoti Meyer and Chilkoti (2004). For less than 50 pentameric repeats we do not observe LCST transitions in single chains, as shown for (VPGVG)40 in Figure 4(a) where approaches but never attains the value of 0.5. This is qualitatively consistent with reports from experimental literature, where at least = 40 pentameric repeats for (VPGVG)n have been required to observe LCST in dilute ELP solutions Tatsubo et al. (2018); Kaibara et al. (1996); Maeda et al. (2013). As such, we conclude that our model is able to accurately capture the LCST transition temperatures of (VPGVG)n sequences at low concentrations.
In experiments, for ELPs have been observed to decrease with increasing ELP concentration following a logarithmic relationship MacEwan et al. (2017); Meyer and Chilkoti (2004). Experiments also reveal a power-law dependency of on chain length for thermoresponsive PNIPAM Ye et al. (2010). The latter dependence was also envisaged using all-atom simulations for ELPs Zhao et al. (2016). The most general form of a power-law dependence of on can be expressed as , where is a reference correction. A fit of the functional form with values obtained from our simulations is shown in Figure 4(b). The values of and obtained from the fit are 276.1 K, and 461.5 K respectively. The exponent is obtained to be 0.42, which is close to 0.44 reported for PNIPAM Ye et al. (2010), and not far from 0.5 predicted by theory Flory (1953); Rubinstein and Colby (2003).
| ELP | (293 K) | (293 K) | (340 K) | (293 K) |
|---|---|---|---|---|
| (VPGVG)150 | – | 7.02 (0.32) | 3.46 (0.05) | 6.19 (0.29) |
| (VPGVG)120 | 6.0 | 6.12 (0.28) | 3.25 (0.05) | 5.52 (0.23) |
| (VPGVG)90 | – | 5.22 (0.24) | 3.00 (0.06) | 4.83 (0.19) |
| (VPGVG)60 | 4.2 | 4.24 (0.19) | 2.69 (0.07) | 3.94 (0.15) |
| (VPGVG)40 | 3.7 | 3.49 (0.16) | 2.43 (0.09) | 3.21 (0.13) |
| (VPGVG)30 | 3.4 | 3.10 (0.14) | 2.28 (0.10) | 2.86 (0.12) |
| (VPGVG)20 | 2.7 | 2.56 (0.11) | 2.04 (0.09) | 2.37 (0.10) |
III.2 Structural properties of (VPGVG)n: dimensions and disorder
In the discussions above involving the parameterization of our model, attention was paid only to the distribution of values, without any regard to the mean dimensions of chains at any given temperature. In Table 1 we compare simulated hydrodynamic radii (eq 6) of (VPGVG)n sequences at = 293 K with reported DLS measurements by Schmidt et al. at the same temperature. For completeness and additional comparison, the results obtained using the original temperature-independent SOP-IDP model at the same simulation temperature are also shown in Table 1. In Table S5 in the SI, we also report corresponding values calculated using the Nygaard relation Nygaard et al. (2017) and calculated from simulations (eq 7). First, given that the SOP-IDP model has been shown to capture the chain dimensions under ambient conditions for diverse polypeptide sequences Baul et al. (2019); Chakraborty et al. (2020), it is not surprising that the temperature-independent model results are already in fair agreement with experiments, with deviations in from the experimental values (8-15)%. It is gratifying to observe, that the temperature-dependent parameterization of the model results in improved agreement with experimental values, with maximum deviation now limited to 9%. We reiterate that the improved accuracy in the reproduction of the chain dimensions is an emergent property from our model, and the temperature-dependent SOP-IDP model captures both ‘coil-like’ ensemble dimensions, and the ‘coil-to-globule’ transition temperatures of (VPGVG)n ELPs.
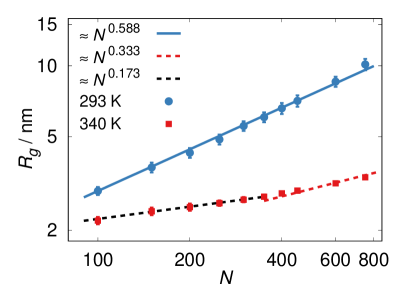
Following the physics of polymers in good solvents, it is expected that the mean for (VPGVG)n at K should scale with with sequence length following Flory’s scaling law Doi and Edwards (1988); Dobay et al. (2003). As shown in Figure 5, this is indeed observed over the entire range in simulated sequence length from to , with a prefactor nm. Similarly, the values for the high globular states should scale as , if fully collapsed Doi and Edwards (1988). From our simulations, we observed that the (VPGVG)n chains adopt most compact conformations at (335 - 340) K, above which a weak expansion of the chains is observed. This observation is highly consistent with the unfolding regime of 333 K envisaged by Marx et al. Rousseau et al. (2004). As such, we consider the at 340 K as the globule dimensions of single ELP chains ( at 340 K are reported in Table 1). Interestingly, the bad-solvent scaling of only holds for , with nm, as shown also in Figure 5. For smaller sequence lengths, , we clearly observe a weaker scaling. This is manifested through a systematic deviation towards larger than expected for the fully collapsed globular state of the polymers.
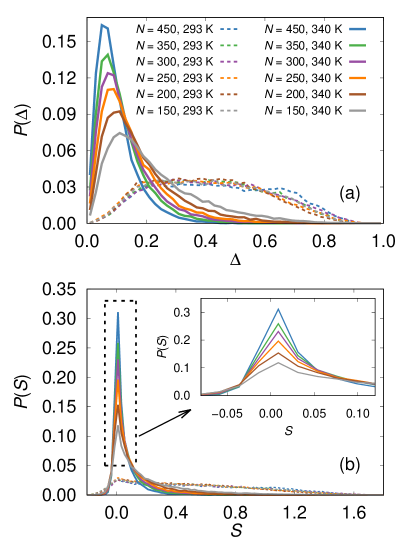
Physical insights into the origins of this apparent weaker scaling can be gained through a statistical analysis of the shapes of the polymer conformations populating the ensembles of interest. Using the temperature-independent SOP-IDP model, and polymer shape parameters and (eqs 9a, 9b) Hyeon et al. (2006); Dima and Thirumalai (2004), it was shown that the conformational ensembles of disordered polypeptide sequences under good solvent conditions, specifically IDPs, can generically be described as prolate ellipsoidal, and with characteristically broad distributions in both and Baul et al. (2019). Predominantly prolate ellipsoidal conformations have also been reported in well solvated poly-ampholytic IDPs with low charge segregation along the sequence Das and Pappu (2013); Das et al. (2015). Consistent with the observations, the distributions of shape parameters and for (VPGVG)n sequences at = 293 K, shown with dashed lines in Figures 6(a) and 6(b), are observed to be broad, and highly skewed towards elongated prolate ellipsoidal conformations. For ready reference, we recall that = 0 corresponds to a perfect sphere, while = 1 is a rigid cylinder, and 0 delineates prolate nature of an ellipsoid.
The overlapping nature of the distributions at = 293 K for all sequence lengths highlights the unchanged sequence composition with . While the conformational ensembles are substantially more spherical at = 340 K for all , a visual inspection of the and distributions corresponding to different clearly show that the conformational ensembles become increasingly spherical as is increased from 150 to 450, with increasingly larger fractions of the conformations populating peaks corresponding to 0.2 and 0. The 0.2 values indicate that the conformations are more spherical than the collapsed hairpin-like conformations observed in poly-ampholytic IDPs which are characterized by Das and Pappu (2013).
Shape fluctuation is widely regarded as a key signature of conformational heterogeneity in disordered polypeptides, and is attributed to non-homogeneous distributions of amino acids along the peptide sequences Song et al. (2017); Fuertes et al. (2017); Riback et al. (2017); Samanta et al. (2018); Baul et al. (2019). Recently, the decoupling of size and shape fluctuations has been used to reconcile discrepancies in small-angle X-ray scattering and single-molecule Förster resonance energy transfer measurements Fuertes et al. (2017). The results in Figure 6 show that varying propensity for aspherical conformations can appear also through changes in sequence length. The block-wise repetitive sequences are identical in composition apart from the sequence length, and the environmental conditions for all simulations at 340 K are also identical. A key characteristic of the energy function at 340 K, in contrast to 293 K where shape distributions are invariant, is that it strongly promotes disproportionate interactions among monomers at short length scales. This likely results in locally non-isotropic packing of monomers. With increasing chain length, entropic constraints are relaxed, and the number of allowed pairwise contacts increases substantially. As a result, the ensembles sample greater numbers of near spherical conformations. Such considerations can be important in the interpretation of experimental data, especially in the quantification of aspherical deformations.
We conclude our results on the temperature-driven conformational changes in (VPGVG)n by highlighting the disordered nature of the ensembles,- both at low and high temperatures. While Figures 2 and 5 already ascertain the good-solvent like polymeric nature and hence disorder at low , the same is not trivially inferred at high , especially for the longer chains showing LCST. Indeed, the scaling of (Figure 5, ) and relatively sharply peaked distribution of at 340 K (shown in Figure S5 in SI) can misleadingly be interpret as signatures of ordered conformations, as predicted originally for ELPs.
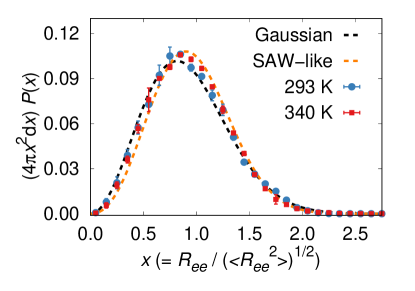
To provide a more stringent test for disorder in compact globular states (see also section titled Disordered ensemble and uncorrelated conformations in the SI), we show in Figure 7 the scaled end-to-end distance () distributions at both 293 K and 340 K for (VPGVG)90. The distributions barely show any discernable changes, and agree reasonably well with distributions expected from theoretical polymer models. This reflects the existence of a dynamically evolving and highly mobile polymeric ensemble even in the most compact phase at = 340 K, above LCST. It is important to note, however, that this does not negate the possibility for transient local structures over short length scales.
III.3 Relative hydrophobicities of amino acids
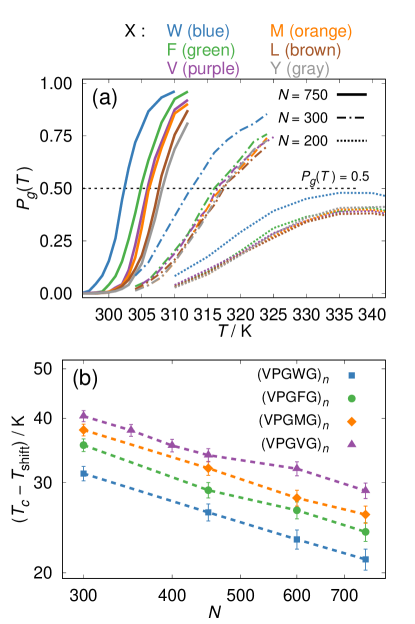
Following the initial works of Urry et al., and numerous experimental studies in subsequent years, it is understood that the chemical identity of the guest residue X in sequences (VPGXG)n influences the of the ELPs. More hydrophobic, especially aromatic-hydrophobic, residues lead to LCST transition at lower , and vice-versa Urry et al. (1985, 1991, 1992). In the context of in ELPs (amino acid hydrophobicity scales, or rankings are context dependent and varied Nozaki and Tanford (1970); Kyte and Doolittle (1982); Eisenberg (1984); Moret and Zebende (2007); Bandyopadhyay and Mehler (2008); Zhu et al. (2016)) the hydrophobic residues are ranked in descending order of hydrophobicities as Trp (W) ¿ Tyr (Y) ¿ Phe (F) ¿ Leu (L) Ile (I) ¿ Met (M) Val (V) ¿ Ala (A) Urry et al. (1992). In the list, we have ignored the titratable residue histidine (H) for which the depends critically on the protonation state, and also proline (P), by definition in ELPs. The LCST transitions observed for the corresponding (VPGXG)n sequences are shown in Figures 8(a,b) for a diverse choice of X, and small ( = 200) to long ( = 750) sequence lengths.
As shown in Figure 8(a), trends in the relative hydrophobicities of residues W, F, V, and M are faithfully reproduced by our model. The relative hydrophobicities are prominently observable for longer sequence lengths ( = 750). For smaller sequence lengths the differences become increasingly less distinct – with the exception of W, which is clearly observed as the most hydrophobic amino acid in our model. The lowest for guest residue W is immediately followed by a second aromatic-hydrophobic residue F, capturing the generally greater hydrophobicities of aromatic-hydrophobic residues compared to the aliphatic ones. The exception to this rule is tyrosine (Y), which is observed to be the least hydrophobic among the discussed hydrophobic amino acids except for alanine. Early studies report a unique characteristic of aromatic hydrophobic amino acids Rose et al. (1985), whereby depending upon methodology of characterization, they can be classified both as strongly hydrophobic Nozaki and Tanford (1970) and mostly hydrophilic Wolfenden et al. (1981). In solvent accessibility measurements of amino acids in folded proteins, Y residues show a low propensity for full burial unlike W and F Rose et al. (1985). The deviant behavior of Y in our model is attributed to this partial polar nature of Y, and consequent weaker interactions with hydrophobic residues in the knowledge-based Betancourt-Thirumalai potential used. This represents a limitation of the model in its current formalism. The complexity of the challenge dictates that the remedy should be found through incorporation of further specific interactions to the model, instead of a simple refinement of parameters. We refer the reader to a brief discussion in the Appendix. Following F are the hydrophobicities of V and M, which are virtually indistinguishable in our model. This is in reasonable agreement also with their hydrophobicity rank Urry et al. (1992). Deviating from the experimental trend, residues L and I have a higher than V and M. These deviations are discussed in the SI as part of context specific alterations of the model.
The general power law dependence of on sequence length , discussed previously for (VPGVG)n is observed to hold for generic (VPGXG)n sequences, as can be seen from the approximately linear nature of the vs. plots shown in Figure 8(b). One can envisage that power law dependence would be observed for all polymers demonstrating LCST. From a computational perspective, it endows a degree of predictability to for a polymer model, which can be highly advantageous in efficient model building and parameterization.
III.4 Temperature-dependent conformational changes in IDPs
In the results discussed thus far, we have elaborated on the performance of our model for simulations of ELP sequences (VPGXG)n over a wide range of experimentally relevant temperatures. To now challenge the performance of our model a bit further, we subject our simulations to study two intrinsically disordered polypeptide (IDP) sequences of substantially greater compositional complexity than ELPs.
As discussed in the introduction, a variety of other, possibly temperature-dependent interactions contribute to the temperature-driven structural changes in IDPs. We recapitulate that in our simulations, in addition to , we consider only the temperature-dependence of solvent mediated electrostatic interactions (see methods). Our focus is thus directed at conformational changes induced by higher temperatures. Specifically, we simulated two IDPs,– namely the 93 residue (1-93) intrinsically disordered region of protein p53 (p53-IDR) and the 441 residue human Tau protein (hTau40) over the wide temperature range of 288 K 348 K. The FASTA sequences for p53-IDR and hTau40 are provided in the SI.
The IDPs p53-IDR and hTau40 are diverse in their amino acid compositions, having both a sufficiently high fraction of charged (20% and 29% respectively) and hydrophobic (60% and 38% respectively) amino acids. IDP p53-IDR, in spite of its relatively short sequence length, assimilates in its sequence all the hydrophobic amino acids discussed in this report. It has been studied experimentally at = 293 K using SAXS Wells et al. (2008), and over temperatures ranging from 278 K to 353 K using DLS and SDS-PAGE electrophoresis Langridge et al. (2014). SAXS experiments have been reported with hTau40, encompassing a temperature range of 288 K to 333 K Battisti et al. (2017); Ciasca et al. (2012); Mylonas et al. (2008). Both IDPs were studied previously in the development of the temperature-independent SOP-IDP model Baul et al. (2019). While neither is known to undergo LCST transition, they exhibit subtle temperature driven compaction of their overall dimensions Battisti et al. (2017); Ciasca et al. (2012); Langridge et al. (2014).
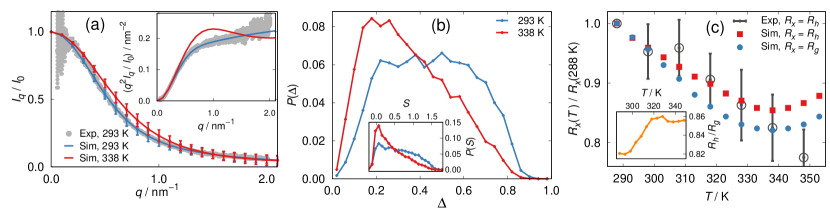
p53-IDR: Figure 9(a) compares simulated SAXS scattering intensity profiles (eq 10) with experimental SAXS profile reported by Fersht et al. at 293 K Wells et al. (2008). The simulated profile at = 293 K is in agreement with the experiment, both in the normalized scattering intensity () and the Kratky () representation (inset plot, Figure 9(a)). Quantitative consistency over the full experimentally reported range in establishes that the simulated ensemble is a highly faithful representation of the conformational ensemble of p53-IDR at the low temperature condition of = 293 K. As can be expected, the at 293 K computed from our current simulation data using eq 7, 2.92 0.5 nm, is also in good agreement with the experimentally reported value of 2.87 nm (2.95 nm at 298 K was obtained with the temperature-independent SOP-IDP model) Bernadó and Svergun (2012); Baul et al. (2019).
The simulated SAXS profile at = 338 K is also shown in Figure 9(a) using both scattering intensity and Kratky representations. Clear deviations from the corresponding curves at 293 K indicates a substantial dependence of the conformational ensemble of p53-IDR on temperature. Of special interest here is the appearance of the bell-shaped nature of the curve in the Kratky representation at 338 K, which implies a propensity towards more compact, globule-like conformations Kikhney and Svergun (2015). The polymer shape parameters and distributions at the two temperatures are shown in Figure 9(b). Both distributions clearly highlight that the conformational ensemble shifts from extended ellipsoidal conformations at 293 K to comparatively globular conformations at 338 K. The simulated at 338 K for p53-IDR was observed to be 2.47 0.5 nm, reduced by from its value at 293 K.
Hydrodynamic radius measurements for p53-IDR have been reported by Whitten et al. over a wide range of temperatures Langridge et al. (2014). The simulated (, ) and experimental () size estimates are reported in Table S6 in the SI as a function of temperature. Table S6 also includes calculated from our simulations using the Nygaard relation Nygaard et al. (2017). In spite of good agreement with SAXS described above, and the known ability of the SOP-IDP model to capture both and for other IDPs (e.g. -Synuclein) to acceptable accuracy Baul et al. (2019), we observed that the reported values were systematically larger than the simulated values, even around 293 K. A closer inspection of reported experimental values reveals an ratio 1.1 around 293 K, which deviates strongly from theoretical polymer models (limiting values of 0.665 and 0.640 for ideal chain and polymer in a good solvent, respectively Teraoka (2002)) and observations from simulations of IDPs Baul et al. (2019). As shown in the inset of Figure 9(c), the simulated value of initially increases with from 0.82 and saturates around 0.86, in agreement with prior observations with disordered states of IDPs Baul et al. (2019). To compare our simulated results with experiments by Whitten et al., we thus focus on the compaction of the normalized size of p53-IDR with temperature. The respective size estimates (experimental and simulated) at = 288 K act as appropriate normalizations.
Figure 9(c) compares from DLS measurements Langridge et al. (2014) and our simulations. For completeness, data from simulations is also shown. The comparison shows good qualitative agreement in temperature induced compaction over a wide range of temperatures ranging from 293 K (agreement at 288 K holds trivially through construction) to 338 K, with simulated data points always found within the experimental error margins in the said interval. Promising agreement is found in the smaller temperature range of 293 K 328 K. Beyond the high temperature of 340 K, the simulated results show an increase in size instead of compaction. In our simulations, this is attributable to the peaking of pairwise hydrophobic interactions around 340 K as discussed in previous sections. We refer the reader to the Appendix section, where we provide further discussion on this observed deviation.
| / K | / nm | / nm | % deviation |
|---|---|---|---|
| 293 | 6.96 (0.16) | 6.77 (0.81) | 2.73 |
| 298 | 7.00 (0.17) | 6.56 (0.80) | 6.29 |
| 303 | 6.53 (0.15) | 6.38 (0.75) | 2.30 |
| 308 | 6.40 (0.16) | 6.22 (0.76) | 2.81 |
| 313 | 6.34 (0.17) | 6.16 (0.69) | 2.84 |
| 318 | 5.93 (0.20) | 6.08 (0.79) | 2.53 |
| 323 | 6.06 (0.20) | 6.01 (0.78) | 0.83 |
| 328 | 5.90 (0.21) | 5.94 (0.72) | 0.68 |
| 333 | 5.67 (0.23) | 5.99 (0.82) | 5.64 |
| 338 | – | 6.07 (0.80) | – |
| 343 | – | 6.20 (0.81) | – |
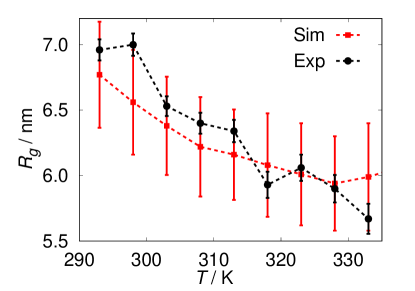
hTau40: The 441 residue long hTau40 is among the longest IDP sequences whose single chain conformational properties have been studied till date in experiments Mylonas et al. (2008); Battisti et al. (2017); Bernadó and Svergun (2012); Baul et al. (2019). It has been shown to undergo a temperature induced compaction in by 18% between the temperatures of 293 K and 333 K using SAXS measurements by Tenenbaum et al Battisti et al. (2017); Ciasca et al. (2012). The from our simulations at different simulation temperatures are compared with the corresponding experimental values in Table 2 and Figure 10. As the comparisons reflect, our simulation model not only captures a sufficiently faithful representation of the temperature-driven fractional compaction of hTau40 ( 12% from simulations vs. 15% from experiments between 293 K and 328 K), but also consistently reproduces the absolute experimental values to appreciable accuracy. For all temperatures apart from 298 K and 333 K, the deviations from experimental values is limited to 3%. Approaching high values 333 K, the simulation results show thermal expansion as discussed previously in the manuscript, in contradiction to continued compaction reported by experiment at 333 K (Figure 10).
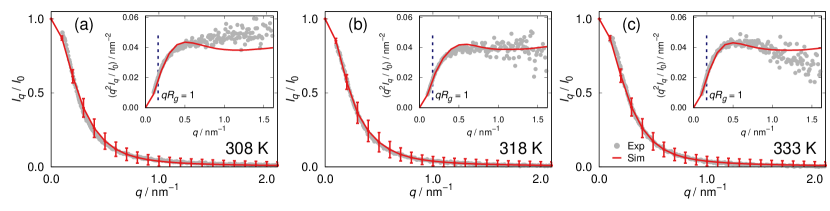
SAXS scattering intensity profiles (, eq 10) enable direct comparison between experimental and simulated conformational ensembles over varying length-scales (). In Figure 11 we compare simulated and experimental Battisti et al. (2017); Ciasca et al. (2012) profiles at three above-ambient temperatures. Consistent with the agreement observed in , the simulated and experimental profiles are in good agreement beyond the Guinier regime (). Indeed, over a wide range of temperature, strong deviations from the experimental profiles are observed only beyond , as highlighted in the Kratky representation (inset plots). At K the simulated ensemble appears to be a faithful representation of the experimental ensemble (Figure 11(b)). For a lower temperature of K (Figure 11 (a)), over-compaction is observed in the simulated ensemble. The scenario is reversed at K, with the experimental ensemble appearing to be locally compact over the simulated ensemble. With its complex sequence composition and associated conformational heterogeneity, IDP hTau40 has historically been a challenging system for study, even at ambient temperatures Mylonas et al. (2008); Baul et al. (2019). While clearly imperfect, the results are promising, and detailed analysis of the temperature-dependent conformations of hTau40 will be part of future projects.
IV Concluding remarks
We have presented an explicitly temperature-dependent coarse grained model for the simulations of disordered, predominantly hydrophobic polypeptide sequences. The model captures the structure and loci of the cloud point (here, collapse transition temperature) for a variety of experimentally probed ELP sequences, most notably for the canonical ELPs (VPGVG)n. We provided insights into the temperature-dependent size-scalings, in particular the shape behavior of globular conformations at high temperatures which indicate an anisotropic nature of the collapsed state for lower degrees of polymerization. The model is shown to capture also the high temperature compaction of more complex polypeptides, namely the IDPs p53-IDR and hTau40. A detailed study of other IDPs using the model, and the structure of their high temperature coacervates would be very interesting for future directions. Finally, we envisage that our model will be highly useful in future simulations and characterization of ELP networks and hydrogels across the collapse transition, which is very important for the development of highly responsive, functional soft materials Walther (2020).
Acknowledgements.
UB would like to thank Sébastien Groh for insightful discussions. The authors are indebted to A. Tenenbaum and G. Ciasca for tabulated experimental scattering profiles of hTau40. This project has received funding from the European Research Council (ERC) under the European Union’s Horizon 2020 research and innovation programme (grant agreement no. 646659). The authors acknowledge support by the state of Baden-Württemberg through bwHPC and the German Research Foundation (DFG) through grant no INST 39/963-1 FUGG (bwForCluster NEMO).V Appendix : Limitations of model and possible remedy
In the article we have taken care to describe the known limitations of the model. In the following, we briefly outline some possible approaches for improvement, which also represent possible future directions of research.
Deviations of relative hydrophobicities of amino acids from experiments: The small deviations observed for aliphatic amino acids can be easily accounted for, as described in the SI. We believe that the low observed hydrophobicity of Y should not be corrected purely within the scope of the model. Aromatic hydrophobic residues can contribute to additional residue-specific interactions such as - or cation- interactions, and hydrogen bonding. These interactions are stronger at lower temperatures, and are known to play important roles in UCST behavior of polypeptides Martin and Mittag (2018). In future work, we intend to extend the model to UCST transitions by including the said interactions, possibly in temperature-dependent manner. While specific results can not be predicted, presence of stronger interactions at low temperatures will drive the of Y containing sequences to lower temperatures. This effect should be accounted for before attempting to optimize of interaction parameters for Y.
Increase in simulated size of IDPs at very high temperatures: We have reported small expansions in simulated sizes of IDPs p53-IDR and hTau40 around and above K, which contradict continued compactions reported in experiments. The maxima of pairwise is strongly sensitive to parameters in eq 4. Thus, minor modifications to a parameter such as in eq 4 is a possible direct route to rectify these deviations. However, the current model does not account for temperature-dependence of pairwise interactions among polar and charged (beyond screened electrostatics) residue types. The strength of these pairwise interactions can increase at very high temperatures, driven by the reduced stability of hydration shell structures around these residues. It is possible that the increased strength of such interactions also contributes to the continued compactions of the IDPs beyond K. Existing literatures suggest that temperature-dependent modifications to such pair interactions in a simulation model should be introduced through changes in vdW radii, rather than Zhu and Elcock (2010); Chudoba et al. (2017).
References
- Koetting et al. (2015) Koetting, M. C.; Peters, J. T.; Steichen, S. D.; Peppas, N. A. Stimulus-responsive hydrogels theory, modern advances, and applications. Mater. Sci. Eng., R 2015, 93, 1 – 49.
- Gil and Hudson (2004) Gil, E. S.; Hudson, S. M. Stimuli-reponsive polymers and their bioconjugates. Prog. Polym. Sci. 2004, 29, 1173 – 1222.
- Liechty et al. (2010) Liechty, W. B.; Kryscio, D. R.; Slaughter, B. V.; Peppas, N. A. Polymers for drug delivery systems. Annu. Rev. Chem. Biomol. Eng. 2010, 1, 149–173.
- Roth and Lowe (2017) Roth, P. J.; Lowe, A. B. Stimulus-responsive polymers. Polym. Chem. 2017, 8, 10–11.
- Wei et al. (2017) Wei, M.; Gao, Y.; Li, X.; Serpe, M. J. Stimuli-responsive polymers and their applications. Polym. Chem. 2017, 8, 127–143.
- Walther (2020) Walther, A. Viewpoint: from responsive to adaptive and interactive materials and materials systems: a roadmap. Adv. Mater. 2020, 32, 1905111.
- Klouda and Mikos (2008) Klouda, L.; Mikos, A. G. Thermoresponsive hydrogels in biomedical applications. Eur. J. Pharm. Biopharm. 2008, 68, 34 – 45.
- Costa et al. (2018) Costa, R. R.; González-Pérez, M.; Herrero-Gutiérrez, M.; Pires, R. A.; Alonso, M.; Rodriguez-Cabello, J. C.; Reis, R. L.; Pashkuleva, I. Tuning the stiffness of surfaces by assembling genetically engineered polypeptides with tailored amino acid sequence. Biomacromolecules 2018, 19, 3401–3411.
- Mano (2008) Mano, J. Stimuli-responsive polymeric systems for biomedical applications. Adv. Eng. Mater. 2008, 10, 515–527.
- Ganta et al. (2008) Ganta, S.; Devalapally, H.; Shahiwala, A.; Amiji, M. A review of stimuli-responsive nanocarriers for drug and gene delivery. J. Controlled Release 2008, 126, 187 – 204.
- Gibson and O’Reilly (2013) Gibson, M. I.; O’Reilly, R. K. To aggregate, or not to aggregate? Considerations in the design and application of polymeric thermally-responsive nanoparticles. Chem. Soc. Rev. 2013, 42, 7204–7213.
- Alarcón et al. (2005) Alarcón, C. d. l. H.; Pennadam, S.; Alexander, C. Stimuli responsive polymers for biomedical applications. Chem. Soc. Rev. 2005, 34, 276–285.
- Khutoryanskiy and Georgiou (2018) Khutoryanskiy, V. V., Georgiou, T. K., Eds. Temperature-responsive polymers chemistry, properties, and applications; John Wiley & Sons: NJ, U. S. A., 2018.
- Kim and Matsunaga (2017) Kim, Y.-J.; Matsunaga, Y. T. Thermo-responsive polymers and their application as smart biomaterials. J. Mater. Chem. B 2017, 5, 4307–4321.
- Meco and Lampe (2019) Meco, E.; Lampe, K. J. Impact of elastin-like protein temperature transition on PEG-ELP hybrid hydrogel properties. Biomacromolecules 2019, 20, 1914–1925.
- Roberts et al. (2015) Roberts, S.; Dzuricky, M.; Chilkoti, A. Elastin-like polypeptides as models of intrinsically disordered proteins. FEBS Lett. 2015, 589, 2477 – 2486.
- Vrhovski and Weiss (1998) Vrhovski, B.; Weiss, A. S. Biochemistry of tropoelastin. Eur. J. Biochem. 1998, 258, 1–18.
- Urry (1997) Urry, D. W. Physical chemistry of biological free energy transduction as demonstrated by elastic protein-based polymers. J. Phys. Chem. B 1997, 101, 11007–11028.
- Urry et al. (1991) Urry, D. W.; Luan, C. H.; Parker, T. M.; Gowda, D. C.; Prasad, K. U.; Reid, M. C.; Safavy, A. Temperature of polypeptide inverse temperature transition depends on mean residue hydrophobicity. J. Am. Chem. Soc. 1991, 113, 4346–4348.
- Urry et al. (1985) Urry, D. W.; Trapane, T. L.; Prasad, K. U. Phase-structure transitions of the elastin polypentapeptide–water system within the framework of composition–temperature studies. Biopolymers 1985, 24, 2345–2356.
- Urry et al. (1992) Urry, D. W.; Gowda, D. C.; Parker, T. M.; Luan, C.-H.; Reid, M. C.; Harris, C. M.; Pattanaik, A.; Harris, R. D. Hydrophobicity scale for proteins based on inverse temperature transitions. Biopolymers 1992, 32, 1243–1250.
- MacEwan and Chilkoti (2010) MacEwan, S. R.; Chilkoti, A. Elastin-like polypeptides biomedical applications of tunable biopolymers. Pept. Sci. 2010, 94, 60–77.
- Meyer and Chilkoti (2002) Meyer, D. E.; Chilkoti, A. Genetically encoded synthesis of protein-based polymers with precisely specified molecular weight and sequence by recursive directional ligation examples from the elastin-like polypeptide system. Biomacromolecules 2002, 3, 357–367.
- Meyer and Chilkoti (2004) Meyer, D. E.; Chilkoti, A. Quantification of the effects of chain length and concentration on the thermal behavior of elastin-like polypeptides. Biomacromolecules 2004, 5, 846–851.
- Tatsubo et al. (2018) Tatsubo, D.; Suyama, K.; Miyazaki, M.; Maeda, I.; Nose, T. Stepwise mechanism of temperature-dependent coacervation of the elastin-like peptide analogue dimer, (C(WPGVG)3)2. Biochemistry 2018, 57, 1582–1590.
- Ribeiro et al. (2009) Ribeiro, A.; Arias, F. J.; Reguera, J.; Alonso, M.; Rodríguez-Cabello, J. C. Influence of the amino-acid sequence on the inverse temperature transition of elastin-like polymers. Biophys. J. 2009, 97, 312 – 320.
- Condon et al. (2017) Condon, J. E.; Martin, T. B.; Jayaraman, A. Effect of conjugation on phase transitions in thermoresponsive polymers: an atomistic and coarse-grained simulation study. Soft Matter 2017, 13, 2907–2918.
- Prhashanna et al. (2019) Prhashanna, A.; Taylor, P. A.; Qin, J.; Kiick, K. L.; Jayaraman, A. Effect of peptide sequence on the LCST-like transition of elastin-like peptides and elastin-like peptide - collagen-like peptide conjugates: simulations and experiments. Biomacromolecules 2019, 20, 1178–1189.
- Tong et al. (1999) Tong, Z.; Zeng, F.; Zheng, X.; Sato, T. Inverse molecular weight dependence of cloud points for aqueous poly(N-isopropylacrylamide) solutions. Macromolecules 1999, 32, 4488–4490.
- Furyk et al. (2006) Furyk, S.; Zhang, Y.; Ortiz-Acosta, D.; Cremer, P. S.; Bergbreiter, D. E. Effects of end group polarity and molecular weight on the lower critical solution temperature of poly(N-isopropylacrylamide). J. Polym. Sci., Part A: Polym. Chem. 2006, 44, 1492–1501.
- Chilkoti et al. (2006) Chilkoti, A.; Christensen, T.; MacKay, J. A. Stimulus responsive elastin biopolymers applications in medicine and biotechnology. Curr. Opin. Chem. Biol. 2006, 10, 652 – 657.
- Cho et al. (2008) Cho, Y.; Zhang, Y.; Christensen, T.; Sagle, L. B.; Chilkoti, A.; Cremer, P. S. Effects of Hofmeister anions on the phase transition temperature of elastin-like polypeptides. J. Phys. Chem. B 2008, 112, 13765–13771.
- Zhang et al. (2006) Zhang, Y.; Trabbic-Carlson, K.; Albertorio, F.; Chilkoti, A.; Cremer, P. S. Aqueous two-phase system formation kinetics for elastin-like polypeptides of varying chain length. Biomacromolecules 2006, 7, 2192–2199.
- Mills et al. (2019) Mills, C. E.; Ding, E.; Olsen, B. D. Cononsolvency of elastin-like polypeptides in water/alcohol solutions. Biomacromolecules 2019, 20, 2167–2173.
- Luan and Urry (1991) Luan, C. H.; Urry, D. W. Solvent deuteration enhancement of hydrophobicity DSC study of the inverse temperature transition of elastin-based polypeptides. J. Phys. Chem. 1991, 95, 7896–7900.
- Zhang et al. (2007) Zhang, Y.; Furyk, S.; Sagle, L. B.; Cho, Y.; Bergbreiter, D. E.; Cremer, P. S. Effects of Hofmeister anions on the LCST of PNIPAM as a function of molecular weight. J. Phys. Chem. C 2007, 111, 8916–8924.
- Zhang et al. (2005) Zhang, Y.; Furyk, S.; Bergbreiter, D. E.; Cremer, P. S. Specific ion effects on the water solubility of macromolecules PNIPAM and the Hofmeister series. J. Am. Chem. Soc. 2005, 127, 14505–14510.
- Karg et al. (2008) Karg, M.; Pastoriza-Santos, I.; Rodriguez-González, B.; von Klitzing, R.; Wellert, S.; Hellweg, T. Temperature, pH, and ionic strength induced changes of the swelling behavior of PNIPAM-Poly(allylacetic acid) copolymer microgels. Langmuir 2008, 24, 6300–6306.
- Zhang et al. (2007) Zhang, J.; Chu, L.-Y.; Li, Y.-K.; Lee, Y. M. Dual thermo- and pH-sensitive poly(N-isopropylacrylamide-co-acrylic acid) hydrogels with rapid response behaviors. Polymer 2007, 48, 1718 – 1728.
- Kurihara et al. (2005) Kurihara, H.; Morita, T.; Shinkai, M.; Nagamune, T. Recombinant extracellular matrix-like proteins with repetitive elastin or collagen-like functional motifs. Biotechnol. Lett. 2005, 27, 665–670.
- McMillan et al. (1999) McMillan, R. A.; Lee, T. A. T.; Conticello, V. P. Rapid assembly of synthetic genes encoding protein polymers. Macromolecules 1999, 32, 3643–3648.
- Petitdemange et al. (2017) Petitdemange, R.; Garanger, E.; Bataille, L.; Dieryck, W.; Bathany, K.; Garbay, B.; Deming, T. J.; Lecommandoux, S. Selective tuning of elastin-like polypeptide properties via methionine oxidation. Biomacromolecules 2017, 18, 544–550.
- Wright and Conticello (2002) Wright, E. R.; Conticello, V. P. Self-assembly of block copolymers derived from elastin-mimetic polypeptide sequences. Adv. Drug Delivery Rev. 2002, 54, 1057–1073.
- Chilkoti et al. (2002) Chilkoti, A.; Dreher, M. R.; Meyer, D. E. Design of thermally responsive, recombinant polypeptide carriers for targeted drug delivery. Adv. Drug Delivery Rev. 2002, 54, 1093–1111.
- Zhou et al. (2017) Zhou, M.; Shmidov, Y.; Matson, J. B.; Bitton, R. Multi-scale characterization of thermoresponsive dendritic elastin-like peptides. Colloids Surf., B 2017, 153, 141–151.
- Anaya et al. (2020) Anaya, L. M. B.; Petitdemange, R.; Rosselin, M.; Ibarboure, E.; Garbay, B.; Garanger, E.; Deming, T. J.; Lecommandoux, S. Design of thermoresponsive elastin-like glycopolypeptides for selective lectin binding and sorting. Biomacromolecules 2020, in press.
- Luo and Kiick (2015) Luo, T.; Kiick, K. L. Noncovalent modulation of the inverse temperature transition and self-assembly of elastin-b-collagen-like peptide bioconjugates. J. Am. Chem. Soc. 2015, 137, 15362–15365.
- MacEwan et al. (2017) MacEwan, S. R.; Weitzhandler, I.; Hoffmann, I.; Genzer, J.; Gradzielski, M.; Chilkoti, A. Phase Behavior and Self-Assembly of Perfectly Sequence-Defined and Monodisperse Multiblock Copolypeptides. Biomacromolecules 2017, 18, 599–609.
- Jang et al. (2019) Jang, Y.; Hsieh, M.-C.; Dautel, D.; Guo, S.; Grover, M. A.; Champion, J. A. Understanding the coacervate-to-vesicle transition of globular fusion proteins to engineer protein vesicle size and membrane heterogeneity. Biomacromolecules 2019, 20, 3494–3503.
- Suyama et al. (2018) Suyama, K.; Tatsubo, D.; Iwasaki, W.; Miyazaki, M.; Kiyota, Y.; Takahashi, I.; Maeda, I.; Nose, T. Enhancement of self-aggregation properties of linear elastin-derived short peptides by simple cyclization: strong self-aggregation properties of cyclo[FPGVG]n, consisting only of natural amino acids. Biomacromolecules 2018, 19, 3201–3211.
- Le and Sugawara-Narutaki (2019) Le, D. H. T.; Sugawara-Narutaki, A. Elastin-like polypeptides as building motifs toward designing functional nanobiomaterials. Mol. Syst. Des. Eng. 2019, 4, 545–565.
- Despanie et al. (2016) Despanie, J.; Dhandhukia, J. P.; Hamm-Alvarez, S. F.; MacKay, J. A. Elastin-like polypeptides: therapeutic applications for an emerging class of nanomedicines. J. Controlled Release 2016, 240, 93–108.
- Delaforge et al. (2018) Delaforge, E.; Cordeiro, T. N.; Bernadó, P.; Sibille, N. In Modern Magnetic Resonance; Webb, G. A., Ed.; Springer International Publishing: Cham, 2018; pp 381–399.
- Ferreon et al. (2010) Ferreon, A. C. M.; Moran, C. R.; Gambin, Y.; Deniz, A. A. In Single molecule tools: fluorescence based approaches, Part A; Walter, N. G., Ed.; Methods in Enzymology; Academic Press, 2010; Vol. 472; pp 179 – 204.
- Zong et al. (2018) Zong, J.; Cobb, S. L.; Cameron, N. R. Short elastin-like peptide-functionalized gold nanoparticles that are temperature responsive under near-physiological conditions. J. Mater. Chem. B 2018, 6, 6667–6674.
- Rauscher and Pomès (2017) Rauscher, S.; Pomès, R. The liquid structure of elastin. eLife 2017, 6, e26526.
- Li et al. (2018) Li, N. K.; Roberts, S.; Quiroz, F. G.; Chilkoti, A.; Yingling, Y. G. Sequence directionality dramatically affects LCST behavior of elastin-like polypeptides. Biomacromolecules 2018, 19, 2496–2505.
- Zhao et al. (2016) Zhao, B.; Li, N. K.; Yingling, Y. G.; Hall, C. K. LCST behavior is manifested in a single molecule elastin-like polypeptide (VPGVG)n. Biomacromolecules 2016, 17, 111–118.
- Li et al. (2014) Li, N. K.; Quiroz, F. G.; Hall, C. K.; Chilkoti, A.; Yingling, Y. G. Molecular description of the LCST behavior of an elastin-like polypeptide. Biomacromolecules 2014, 15, 3522–3530.
- Rousseau et al. (2004) Rousseau, R.; Schreiner, E.; Kohlmeyer, A.; Marx, D. Temperature-dependent conformational transitions and hydrogen-bond dynamics of the elastin-like octapeptide GVG(VPGVG): a molecular-dynamics study. Biophys. J. 2004, 86, 1393 – 1407.
- Glaves et al. (2008) Glaves, R.; Baer, M.; Schreiner, E.; Stoll, R.; Marx, D. Conformational dynamics of minimal elastin-like polypeptides: the role of proline revealed by molecular dynamics and nuclear magnetic resonance. ChemPhysChem 2008, 9, 2759–2765.
- Zhao et al. (2020) Zhao, Y.; Singh, M. K.; Kremer, K.; Cortes-Huerto, R.; Mukherji, D. Why do elastin-like polypeptides possibly have different solvation behaviors in water-ethanol and water-urea mixtures? Macromolecules 2020, 53, 2101–2110.
- Urry et al. (1981) Urry, D. W.; Trapane, T. L.; Sugano, H.; Prasad, K. U. Sequential polypeptides of elastin cyclic conformational correlates of the linear polypentapeptide. J. Am. Chem. Soc. 1981, 103, 2080–2089.
- Dignon et al. (2019) Dignon, G. L.; Zheng, W.; Kim, Y. C.; Mittal, J. Temperature-controlled liquid-liquid phase separation of disordered proteins. ACS Cent. Sci. 2019, 5, 821–830.
- Qian et al. (2008) Qian, H.-J.; Carbone, P.; Chen, X.; Karimi-Varzaneh, H. A.; Liew, C. C.; Müller-Plathe, F. Temperature-transferable coarse-grained potentials for ethylbenzene, polystyrene, and their mixtures. Macromolecules 2008, 41, 9919–9929.
- Krishna et al. (2009) Krishna, V.; Noid, W. G.; Voth, G. A. The multiscale coarse-graining method. IV. Transferring coarse-grained potentials between temperatures. J. Chem. Phys. 2009, 131, 024103.
- Rosenberger and van der Vegt (2018) Rosenberger, D.; van der Vegt, N. F. A. Addressing the temperature transferability of structure based coarse graining models. Phys. Chem. Chem. Phys. 2018, 20, 6617–6628.
- Martin and Mittag (2018) Martin, E. W.; Mittag, T. Relationship of sequence and phase separation in protein low-complexity regions. Biochemistry 2018, 57, 2478–2487.
- Molliex et al. (2015) Molliex, A.; Temirov, J.; Lee, J.; Coughlin, M.; Kanagaraj, A.; Kim, H.; Mittag, T.; Taylor, J. Phase separation by low complexity domains promotes stress granule assembly and drives pathological fibrillization. Cell 2015, 163, 123 – 133.
- Lin et al. (2015) Lin, Y.; Protter, D.; Rosen, M.; Parker, R. Formation and maturation of phase-separated liquid droplets by RNA-binding proteins. Mol. Cell 2015, 60, 208 – 219.
- Martin et al. (2016) Martin, E. W.; Holehouse, A. S.; Grace, C. R.; Hughes, A.; Pappu, R. V.; Mittag, T. Sequence determinants of the conformational properties of an intrinsically disordered protein prior to and upon multisite phosphorylation. J. Am. Chem. Soc. 2016, 138, 15323–15335.
- Brangwynne et al. (2009) Brangwynne, C. P.; Eckmann, C. R.; Courson, D. S.; Rybarska, A.; Hoege, C.; Gharakhani, J.; Jülicher, F.; Hyman, A. A. Germline P granules are liquid droplets that localize by controlled dissolution/condensation. Science 2009, 324, 1729–1732.
- Li et al. (2012) Li, P.; Banjade, S.; Cheng, H.-C.; Kim, S.; Chen, B.; Guo, L.; Llaguno, M.; Hollingsworth, J. V.; King, D. S.; Banani, S. F.; Russo, P. S.; Jiang, Q.-X.; Nixon, B. T.; Rosen, M. K. Phase transitions in the assembly of multivalent signalling proteins. Nature 2012, 483, 336–340.
- Velichko et al. (2008) Velichko, Y. S.; Stupp, S. I.; de la Cruz, M. O. Molecular simulation study of peptide amphiphile self-assembly. J. Phys. Chem. B 2008, 112, 2326–2334.
- McCarty et al. (2019) McCarty, J.; Delaney, K. T.; Danielsen, S. P. O.; Fredrickson, G. H.; Shea, J.-E. Complete phase diagram for liquid-liquid phase separation of intrinsically disordered proteins. J. Phys. Chem. Lett. 2019, 10, 1644–1652.
- Quiroz and Chilkoti (2015) Quiroz, F. G.; Chilkoti, A. Sequence heuristics to encode phase behaviour in intrinsically disordered protein polymers. Nat. Mater. 2015, 14, 1164.
- Ryan et al. (2018) Ryan, V. H.; Dignon, G. L.; Zerze, G. H.; Chabata, C. V.; Silva, R.; Conicella, A. E.; Amaya, J.; Burke, K. A.; Mittal, J.; Fawzi, N. L. Mechanistic view of hnRNPA2 low-complexity domain structure, interactions, and phase separation altered by mutation and arginine methylation. Mol. Cell 2018, 69, 465 – 479.e7.
- Wuttke et al. (2014) Wuttke, R.; Hofmann, H.; Nettels, D.; Borgia, M. B.; Mittal, J.; Best, R. B.; Schuler, B. Temperature-dependent solvation modulates the dimensions of disordered proteins. Proc. Natl. Acad. Sci. U. S. A. 2014, 111, 5213–5218.
- Jephthah et al. (2019) Jephthah, S.; Staby, L.; Kragelund, B. B.; Skepö, M. Temperature dependence of intrinsically disordered proteins in simulations what are we missing? J. Chem. Theory Comput. 2019, 15, 2672–2683.
- van Dijk et al. (2015) van Dijk, E.; Hoogeveen, A.; Abeln, S. The hydrophobic temperature dependence of amino acids directly calculated from protein structures. PLoS Comput. Biol. 2015, 11, 1–17.
- Baul et al. (2019) Baul, U.; Chakraborty, D.; Mugnai, M. L.; Straub, J. E.; Thirumalai, D. Sequence effects on size, shape, and structural heterogeneity in intrinsically disordered proteins. J. Phys. Chem. B 2019, 123, 3462–3474.
- Chakraborty et al. (2020) Chakraborty, D.; Straub, J. E.; Thirumalai, D. Differences in the free energies between the excited states of A40 and A42 monomers encode their distinct aggregation propensities. bioRxiv 2020, https://doi.org/10.1101/2020.02.09.940676.
- Malmberg and Maryott (1956) Malmberg, C. G.; Maryott, A. A. Dielectric constant of water from 0°C to 100°C. J. Res. Natl. Bur. Stand. 1956, 56, 2641.
- Liu et al. (2012) Liu, Z.; Reddy, G.; Thirumalai, D. Theory of the molecular transfer model for proteins with applications to the folding of the src-SH3 domain. J. Phys. Chem. B 2012, 116, 6707–6716.
- Reddy and Thirumalai (2015) Reddy, G.; Thirumalai, D. Dissecting ubiquitin folding using the self-organized polymer model. J. Phys. Chem. B 2015, 119, 11358–11370.
- Betancourt and Thirumalai (1999) Betancourt, M. R.; Thirumalai, D. Pair potentials for protein folding choice of reference states and sensitivity of predicted native states to variations in the interaction schemes. Protein Sci. 1999, 8, 361–369.
- Kauzmann (1959) Kauzmann, W. In Some factors in the interpretation of protein denaturation; Anfinsen, C., Anson, M., Bailey, K., Edsall, J. T., Eds.; Advances in Protein Chemistry; Academic Press, 1959; Vol. 14; pp 1 – 63.
- Huang and Chandler (2000) Huang, D. M.; Chandler, D. Temperature and length scale dependence of hydrophobic effects and their possible implications for protein folding. Proc. Natl. Acad. Sci. U. S. A. 2000, 97, 8324–8327.
- Huang and Chandler (2002) Huang, D. M.; Chandler, D. The hydrophobic effect and the influence of solute-solvent attractions. J. Phys. Chem. B 2002, 106, 2047–2053.
- Rajamani et al. (2005) Rajamani, S.; Truskett, T. M.; Garde, S. Hydrophobic hydration from small to large lengthscales: Understanding and manipulating the crossover. Proc. Natl. Acad. Sci. U. S. A. 2005, 102, 9475–9480.
- Athawale et al. (2007) Athawale, M. V.; Goel, G.; Ghosh, T.; Truskett, T. M.; Garde, S. Effects of lengthscales and attractions on the collapse of hydrophobic polymers in water. Proc. Natl. Acad. Sci. U. S. A. 2007, 104, 733–738.
- Garde and Patel (2011) Garde, S.; Patel, A. J. Unraveling the hydrophobic effect, one molecule at a time. Proc. Natl. Acad. Sci. U. S. A. 2011, 108, 16491–16492.
- Murphy (1994) Murphy, K. P. Hydration and convergence temperatures on the use and interpretation of correlation plots. Biophys. Chem. 1994, 51, 311 – 326.
- Schellman (1997) Schellman, J. Temperature, stability, and the hydrophobic interaction. Biophys. J. 1997, 73, 2960 – 2964.
- Reinhardt et al. (2013) Reinhardt, M.; Dzubiella, J.; Trapp, M.; Gutfreund, P.; Kreuzer, M.; Gröschel, A. H.; Müller, A. H. E.; Ballauff, M.; Steitz, R. Fine-tuning the structure of stimuli-responsive polymer films by hydrostatic pressure and temperature. Macromolecules 2013, 46, 6541–6547.
- Zhu and Elcock (2010) Zhu, S.; Elcock, A. H. A complete thermodynamic characterization of electrostatic and hydrophobic associations in the temperature range 0 to 100 ∘C from explicit-solvent molecular dynamics simulations. J. Chem. Theory Comput. 2010, 6, 1293–1306.
- Schulz et al. (2015) Schulz, B.; Chudoba, R.; Heyda, J.; Dzubiella, J. Tuning the critical solution temperature of polymers by copolymerization. J. Chem. Phys. 2015, 143, 243119.
- Tozzini (2005) Tozzini, V. Coarse-grained models for proteins. Curr. Opin. Struct. Biol. 2005, 15, 144 – 150.
- Tozzini (2010) Tozzini, V. Multiscale Modeling of Proteins. Acc. Chem. Res. 2010, 43, 220–230.
- Tozzini (2010) Tozzini, V. Minimalist models for proteins: a comparative analysis. Q. Rev. Biophys. 2010, 43, 333–371.
- Monticelli et al. (2008) Monticelli, L.; Kandasamy, S. K.; Periole, X.; Larson, R. G.; Tieleman, D. P.; Marrink, S.-J. The MARTINI coarse-grained force field: extension to proteins. J. Chem. Theory Comput. 2008, 4, 819–834.
- Stark et al. (2013) Stark, A. C.; Andrews, C. T.; Elcock, A. H. Toward optimized potential functions for protein-protein interactions in aqueous solutions osmotic second virial coefficient calculations using the MARTINI coarse-grained force field. J. Chem. Theory Comput. 2013, 9, 4176–4185.
- Lüdemann et al. (1997) Lüdemann, S.; Abseher, R.; Schreiber, H.; Steinhauser, O. The temperature-dependence of hydrophobic association in water. Pair versus bulk hydrophobic interactions. J. Am. Chem. Soc. 1997, 119, 4206–4213.
- Chaudhari et al. (2013) Chaudhari, M. I.; Holleran, S. A.; Ashbaugh, H. S.; Pratt, L. R. Molecular-scale hydrophobic interactions between hard-sphere reference solutes are attractive and endothermic. Proc. Natl. Acad. Sci. U. S. A. 2013, 110, 20557–20562.
- Chudoba et al. (2017) Chudoba, R.; Heyda, J.; Dzubiella, J. Temperature-dependent implicit-solvent model of polyethylene glycol in aqueous solution. J. Chem. Theory Comput. 2017, 13, 6317–6327.
- Vargas et al. (2001) Vargas, P.; Mun̂oz, E.; Rodriguez, L. Second virial coefficient for the Lennard-Jones potential. Phys. A 2001, 290, 92 – 100.
- Kocherbitov (2019 (accessed 01 Apr 2019) Kocherbitov, V. Calculation of debye length. 2019 (accessed 01 Apr 2019); http://www.surfchem.info/calculate/Debye/.
- Doi and Edwards (1988) Doi, M.; Edwards, S. F. The theory of polymer dynamics; Oxford University Press: New York, U. S. A., 1988.
- Stetefeld et al. (2016) Stetefeld, J.; McKenna, S. A.; Patel, T. R. Dynamic light scattering a practical guide and applications in biomedical sciences. Biophys. Rev. 2016, 8, 409–427.
- Mansfield et al. (2007) Mansfield, M. L.; Douglas, J. F.; Irfan, S.; Kang, E.-H. Comparison of approximate methods for calculating the friction coefficient and intrinsic viscosity of nanoparticles and macromolecules. Macromolecules 2007, 40, 2575–2589.
- Nygaard et al. (2017) Nygaard, M.; Kragelund, B. B.; Papaleo, E.; Lindorff-Larsen, K. An efficient method for estimating the hydrodynamic radius of disordered protein conformations. Biophys. J. 2017, 113, 550 – 557.
- Ivanov et al. (1998) Ivanov, V. A.; Paul, W.; Binder, K. Finite chain length effects on the coil-globule transition of stiff-chain macromolecules a monte carlo simulation. J. Chem. Phys. 1998, 109, 5659–5669.
- Schnabel et al. (2011) Schnabel, S.; Seaton, D. T.; Landau, D. P.; Bachmann, M. Microcanonical entropy inflection points Key to systematic understanding of transitions in finite systems. Phys. Rev. E 2011, 84, 011127.
- Wu and Wang (1998) Wu, C.; Wang, X. Globule-to-coil transition of a single homopolymer chain in solution. Phys. Rev. Lett. 1998, 80, 4092.
- Maffi et al. (2012) Maffi, C.; Baiesi, M.; Casetti, L.; Piazza, F.; De Los Rios, P. First-order coil-globule transition driven by vibrational entropy. Nat. Commun. 2012, 3, 1065.
- Grosberg and Kuznetsov (1992) Grosberg, A. Y.; Kuznetsov, D. V. Quantitative theory of the globule-to-coil transition. 1. link density distribution in a globule and its radius of gyration. Macromolecules 1992, 25, 1970–1979.
- Wang and Wang (2014) Wang, R.; Wang, Z.-G. Theory of polymer chains in poor solvent: single-chain structure, solution thermodynamics, and point. Macromolecules 2014, 47, 4094–4102.
- de Gennes (1979) de Gennes, P.-G. Scaling concepts in polymer physics; Cornell university press: Ithaca, NY, U. S. A., 1979.
- Rubinstein and Colby (2003) Rubinstein, M.; Colby, R. H. Polymer physics; Oxford University Press: NY, U. S. A., 2003.
- Aznauryan et al. (2013) Aznauryan, M.; Nettels, D.; Holla, A.; Hofmann, H.; Schuler, B. Single-molecule spectroscopy of cold denaturation and the temperature-induced collapse of unfolded proteins. J. Am. Chem. Soc. 2013, 135, 14040–14043.
- Hyeon et al. (2006) Hyeon, C.; Dima, R. I.; Thirumalai, D. Size, shape, and flexibility of RNA structures. J. Chem. Phys. 2006, 125, 194905.
- Dima and Thirumalai (2004) Dima, R. I.; Thirumalai, D. Asymmetry in the shapes of folded and denatured states of proteins. J. Phys. Chem. B 2004, 108, 6564–6570.
- Aronovitz and Nelson (1986) Aronovitz, J. A.; Nelson, D. R. Universal features of polymer shapes. J. Phys. France 1986, 47, 1445–1456.
- Putnam et al. (2013) Putnam, D. K.; Lowe, E. W.; Meiler, J. Reconstruction of SAXS profiles from protein structures. Comput. Struct. Biotechnol. J. 2013, 8, e201308006.
- Tong et al. (2016) Tong, D.; Yang, S.; Lu, L. Accurate optimization of amino acid form factors for computing small-angle X-ray scattering intensity of atomistic protein structures. J. Appl. Crystallogr. 2016, 49, 1148–1161.
- Plimpton (1995) Plimpton, S. Fast parallel algorithms for short-range molecular dynamics. J. Comput. Phys. 1995, 117, 1–19.
- Schneider and Stoll (1978) Schneider, T.; Stoll, E. Molecular-dynamics study of a three-dimensional one-component model for distortive phase transitions. Phys. Rev. B 1978, 17, 1302–1322.
- Humphrey et al. (1996) Humphrey, W.; Dalke, A.; Schulten, K. VMD: Visual molecular dynamics. J. Mol. Graphics Modell. 1996, 14, 33–38.
- Wells et al. (2008) Wells, M.; Tidow, H.; Rutherford, T. J.; Markwick, P.; Jensen, M. R.; Mylonas, E.; Svergun, D. I.; Blackledge, M.; Fersht, A. R. Structure of tumor suppressor p53 and its intrinsically disordered N-terminal transactivation domain. Proc. Natl. Acad. Sci. U. S. A. 2008, 105, 5762–5767.
- Langridge et al. (2014) Langridge, T. D.; Tarver, M. J.; Whitten, S. T. Temperature effects on the hydrodynamic radius of the intrinsically disordered N-terminal region of the p53 protein. Proteins: Struct., Funct., Bioinf. 2014, 82, 668–678.
- Battisti et al. (2017) Battisti, A.; Ciasca, G.; Grottesi, A.; Tenenbaum, A. Thermal compaction of the intrinsically disordered protein Tau: entropic, structural, and hydrophobic factors. Phys. Chem. Chem. Phys. 2017, 19, 8435–8446.
- Ciasca et al. (2012) Ciasca, G.; Campi, G.; Battisti, A.; Rea, G.; Rodio, M.; Papi, M.; Pernot, P.; Tenenbaum, A.; Bianconi, A. Continuous thermal collapse of the intrinsically disordered protein Tau is driven by its entropic flexible domain. Langmuir 2012, 28, 13405–13410.
- Moghaddam et al. (2005) Moghaddam, M. S.; Shimizu, S.; Chan, H. S. Temperature dependence of three-body hydrophobic interactions : potential of mean force, enthalpy, entropy, heat capacity, and nonadditivity. J. Am. Chem. Soc. 2005, 127, 303–316.
- Kaibara et al. (1996) Kaibara, K.; Akinari, Y.; Okamoto, K.; Uemura, Y.; Yamamoto, S.; Kodama, H.; Kondo, M. Characteristic interaction of Ca2+ ions with elastin coacervate ion transport study across coacervate layers of -elastin and elastin model polypeptide, (Val-Pro-Gly-Val-Gly)n. Biopolymers 1996, 39, 189–198.
- Maeda et al. (2013) Maeda, I.; Taniguchi, S.; Ebina, J.; Watanabe, N.; Hattori, T.; Nose, T. Comparison between coacervation property and secondary structure of synthetic peptides, Ile-containing elastin-derived pentapeptide repeats. Protein Pept. Lett. 2013, 20, 905–910.
- Ye et al. (2010) Ye, X.; Ding, Y.; Li, J. Scaling of the molecular weight-dependent thermal volume transition of poly(N-isopropylacrylamide). Journal of Polymer Science Part B: Polymer Physics 2010, 48, 1388–1393.
- Flory (1953) Flory, P. J. Principles of polymer chemistry; Cornell University Press: Ithaca, NY, U. S. A., 1953.
- Fluegel et al. (2010) Fluegel, S.; Fischer, K.; McDaniel, J. R.; Chilkoti, A.; Schmidt, M. Chain stiffness of elastin-like polypeptides. Biomacromolecules 2010, 11, 3216–3218.
- Dobay et al. (2003) Dobay, A.; Dubochet, J.; Millett, K.; Sottas, P.-E.; Stasiak, A. Scaling behavior of random knots. Proc. Natl. Acad. Sci. U. S. A. 2003, 100, 5611–5615.
- Das and Pappu (2013) Das, R. K.; Pappu, R. V. Conformations of intrinsically disordered proteins are influenced by linear sequence distributions of oppositely charged residues. Proc. Natl. Acad. Sci. U. S. A. 2013, 110, 13392–13397.
- Das et al. (2015) Das, R. K.; Ruff, K. M.; Pappu, R. V. Relating sequence encoded information to form and function of intrinsically disordered proteins. Curr. Opin. Struct. Biol. 2015, 32, 102 – 112.
- Song et al. (2017) Song, J.; Gomes, G.-N.; Shi, T.; Gradinaru, C. C.; Chan, H. S. Conformational heterogeneity and FRET data interpretation for dimensions of unfolded proteins. Biophys. J. 2017, 113, 1012 – 1024.
- Fuertes et al. (2017) Fuertes, G. et al. Decoupling of size and shape fluctuations in heteropolymeric sequences reconciles discrepancies in SAXS vs. FRET measurements. Proc. Natl. Acad. Sci. U. S. A. 2017, 114, E6342–E6351.
- Riback et al. (2017) Riback, J. A.; Bowman, M. A.; Zmyslowski, A. M.; Knoverek, C. R.; Jumper, J. M.; Hinshaw, J. R.; Kaye, E. B.; Freed, K. F.; Clark, P. L.; Sosnick, T. R. Innovative scattering analysis shows that hydrophobic disordered proteins are expanded in water. Science 2017, 358, 238–241.
- Samanta et al. (2018) Samanta, H. S.; Chakraborty, D.; Thirumalai, D. Charge fluctuation effects on the shape of flexible polyampholytes with applications to intrinsically disordered proteins. J. Chem. Phys. 2018, 149, 163323.
- Nozaki and Tanford (1970) Nozaki, Y.; Tanford, C. The solubility of amino acids and two glycine peptides in aqueous ethanol and dioxane solutions establishment of a hydrophobicity scale. J. Biol. Chem. 1970, 246, 2211–2217.
- Kyte and Doolittle (1982) Kyte, J.; Doolittle, R. F. A simple method for displaying the hydropathic character of a protein. J. Mol. Biol. 1982, 157, 105 – 132.
- Eisenberg (1984) Eisenberg, D. Three-dimensional structure of membrane and surface proteins. Annu. Rev. Biochem. 1984, 53, 595–623.
- Moret and Zebende (2007) Moret, M. A.; Zebende, G. F. Amino acid hydrophobicity and accessible surface area. Phys. Rev. E 2007, 75, 011920.
- Bandyopadhyay and Mehler (2008) Bandyopadhyay, D.; Mehler, E. L. Quantitative expression of protein heterogeneity: response of amino acid side chains to their local environment. Proteins: Struct., Funct., Bioinf. 2008, 72, 646–659.
- Zhu et al. (2016) Zhu, C.; Gao, Y.; Li, H.; Meng, S.; Li, L.; Francisco, J. S.; Zeng, X. C. Characterizing hydrophobicity of amino acid side chains in a protein environment via measuring contact angle of a water nanodroplet on planar peptide network. Proc. Natl. Acad. Sci. U. S. A. 2016, 113, 12946–12951.
- Rose et al. (1985) Rose, G.; Geselowitz, A.; Lesser, G.; Lee, R.; Zehfus, M. Hydrophobicity of amino acid residues in globular proteins. Science 1985, 229, 834–838.
- Wolfenden et al. (1981) Wolfenden, R.; Andersson, L.; Cullis, P. M.; Southgate, C. C. B. Affinities of amino acid side chains for solvent water. Biochemistry 1981, 20, 849–855.
- Rohtagi (2019 (accessed 01 May 2019) Rohtagi, A. WebPlotDigitizer Version 4.2. 2019 (accessed 01 May 2019); https://automeris.io/WebPlotDigitizer.
- Mylonas et al. (2008) Mylonas, E.; Hascher, A.; Bernadó, P.; Blackledge, M.; Mandelkow, E.; Svergun, D. I. Domain conformation of Tau protein studied by solution small-angle X-ray scattering. Biochemistry 2008, 47, 10345–10353.
- Bernadó and Svergun (2012) Bernadó, P.; Svergun, D. I. Structural analysis of intrinsically disordered proteins by small-angle X-ray scattering. Mol. BioSyst. 2012, 8, 151–167.
- Kikhney and Svergun (2015) Kikhney, A. G.; Svergun, D. I. A practical guide to small angle X-ray scattering (SAXS) of flexible and intrinsically disordered proteins. FEBS Lett. 2015, 589, 2570 – 2577.
- Teraoka (2002) Teraoka, I. Polymer solutions an introduction to physical properties; John Wiley & Sons: New York, U. S. A., 2002.