X-ray Spectral and Timing evolution of MAXI J1727–203 with NICER
Abstract
We present a detailed X-ray spectral and variability study of the full 2018 outburst of MAXI J1727–203 using NICER observations. The outburst lasted approximately four months. Spectral modelling in the 0.3–10 keV band shows the presence of both a soft thermal and a hard Comptonised component. The analysis of these components shows that MAXI J1727–203 evolved through the soft, intermediate and hard spectral states during the outburst. We find that the soft (disc) component was detected throughout almost the entire outburst, with temperatures ranging from 0.4 keV, at the moment of maximum luminosity, to 0.1 keV near the end of the outburst. The power spectrum in the hard and intermediate states shows broadband noise up to 20 Hz, with no evidence of quasi-periodic oscillations. We also study the rms spectra of the broadband noise at keV of this source. We find that the fractional rms increases with energy in most of the outburst except during the hard state, where the fractional rms remains approximately constant with energy. We also find that, below 3 keV, the fractional rms follows the same trend generally observed at energies keV, a behaviour known from previous studies of black holes and neutron stars. The spectral and timing evolution of MAXI J1727–203, as parametrised by the hardness-intensity, hardness-rms, and rms-intensity diagrams, suggest that the system hosts a black hole, although we could not rule out a neutron star.
keywords:
Accretion, accretion discs black hole physics X-rays: binaries stars: individual: MAXI J1727-2031 Introduction
Low mass X-ray binary systems (LMXBs) are binaries that contain a compact object, either a black hole (BH) or a neutron star (NS) and an evolved low-mass companion star. LMXBs for which the compact object is a black-hole candidate are known as BH low-mass X-ray binaries (BH LMXBs). The energy spectra of BH LMXBs are characterised by two main components: a soft thermal component and a hard power-law like component (e.g. Remillard & McClintock, 2006; Belloni, 2010). The thermal component is generally described by a multi-colour disc blackbody model (Mitsuda et al., 1984) peaking at 1–2 keV (see review by Done et al., 2007, and references therein) and thought to be produced by a geometrically thin and optically thick accretion disc (Shakura & Sunyaev, 1973). The hard component is thought to be produced by a region of hot plasma, around the compact object and the accretion disc (the so-called "corona"; Sunyaev & Truemper, 1979; Sunyaev & Titarchuk, 1980). A thermal Comptonisation model, in which high-energy photons are emitted by inverse Compton scattering (Sunyaev & Titarchuk, 1980), has been proposed to explain the hard component of the BH LMXBs energy spectra (e.g. Titarchuk, 1994; Zdziarski & Gierliński, 2004; Done et al., 2007; Burke et al., 2017).
BH LMXBs show a variety of spectral and timing properties during an outburst (see e.g. van der Klis, 1989; Méndez & van der Klis, 1997; van der Klis, 2000; Homan & Belloni, 2005; Remillard & McClintock, 2006; Belloni, 2010; Belloni et al., 2011; Plant et al., 2014; Motta, 2016). Two main spectral states can be defined (see e.g., Tanaka, 1989; van der Klis, 1994): the low/hard state (LHS), when the thermal Comptonised component dominates the energy spectrum, and the high/soft state (HSS) when the thermal component dominates the spectrum. In the LHS, however, a multi-colour disc blackbody component can be detected (e.g. Capitanio et al., 2009; Wang-Ji et al., 2018). In this state, the power-density spectrum (PDS) is characterised by a strong broadband noise component with a fractional rms amplitude of 30%–50% (e.g. Méndez & van der Klis, 1997; Belloni et al., 2005; Remillard & McClintock, 2006; Muñoz-Darias et al., 2011; Motta, 2016). In addition, quasi-periodic oscillations (QPOs) of type-C can be detected (e.g., Casella et al., 2004; Belloni et al., 2005). These oscillations have a centroid frequency ranging from 0.01 Hz to 30 Hz. In the HSS, a weak power-law component is sometimes detected in the energy spectrum (e.g. Capitanio et al., 2009). The broadband fractional rms of BHs in this state is generally less than 5% (Méndez & van der Klis, 1997), and QPOs are sometimes detected, too (e.g. Remillard & McClintock, 2006; Muñoz-Darias et al., 2011; Motta, 2016).
Between the LHS and HSS, two intermediate states can be distinguished in terms of variability: the hard intermediate state (HIMS) and the soft intermediate state (SIMS) (see, e.g. Homan & Belloni, 2005; Belloni, 2010). The HIMS shows less broadband fractional rms than the hard state (10%–30%; e.g. Muñoz-Darias et al., 2011; Motta et al., 2012) and type-C QPOs can be present (e.g. Casella et al., 2004; Belloni et al., 2005; Belloni & Stella, 2014). The SIMS is characterised by a weak power-law noise component that replaces the broadband noise component present in the HIMS, and type-A or type-B QPOs (e.g. Wijnands et al., 1999; Homan et al., 2001; Casella et al., 2004; Belloni et al., 2005; Belloni & Stella, 2014). Type-B QPOs have centroid frequencies in the 1–7 Hz frequency range (Gao et al., 2017) and a quality factor, Q > 6. Type-A QPOs have centroid frequencies in the 6.5–8 Hz frequency range and are broader than type-B and type-C QPOs, with a quality factor of Q1–3 (Wijnands et al., 1999; Casella et al., 2004; Belloni & Stella, 2014).
The evolution of a BH LMXB through an outburst can be well illustrated using the hardness-intensity diagram (HID; e.g. Homan et al., 2001; Remillard & McClintock, 2006; Belloni et al., 2006). At the beginning of the outburst, the source is in the LHS and its intensity increases at approximately constant hardness ratio, drawing a vertical line in the right part of the HID. At some point, in the outburst evolution, the source starts a transition to the HSS, moving to the left in the diagram at an approximately constant luminosity. This transition corresponds to the top horizontal branch in the HID (HIMS and SIMS), reaching the HSS at the top left part of the HID. During the HSS, the source starts to decrease its intensity, moving down in the diagram. Eventually, the source returns to the HIMS and SIMS, drawing a horizontal branch in the HID, but in the opposite direction, from left to right. Before the end of the outburst, the source reaches the hard state again, to finally return to quiescence. This very particular pattern in the HID of BH LMXBs is known as the q-track and it is often discussed in terms of hysteresis (e.g., Miyamoto et al., 1995). Multiple outbursts of different sources follow this q-track: e.g. XTE 1550–564, GX 339–4, H1743–322 and GRO J1655–40 (Homan et al., 2001; Belloni et al., 2005; Fender et al., 2009; Dunn et al., 2010; Uttley & Klein-Wolt, 2015).
The outburst evolution can also be analysed using the hardness-rms diagram (HRD, Belloni et al., 2005) and the rms-intensity diagram (RID, Muñoz-Darias et al., 2011). The different spectral states show different fractional rms-hardness ratio correlations. Observations in the LHS are located on the top right side of the HRD. When the source enters the HIMS and the SIMS, it moves to the bottom left side of the HRD diagonally until the source reaches the HSS. Finally, the evolution reverses, returning to the HIMS and the SIMS following the same track as before, until it reaches the hard state again at the top right side of the HRD. The evolution in the RID is counterclockwise, similar to the one observed in the HID. In the LHS, the source evolves along a diagonal line from the bottom left to the top right of the diagram. This line is called the “Hard Line” (HL, Muñoz-Darias et al., 2011). When it makes the transition to the HIMS and SIMS, the source moves horizontally to the left side of the RID. Then the source reaches the HSS and starts to move down along a diagonal following the 1% rms line. Finally, the source returns to the HIMS and SIMS moving horizontally to the right side of the diagram. At some point the source reaches again the 30% rms line and goes down diagonally following the so-called “Adjacent Hard Line” (AHL), which is coincident to the Hard Line.
LMXBs in which the compact object is a NS are known as NS LMXBs. The energy spectra of NS LMXBs are characterised by three components: a disc blackbody component and a Comptonised component as for BH LMXBs, and a blackbody component from the emission of the surface of the NS and its boundary layer (e.g. Mitsuda et al., 1984; Di Salvo et al., 2000; Gierliński & Done, 2002; Lin et al., 2007). NS LMXBs show different X-ray spectral states (for a review, see van der Klis, 2006). At high accretion rates, NS LMXBs follow Z-tracks in the HID and the colour-colour diagrams. These sources are known as Z sources. At low accretion rates, NS LMXBs are known as atoll sources due to the tracks they follow in colour-colour diagrams (Hasinger & van der Klis, 1989). Atoll sources show three X-ray spectral states that are comparable to the X-ray spectral states of BH LMXBs (e.g. van der Klis, 2006; Muñoz-Darias et al., 2014). Besides, the hysteresis observed in BH LMXBs has been also observed in NS LMXBs (Muñoz-Darias et al., 2014), sometimes even the q-track (Körding et al., 2008).
Some differences between BH LMXBs and NS LMXBs have been observed in the X-ray spectral and timing properties. The hard state of NS systems is softer than that of BH systems (e.g. Done & Gierliński, 2003). In terms of timing properties, the most important difference between the two types of LMXBs is the presence of kilo-hertz QPOs (kHz QPOs) at frequencies between 300 Hz and 1.2 kHz for NS (van der Klis, 2006; van Doesburgh et al., 2018). In terms of the broadband noise component and low-frequency QPOs (LFQPOs), NSs and BHs systems can be very similar (e.g. Klein-Wolt & van der Klis, 2008) but, while BH LMXBs usually show broadband noise up to 500 Hz, NS systems can show broadband noise at higher frequencies (Sunyaev & Revnivtsev, 2000).
MAXI J1727–203 was discovered on 2018 June 5 with MAXI/GSC (Yoneyama et al., 2018). Ludlam et al. (2018b) and Kennea et al. (2018) reported, respectively, observations performed the same day with the Neutron star Interior Composition Explorer (NICER; Gendreau et al., 2012) and with the Neil Gehrels Swift Observatory (Swift; Gehrels et al., 2004). A hard-to-soft state transition and the disc properties of the system in the soft state, led to the possible identification of the source as a BH transient (Negoro et al., 2018). In mid-July of 2018, a soft-to-hard transition was observed with Swift/XRT (Tomsick et al., 2018).
NICER (Gendreau et al., 2012) is an X-ray instrument aboard the International Space Station (ISS) launched in 2017. It consists on 52 functioning detectors. Photons in the keV energy band can be detected to a time resolution of 300 ns. In this paper, we present the first study of the spectral and timing evolution of the 4-months long outburst of MAXI J1727–203 as observed with NICER. In Section 2 we describe the observations and data analysis. In section 3 we present the results of the spectral and timing study. In section 3.1 we describe the outburst evolution. In sections 3.2 and 3.3 we describe the timing and spectral properties, respectively. Finally, in Section 4 we discuss the nature of the compact object of the source and the identification of its spectral states.
2 Observation and data analysis
NICER observed MAXI J1727–203 86 times between 2018 June 5 and 2018 October 7 (ObsID ). The data were analysed using the software HEASOFT version 6.26 and NICERDAS version 6.0. The latest CALDB version 20190516 was used. We applied standard filtering and cleaning criteria, including the data where the pointing offset was , the dark Earth limb angle was , the bright Earth limb angle was , and the International Space Station (ISS) was outside the South Atlantic Anomaly (SAA). We removed data from detectors 14 and 34 which occasionally show episodes of increased electronic noise, so all our results are based on using NICER’s 50 other active detectors. Also, we excluded time intervals showing strong background flare-ups, that is, time intervals with an averaged count rate in the 13–15 keV energy band higher than 1 c/s. The good time intervals (GTIs) of each observation were separated into several data segments () based on the orbit of the ISS. The background was calculated using the “3C50_RGv5" model provided by the NICER team.
To create the long-term light curve and the HID of the outburst, we first produced 1-s binned light curves in the keV, keV and keV energy bands for each data segments using XSELECT. We then applied the background correction for each light curve and calculated averages per data segment. We defined intensity as the average count rate in the keV energy range and the hardness ratio as the ratio between the keV and the keV band count rates (both background subtracted).
We extracted a background-subtracted energy spectra for each data segment using the “3C50_RGv5" model mentioned above. We fitted the energy spectra of MAXI J1727–203 in the energy band keV using XSPEC (V. 12.10.1; Arnaud, 1996). We rebinned the spectra by a factor of 3 to correct for energy oversampling and then to have at least 25 counts per bin. In addition, we added a systematic error of 1% in the energy range keV (suggested by the NICER team). We found strong instrumental residuals below 2 keV. These residuals are typical for X-ray missions and Si-based detectors (e.g. Ludlam et al., 2018a; Miller et al., 2018). We therefore added a 5% systematic error in the keV energy band (also suggested by the NICER team). We fitted the energy spectra with an absorbed (tbabs in XSPEC, Wilms et al., 2000) power-law model, tbabspowerlaw, an absorbed disc blackbody (Mitsuda et al., 1984), tbabsdiskbb, and an absorbed combination of a thermally Comptonisation model (Zdziarski et al., 1996; Życki et al., 1999) and a multi-colour disc blackbody tbabs(nthcomp+diskbb). Fitting the spectra with the models tbabspowerlaw and tbabsdiskbb did not give satisfactory fits in terms of and expected spectral parameters. Therefore, in this paper, we only report the results of using the model tbabs(nthcomp+diskbb). In order to obtain the fluxes of the different components, we added two cflux components to the models. The solar abundances were set according to Wilms et al. (2000) and the hydrogen column density () of the tbabs was left free. The cross section was set according to Verner et al. (1996). The 1 errors of the parameters were calculated from a Markov Chain Monte Carlo of length 10000 with a 2000-step burn-in phase.
For the Fourier timing analysis, we constructed Leahy-normalized power spectra (Leahy et al., 1983) using data segments of 131 seconds and a time resolution of 125s. The minimum frequency was 0.007 Hz and the Nyquist frequency was 4096 Hz. Then we averaged the power spectra per observation and subtracted the Poisson noise based on the average power in the kHz frequency range. Finally, we converted the power spectra to squared fractional rms (van der Klis, 1995). We obtained the integrated fractional rms amplitude from 0.01 Hz to 64 Hz. To obtain the rms spectrum (i.e. fractional rms amplitude vs energy), we repeated the previous procedure for the following energy bands: keV, keV, keV and keV. We obtained the Hz fractional rms amplitude for all these bands and plotted the fractional rms amplitude vs energy to study the evolution of the energy dependence of the fractional rms amplitude.
To fit the power spectra we used a multi-Lorentzian function: the sum of several Lorentzians. We give the frequency of the Lorentzians in terms of the characteristic frequency, which is the frequency where the component contributes most of its variance per logarithmic interval of frequency (Belloni et al., 2002): . The quality factor is defined as , where is the full width at half maximum and the centroid frequency of the Lorentzian.
3 Results
3.1 Outburst evolution
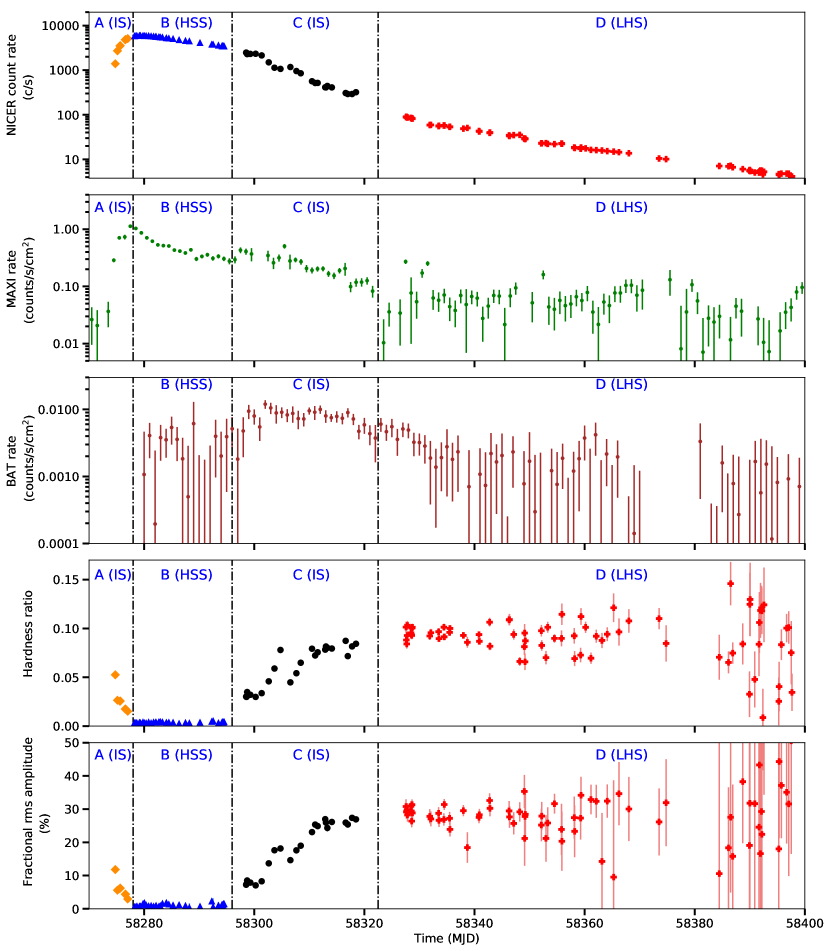
We show the NICER light curve of the 2018 outburst of MAXI J1727–203, which covers a period of 123 days, in the keV energy band in the top panel of Figure 1. Based on our spectral and variability studies, which are described below, we define four phases of the outburst in Figure 1: phase A (from MJD 58274 to MJD 58278; shown with orange diamonds), phase B (from MJD 58278 to MJD 58296; shown with blue triangles), phase C (from MJD 58296 to MJD 58322; shown with black circles) and phase D (from MJD 58322 to the end of the outburst; shown with red filled crosses).
The first NICER detection of the source was on MJD 58274, at a count rate of 1400 c/s, indicating that the NICER observations caught the outburst already at a high flux. The intensity increased very quickly until MJD 58279 in phase A when the source reached a maximum intensity of 5960 c/s. After the maximum, the flux decreased monotonically, although the decay can be divided into 3 parts. As the source entered phase B of the outburst, its intensity decreased smoothly from 5960 c/s to 3400 c/s over the next 18 days of observation. During phase C of the outburst, the intensity decreased faster than in phase B, from 2500 c/s to 300 c/s over 26 days. Finally, in phase D the intensity decreased from 90 c/s to 4 c/s over the last 75 days of X-ray monitoring. After that, the apparent position of the source was located behind the Sun from the point of view of NICER in its Earth orbit on-board the ISS. After the MAXI J1727–203 occultation by the Sun, NICER did not perform further observations of this source.
We also show the keV MAXI111http://maxi.riken.jp/pubdata/v6m/J1728-203/index.html and the keV Swift/BAT222https://swift.gsfc.nasa.gov/results/transients/weak/MAXIJ1727-203.lc.txt light curves of MAXI J1727–203 in the second and third panels of Figure 1, respectively. The rise of the outburst was detected by MAXI, showing that the intensity increased by a factor of 50 in four days. In phase B, the MAXI intensity decayed faster than the NICER intensity. The analysis of the keV NICER light curve shows the same trend as the keV light curve, probably indicating that the difference between NICER and MAXI is due to differences in their respective effective areas. In phases C and D of the outburst, the evolution of both NICER and MAXI light curves were similar. The Swift/BAT light curve did not sample the rise of the outburst, however, it gives additional information during phases B and C, where the keV intensity showed a bump. In phases C and D, the Swift/BAT intensity decayed until the end of the outburst.
In the fourth panel in Figure 1 we show the temporal evolution of the hardness ratio (as estimated from NICER data) during the whole outburst. The different phases of the outburst show a different behaviour of the hardness ratio. In phase A of the outburst, the hardness ratio drop from 0.05 to 0.02. In phase B the hardness ratio remained constant with values around 0.004. In phase C the hardness ratio increased from 0.03 to 0.09. In phase D the source showed an approximately constant hardness ratio with an average value of 0.09. Due to the data-gaps between phases B and C, and phases C and D, we arbitrarily chose the limits between phases in the middle of the gap.
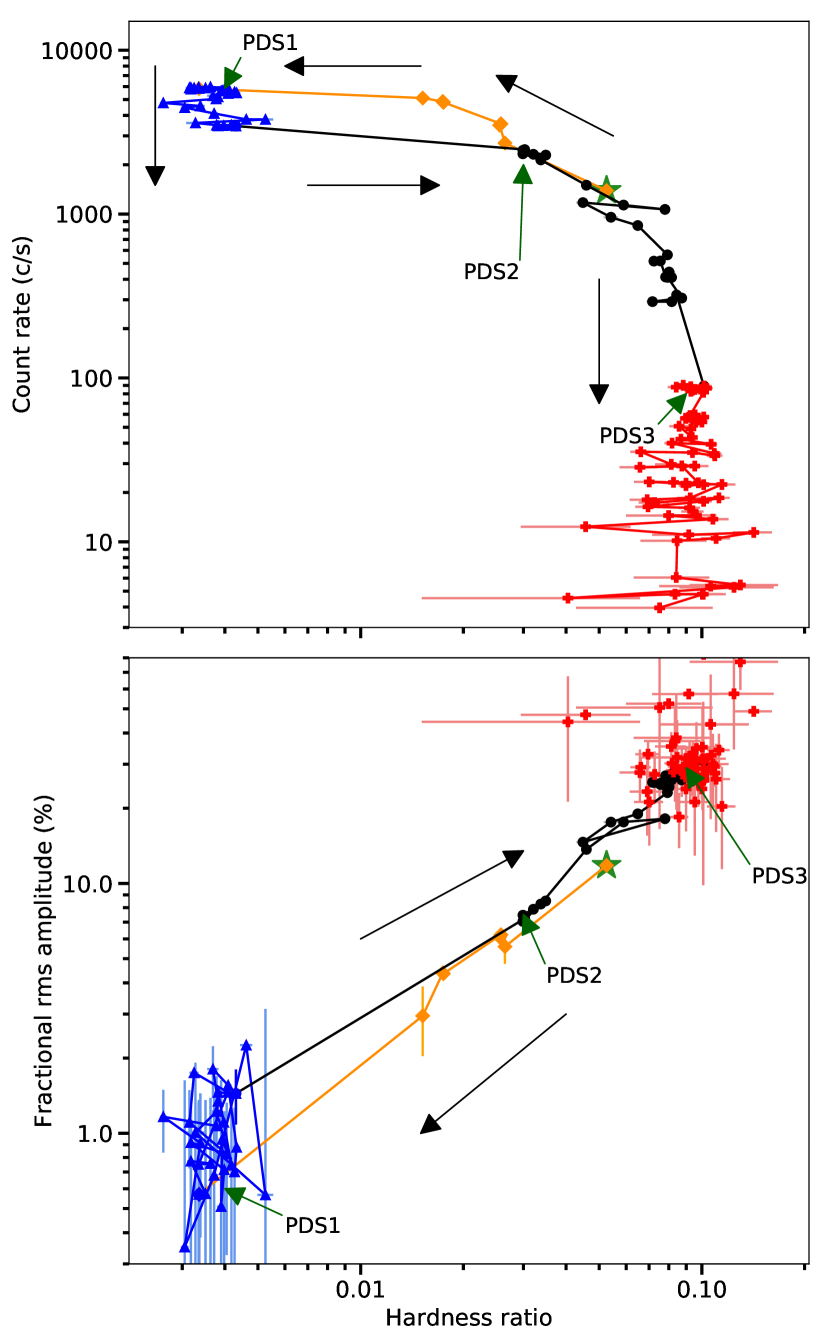
In the top panel of Figure 2 we show the HID. The first point is marked with a green star in the phase A of the outburst (orange diamonds). During this phase, the source evolved in the top part of the HID from the right side to the left side. In the phase B of the outburst (blue triangles) the source reduced its intensity at an approximately constant hardness ratio. Then the source entered the phase C of the outburst (black circles) and evolved from the top left to the right side of the diagram. Finally, during the phase D of the outburst (red crosses) the source evolved to the bottom right side of the diagram. Although we are missing the rise of the outburst, a q-track shape is clear in Figure 2.
3.2 Timing properties
As expected from LMXBs in outburst, the X-ray variability of MAXI J1727–203 also evolved through the 2018 outburst. The bottom panel in Figure 1 shows the temporal evolution of the averaged fractional rms amplitude. During the first observation (MJD 58274) MAXI J1727–203 showed a fractional rms amplitude of 12%. Then, the fractional rms decreased down to 3% in phase A of the outburst. In phase B, the fractional rms amplitude ranged from 2% to 0.5%, in phase C it increased from 7% to 27% and, in phase D, it remained approximately constant at 30%.
In the bottom panel of Figure 2 we show the HRD. The first observation is marked with a green star and it showed a hardness ratio of 0.05 and a fractional rms amplitude of 12%. Then, the source evolved to the bottom left part of the diagram reaching values of the fractional rms amplitude %. Finally, the evolution reversed and the source moved to the top right side of the diagram, increasing its hardness ratio and the fractional rms amplitude.
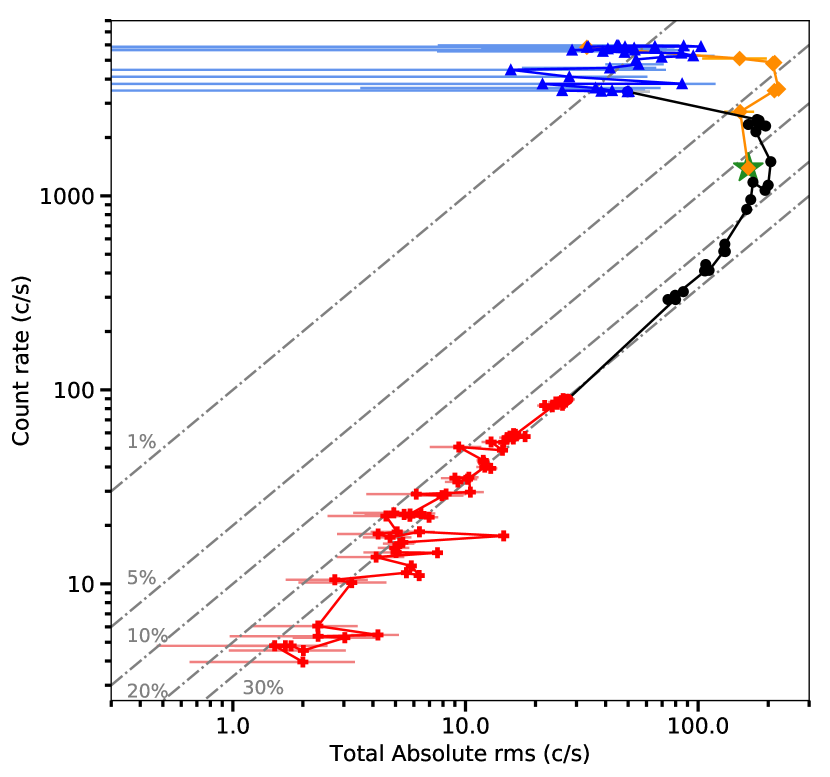
Figure 3 shows how MAXI J1727–203 evolves in the absolute rms-intensity diagram. The source described the anticlockwise pattern that has been observed for other BHs (e.g. MAXI J1348–630, Zhang et al. in prep; GX 339–4, Muñoz-Darias et al., 2011). The first point of the outburst in the RID is denoted with a green star. As the source evolved it crossed the 10% fractional rms amplitude line increasing its intensity. Two days later, on MJD 58276, the source crossed the 5% line and after that it moved horizontally to the left of the diagram. From MJD 58278 to MJD 58294, MAXI J1727–203 stayed close to the 1% rms line while the intensity decreased. This corresponds to the softest part of the HID and the bottom-left part of the HRD (shown with blue triangles in the bottom panel of Figure 1 and Figure 2). After MJD 58298 the source evolved in the opposite way going back to the right side of the RID. On MJD 58302, MAXI J1727–203 crossed the 10% rms line and on MJD 58310, it crossed the 20% rms line. 17 days later, on MJD 58327, the source evolved around the 30% rms line, identifying this as the Adjacent Hard Line. This is shown with red filled crosses in Figure 1 and Figure 2.
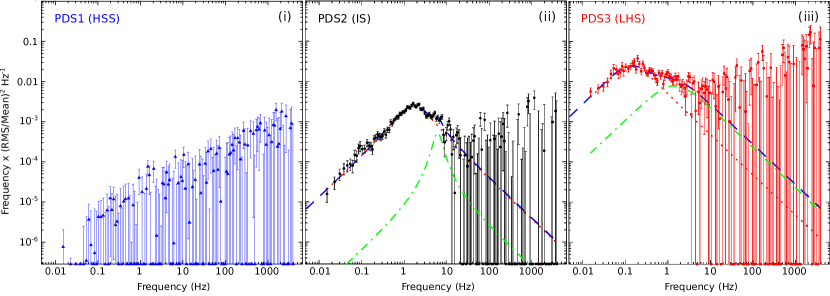
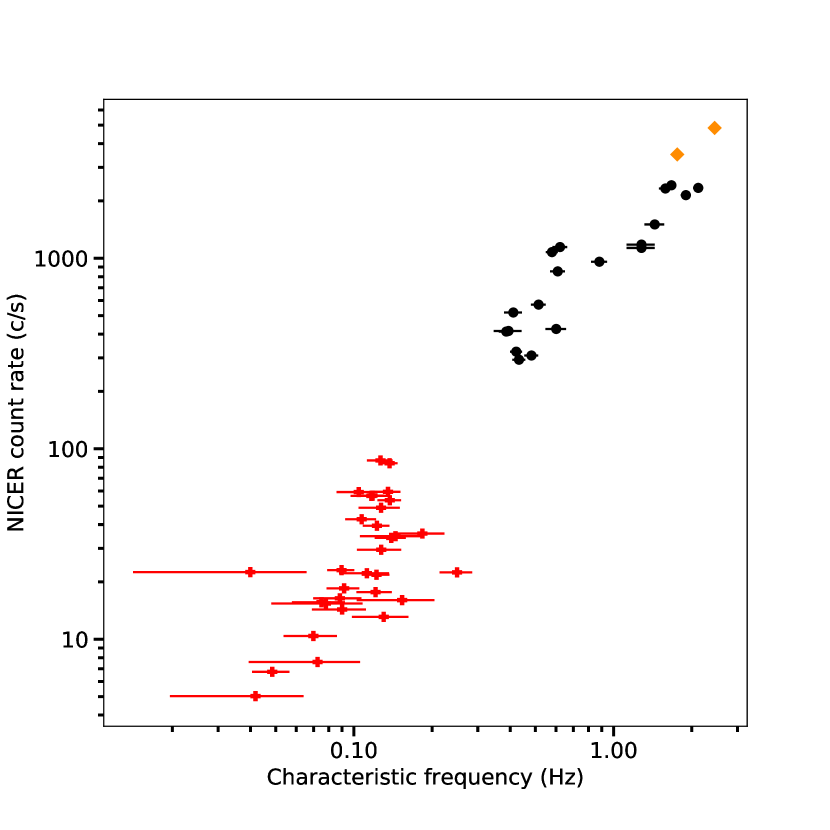
Figure 4 shows three representative examples of the NICER PDS at three different stages of the outburst (marked in the HID and the RID as “PDS1”, “PDS2” and “PDS3”, respectively). The PDS of the observations before MJD 58278 (phase A of the outburst) showed a significant broadband noise component up to 20 Hz and no significant QPOs (e.g. panel (ii) in Figure 4). In phase B, the PDS of all the observations revealed little to no significant variability (e.g. panel (i) in Figure 4). This corresponds to the interval plotted with blue triangles of the bottom panel of Figure 1 and the HID and RID. Then, from MJD 58298 to the end of the outburst (phases C and D), a broadband noise component was present with similar power-spectral shape as that in panel (ii) and panel (iii) in Figure 4. In this period, there was significant broadband noise extending up to a frequency of Hz on MJD 58298; after this date the maximum frequency of this broadband noise component decreased down to hundredths of Hz as the source evolved towards the end of the outburst. Figure 5 shows the evolution of the characteristic frequency of the broadband noise component with intensity. We found that they are correlated.
We searched for QPOs in the PDS of MAXI J1727–203 in the keV and the keV energy bands per observation, per orbit and per region of the HID. We found evidence for QPOs in four cases: at 0.2 Hz (% rms, ObsID 1200220134), 0.5 Hz (% RMS, ObsID 1200220127), 3 Hz (% rms, ObsID 1200220131) and 6 Hz (% rms, ObsID 1200220102). These QPOs are all between 3 and 3.5 significant single trial. When considering the number of trials, these QPOs are significant; however the fractional rms amplitude we measured serve as an indication of our sensitivity to detect QPOs.
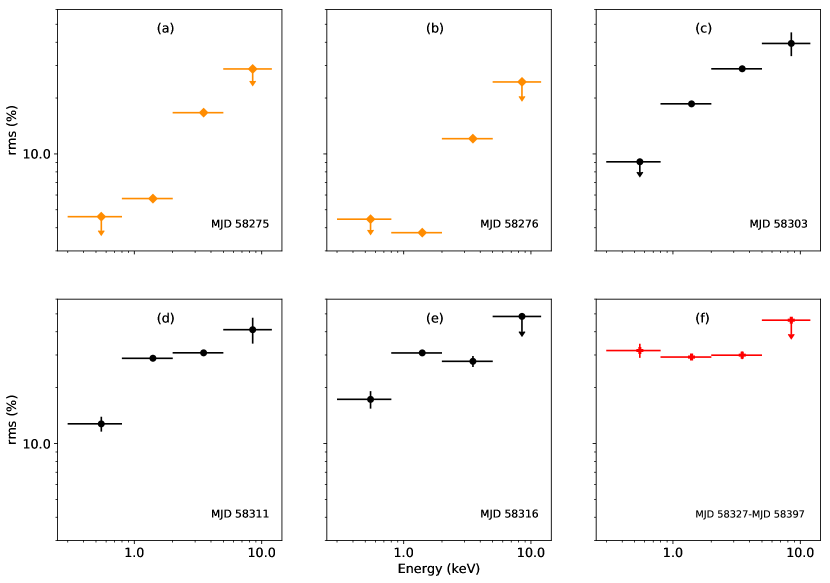
Figure 6 shows the Hz fractional rms spectrum of representative observations through the whole outburst in the keV energy band. The panels are chronologically ordered. The rms spectrum of panel (f) was made combining all the observations from MJD 58327 to MJD 58346 for the same reason. From panel (a) to panel (e) the fractional rms amplitude increased with energy. On panel (f) the fractional rms amplitude remained approximately constant with energy. During phase B of the outburst, the X-ray variability is very low, of the order of 1 % fractional rms. We do not show the data of this phase in Figure 6 as we only obtain upper limits in the different energy bands.
3.3 Spectral properties
We fitted the energy spectra using the model tbabs(nthcomp+diskbb). First, we fitted all the energy spectra separately linking the parameter of nthcomp and of diskbb, and we found that the electron temperature, , in nthcomp was always above the maximum energy of the instrument. Therefore, we fixed at 1000 keV. Besides, we noted that the value of in all the fitted energy spectra was consistent within errors. Therefore, we decided to link this parameter among all the spectra and to repeat the fitting. We obtained an average of cm-2, and a relatively good fit, with a of 1.16, for 11107 degrees of freedom (for a total of 60 spectra). The excess in is given by the fit to some spectra where the 5% of systematic errors below 2 keV were not sufficient to mitigate the effect of instrumental residuals below 2 keV.
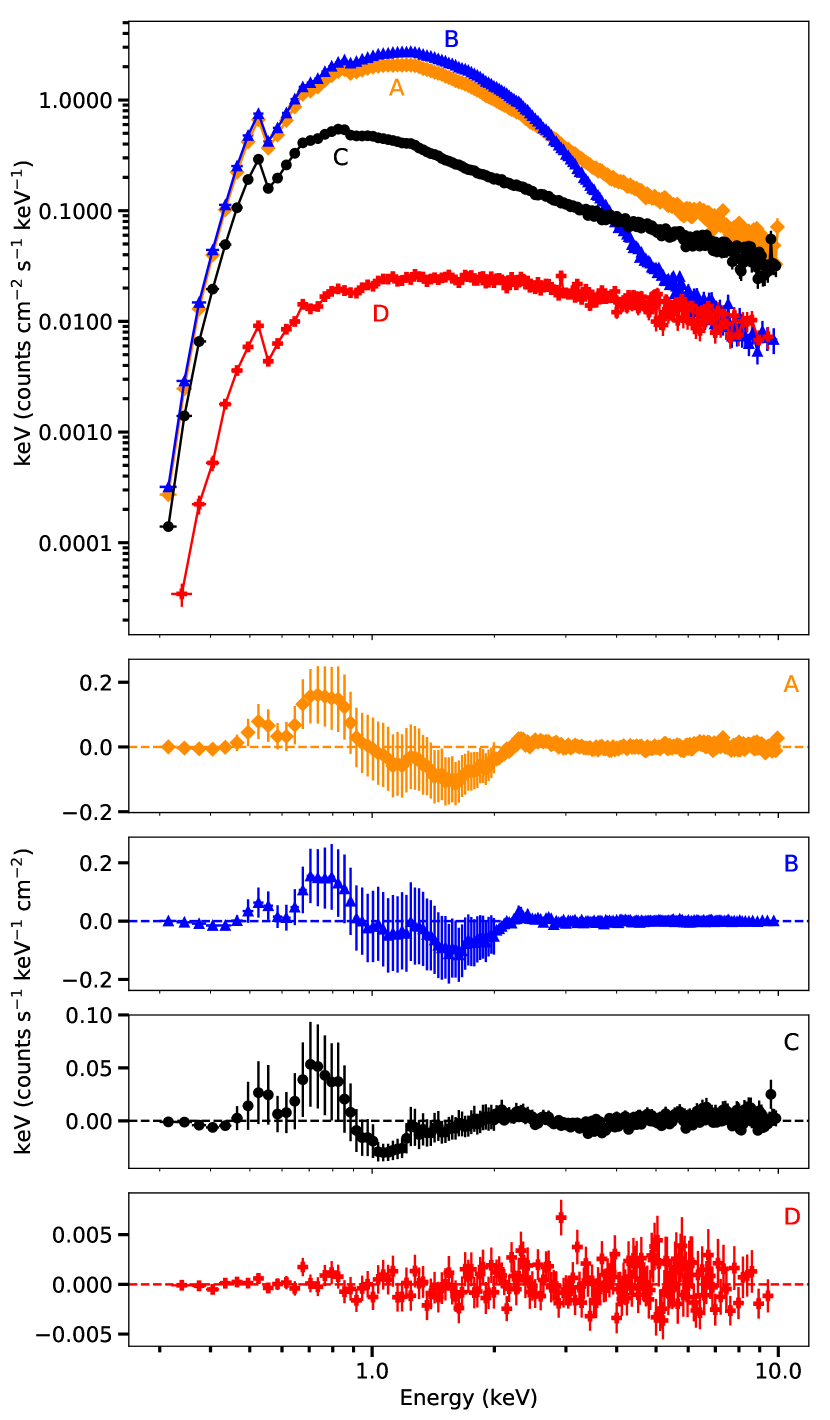
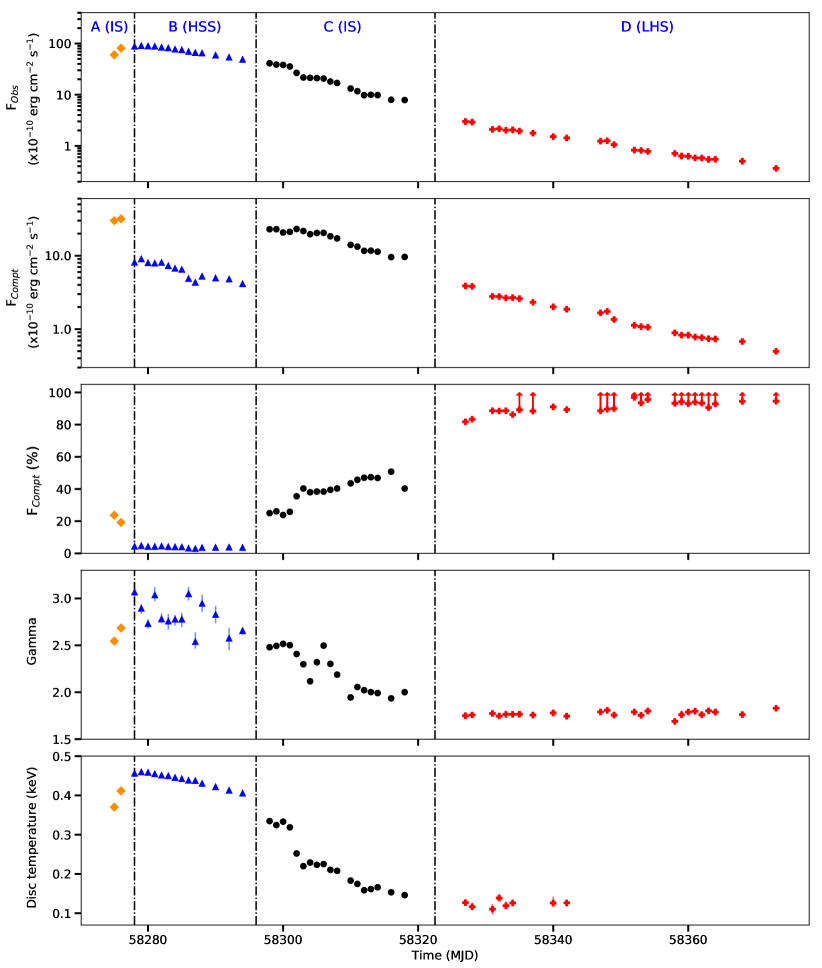
Figure 7 shows four representative spectra of each phase of the outburst. The best-fitting parameters are given in table 1, the evolution of the parameters is shown in Figure 8. In the upper panel of Figure 8 we show the temporal evolution of the total observed flux. Naturally, we observed the same trend as in the upper panel of Figure 1. In the second panel of Figure 8 we show the temporal evolution of the Comptonised component unabsorbed flux in the keV energy band. The third panel shows the contribution of the Comptonised component to the unabsorbed flux in per cent. Finally, in the last two panels, we show the temporal evolution of the photon index, , of the Comptonised component and the inner disc temperature, , of the disc component.
The phases identified in Figure 1 show different spectral behaviour as well, as it is shown in Figure 8. In phase A, the contribution of the Comptonised component was 20%. The photon index ranged from 2.5 to 2.7 and the disc temperature was close to 0.4 keV. The flux of the Comptonised component was 30.0 erg cm-2s-1. The flux of the disc component, on the other hand, ranged from 95 erg cm-2 s-1 to 135 erg cm-2 s-1. This phase corresponds to the regions with orange diamonds in Figures 2 and 3. In phase B the Comptonised flux dropped to 8 erg cm-2 s-1 and decreased until 4 erg cm-2 s-1 on MJD 58294 and, as a consequence, the contribution of the Comptonised component decreased to 4%. The photon index varied from 2.7 to 3.1 and the disc temperature decreased from 0.45 to 0.3 keV. This phase corresponds to the region plotted with blue triangles in the HID and the interval with lower fractional rms amplitude in the bottom panel of Figure 1 and Figure 3 (also plotted with blue triangles on the RID). In phase C the contribution of the Comptonised component was higher than in the previous phase. At the beginning of the phase, the contribution of the Comptonised component was 25% and increased up to 40%. The photon index and the disc temperature decreased from 2.5 to 2.0 and from 0.3 keV to 0.15 keV, respectively. This region corresponds to the black circles in the HID and the RID, where the hardness ratio and the fractional rms amplitude increased again. Finally, in phase D, the contribution of the Comptonised component to the total unabsorbed flux was higher than 80%, with the disc component becoming insignificant (i.e. not statistically required) after MJD 58342. The photon index and the disc temperature remained approximately constant around 1.8 and 0.1 keV, respectively. This phase corresponds to the red filled crosses of the HID and the RID. In these phases, the hardness ratio and the fractional rms amplitude remained constant at their highest values.
Our spectral modelling did not require the addition of a line-component in the in the keV region. The addition of a Gaussian in this energy range led to non-physical results (the Gaussian component became too broad and the nthcomp component changed). If the sigma parameter of the line was fixed to the arbitrary value of 0.3, we found that in some cases there was a significant line. In phases A and C we could find emission lines at 6.5 keV at a significance of no more than and an equivalent width of 0.09 keV. After averaging all data of phase D in the period MJD 58327-58340, we were able to find a emission line at 6.5 keV and an equivalent width of 0.05 keV (in this case the sigma parameter was also fixed to 0.3). These results suggest the potential presence of an emission line; however our results are not conclusive.
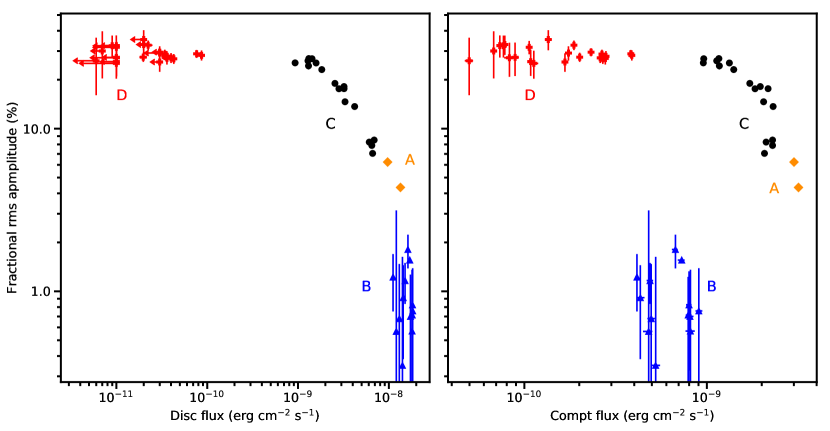
In Figure 9 we plot the fractional rms amplitude vs. the flux of the disc component (left panel) and the fractional rms amplitude vs. the flux of the Comptonised component (right panel). In the left panel of Figure 9, as the disc flux increases, the fractional rms amplitude initially remains constant, phase D, and then decreases as the disc flux increases further, C, A and B. While during phase B the rms amplitude is consistent with being constant, those measurements are consistent with the overall trend of the rms amplitude with disc flux, and extend the anti-correlation shown by the measurements in phases C and A. On the contrary, when we plot the rms amplitude vs. the Comptonised flux (right panel of Figure 9), the relation is not continuous since in those cases phase B is in between phase D and C (see Figure 8).
4 Discussion
In this paper we present a detailed spectral and timing study of the 2018 outburst of MAXI J1727–203. We found that the system showed three different spectral states during this outburst. Fitting the energy spectra of the source with a combination of a soft thermal component and a hard Comptonised component, we found that the photon index ranges between 1.75 and 3.1 and the temperature at the inner disc radius ranged between 0.1 keV and 0.45 keV. From MJD 58342 until the end of the outburst, the disc component is not detected. The power spectra of MAXI J1727–203 showed broadband noise up to 20 Hz, without any significant QPOs. The Hz averaged fractional rms amplitude ( keV) ranged from <1% to 30%. In addition, we found that the fractional rms amplitude increased with energy during most of the outburst, except at the end of the outburst when it remained approximately constant with energy. All these properties allow us to discuss the nature of the compact object of MAXI J1727–203 and to determine the spectral states that characterise the source during the outburst.
Before comparing our results with previous works, it is important to note that NICER observations are sensitive in the keV range, whereas most of our understanding of LMXBs in the last two decades comes from observations done with the Principal Counter Array (PCA) in Rossi X-ray Timing Explorer (RXTE; Bradt et al., 1993), which was more sensitive in the keV range. NICER observations, therefore, will be more affected by the interstellar absorption (which affects mainly the spectrum keV) than those of RXTE, affecting not only the energy spectra but also the colours/hardness estimated from them. Especially important is as well the role of the disc component of the spectra on the amplitude of the variability we detect (Uttley et al., 2011). This is especially important for QPOs, but can also affect the broadband noise. So, for example, the integrated rms amplitudes we report in the previous section are likely underestimated as compared to those we would have measured in the usual RXTE keV energy band-pass. For this work, the difference in energy range probably had an impact on the q-shape loops in the HIDs and RID, as well as the correlations seen in the HRD. In the comparisons below, we at first neglect the energy range difference as we compare our results with those based on RXTE data but then compare with recent results based on NICER observations. Our conclusions are not affected by the difference in the energy range used.
4.1 Nature of the compact object in MAXI J1727–203
The nature of the compact object in MAXI J1727–203 is still under debate. Negoro et al. (2018) suggested that the source is a BH LMXB. However, the dynamical mass of the system has not been estimated yet, and the lack of very clear NS signatures (i.e. X-ray pulsations and thermonuclear X-ray bursts) does not allow to determine with absolute certainty the nature of the compact object. Below we use the evolution of the spectral and timing properties to investigate whether the compact object is a BH or a NS.
The track traced by MAXI J1727–203 in the HID appears to trace part of the q-track, although we missed the rising part of the outburst. This hysteresis loop is typical of BH LMXBs (e.g. Homan & Belloni, 2005; Remillard & McClintock, 2006; Fender et al., 2009, and references therein). However, hysteresis loops have also been observed in NS LMXBs (Körding et al., 2008; Muñoz-Darias et al., 2014).
An evolution in the HRD similar to that of MAXI J1727–203 has been observed in other LMXBs. The track we found for MAXI J1727–203 is similar to the one showed by GX 339–4 (Belloni et al., 2005) and MAXI J1348–630 (Zhang et al. in prep.), both BH LMXBs. Nevertheless, similar tracks were observed in two NS LMXBs (Aql X–1 and 4U 1705–44, Muñoz-Darias et al., 2014).
The track that MAXI J1727–203 traced in the RID is similar to the track traced by the data of the BH candidate GX 339–4 (based on RXTE; Muñoz-Darias et al., 2011) and MAXI J1348–630 (based on NICER data; Zhang et al. in prep). The difference between MAXI J1727–203 and GX 339–4 is that the Adjacent Hard Line of the latter was located between 30% and 40% fractional rms amplitude, whereas in the case of MAXI J1727–203 the Adjacent Hard Line line was located between 20-30% fractional rms. Muñoz-Darias et al. (2014) found that NS LMXBs also show hysteresis in the RID. In particular, these authors found that low accretion rate NS LMXBs traced similar tracks in the RID as those traced by BH LMXBs. The main difference between these low accretion rate NS systems and BH systems is that the track followed during the state transitions is diagonal in NS, while state transitions in BH are usually horizontal, at least for low-inclination systems (Muñoz-Darias et al., 2013). This makes low accretion rate NS brighter during the soft than during the hard or intermediate states in the keV energy band, as opposed to low-inclination BH LMXBs (Muñoz-Darias et al., 2013). In Figures 2 and 3, it is observed that, unlike the transitions found by Muñoz-Darias et al. (2014), the transition from the right to the left part of the diagrams are horizontal, suggesting a BH nature for MAXI J1727–203.
The X-ray timing properties of MAXI J1727–203 do not allow us to determine the nature of the compact object in the system due to the lack of specific BH and NS signatures. The presence of kHz QPOs or X-ray pulsations and type-A, B and C QPOs would have allowed us to identify the compact object as a NS or a BH, respectively. Unfortunately, no kHz QPOs or X-ray pulsations are observed in the PDS of MAXI J1727–203. We found some marginally significant QPOs in the PDS at low frequencies (from 0.2 to 6 Hz); however the data are not sufficient to identify them with the NS or BH QPO counterparts. We can focus on the maximum frequency of the variability of the broadband noise component. MAXI J1727–203 showed broadband noise component that extends up to 20 Hz. Based on the results of Sunyaev & Revnivtsev (2000), this behaviour is more typical of BHs, since the power spectra of BH LMXBs displays a strong decline at frequencies higher than Hz, with no significant variability above Hz (e.g. GX 339–4, GS 1354–644, XTE J1748–288, and 4U 1630–47). NS LMXBs, on the other hand, can show significant variability in the power spectra up to 500-1000 Hz (e.g. 4U1608–522, SAX J1808.4–3658, and 4U0614+091). The fact that MAXI J1727–203 showed variability only up to 20 Hz suggests that the compact object in MAXI J1727–203 is a BH.
The evolution of the energy dependence of the fractional rms amplitude of the broadband noise component at energies keV is consistent with what has been seen in other BH LMXBs in energies above keV (e.g. XTE J1550–564 and XTE J1650–50; Gierliński & Zdziarski, 2005). We found that during most of the outburst, the fractional rms amplitude increased with energy. The only exception is shown in the panel (f) of Figure 6 where the rms remained approximately constant with energy. This panel corresponds to the spectrally hardest observations in Figures 2 and 3 (red crosses of the diagrams). Gierliński & Zdziarski (2005) found that in the hard state of XTE J1550–564 and XTE J1650–50 the rms-spectra remained constant or slightly decreased with energy, while in the intermediate and the soft state the rms spectra increased with energy. Some NS show a similar behaviour (e.g. XTE J1701-462; Bu et al., 2015). The rms spectra of broadband noise components of NS increase with energy in some cases (Bu et al., 2015; Bult, 2017, studying XTE J1701–462 and MAXI J0911–655, respectively), as MAXI J1727–203 did during most of the outburst. Unfortunately, neither of those works present the evolution of the rms spectra during a whole outburst, so at the moment we cannot compare the evolution of these sources and that of MAXI J1727–203.
The evolution of the spectral parameters of MAXI J1727–203 is similar to what has been observed in other BH LMXBs and NS LMXBs. The photon index of MAXI J1727–203 ranged from 1.75 to 3.1. This evolution is similar to two of the most studied BH LMXBs, Cyg X–1 (photon index from 1.5 to 2.7, Titarchuk, 1994) and GX 339–4 (photon index from 1.5 to 2.9, Plant et al., 2014). We also compared the photon index of MAXI J1727–203 with the photon index of two NS LMXBs: 4U 1636-53 and MXB 1658–298 during its 2015-2017 outburst. In the case of 4U 1636-53, the photon index ranged from 1.3 to 2.5 (Zhang et al., 2017). This range is similar to the photon index range of MAXI J1727–203. In the case of MXB 1658–298, the photon index ranged from 1.7 to 2.4 (Sharma et al., 2018). Although the photon index in NS LMXBs might show lower values than for BH LMXBs (something that would have to be tested studying a much larger sample), this potential difference would argue that MAXI J1727–203 is a BH candidate. In terms of the inner disc temperature, MAXI J1727–203 showed a lower temperature than other BH LMXBs. The disc temperature of GX 339–4 ranged from 0.6 to 0.9 keV (Plant et al., 2014) and the temperature of Cyg X–1 ranged between 0.5 keV and 0.6 keV (Shaposhnikov & Titarchuk, 2006). The temperature of 4U 1636-53 ranged from 0.3 to 0.8 keV in the best-fitting results (Zhang et al., 2017) and the disc temperature of MXB 1658–298 ranged from 0.6 to 0.9 keV (Sharma et al., 2018). The disc temperature of MAXI J1727–203 was lower than these 4 systems.
A potential explanation for a lower temperature in MAXI J1727–203 than in other sources could be related to the mass of the compact object. Assuming that the accretion disc is at the innermost stable circular orbit (ISCO), the temperature at the inner disc radius is proportional to , where is the mass accretion rate and is the mass of the compact object (Frank et al., 2002). According to Muñoz-Darias et al. (2008), for GX 339–4. We take the temperature of GX 339–4 in the soft state (0.79 keV) from Plant et al. (2014), and we also take the disc temperature of the softest observation in the HID of MAXI J1727–203 (0.45 keV). From that, if we assume that is the same for two sources in the same spectral state, we estimate a lower limit for the mass of MAXI J1727–203 of 19 . Therefore, the high mass of the compact object can explain the low temperature of the inner disc. Alternatively, as suggested by Gou et al. (2011), the low temperature at the inner disc radius can be a consequence of a low inclination of the accretion disc with respect to the line of sight.
We can repeat this analysis to estimate the mass of MAXI J1727–203 with the NS Aql X–1. For this, we took the temperature of Aql X–1 in the soft state of its 2007 outburst (0.66 keV, Raichur et al., 2011). Considering a mass of for the NS in Aql X–1, we obtained a mass of for the compact object in MAXI J1727–203. If we consider a higher mass for Aql X–1, the mass of MAXI J1727–203 also increases. Considering the latter, this mass estimates suggest that the compact object in MAXI J1727–203 is massive NS or a low-mass BH.
Based on all the above comparisons, although we cannot unambiguously identify the nature of the compact object in MAXI J1727–203, the evolution in the HID, RID and RHD, and the temperature at the inner radius of the accretion disc during the softest observations, suggest that it is a BH.
4.2 Anticorrelation between the fractional rms amplitude and the flux of the disc component
Figure 9 shows that the relation between the fractional rms amplitude and the disc flux is continuous and that both quantities are anti-correlated during phases A and C (orange diamonds and black circles) of the outburst. While in phases B and D (blue triangles and red crosses) the rms amplitude is consistent with being independent of the disc flux, those measurements extend the relation seen in phases A and C to low (phase D) and high (phase B) values of the disc flux.
The simplest interpretation of this behaviour is that the variability is produced by the Comptonised component, the disc emission is not variable and, as the relative contribution of the disc to the total emission increases, the variability decreases. If this is the case, the intrinsic variability would be produced by the corona (e.g., for QPOs Lee & Miller, 1998; Lee et al., 2001; Kumar & Misra, 2014). Karpouzas et al. (2020) explain this for the kilohertz QPOs in neutron-star LMXBs, and Zhang et al. (2020) for the type C QPOs in the black-hole candidate GRS 1915+105, but the same mechanism could apply for the broadband component that we discuss here, but the observed trend would be driven by the disc. A similar argument was discussed by Méndez et al. (2001) for the dependence of the rms amplitude of the kilohertz QPOs in the neutron-star LMXBs 4U 1728–34, 4U 1608–52 and Aql X–1.
4.3 Spectral states of MAXI J1727–203
Assuming that the source is a BH LMXB, we can identify its spectral states from its spectral and timing properties. Here we describe the different spectral states found for MAXI J1727–203:
-
•
Low/hard state (LHS): From MJD 58327 to MJD 58397. This period corresponds with phase D of the outburst, marked with red filled crosses in Figures 1, 2, 3, 8 and 9. In the HID the source was in the right vertical branch, with hardness values close to 0.1. The fractional rms amplitude in the LHS state was close to 30% and followed the AHL in the RID, supporting the LHS classification state based on the results of Muñoz-Darias et al. (2011). The fractional rms amplitude was also approximately constant with energy (panel with red filled crosses in Figure 6). The PDS was dominated by a broadband noise component (panel (iii) in Figure 4). In terms of spectral properties, the contribution of the Comptonised component was >80% in this state. At the end of the outburst, the disc component is not significant. The fractional rms amplitude is not correlated with the flux of the Comptonised component. This is because the fractional rms remains approximately constant with energy. The photon index of the Comptonised component and the inner disc temperature remained approximately constant at 1.8 and 0.1 keV, respectively.
-
•
Intermediate states (IS): From MJD 58274 to MJD 58278 and from MJD 58298 to MJD 58327. These periods corresponds to phases A and C of the outburst, respectively, which are marked with orange diamonds (phase A) and black circles (phase C) in Figures 1, 2, 3, 8 and 9. In the HID these correspond to the horizontal branches with hardness values from 0.02 to 0.1. In these periods, the fractional rms amplitude ranged from 5% to 30% and the source evolved to the top left part of the RID in the first epoch (MJD 58274–MJD 58278) and to the Adjacent Hard Line in the second epoch (MJD 58298–MJD 58327), as can be seen in Figure 3. The fractional rms amplitude increased with energy (panels with black circles and orange diamonds in Figure 6), and the PDS was dominated by a broadband noise component (panel (ii) in Figure 4). No significant QPOs are detected during this phase. The characteristic frequency also increases with the intensity. The contribution of the Comptonised component ranged from 20% to 50%. The fractional rms amplitude and the flux of the Comptonised flux are anti-correlated, suggesting that the change of variability is driven by changes in the flux of the Comptonised component. The photon index of the Comptonised component in this state ranged from 2.0 to 2.7 and the inner disc temperature decreased from 0.4 keV to 0.15 keV.
-
•
High/soft state (HSS): From MJD 58278 to MJD 58298. This period corresponds to phase B of the outburst, plotted with blue triangles in Figures 1, 2, 3, 8 and 9. In the HID the hardness ratio was approximately constant close to 0.005. The fractional rms amplitude was 1%, which can be observed in the top left part of the RID, where the source evolved around the 1% fractional rms line. The maximum frequency also increases with energy. The rms spectrum increases with energy (blue triangles in Figure 6). The contribution of the Comptonised component was less than 5%, the photon index of the Comptonised component ranged from 2.5 to 3.0 and the temperature of the inner disc decreased from 0.45 keV to 0.3 keV. The rms-flux correlation was flat with some scatter (Figure 9).
Acknowledgements
This work is based on observations made by the NICER X-ray mission supported by NASA. This research has made use of data and software provided by the High Energy Astrophysics Science Archive Research Center (HEASARC), a service of the Astrophysics Science Division at NASA/GSFC and the High Energy Astrophysics Division of the Smithsonian Astrophysical Observatory. This research has made use of the MAXI light curve provided by RIKEN, JAXA, and the MAXI team. This research has also made use of Swift/BAT transient monitor results provided by the Swift/BAT team. KA acknowledges support from a UGC-UKIERI Phase 3 Thematic Partnership (UGC-UKIERI-2017-18-006; PI: P. Gandhi). KA especially acknowledges Dr. Keith Arnaud for his help with the X-ray tool XSPEC. D.A. and D.J.K.B. acknowledge support from the Royal Society. V.A.C. acknowledges support from the Royal Society International Exchanges "The first step for High-Energy Astrophysics relations between Argentina and UK" and from the Spanish Ministerio de Ciencia e Innovación under grant AYA2017-83216-P. LZ and AC acknowledges support from the Royal Society Newton International Fellowship. R.M.L. acknowledges the support of NASA through Hubble Fellowship Program grant HST-HF2-51440.001.
Data availability
The data underlying this article are publicly available in the High Energy Astrophysics Science Archive Research Center (HEASARC) at
The data underlying this article are publicly available in the High Energy Astrophysics Science Archive Research Center (HEASARC) at https://heasarc.gsfc.nasa.gov/db-perl/W3Browse/w3browse.pl
References
- Arnaud (1996) Arnaud K. A., 1996, in Jacoby G. H., Barnes J., eds, Astronomical Society of the Pacific Conference Series Vol. 101, Astronomical Data Analysis Software and Systems V. p. 17
- Belloni (2010) Belloni T. M., 2010, in Belloni T., ed., Vol. 794, The Jet Paradigm, Lecture Notes in Physics. ISBN 978-3-540-76936-1. Springer-Verlag Berlin Heidelberg. p. 53, doi:10.1007/978-3-540-76937-8_3
- Belloni & Stella (2014) Belloni T. M., Stella L., 2014, Space Sci. Rev., 183, 43
- Belloni et al. (2002) Belloni T., Psaltis D., van der Klis M., 2002, ApJ, 572, 392
- Belloni et al. (2005) Belloni T., Homan J., Casella P., van der Klis M., Nespoli E., Lewin W. H. G., Miller J. M., Méndez M., 2005, A&A, 440, 207
- Belloni et al. (2006) Belloni T., et al., 2006, MNRAS, 367, 1113
- Belloni et al. (2011) Belloni T. M., Motta S. E., Muñoz-Darias T., 2011, Bulletin of the Astronomical Society of India, 39, 409
- Bradt et al. (1993) Bradt H. V., Rothschild R. E., Swank J. H., 1993, A&AS, 97, 355
- Bu et al. (2015) Bu Q.-c., Chen L., Li Z.-s., Qu J.-l., Belloni T. M., Zhang L., 2015, ApJ, 799, 2
- Bult (2017) Bult P., 2017, ApJ, 837, 61
- Burke et al. (2017) Burke M. J., Gilfanov M., Sunyaev R., 2017, MNRAS, 466, 194
- Capitanio et al. (2009) Capitanio F., Belloni T., Del Santo M., Ubertini P., 2009, MNRAS, 398, 1194
- Casella et al. (2004) Casella P., Belloni T., Homan J., Stella L., 2004, A&A, 426, 587
- Di Salvo et al. (2000) Di Salvo T., et al., 2000, ApJ, 544, L119
- Done & Gierliński (2003) Done C., Gierliński M., 2003, MNRAS, 342, 1041
- Done et al. (2007) Done C., Gierliński M., Kubota A., 2007, Astronomy and Astrophysics Review, 15, 1
- Dunn et al. (2010) Dunn R. J. H., Fender R. P., Körding E. G., Belloni T., Cabanac C., 2010, MNRAS, 403, 61
- Fender et al. (2009) Fender R. P., Homan J., Belloni T. M., 2009, MNRAS, 396, 1370
- Frank et al. (2002) Frank J., King A., Raine D. J., 2002, Accretion Power in Astrophysics: Third Edition. Cambridge, UK: Cambridge University Press
- Gao et al. (2017) Gao H. Q., et al., 2017, MNRAS, 466, 564
- Gehrels et al. (2004) Gehrels N., et al., 2004, ApJ, 611, 1005
- Gendreau et al. (2012) Gendreau K. C., Arzoumanian Z., Okajima T., 2012, in Space Telescopes and Instrumentation 2012: Ultraviolet to Gamma Ray. p. 844313, doi:10.1117/12.926396
- Gierliński & Done (2002) Gierliński M., Done C., 2002, MNRAS, 337, 1373
- Gierliński & Zdziarski (2005) Gierliński M., Zdziarski A. A., 2005, MNRAS, 363, 1349
- Gou et al. (2011) Gou L., et al., 2011, ApJ, 742, 85
- Hasinger & van der Klis (1989) Hasinger G., van der Klis M., 1989, A&A, 225, 79
- Homan & Belloni (2005) Homan J., Belloni T., 2005, Ap&SS, 300, 107
- Homan et al. (2001) Homan J., Wijnands R., van der Klis M., Belloni T., van Paradijs J., Klein-Wolt M., Fender R., Méndez M., 2001, ApJS, 132, 377
- Karpouzas et al. (2020) Karpouzas K., Méndez M., Ribeiro E. r. M., Altamirano D., Blaes O., García F., 2020, MNRAS, 492, 1399
- Kennea et al. (2018) Kennea J. A., Bahramian A., Beardmore A. P., 2018, The Astronomer’s Telegram, 11697
- Klein-Wolt & van der Klis (2008) Klein-Wolt M., van der Klis M., 2008, ApJ, 675, 1407
- Körding et al. (2008) Körding E., Rupen M., Knigge C., Fender R., Dhawan V., Templeton M., Muxlow T., 2008, Science, 320, 1318
- Kumar & Misra (2014) Kumar N., Misra R., 2014, MNRAS, 445, 2818
- Leahy et al. (1983) Leahy D. A., Darbro W., Elsner R. F., Weisskopf M. C., Sutherland P. G., Kahn S., Grindlay J. E., 1983, ApJ, 266, 160
- Lee & Miller (1998) Lee H. C., Miller G. S., 1998, MNRAS, 299, 479
- Lee et al. (2001) Lee H. C., Misra R., Taam R. E., 2001, ApJ, 549, L229
- Lin et al. (2007) Lin D., Remillard R. A., Homan J., 2007, ApJ, 667, 1073
- Ludlam et al. (2018a) Ludlam R. M., et al., 2018a, ApJ, 858, L5
- Ludlam et al. (2018b) Ludlam R. M., et al., 2018b, The Astronomer’s Telegram, 11689
- Méndez & van der Klis (1997) Méndez M., van der Klis M., 1997, ApJ, 479, 926
- Méndez et al. (2001) Méndez M., van der Klis M., Ford E. C., 2001, ApJ, 561, 1016
- Miller et al. (2018) Miller J. M., et al., 2018, ApJ, 860, L28
- Mitsuda et al. (1984) Mitsuda K., et al., 1984, PASJ, 36, 741
- Miyamoto et al. (1995) Miyamoto S., Kitamoto S., Hayashida K., Egoshi W., 1995, ApJ, 442, L13
- Motta (2016) Motta S. E., 2016, Astronomische Nachrichten, 337, 398
- Motta et al. (2012) Motta S., Homan J., Muñoz Darias T., Casella P., Belloni T. M., Hiemstra B., Méndez M., 2012, MNRAS, 427, 595
- Muñoz-Darias et al. (2008) Muñoz-Darias T., Casares J., Martínez-Pais I. G., 2008, MNRAS, 385, 2205
- Muñoz-Darias et al. (2011) Muñoz-Darias T., Motta S., Belloni T. M., 2011, MNRAS, 410, 679
- Muñoz-Darias et al. (2013) Muñoz-Darias T., Coriat M., Plant D. S., Ponti G., Fender R. P., Dunn R. J. H., 2013, MNRAS, 432, 1330
- Muñoz-Darias et al. (2014) Muñoz-Darias T., Fender R. P., Motta S. E., Belloni T. M., 2014, MNRAS, 443, 3270
- Negoro et al. (2018) Negoro H., et al., 2018, The Astronomer’s Telegram, 11696
- Plant et al. (2014) Plant D. S., Fender R. P., Ponti G., Muñoz-Darias T., Coriat M., 2014, MNRAS, 442, 1767
- Raichur et al. (2011) Raichur H., Misra R., Dewangan G., 2011, MNRAS, 416, 637
- Remillard & McClintock (2006) Remillard R. A., McClintock J. E., 2006, Annual Review of Astronomy and Astrophysics, 44, 49
- Shakura & Sunyaev (1973) Shakura N. I., Sunyaev R. A., 1973, in Bradt H., Giacconi R., eds, IAU Symposium Vol. 55, X- and Gamma-Ray Astronomy. p. 155
- Shaposhnikov & Titarchuk (2006) Shaposhnikov N., Titarchuk L., 2006, ApJ, 643, 1098
- Sharma et al. (2018) Sharma R., Jaleel A., Jain C., Pand ey J. C., Paul B., Dutta A., 2018, MNRAS, 481, 5560
- Sunyaev & Revnivtsev (2000) Sunyaev R., Revnivtsev M., 2000, A&A, 358, 617
- Sunyaev & Titarchuk (1980) Sunyaev R. A., Titarchuk L. G., 1980, A&A, 86, 121
- Sunyaev & Truemper (1979) Sunyaev R. A., Truemper J., 1979, Nature, 279, 506
- Tanaka (1989) Tanaka Y., 1989, in Hunt J., Battrick B., eds, ESA Special Publication Vol. 1, Two Topics in X-Ray Astronomy, Volume 1: X Ray Binaries. Volume 2: AGN and the X Ray Background. p. 3
- Titarchuk (1994) Titarchuk L., 1994, ApJ, 434, 570
- Tomsick et al. (2018) Tomsick J., Shaw A., Garcia J., Walton D., Fuerst F., Miller J., Parker M., Xu Y., 2018, The Astronomer’s Telegram, 11881
- Uttley & Klein-Wolt (2015) Uttley P., Klein-Wolt M., 2015, MNRAS, 451, 475
- Uttley et al. (2011) Uttley P., Wilkinson T., Cassatella P., Wilms J., Pottschmidt K., Hanke M., Böck M., 2011, MNRAS, 414, L60
- Verner et al. (1996) Verner D. A., Ferland G. J., Korista K. T., Yakovlev D. G., 1996, ApJ, 465, 487
- Wang-Ji et al. (2018) Wang-Ji J., et al., 2018, ApJ, 855, 61
- Wijnands et al. (1999) Wijnands R., Homan J., van der Klis M., 1999, ApJ, 526, L33
- Wilms et al. (2000) Wilms J., Allen A., McCray R., 2000, ApJ, 542, 914
- Yoneyama et al. (2018) Yoneyama T., et al., 2018, The Astronomer’s Telegram, 11683
- Zdziarski & Gierliński (2004) Zdziarski A. A., Gierliński M., 2004, Progress of Theoretical Physics Supplement, 155, 99
- Zdziarski et al. (1996) Zdziarski A. A., Johnson W. N., Magdziarz P., 1996, MNRAS, 283, 193
- Zhang et al. (2017) Zhang G., Méndez M., Sanna A., Ribeiro E. M., Gelfand J. D., 2017, MNRAS, 465, 5003
- Zhang et al. (2020) Zhang L., et al., 2020, MNRAS,
- Życki et al. (1999) Życki P. T., Done C., Smith D. A., 1999, MNRAS, 309, 561
- van Doesburgh et al. (2018) van Doesburgh M., van der Klis M., Morsink S. M., 2018, MNRAS, 479, 426
- van der Klis (1989) van der Klis M., 1989, ARA&A, 27, 517
- van der Klis (1994) van der Klis M., 1994, ApJS, 92, 511
- van der Klis (1995) van der Klis M., 1995, in Alpar M. A., Kiziloglu U., van Paradijs J., eds, NATO Advanced Science Institutes (ASI) Series C Vol. 450, NATO Advanced Science Institutes (ASI) Series C. p. 301
- van der Klis (2000) van der Klis M., 2000, ARA&A, 38, 717
- van der Klis (2006) van der Klis M., 2006, in In: Compact stellar X-ray sources. Edited by Walter Lewin & Michiel van der Klis. Cambridge Astrophysics Series, No. 39. Cambridge, UK: Cambridge University Press, ISBN 978-0-521-82659-4, ISBN 0-521-82659-4, DOI: 10.2277/0521826594, 2006, p. 39 - 112. pp 39–112
Appendix A Spectral fitting parameters
| MJD | nthcomp norm. | diskbb norm. | Comptonised flux | Disc flux | Unabsorbed flux | Total absorbed flux | Phase | ||
|---|---|---|---|---|---|---|---|---|---|
| NICER | () | (keV) | [ km2 (10 kpc)-2] | ( erg cm-2 s-1) | ( erg cm-2 s-1) | ( erg cm-2 s-1) | ( erg cm-2 s-1) | outburst | |
| 58275 | 2.53 | 50.9 | 0.370 | 2.99 | 30.0 | 96.7 | 126.8 | 60.2 | A |
| 58276 | 2.68 | 50.5 | 0.412 | 2.62 | 31.8 | 134.0 | 166 | 81.3 | A |
| 58278 | 3.1 | 12.7 | 0.456 | 2.28 | 8.1 | 179.8 | 187.9 | 88.00 | B |
| 58279 | 2.89 | 13.3 | 0.459 | 2.24 | 9.0 | 183.0 | 192.0 | 90.7 | B |
| 58280 | 2.73 | 11.1 | 0.458 | 2.26 | 8.0 | 181.7 | 189.8 | 89.3 | B |
| 58281 | 3.04 | 12.33 | 0.455 | 2.32 | 7.9 | 181.0 | 188.4 | 88.0 | B |
| 58282 | 2.78 | 11.71 | 0.451 | 2.29 | 8.1 | 173.0 | 181.0 | 84.2 | B |
| 58283 | 2.76 | 10.5 | 0.449 | 2.28 | 7.3 | 169.6 | 176.9 | 81.9 | B |
| 58284 | 2.78 | 9.90 | 0.445 | 2.27 | 6.7 | 161.8 | 169.0 | 77.3 | B |
| 58285 | 2.78 | 9.67 | 0.442 | 2.28 | 6.5 | 158.3 | 164.8 | 75.1 | B |
| 58286 | 3.05 | 8.06 | 0.438 | 2.27 | 4.9 | 150.5 | 155.4 | 69.8 | B |
| 58287 | 2.54 | 5.90 | 0.437 | 2.17 | 4.3 | 143.5 | 147.8 | 66.3 | B |
| 58288 | 2.95 | 8.57 | 0.430 | 2.28 | 5.2 | 140.8 | 146.0 | 64.9 | B |
| 58290 | 2.83 | 8.00 | 0.421 | 2.30 | 5.0 | 130.2 | 135.1 | 59.1 | B |
| 58292 | 2.6 | 7.2 | 0.413 | 2.34 | 4.8 | 121 | 125 | 53.9 | B |
| 58294 | 2.66 | 6.55 | 0.4053 | 2.32 | 4.14 | 111.0 | 115.2 | 48.7 | B |
| 58298 | 2.48 | 42.1 | 0.330 | 3.29 | 22.9 | 68.8 | 91.7 | 41.1 | C |
| 58299 | 2.49 | 43.7 | 0.324 | 3.55 | 22.9 | 64.8 | 87.8 | 38.8 | C |
| 58300 | 2.52 | 38.9 | 0.333 | 3.23 | 20.7 | 66.2 | 86.9 | 38.2 | C |
| 58301 | 2.50 | 41.1 | 0.319 | 3.59 | 21.1 | 60.8 | 81.9 | 35.60 | C |
| 58302 | 2.41 | 51.2 | 0.252 | 7.1 | 23.1 | 41.9 | 65.1 | 26.7 | C |
| 58303 | 2.30 | 48.3 | 0.220 | 10.1 | 21.7 | 32.1 | 53.7 | 21.70 | C |
| 58304 | 2.12 | 37.9 | 0.229 | 8.3 | 19.6 | 32.0 | 51.7 | 21.40 | C |
| 58305 | 2.32 | 45.7 | 0.223 | 9.6 | 20.4 | 32.7 | 53.1 | 21.1 | C |
| 58306 | 2.50 | 50.6 | 0.225 | 9.3 | 20.5 | 32.9 | 53.4 | 20.70 | C |
| 58307 | 2.30 | 41.7 | 0.210 | 10.9 | 18.4 | 28.2 | 46.6 | 18.10 | C |
| 58308 | 2.188 | 36.4 | 0.2079 | 10.4 | 17.20 | 25.5 | 42.7 | 17.00 | C |
| 58310 | 1.944 | 25.5 | 0.183 | 13.7 | 14.04 | 18.2 | 32.3 | 13.2 | C |
| 58311 | 2.05 | 26.5 | 0.175 | 14.9 | 13.29 | 15.8 | 29.1 | 11.70 | C |
| 58312 | 2.02 | 22.8 | 0.159 | 20 | 11.64 | 13.1 | 24.8 | 9.79 | C |
| 58313 | 2.00 | 22.6 | 0.161 | 18.0 | 11.7 | 13.0 | 24.7 | 9.96 | C |
| 58314 | 1.99 | 21.64 | 0.166 | 15.5 | 11.33 | 12.9 | 24.2 | 9.82 | C |
| 58316 | 1.935 | 17.53 | 0.153 | 17 | 9.57 | 9.3 | 18.9 | 7.97 | C |
| 58318 | 2.001 | 17.50 | 0.146 | 16 | 9.6 | 14 | 24 | 7.87 | C |
| 58327 | 1.75 | 6.03 | 0.127 | 4 | 3.88 | 0.87 | 4.75 | 3.00 | D |
| 58328 | 1.76 | 5.97 | 0.117 | 6 | 3.83 | 0.77 | 4.59 | 2.92 | D |
| 58331 | 1.77 | 4.42 | 0.11 | 4 | 2.80 | 0.36 | 3.16 | 2.10 | D |
| 58332 | 1.75 | 4.31 | 0.139 | 1.1 | 2.78 | 0.36 | 3.14 | 2.16 | D |
| 58333 | 1.77 | 4.52 | 0.12 | 2.3 | 2.66 | 0.34 | 3.00 | 2.020 | D |
| 58334 | 1.77 | 4.24 | 0.126 | 2.1 | 2.69 | 0.43 | 3.12 | 2.06 | D |
| 58335 | 1.77 | 4.08 | – | <5 | 2.60 | <0.4 | 2.92 | 1.95 | D |
| 58337 | 1.76 | 3.63 | – | <3 | 2.32 | <0.3 | 2.62 | 1.780 | D |
| 58340 | 1.779 | 3.41 | 0.13 | 0.9 | 2.01 | 0.19 | 2.20 | 1.520 | D |
| 58342 | 1.74 | 2.89 | 0.126 | 1.1 | 1.87 | 0.22 | 2.09 | 1.43 | D |
| 58347 | 1.79 | 2.79 | – | <5 | 1.67 | <0.3 | 1.88 | 1.24 | D |
| 58348 | 1.808 | 2.79 | – | <19 | 1.74 | <0.3 | 1.95 | 1.260 | D |
| 58349 | 1.76 | 2.09 | - | <0.6 | 1.35 | <0.2 | 1.50 | 1.06 | D |
| MJD | nthcomp norm. | diskbb norm. | Compt. flux | Disc flux | Unabsorbed flux | Total absorbed flux | Phase | ||
|---|---|---|---|---|---|---|---|---|---|
| () | (keV) | [ km2 (10 kpc)-2] | ( erg cm-2 s-1) | ( erg cm-2 s-1) | ( erg cm-2 s-1) | ( erg cm-2 s-1) | outburst | ||
| 58352 | 1.79 | 1.79 | – | <2 | 1.13 | <0.1 | 1.16 | 0.830 | D |
| 58353 | 1.75 | 1.68 | – | <2 | 1.08 | <0.1 | 1.16 | 0.815 | D |
| 58354 | 1.799 | 1.71 | – | <3 | 1.06 | <0.1 | 1.11 | 0.779 | D |
| 58358 | 1.69 | 1.29 | – | <2 | 0.89 | <0.1 | 0.95 | 0.710 | D |
| 58359 | 1.76 | 1.30 | – | <0.6 | 0.83 | <0.1 | 0.88 | 0.64 | D |
| 58360 | 1.79 | 1.33 | – | <0.5 | 0.83 | <0.1 | 0.89 | 0.627 | D |
| 58361 | 1.79 | 1.26 | – | <0.8 | 0.78 | <0.02 | 0.83 | 0.582 | D |
| 58362 | 1.76 | 1.24 | – | <0.7 | 0.77 | <0.09 | 0.82 | 0.579 | D |
| 58363 | 1.80 | 1.19 | – | <2 | 0.74 | <0.08 | 0.82 | 0.54 | D |
| 58364 | 1.79 | 1.17 | – | <1 | 0.73 | <0.1 | 0.79 | 0.549 | D |
| 58368 | 1.76 | 1.04 | – | <4 | 0.68 | <0.07 | 0.72 | 0.500 | D |
| 58373 | 1.83 | 0.841 | – | <0.4 | 0.49 | <0.06 | 0.53 | 0.363 | D |
| 58374 | 1.86 | 0.78 | – | <0.3 | 0.46 | <0.08 | 0.50 | 0.345 | D |