Black Hole Accretion Correlates with Star Formation Rate and Star Formation Efficiency in Nearby Luminous Type 1 Active Galaxies
Abstract
We investigate the relationship between black hole accretion and star formation in a sample of 453 type 1 active galactic nuclei (AGNs). We use available CO observations to demonstrate that the combination of nebular dust extinction and metallicity provides reliable estimates of the molecular gas mass even for the host galaxies of type 1 AGNs. Consistent with other similar but significantly smaller samples, we reaffirm the notion that powerful AGNs have comparable gas content as nearby star-forming galaxies and that AGN feedback does not deplete the host of cold gas instantaneously. We demonstrate that while the strong correlation between star formation rate and black hole accretion rate is in part driven by the mutual dependence of these parameters on molecular gas mass, the star formation rate and black hole accretion rate are still weakly correlated after removing the dependence of star formation rate on molecular gas mass. This, together with a positive correlation between star formation efficiency and black hole accretion rate, may be interpreted as evidence for positive AGN feedback.
1 Introduction
Active galactic nuclei (AGNs) play a significant role in galaxy evolution by changing the ionization structure and injecting energy and momentum into the interstellar medium. The fast outflows produced by AGNs are expected to heat and sweep out most of the gas in their host galaxies, inhibiting star formation and preventing the galaxies from overgrowing, in what is often dubbed “negative” feedback (see Fabian, 2012, for a review). On the other hand, the compression of gas in the interstellar medium (King, 2005; Silk, 2013) and direct formation of stars inside outflows (Maiolino et al., 2017; Wang & Loeb, 2018; Gallagher et al., 2019) could enhance the star formation rate (SFR) through “positive” feedback. However, negative and positive feedback do not necessarily act against each other. They sometimes occur simultaneously in the same galaxy (Silk, 2013; Cresci et al., 2015a). The complex interplay between AGNs and their large-scale environment lies at the heart of the coevolution of supermassive black holes (BHs) and their host galaxies (Richstone et al., 1998; Kormendy & Ho, 2013; Heckman & Best, 2014).
Much effort has been invested in elucidating the link between the SFR of AGN host galaxies and the luminosity of the AGN, or, equivalently, the accretion rate of the central BH (). Some studies report that SFR strongly correlates with (e.g., Mullaney et al., 2012; Chen et al., 2013; Harris et al., 2016; Lanzuisi et al., 2017; Zhuang & Ho, 2020), while others find a shallower correlation, or none at all (e.g., Azadi et al., 2015; Stanley et al., 2015, 2017; Shimizu et al., 2017). The relation beween SFR and may also depend on luminosity and redshift (e.g., Lutz et al., 2010; Rosario et al., 2012; Santini et al., 2012). Many factors may contribute to these contradictory results, including sample size, sample selection, and the methods used to calculate the SFR and to bin the data (Harrison, 2017).
Measuring accurate SFRs in AGN host galaxies presents a major observational challenge. The emission from rapidly accreting BHs can easily dominate the observed spectral energy distribution and contaminate traditional SFR diagnostics normally employed in star-forming galaxies. Thermal dust emission from the obscuring torus and the narrow-line region can contribute significantly to the infrared (IR) continuum (e.g., Groves et al., 2006; Shimizu et al., 2017; Shangguan et al., 2018; Zhuang et al., 2018), which is otherwise widely used to measure the SFR of inactive galaxies (Kennicutt, 1998a). While polycyclic aromatic hydrocarbons closely trace ultraviolet photons from young stars (Shipley et al., 2016; Xie & Ho, 2019), they can be destroyed by the more intense, harder radiation field of AGNs (Voit, 1992; Li, 2020). Many attempts have been made to derive more reliable SFR diagnostics in AGNs, ranging from developing more sophisticated models of the IR emission (e.g., Hönig & Kishimoto, 2017; Lyu & Rieke, 2017; Stalevski et al., 2019), improving the methods for fitting the spectral energy distribution (e.g., Ciesla et al., 2015; Yang et al., 2020), and devising empirical calibrations based on certain diagnostic emission lines (e.g., Ho, 2005; Meléndez et al., 2008; Pereira-Santaella et al., 2010; Davies et al., 2016; Thomas et al., 2018). Building upon Ho & Keto (2007), Zhuang et al. (2019) used photoionization models that employ realistic AGN spectral energy distributions and physical properties of the narrow-line region to calibrate a new SFR estimator for AGNs anchored on the mid-IR fine-structure lines of [Ne ii] , [Ne iii] , and [Ne v] . The same set of models was then extended by Zhuang & Ho (2019) to the optical lines of [O ii] and [O iii] , updating the prior effort of Kim et al. (2006).
A positive relation between two variables does not necessarily signify an underlying causal connection if the correlation is artificially driven by the mutual dependence of the two parameters on a third. This may be a source of concern for the reported correlation, especially when it derives from AGN samples covering a wide range of redshift. A number of studies have shown that the correlation is significantly reduced after accounting for the redshift dependence (e.g., Rosario et al., 2012; Stanley et al., 2015; Lanzuisi et al., 2017; Dai et al., 2018). The separate dependence of SFR and on stellar masses poses a similar ambiguity (Yang et al., 2017; Suh et al., 2019; Stemo et al., 2020). Here we focus on yet another factor—the impact of molecular gas mass (). As the raw material that directly forms stars, strongly correlates with SFR, both as integrated on global scales and as resolved on sub-galactic scales (e.g., Kennicutt, 1998b; Bigiel et al., 2008; Genzel et al., 2010). The integrated molecular gas content of the host galaxies of nearby AGNs is also found to correlate with (Xia et al., 2012; Husemann et al., 2017), as might arise if the large-scale interstellar medium of the host couples with the fuel supply on circumnuclear scales. In their analysis of 40 low-redshift () quasars with CO and far-IR observations, Shangguan et al. (2020b) show that while their sample exhibits a statistically significant correlation between IR luminosity and AGN luminosity, or, equivalently, a relation between SFR and , the relation vanishes once the mutual correlation of the two quantities with CO luminosity is removed. One of the main objectives of the present study is to test the robustness of this result, which we achieve by substantially expanding the sample by an order of magnitude.
Cold molecular gas in galaxies is usually traced using CO (Young & Scoville, 1991), and more recently [C I] (e.g., Valentino et al., 2018), but observations of these lines are expensive and difficult to acquire for large, representative samples of AGNs. Alternative methods of estimating the cold interstellar medium have been developed based dust emission in the thermal IR (Draine et al., 2007; Scoville et al., 2014) and dust attenuation derived from optical hydrogen Balmer lines (e.g., Brinchmann et al., 2013; Concas & Popesso, 2019). Recently, Yesuf & Ho (2019) proposed an effective formalism to predict molecular gas mass from optical nebular dust extinction and metallicity, which enables efficient estimates of molecular gas mass for large spectroscopic surveys of galaxies.
Taking advantage of the recent [O ii] SFR estimator for AGNs developed by Zhuang & Ho (2019), Zhuang & Ho (2020) assembled a large sample of low-redshift type 1 AGNs to systematically investigate the star formation properties of the host galaxies and their relation to their accreting BHs. After properly mitigating the influence of redshift, Zhuang & Ho (2020) show that their AGN sample still exhibits a strong correlation between SFR and . They find no obvious dependence on stellar mass. Here we extend the analysis a step further by considering the possible effect of molecular gas mass, which we obtain using the method of Yesuf & Ho (2019). This paper assumes a cosmology with km s-1 Mpc-1, , and . We adopt the stellar initial mass function of Kroupa (2001).
2 Data
2.1 AGN Sample
This study uses the catalog of broad-line (type 1) AGNs analyzed by (Liu et al., 2019), who performed detailed spectral decomposition of galaxies and quasars from the seventh data release (DR7; Abazajian et al., 2009) of the Sloan Digital Sky Survey (SDSS; York et al., 2000). As in Zhuang & Ho (2020), we study sources having sufficiently high signal-to-noise ratio to permit a clear spectral classification based on narrow emission-line intensity diagnostics, and, in the case of H and H, we further require that their signal-to-noise ratio exceeds 5. We select galaxies classified as hosting Seyfert nuclei and that have a ratio of narrow H to H larger than 3.1, the canonical intrinsic value for AGNs (Osterbrock & Ferland, 2006). To mitigate against differential aperture effects and possible artificial correlations induced by distance, we focus only on the subset of 453 sources that span the narrow redshift range , henceforth dubbed the “” type 1 AGN sample. The fluxes of the [O iii] line and the narrow component of the H and H lines are taken directly from the catalog of Liu et al. (2019), which also provides BH masses estimated from broad H, using the method of Greene & Ho (2005). The sample consists of powerful AGNs with bolometric luminosities ranging from to erg s-1, which, for a canonical radiative efficiency of 0.1, correspond to BH mass accretion rates of yr-1. Zhuang & Ho (2020) derived the total stellar masses () of the host galaxies using the empirical scaling relation between BH mass and recently calibrated by Greene et al. (2020). They performed new measurements of [O ii] , which, in combination with [O iii] and estimates of the gas-phase metallicity, furnish SFRs following the methodology of Zhuang & Ho (2019).
2.2 Molecular Gas Mass Estimates
A central part of our analysis requires access to estimates of the gas content—preferably the molecular component—for the AGN host galaxies. Direct measurements of the molecular gas usually rely on observations of the CO line, which are time-consuming and presently unavailable for the kind of AGN sample needed for the current study. Estimates of gas masses for AGNs can be obtained indirectly through modeling of the thermal dust emission (e.g., Shangguan et al., 2018; Shangguan & Ho, 2019), but it remains challenging to access appropriate far-IR observations to construct the kind of AGN sample necessary for our purposes.
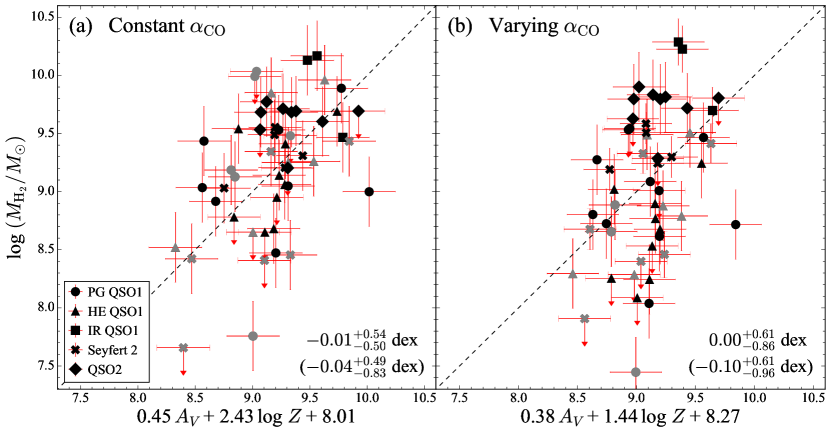
Yesuf & Ho (2019) proposed an effective, new empirical method to estimate molecular gas mass from dust extinction. Combining the nebular dust extinction traced by the narrow H/H Balmer decrement and gas-phase metallicity, molecular gas masses can be predicted to within 0.23 dex scatter compared to values derived directly from CO measurements. The scaling relation of Yesuf & Ho (2019) depends on the choice of the CO-to-H2 conversion factor (). For a constant Galactic value of (K km s-1 pc2)-1,
| (1) |
while for the varying from Accurso et al. (2017), which primarily depends on gas-phase metallicity with a secondary dependence on the offset from the star-forming galaxy main sequence,
| (2) |
Here, is the nebular -band dust extinction measured within the SDSS fiber, and is the metallicity estimated from the relation of Tremonti et al. (2004), as parameterized by Kewley & Ellison (2008).
The Yesuf & Ho (2019) technique was calibrated against a sample of star-forming galaxies. How reliably can it be applied to the host galaxies of AGNs, particularly type 1 sources? To address this issue, we compare the molecular gas masses predicted from dust extinction and metallicity with molecular gas masses derived from CO measurements, using a heterogeneous sample of low-redshift AGNs with available data from the literature. The literature sources include the Palomar-Green (PG) quasars studied by Shangguan et al. (2020a), the Hamburg/ESO (HE) quasars studied by Bertram et al. (2007) and Husemann et al. (2017), the IR-luminous quasars from Xia et al. (2012), the Seyfert 2 galaxies included as part of the xCOLD GASS survey (Saintonge et al., 2017), and more luminous type 2 quasars from Krips et al. (2012) and Villar-Martín et al. (2013). Cross-matching these samples having CO observations with the SDSS-based type 1 AGN catalog of Liu et al. (2019) and the type 2 AGN catalog from the MPA-JHU database111http://www.strw.leidenuniv.nl/jarle/SDSS/
http://www.mpa-garching.mpg.de/SDSS/DR7/ (Tremonti et al., 2004) allows us to locate Balmer decrement measurements and stellar masses222For type 1 AGNs, stellar masses are estimated from their BH masses using the calibration in Greene et al. (2020). For five type 2 AGNs without stellar mass measurements from the MPA-JHU catalog, we assume . for 22 type 1 and 20 type 2 AGNs. An additional 10 type 1 AGNs have optical data from the BAT AGN Spectroscopic Survey (Koss et al., 2017). We analyzed these using the quasar spectral fitting code PyQSOFIT (Guo et al., 2018) to measure their narrow H and H fluxes. In total, we have 32 type 1 and 20 type 2 AGNs. They have redshifts up to 0.34 and cover nearly 5 orders of magnitude in ( erg s-1), overlapping the range of the majority (93%) of our type 1 AGNs.
As in Yesuf & Ho (2019), we derive molecular gas masses assuming two sets of CO-to-H2 conversion factors. In the case of a variable , we use the calibration of Accurso et al. (2017)333We use the IR luminosity to estimate SFR, which is needed to calculating . For objects without IR luminosity, the CO(1–0) luminosity is used to predict the IR luminosity using the scaling relation given in Shangguan et al. (2020a)., whereas for the case of constant , we choose one of two fixed values, depending on the IR luminosity () of the object. For , which applies to the PG quasars, HE quasars, and Seyfert 2 galaxies, we adopt (K km s-1 pc2)-1, a value found to be appropriate for low-redshift quasars (Shangguan et al., 2020a); for IR-luminous quasars and type 2 quasars, characterized by , we select (K km s-1 pc2)-1, a value recommended for ultraluminous IR galaxies (Downes & Solomon, 1998).
We use the Kaplan-Meier estimator, as implemented in the Python package lifelines444https://lifelines.readthedocs.io/en/latest/, to calculate the median and interval of the molecular gas mass, including the CO non-detections. The extinction-based molecular gas masses, either for the varying or constant , generally provide reasonable estimates of the true gas masses based on actual CO measurements, albeit with large scatter (Figure 1). One of sources of the scatter presumably arises from the mismatch in spatial coverage between the CO measurements and the optical spectroscopic data, which generally cover just the central region of the host galaxy. A larger value of dust extinction is often found in the central region of a galaxy (e.g., Jafariyazani et al., 2019). After excluding 15 objects whose optical spectra were acquired with a slit width smaller than 2 kpc, the scatter for the case of constant is significantly reduced from 0.83 to 0.50 dex. The median differences between the two molecular gas mass estimates are much smaller than the scatter. In spite of the small-number statistics, we are encouraged by the results of this comparison. For concreteness, all subsequent analysis will use Equation 1 to predict molecular gas mass. We note that we have probably overestimated the real uncertainty of converting nebular extinction and metallicity to molecular gas mass. The heterogeneous origin of the CO measurements from different telescopes and observations likely leads to calibration systematics and contributes to the observed scatter of 0.5 dex.
3 Results
3.1 Active and Inactive Galaxies Have Similar Gas Content
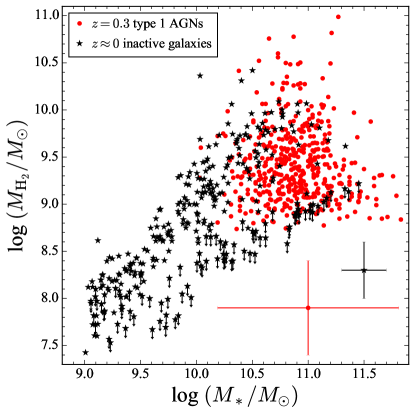
The molecular gas content of a galaxy varies with its stellar mass (Saintonge et al., 2016). Figure 2 shows that the molecular gas masses for our type 1 AGNs are generally consistent with those for nearby inactive, star-forming galaxies from the xCOLD GASS sample (Saintonge et al., 2017). This implies that type 1 AGNs have similar molecular gas content as nearby normal galaxies, echoing previous cold gas surveys of low- quasars (e.g., Bertram et al., 2007; Villar-Martín et al., 2013; Jarvis et al., 2020; Shangguan et al., 2020b). Using the same technique as we, Yesuf & Ho (2020) reached a similar conclusion regarding nearby Seyfert 2 galaxies. The existence of a large gas reservoir in AGNs supports the idea that, instead of instantaneously removing the interstellar medium and suppressing star formation in their host galaxies, AGN feedback may operate over a longer timescale (e.g., Costa et al., 2014; Harrison, 2017; Harrison et al., 2018).
Figure 2 might give the impression that our AGN sample contains no gas-poor objects whatsoever. There are, although not many. The selection criteria of Zhuang & Ho (2020) required that narrow H/H , to exclude objects with unphysical Balmer decrements that can arise from poor spectral decomposition. This requirement, although very stringent, only excluded (13/466) of the parent sample of type 1 AGNs. Moreover, Equation 1 can only probe for objects with , even when the dust extinction is zero. Thus, while we miss gas-poor systems, we do not miss many, and they do not affect our main conclusions. The overall consistency between our results and independently derived gas masses lends confidence that the extinction-based method can be applied to estimate molecular gas masses in type 1 AGNs.
3.2 SFR and Are Intrinsically Correlated
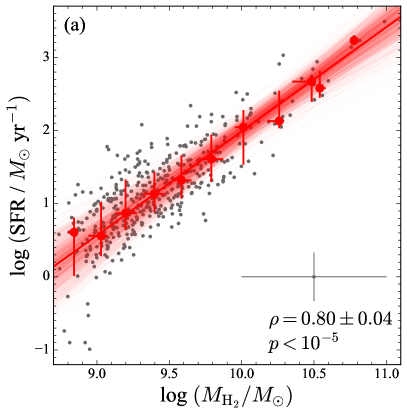
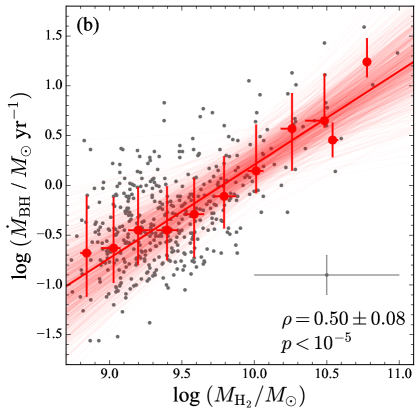
SFR correlates with molecular gas mass (e.g., Bigiel et al., 2008; Genzel et al., 2010), and so, too, does AGN luminosity (Xia et al., 2012; Izumi et al., 2016; Husemann et al., 2017; Shangguan et al., 2020b). We also find a very strong positive correlation (Spearman correlation strength , ; Figure 3a)555Throughout this paper we consider a correlation “very strong” when the Spearman’s coefficient , “strong” when , “moderate” when , “weak” when , and “very weak” when . between SFR and and a moderately strong positive correlation (, ; Figure 3b) between and for our type 1 AGN sample. To mitigate against the potential effect of the large uncertainties in the molecular gas mass estimates on our correlation analysis, we use bootstrap resampling666We resample 500 times using samples of 100 objects. The statistics are stable (almost identical and ) for sample sizes larger than 70. to quantify the uncertainties when performing correlation analysis involving (i.e. Figures 3 and 5). Fits to the medians of the data in Figure 3 using the linear regression code linmix (Kelly, 2007) give
| (3) |
and
| (4) |
Two important inferences can be drawn from these results. On the one hand, the relation between SFR and molecular gas mass observed in our sample of type 1 AGNs implies that even in powerful AGNs the interstellar medium of their host galaxies behaves essentially normally, insofar as their ability to form stars is concerned. On the other hand, the existence of an empirical relation between BH accretion rate and total molecular gas mass suggests that there is a physical link between the gas supply of the host galaxy on global scales and the fuel reservoir for the AGN on circumnuclear scales. This echoes the results from the studies of Husemann et al. (2017) and Shangguan et al. (2020b), but places them on much firmer statistical footing because of the unprecedented size and homogeneity of our sample.
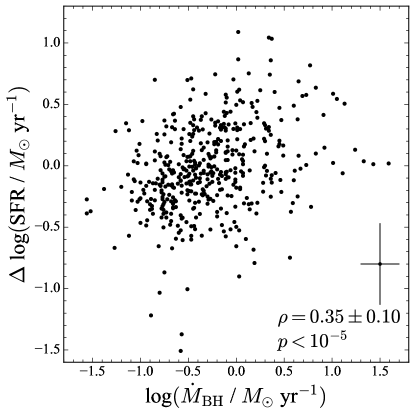
We return to the main issue that triggered this study, one that has motivated many similar studies in the literature (Section 1). To what extent does the SFR of the host galaxy truly correlate with the BH accretion rate (or AGN luminosity)? Taken at face value, the full parent sample of all type 1 AGNs certainly exhibits a dramatic correlation between SFR and (Zhuang & Ho, 2020, their Figure 5a). However, this can be misleading, for an artificial correlation can be induced by redshift and stellar mass. After mitigating these effects by limiting the analysis to the subsample isolated to , Zhuang & Ho (2020, their Figure 5b) show that a highly significant positive correlation (, ) persists, with no evident dependence on stellar mass. Our present study reveals yet another factor of concern, one that hitherto has been underappreciated. In light of the separate and correlations discussed above (Figure 3), seeking any additional, intrinsic link between SFR and first should remove the mutual dependence on . This is obviously a difficult and demanding task, given the myriad requirements that the sample must satisfy. It also highlights the dangers of over-interpreting any casual presentation of the SFR- relation without considering this factor. Although our estimates of molecular gas mass, based on the Balmer decrement and metallicity from the stellar mass-metallicity relation, are admittedly crude (Yesuf & Ho, 2019) and necessarily indirect, they afford us the opportunity to investigate the partial correlation between SFR and after removing the dependence of SFR on . Since SFR correlates more strongly with than it does with , while does not (), we only consider the result of removing the dependence of SFR on . Toward this end, to remove the dependence of SFR on , we subtract from each observed SFR the value predicted from using Equation 3, to obtain the residual SFR: . We estimate the uncertainties of this subtraction using the 500 random realizations from the posterior distribution of the fit (thin red lines in Figure 3a). Figure 4 displays SFR versus BH accretion rate. Intriguingly, even after accounting for the dependence of SFR on , the residual SFR still significantly correlates with (), albeit more weakly ()777A larger Spearman coefficient is achieved (, ) if the dependence of on is further included.. The existence of an intrinsic correlation between and SFR suggests that BH accretion in the innermost region somehow communicates with star formation on galactic scales.
4 Discussion
4.1 Implications for AGN Feedback
Our partial correlation analysis suggests that, after accounting for the common dependence on , an intrinsic relation exists between SFR and . Far from curtailing star formation, BH accretion evidently is connected somehow with the positive enhancement of star formation activity in the host galaxy. While we currently cannot say where in the host galaxy the stars form, Zhuang & Ho (2020) present tentative evidence that the star formation occurs predominantly on relatively small (central kpc) scales.
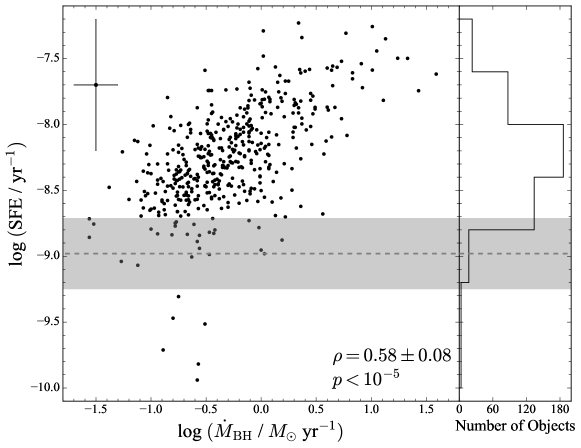
A number of authors have proposed that AGN feedback can exert a positive instead of a negative influence on star formation (e.g., King, 2005; Ishibashi & Fabian, 2012; Ishibashi et al., 2013). Positive feedback can be achieved by compression of cold molecular gas by fast outflows generated by AGNs (Silk, 2013; Cresci et al., 2015b) and by the direct formation of stars via cooling and fragmentation of the gas inside the outflows themselves (Maiolino et al., 2017; Gallagher et al., 2019). While we presently lack the spatial information to make more definitive statements about the nature of the connection between the AGN and star formation, Figure 5 shows that the star formation efficiency () strongly correlates (, ) with the BH accretion rate, with the majority of the AGNs in our sample having SFEs higher than the typical values of galaxies on the star-forming main-sequence in the local Universe (Saintonge et al., 2017). Stars not only form more efficiently in AGN hosts, but their formation efficiency increases with larger BH accretion rate.
Outflows occur pervasively in AGNs, and the fraction of AGNs with outflow signatures increases with higher [O iii] luminosity (Rakshit & Woo, 2018). Using integral field spectroscopy of 2800 local galaxies, Gallagher et al. (2019) find that the SFR inside the outflows positively correlates with the mass outflow rate of the ionized gas. Equation 9 of Gallagher et al. (2019) implies that the fraction of the SFR inside outflows increases from at yr-1 to at yr-1. Galactic outflows contain a large reservoir of molecular gas (e.g., Feruglio et al., 2010; Fluetsch et al., 2019, 2020), which occupy a higher proportion in a dense phase compared to the galactic disk (Aalto et al., 2012; Walter et al., 2017). The relative fraction of molecular gas to ionized gas in outflows scales with AGN strength (Fluetsch et al., 2019). We surmise that the overall rise of SFE with BH accretion rate may be connected with positive feedback from AGN-driven outflows.
We close with a note of clarification. Shangguan et al. (2020b) recently studied the physical properties of the host galaxies of 40 PG quasars for which they could measure their molecular gas content through CO observations and SFRs from decomposition of the full (m) IR spectral energy distribution. The authors find that SFR correlates strongly with AGN luminosity, but that the correlation disappears after taking into account the mutual dependence on molecular gas mass (their Figure 8). We attribute this apparent discrepancy with the results of this paper to small-number statistics. We can qualitatively reproduce the results of (Shangguan et al., 2020b) by performing bootstrap resampling 500 times of subsets of 40 objects (to match the sample size of Shangguan et al. 2020b) selected from our parent sample of 453 sources. There is a 15% probability that the randomly drawn samples achieve a Spearman -value .
4.2 Caveats
This study extends to AGNs the formalism of Yesuf & Ho (2019), originally devised for star-forming galaxies, to estimate molecular gas mass using nebular extinction and metallicity. To be sure, the indirect molecular gas masses have significant uncertainties (0.5 dex; Figure 1a), and they should be used with extreme caution for any single individual object. However, the absence of systematic bias between the molecular gas masses based on CO and those estimated from dust extinction lends confidence that we can apply our method to study the molecular gas content of a large AGN sample. Although our main sample contains a small percentage (8%) of objects with and larger than those of the calibration sample, we verified that excluding this small subset of objects does not affect our results.
We suggest that positive AGN feedback might underlie the positive correlation between SFE and (Section 4.1). Perhaps some alternative process can enhance the host galaxy SFE while simultaneously coupling to the BH accretion rate. For example, gas-rich galaxy-galaxy interactions can drive gas from the outskirts of the host galaxy to the center, induce intense central star formation, and feed the BH (e.g., Hopkins et al., 2005). Unfortunately, the quality of the available SDSS optical images precludes us from obtaining reliable information on the morphology of the sample. The objects are located at a relatively large distance (), compounded by the fact that the prominent type 1 nucleus presents a major source of contamination. Nevertheless, there is no strong evidence that major mergers play a significant role in triggering BH accretion in quasars (Dunlop et al., 2003; Cisternas et al., 2011; Mechtley et al., 2016; Zhao et al., 2019; but see counter evidence in Marian et al., 2020). Studies of the smaller sample of nearby () PG quasars reinforce our conclusions: Shangguan et al. (2020b) and Xie et al. (2020) report that a sizable fraction of these quasars also exhibit high SFEs, and yet many lack signatures of ongoing or recent major mergers. Although other possibilities such as minor mergers (Husemann et al., 2014) cannot be ruled out easily, we suspect that major mergers are not responsible for the observed correlation between SFE and .
Lastly, we note that our AGN sample, intentionally designed to mitigate complications from redshift effects and SDSS fiber coverage, limits our study only to relatively luminous AGNs at . It is possible that BH accretion has less of an impact on the star formation properties of the host galaxies of less luminous AGNs, which exhibit a lower incidence of outflows (e.g., Rakshit & Woo 2018). While elevated SFEs can be found in quasars at (Husemann et al., 2017; Shangguan et al., 2020b), they are not as prevalent as in the sample considered here.
5 Summary
Using a large sample of 453 type 1 AGNs from Zhuang & Ho (2020), we apply the molecular gas mass estimator from Yesuf & Ho (2019) to study the link between BH accretion and SFR after accounting for the dependence of these quantities on redshift and molecular gas mass. We summarize this study as follows:
-
1.
We collect 32 type 1 and 20 type 2 AGNs with archival CO observations and Balmer decrement from optical spectroscopy and show that the combination of dust extinction and metallicity prescribed by Yesuf & Ho (2019) provides fairly accurate molecular gas mass estimates for AGNs.
-
2.
Applying the molecular gas estimator to our type 1 AGNs, we find that these objects have similar gas content as nearby inactive galaxies, which suggests that AGNs do not remove the cold gas content of their host galaxies instantaneously.
-
3.
We find that both SFR and BH accretion rate correlate with molecular gas mass. The observed strong correlation between SFR and is exaggerated by their mutual dependence on .
-
4.
After removing the dependence of SFR on , SFR and are still weakly correlated, which suggests that BH accretion in the innermost region is linked to star formation on galactic scales.
-
5.
We find a strong correlation between star formation efficiency and BH accretion rate, which can be interpreted as evidence for positive AGN feedback.
References
- Aalto et al. (2012) Aalto, S., Garcia-Burillo, S., Muller, S., et al. 2012, A&A, 537, A44
- Abazajian et al. (2009) Abazajian, K. N., Adelman-McCarthy, J. K., Agüeros, M. A., et al. 2009, ApJS, 182, 543
- Accurso et al. (2017) Accurso, G., Saintonge, A., Catinella, B., et al. 2017, MNRAS, 470, 4750
- Astropy Collaboration et al. (2018) Astropy Collaboration, Price-Whelan, A. M., Sipőcz, B. M., et al. 2018, AJ, 156, 123
- Astropy Collaboration et al. (2013) Astropy Collaboration, Robitaille, T. P., Tollerud, E. J., et al. 2013, A&A, 558, A33
- Azadi et al. (2015) Azadi, M., Aird, J., Coil, A. L., et al. 2015, ApJ, 806, 187
- Bertram et al. (2007) Bertram, T., Eckart, A., Fischer, S., et al. 2007, A&A, 470, 571
- Bigiel et al. (2008) Bigiel, F., Leroy, A., Walter, F., et al. 2008, AJ, 136, 2846
- Brinchmann et al. (2013) Brinchmann, J., Charlot, S., Kauffmann, G., et al. 2013, MNRAS, 432, 2112
- Chen et al. (2013) Chen, C.-T. J., Hickox, R. C., Alberts, S., et al. 2013, ApJ, 773, 3
- Ciesla et al. (2015) Ciesla, L., Charmandaris, V., Georgakakis, A., et al. 2015, A&A, 576, A10
- Cisternas et al. (2011) Cisternas, M., Jahnke, K., Inskip, K. J., et al. 2011, ApJ, 726, 57
- Concas & Popesso (2019) Concas, A., & Popesso, P. 2019, MNRAS, 486, L91
- Costa et al. (2014) Costa, T., Sijacki, D., & Haehnelt, M. G. 2014, MNRAS, 444, 2355
- Cresci et al. (2015a) Cresci, G., Mainieri, V., Brusa, M., et al. 2015a, ApJ, 799, 82
- Cresci et al. (2015b) Cresci, G., Marconi, A., Zibetti, S., et al. 2015b, A&A, 582, A63
- Dai et al. (2018) Dai, Y. S., Wilkes, B. J., Bergeron, J., et al. 2018, MNRAS, 478, 4238
- Davies et al. (2016) Davies, R. L., Groves, B., Kewley, L. J., et al. 2016, MNRAS, 462, 1616
- Downes & Solomon (1998) Downes, D., & Solomon, P. M. 1998, ApJ, 507, 615
- Draine et al. (2007) Draine, B. T., Dale, D. A., Bendo, G., et al. 2007, ApJ, 663, 866
- Dunlop et al. (2003) Dunlop, J. S., McLure, R. J., Kukula, M. J., et al. 2003, MNRAS, 340, 1095
- Fabian (2012) Fabian, A. C. 2012, ARA&A, 50, 455
- Feruglio et al. (2010) Feruglio, C., Maiolino, R., Piconcelli, E., et al. 2010, A&A, 518, L155
- Fluetsch et al. (2019) Fluetsch, A., Maiolino, R., Carniani, S., et al. 2019, MNRAS, 483, 4586
- Fluetsch et al. (2020) Fluetsch, A., Maiolino, R., Carniani, S., et al. 2020, MNRAS, submitted (arXiv:2006.13232)
- Gallagher et al. (2019) Gallagher, R., Maiolino, R., Belfiore, F., et al. 2019, MNRAS, 485, 3409
- Genzel et al. (2010) Genzel, R., Tacconi, L. J., Gracia-Carpio, J., et al. 2010, MNRAS, 407, 2091
- Greene & Ho (2005) Greene, J. E., & Ho, L. C. 2005, ApJ, 630, 122
- Greene et al. (2020) Greene, J. E., Strader, J., & Ho, L. C. 2020, ARA&A, 58, 257
- Groves et al. (2006) Groves, B., Dopita, M., & Sutherland, R. 2006, A&A, 458, 405
- Guo et al. (2018) Guo, H., Shen, Y., & Wang, S. 2018, PyQSOFit: Python code to fit the spectrum of quasars, ascl:1809.008
- Harris et al. (2016) Harris, K., Farrah, D., Schulz, B., et al. 2016, MNRAS, 457, 4179
- Harrison (2017) Harrison, C. M. 2017, Nature Astronomy, 1, 0165
- Harrison et al. (2018) Harrison, C. M., Costa, T., Tadhunter, C. N., et al. 2018, Nature Astronomy, 2, 198
- Heckman & Best (2014) Heckman, T. M., & Best, P. N. 2014, ARA&A, 52, 589
- Ho (2005) Ho, L. C. 2005, ApJ, 629, 680
- Ho & Keto (2007) Ho, L. C., & Keto, E. 2007, ApJ, 658, 314
- Hönig & Kishimoto (2017) Hönig, S. F., & Kishimoto, M. 2017, ApJ, 838, L20
- Hopkins et al. (2005) Hopkins, P. F., Hernquist, L., Cox, T. J., et al. 2005, ApJ, 630, 705
- Hunter (2007) Hunter, J. D. 2007, Computing in Science & Engineering, 9, 90
- Husemann et al. (2017) Husemann, B., Davis, T. A., Jahnke, K., et al. 2017, MNRAS, 470, 1570
- Husemann et al. (2014) Husemann, B., Jahnke, K., Sánchez, S. F., et al. 2014, MNRAS, 443, 755
- Ishibashi & Fabian (2012) Ishibashi, W., & Fabian, A. C. 2012, MNRAS, 427, 2998
- Ishibashi et al. (2013) Ishibashi, W., Fabian, A. C., & Canning, R. E. A. 2013, MNRAS, 431, 2350
- Izumi et al. (2016) Izumi, T., Kawakatu, N., & Kohno, K. 2016, ApJ, 827, 81
- Jafariyazani et al. (2019) Jafariyazani, M., Mobasher, B., Hemmati, S., et al. 2019, ApJ, 887, 204
- Jarvis et al. (2020) Jarvis, M. E., Harrison, C. M., Mainieri, V., et al. 2020, MNRAS, 498, 1560
- Jones et al. (2001–) Jones, E., Oliphant, T., Peterson, P., et al. 2001–, SciPy: Open source scientific tools for Python, , , [Online; accessed 2019-05-27]
- Kelly (2007) Kelly, B. C. 2007, ApJ, 665, 1489
- Kennicutt (1998a) Kennicutt Jr., R. C., 1998a, ARA&A, 36, 189
- Kennicutt (1998b) Kennicutt Jr., R. C., 1998b, ApJ, 498, 541
- Kewley & Ellison (2008) Kewley, L. J., & Ellison, S. L. 2008, ApJ, 681, 1183
- Kim et al. (2006) Kim, M., Ho, L. C., & Im, M. 2006, ApJ, 642, 702
- King (2005) King, A. 2005, ApJ, 635, L121
- Kormendy & Ho (2013) Kormendy, J., & Ho, L. C. 2013, ARA&A, 51, 511
- Koss et al. (2017) Koss, M., Trakhtenbrot, B., Ricci, C., et al. 2017, ApJ, 850, 74
- Krips et al. (2012) Krips, M., Neri, R., & Cox, P. 2012, ApJ, 753, 135
- Kroupa (2001) Kroupa, P. 2001, MNRAS, 322, 231
- Lanzuisi et al. (2017) Lanzuisi, G., Delvecchio, I., Berta, S., et al. 2017, A&A, 602, A123
- Li (2020) Li, A. 2020, Nature Astronomy, 4, 339
- Liu et al. (2019) Liu, H.-Y., Liu, W.-J., Dong, X.-B., et al. 2019, ApJS, 243, 21
- Lutz et al. (2010) Lutz, D., Mainieri, V., Rafferty, D., et al. 2010, ApJ, 712, 1287
- Lyu & Rieke (2017) Lyu, J., & Rieke, G. H. 2017, ApJ, 841, 76
- Maiolino et al. (2017) Maiolino, R., Russell, H. R., Fabian, A. C., et al. 2017, Nature, 544, 202
- Marian et al. (2020) Marian, V., Jahnke, K., Andika, I., et al. 2020, ApJ, in press (arXiv:2010.00022)
- Mechtley et al. (2016) Mechtley, M., Jahnke, K., Windhorst, R. A., et al. 2016, ApJ, 830, 156
- Meléndez et al. (2008) Meléndez, M., Kraemer, S. B., Schmitt, H. R., et al. 2008, ApJ, 689, 95
- Mullaney et al. (2012) Mullaney, J. R., Daddi, E., Béthermin, M., et al. 2012, ApJ, 753, L30
- Oliphant (2006) Oliphant, T. E. 2006, A guide to NumPy, Vol. 1 (Trelgol Publishing USA)
- Osterbrock & Ferland (2006) Osterbrock, D. E., & Ferland, G. J. 2006, Astrophysics of Gaseous Nebulae and Active Galactic Nuclei, 2nd Ed. (Sausalito, CA: Univ. Science Books)
- Pereira-Santaella et al. (2010) Pereira-Santaella, M., Diamond-Stanic, A. M., Alonso-Herrero, A., & Rieke, G. H. 2010, ApJ, 725, 2270
- Rakshit & Woo (2018) Rakshit, S., & Woo, J.-H. 2018, ApJ, 865, 5
- Richstone et al. (1998) Richstone, D., Ajhar, E. A., Bender, R., et al. 1998, Nature, 395, A14
- Rosario et al. (2012) Rosario, D. J., Santini, P., Lutz, D., et al. 2012, A&A, 545, A45
- Saintonge et al. (2016) Saintonge, A., Catinella, B., Cortese, L., et al. 2016, MNRAS, 462, 1749
- Saintonge et al. (2017) Saintonge, A., Catinella, B., Tacconi, L. J., et al. 2017, ApJS, 233, 22
- Santini et al. (2012) Santini, P., Rosario, D. J., Shao, L., et al. 2012, A&A, 540, A109
- Scoville et al. (2014) Scoville, N., Aussel, H., Sheth, K., et al. 2014, ApJ, 783, 84
- Shangguan & Ho (2019) Shangguan, J., & Ho, L. C. 2019, ApJ, 873, 90
- Shangguan et al. (2020a) Shangguan, J., Ho, L. C., Bauer, F. E., Wang, R., & Treister, E. 2020a, ApJS, 247, 15
- Shangguan et al. (2020b) Shangguan, J., Ho, L. C., Bauer, F. E., Wang, R., & Treister, E. 2020b, ApJ, 899, 112
- Shangguan et al. (2018) Shangguan, J., Ho, L. C., & Xie, Y. 2018, ApJ, 854, 158
- Shimizu et al. (2017) Shimizu, T. T., Mushotzky, R. F., Meléndez, M., et al. 2017, MNRAS, 466, 3161
- Shipley et al. (2016) Shipley, H. V., Papovich, C., Rieke, G. H., Brown, M. J. I., & Moustakas, J. 2016, ApJ, 818, 60
- Silk (2013) Silk, J. 2013, ApJ, 772, 112
- Stalevski et al. (2019) Stalevski, M., Tristram, K. R. W., & Asmus, D. 2019, MNRAS, 484, 3334
- Stanley et al. (2017) Stanley, F., Alexander, D. M., Harrison, C. M., et al. 2017, MNRAS, 472, 2221
- Stanley et al. (2015) Stanley, F., Harrison, C. M., Alexander, D. M., et al. 2015, MNRAS, 453, 591
- Stemo et al. (2020) Stemo, A., Comerford, J. M., Barrows, R. S., et al. 2020, ApJ, 888, 78
- Suh et al. (2019) Suh, H., Civano, F., Hasinger, G., et al. 2019, ApJ, 872, 168
- Thomas et al. (2018) Thomas, A. D., Dopita, M. A., Kewley, L. J., et al. 2018, ApJ, 856, 89
- Tremonti et al. (2004) Tremonti, C. A., Heckman, T. M., Kauffmann, G., et al. 2004, ApJ, 613, 898
- Valentino et al. (2018) Valentino, F., Magdis, G. E., Daddi, E., et al. 2018, ApJ, 869, 27
- Villar-Martín et al. (2013) Villar-Martín, M., Rodríguez, M., Drouart, G., et al. 2013, MNRAS, 434, 978
- Voit (1992) Voit, G. M. 1992, MNRAS, 258, 841
- Walter et al. (2017) Walter, F., Bolatto, A. D., Leroy, A. K., et al. 2017, ApJ, 835, 265
- Wang & Loeb (2018) Wang, X., & Loeb, A. 2018, New A, 61, 95
- Xia et al. (2012) Xia, X. Y., Gao, Y., Hao, C. N., et al. 2012, ApJ, 750, 92
- Xie & Ho (2019) Xie, Y., & Ho, L. C. 2019, ApJ, 884, 136
- Xie et al. (2020) Xie, Y., Ho, L. C., Zhuang, M.-Y., & Shangguan, J. 2020, ApJ, submitted
- Yang et al. (2020) Yang, G., Boquien, M., Buat, V., et al. 2020, MNRAS, 491, 740
- Yang et al. (2017) Yang, G., Chen, C.-T. J., Vito, F., et al. 2017, ApJ, 842, 72
- Yesuf & Ho (2019) Yesuf, H. M., & Ho, L. C. 2019, ApJ, 884, 177
- Yesuf & Ho (2020) Yesuf, H. M., & Ho, L. C. 2020, ApJ, 901, 42
- York et al. (2000) York, D. G., Adelman, J., Anderson, Jr., J. E., et al. 2000, AJ, 120, 1579
- Young & Scoville (1991) Young, J. S., & Scoville, N. Z. 1991, ARA&A, 29, 581
- Zhao et al. (2019) Zhao, D., Ho, L. C., Zhao, Y., Shangguan, J., & Kim, M. 2019, ApJ, 877, 52
- Zhuang & Ho (2019) Zhuang, M.-Y., & Ho, L. C. 2019, ApJ, 882, 89
- Zhuang & Ho (2020) Zhuang, M.-Y., & Ho, L. C. 2020, ApJ, 896, 108
- Zhuang et al. (2018) Zhuang, M.-Y., Ho, L. C., & Shangguan, J. 2018, ApJ, 862, 118
- Zhuang et al. (2019) Zhuang, M.-Y., Ho, L. C., & Shangguan, J. 2019, ApJ, 873, 103