3D Correspondence Grouping with Compatibility Features
Abstract
We present a simple yet effective method for 3D correspondence grouping. The objective is to accurately classify initial correspondences obtained by matching local geometric descriptors into inliers and outliers. Although the spatial distribution of correspondences is irregular, inliers are expected to be geometrically compatible with each other. Based on such observation, we propose a novel representation for 3D correspondences, dubbed compatibility feature (CF), to describe the consistencies within inliers and inconsistencies within outliers. CF consists of top-ranked compatibility scores of a candidate to other correspondences, which purely relies on robust and rotation-invariant geometric constraints. We then formulate the grouping problem as a classification problem for CF features, which is accomplished via a simple multilayer perceptron (MLP) network. Comparisons with nine state-of-the-art methods on four benchmarks demonstrate that: 1) CF is distinctive, robust, and rotation-invariant; 2) our CF-based method achieves the best overall performance and holds good generalization ability.
1 Introduction
3D correspondence grouping (a.k.a. 3D correspondence selection or 3D mismatch removal) is essential to a number of point-to-point correspondences-based tasks, such as 3D point cloud registration [24], 3D object recognition [32], and 3D reconstruction [18]. The aim is to classify initial feature correspondences between two 3D point clouds obtained by matching local geometric descriptors into inliers and outliers. Due to a number of factors, e.g., repetitive patterns, keypoint localization errors, and data nuisances including noise, limited overlap, clutter and occlusion, heavy outliers are generated in the initial correspondence set [34]. Thus, it is very challenging to mine the consistency of scarce inliers and find those inliers.
Existing 3D correspondence grouping methods can be divided into two categories: group-based and individual-based. Group-based methods [6, 11, 2, 31, 23] assume that inliers constitute a cluster in a particular domain and struggle to recover such cluster. By contrast, individual-based ones [17, 33, 13, 1, 36, 26] usually first assign confidence scores to correspondences based on feature or geometrics constraints, and then select top-scored correspondences independently. However, as revealed by a recent evaluation [34], existing methods in both categories 1) generalize poorly across datasets with different application scenarios and data modalities, and 2) deliver limited precision performance which is critical to successful 3D registration with sparse correspondences.
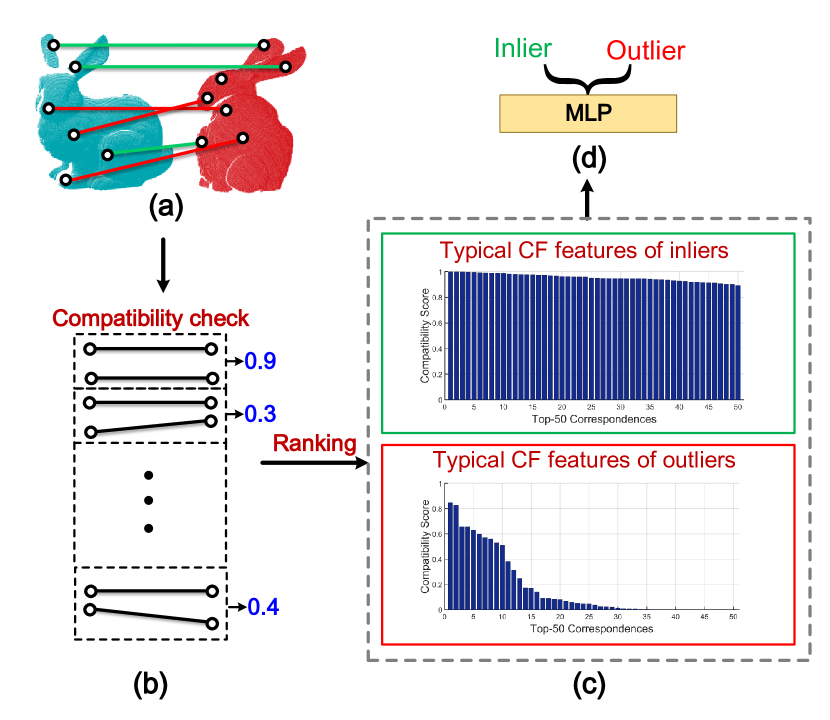
To overcome above limitations, we present a new feature presentation to describe 3D correspondences dubbed compatibility feature (CF) along with a CF-based 3D correspondence grouping method, as illustrated in Fig. 1. CF consists of top-ranked compatibility scores of a candidate to other correspondences. CF is supposed to hold strong discriminative power because inliers are geometrically compatible with each other whereas outliers are unlikely to be compatible with either outliers or inliers due to their unordered spatial distributions. This results in clear distinctions between CF features of inliers and outliers. Since the correspondence grouping problem can be viewed as a binary classification problem, we train a simple multilayer perceptron (MLP) network as a robust classifier to distinguish inliers and outliers. Although there have been some “end-to-end” learning-based 2D correspondence selection methods [20, 37, 28], our method follows a “geometry + learning” fashion due to the following reasons. First, even for 2D images with pixel coordinate values being in a small range, training “end-to-end” networks still requires a huge amount number of labeled image pairs [20]. By contrast, the coordinates of 3D points can be arbitrary in a 3D space, greatly increasing the challenges of training data preparation and training. We will show that dozens of point cloud pairs are suffice to train an MLP to classify CF features. Second, pixel/point coordinates are sensitive to rotations [4]. Although augmenting training data can sometimes alleviates this problem, the network is still not fully rotation-invariant in nature. By contrast, CF features are extracted with rotation-invariant geometric constraints and are robust to arbitrary 3D rotations. Third, most of existing “end-to-end” methods are not practical on real-world data as demonstrated in [3]. Fourth, with CF features, the learning network (i.e., MLP) in our method is very lightweight and can be trained with a few number of point cloud pairs. In a nutshell, this paper has the following contributions.
-
•
A compatibility feature (CF) representation is proposed to describe 3D feature correspondences. CF captures the key differences between inliers and outliers regarding pairwise geometrical compatibility, which is distinctive, robust, and rotation-invariant.
-
•
A 3D correspondence grouping method based on CF is proposed. In 3D correspondence grouping domain, our method is the first learning-based one (to the best of our knowledge), while it holds the “geometry + learning” property and works with a simple MLP network. Comprehensive experiments and comparisons with all methods evaluated in [34] on datasets with different application contexts and data modalities verify that our method has good generalization abilities and achieves outstanding precision performance.
2 Related Work
This section briefly reviews group-based and individual-based methods for 3D correspondence grouping. Methods in both categories are geometric-only ones. Because our method includes a learning-based classier, we also discuss some learning-based techniques for correspondence problems in 2D domain.
2.1 3D Correspondence Grouping
Group-based methods Random sampling consensus [6] is arguably the most commonly used method for 3D correspondence grouping and transformation estimation. It iteratively estimates a model from correspondences and verifies its rationality; correspondences coherent with the best estimated model are served as inliers. The variants of RANSAC [8, 22] generally follow the same pipeline. Some methods try to find the main cluster within initial correspondences by analyzing the affinity matrix computed for correspondences. For instance, game theory matching (GTM) [23] and spectral technique [11] perform spectral analysis and dynamic evolution on the affinity matrix to determine the inlier cluster, respectively. Geometric consistency (GC) [9, 2] performs inlier cluster selection more straightforwardly. In particular, GC forms a cluster for each correspondence by ensuring correspondences in the cluster are compatible with the query correspondence; the cluster with the maximum element count is served as the inlier cluster. Different from above iterative methods, 3D Hough voting (3DHV) [31] is a one-shot method, which first transforms correspondences to 3D points in a 3D Hough space and then finds the cluster in Hough space.
As demonstrated in a recent evaluation [34], group-based methods often miss isolated inliers and are sensitive to low inlier ratios.
Individual-based methods In early studies, some individual-based methods group correspondences based on feature distances only [17, 8], which are straightforward but rely heavily on the performance of descriptors. To achieve more robust grouping, several voting-based methods have been proposed such as search of inliers (SI) [1] and consistency voting (CV) [36]. The common peculiarity of these methods is that one or more voting sets are first defined and then all voters will cast a vote to each correspondence based on some pre-defined rules.
Compared with group-based methods, individual-based ones assign scores to correspondences independently and thus can more reliably recall isolated inliers. However, existing individual-based methods still exhibit limited precision performance. We note that the proposed method is individual-based as well, but is highly selective with outstanding precision performance.
2.2 Learning for Correspondence Grouping
Existing 3D correspondence grouping methods are still geometric-based ones [34]. In 2D domains, there exist a few mismatch removal methods based on deep learning [20, 14, 38, 30]. Yi et al. [20] presented the first attempt to find inliers with an “end-to-end” network. To mine local information, Ma et al. [14] and Zhao et al. [38] associated spatial and compatibility-specific neighbors to each correspondence for classifier training, respectively.
Nonetheless, most of existing learning-based image correspondence grouping methods suffer from the following limitations: 1) the requirement of a large amount of training matching pairs; 2) the sensitivity to rotations due to the input of coordinate information; 3) redundant network architectures. By contrast, our method properly interprets the roles of geometric and learning techniques, and can effectively overcome these limitations.
3 Methodology
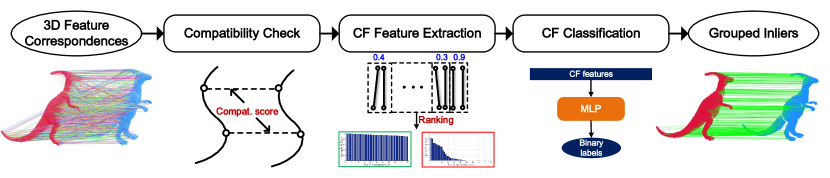
The pipeline of our method is presented in Fig. 2. It consists of three main steps, including compatibility check, CF feature extraction, and CF classification. They play the following roles in the whole pipeline:
-
•
Compatibility check: one critical difference between inliers and outliers is that inliers are compatible with each other while outliers are usually incompatible with either inliers or outliers. Checking the compatibility between correspondences is the basis of the following steps.
-
•
CF feature extraction: CF features are extracted based on the compatibility cue to parametrize 3D feature correspondences and distinguish inliers and outliers.
-
•
CF classification: we train a classifier to classify CF features extracted for correspondences and accomplish the 3D correspondence grouping goal.
To improve readability, we introduce the following notations. Let and be the source point cloud and the target point cloud, respectively. A feature correspondence set can be generated by matching local geometric descriptors for and . The aim of our method is to assign a binary label (inlier or outlier) to each element in , where and .
3.1 Compatibility Check
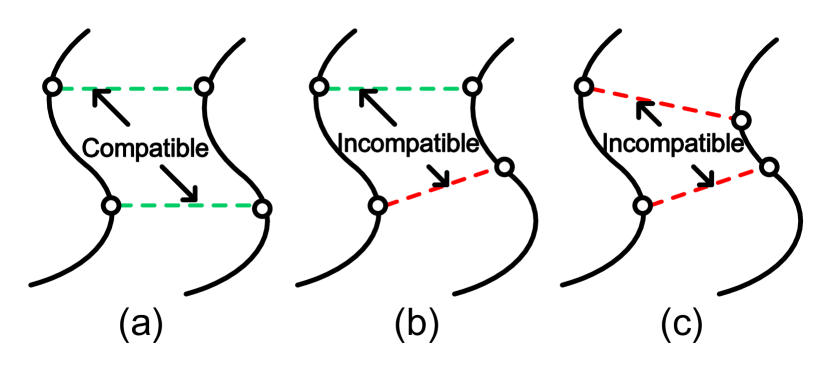
In order to distinguish inliers and outliers, we should fully mine the consistency information within inliers. As depicted in Fig. 3, an important observation is that inliers are geometrically compatible with each other, while outliers are unlikely to be compatible with either outliers or inliers, because the spatial distribution of outliers are unordered. Following this cue, we are motivated to define a metric to check the compatibility between two correspondences.
In the context of 3D point cloud matching, we consider distance and angle constraints [1, 36] that are invariant to rotations for compatibility metric definition. Let be the normal of , the distance and angle constraints for two correspondences are respectively defined as:
| (1) |
and
| (2) |
We note that and are calculated based on linear operation on relative distances and angles, thus being rotation-invariant. Both constraints are complementary to each other (Sect. 4.2). By integrating the two constraints, we define the compatibility metric as:
| (3) |
where and represent a distance parameter and an angle parameter, respectively. One can see that and equals 1 only if both constraints are fully satisfied.
3.2 CF Feature Extraction
With a compatibility metric, a naive way for correspondence grouping is to first assess the greatest compatibility score of each correspondence to others and then set a threshold to filter those with low scores. This is not robust and the distinctiveness of a single compatibility score is limited, as demonstrated in [2]. Instead, we consider top- compatibility scores and render them as a feature vector. Remarkably, most prior works focus on assign scores to correspondences, and the main difference among them is the scoring functions. Our method differs from those ones as we exact feature vectors for correspondences.
Specifically, the calculation of CF features consists of three steps: 1) compute the compatibility scores of to other correspondences in based on Eq. 3, obtaining a score set ( being the cardinality of ); 2) sort elements in by a descending order, resulting in ; 3) compute the -dimensional CF feature of as the concatenation of the former elements in , i.e., .
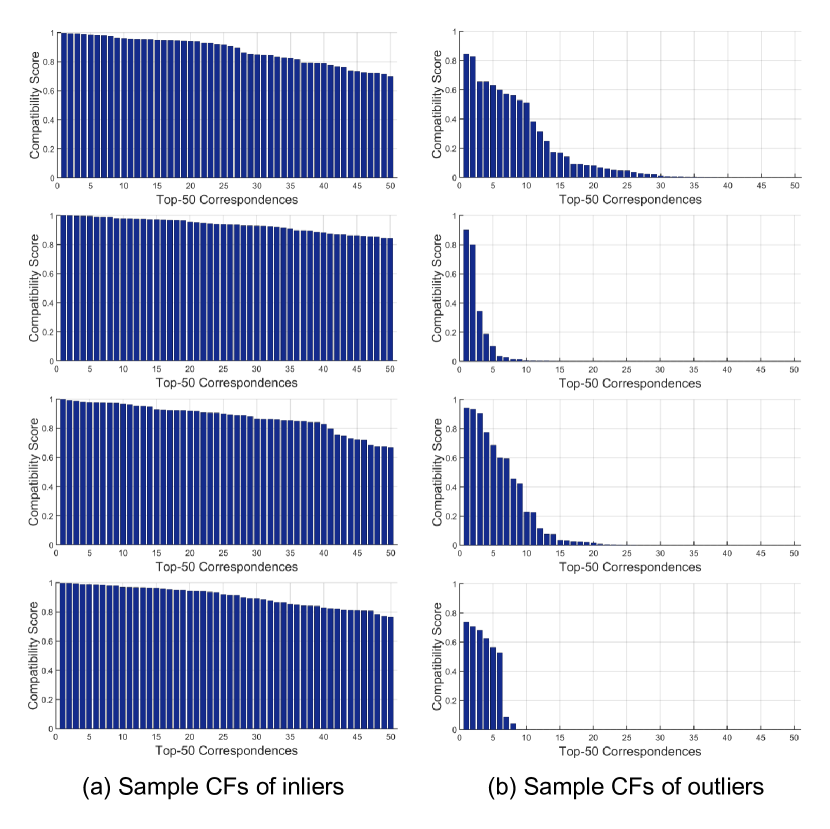
Assume that: 1) an ideal compatibility scoring metric is defined, which assigns ‘1’ to correspondence pairs composed by inliers and ‘0’ to those with at least one outlier, and 2) a proper is defined, we can obtain CF features with all elements being ‘1’ and ‘0’ for inliers and outliers, respectively. Hence, from the theoretic perspective, our proposed CF can be ultra distinctive. At present, robust compatibility metric definition for 3D correspondences is still an open issue [36] and estimating a proper appears to be a chicken-and-egg problem, resulting in noise in CF features. However, with the metric defined in Eq. 3 and an empirically determined (based on experiments in Sect. 4.2), our CF features, in real case, still hold strong distinctiveness, as shown in Fig. 4.
3.3 CF Classification
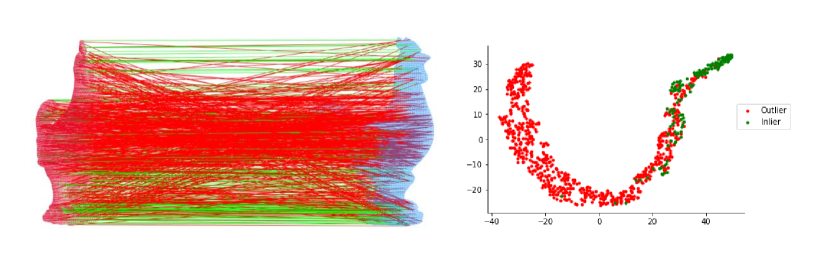
Finally, the 3D correspondence grouping problem boils down to a binary feature classification problem. In recent years, deep learning has achieved remarkable success in classification tasks [5, 10]. In addition, we find that classifying CF features in cases with low inlier ratios sometimes appears to be a non-linear classification problem. As shown in Fig. 5, the CF features of inliers and outliers cannot be linearly separated. Thus, we are motivated to employ a deep-learning classifier.
In particular, the MLP network is suffice to our task because CF feature vectors are inputs to the network. This makes the network ultra lightweight as compared with other networks for image correspondence problem [20, 38, 30], which is also demonstrated to be quite effective as will be verified in the experiments. The employed MLP network has 6 layers with 50, 128, 128, 64, 32, and 2 neurons, respectively. Regarding the loss function, we have considered both cross-entropy loss and focal loss [12] (Sect. 4.2). We note that the training samples of inliers and outliers are imbalanced for 3D correspondence grouping problem, and eventually we use focal loss to train our network.
| Dataset | Scenario | Nuisances | Modality | # Matching Pairs | Avg. inlier ratio | |
|---|---|---|---|---|---|---|
| U3M [19] | Registration | Limited overlap, self-occlusion | LiDAR | 496 | 0.1480 | |
| BMR [27] | Registration | Limited overlap, self-occlusion, real noise | Kinect | 485 | 0.0563 | |
| U3OR [17, 16] | Object recognition | Clutter, occlusion | LiDAR | 188 | 0.0809 | |
| BoD5 [27] | Object recognition | Clutter, occlusion, real noise, holes | Kinect | 43 | 0.1575 |
4 Experiments
This section presents the experimental setup, analysis and comparative results, along with necessary explanations.
4.1 Experimental Setup
4.1.1 Datasets
Four datasets are considered in our experiments, including UWA 3D modeling (U3M) [19], Bologna Mesh Registration (BMR) [27], UWA 3D object recognition (U3OR) [17, 16], and Bologna Dataset5 (BoD5) [27]. The main properties of experimental datasets are summarized in Table 1. These datasets have 1) different application scenarios, 2) a variety of nuisances, and 3) different data modalities, which can ensure a comprehensive evaluation. For each dataset, we use correspondence data generated by 75% matching pairs for training and the remaining for testing. Note that we will also test the generalization performance of our method without training a model for each dataset.
4.1.2 Metrics
Precision (P), Recall (R), and F-score (F) are popular metrics for evaluating the performance of correspondence grouping [38, 35, 34]. A correspondence is judged as correct if:
| (4) |
where is a distance threshold; and denote the ground-truth rotation matrix and translation vector, respectively. We set to 5 pr as in [35, 34]. The unit ‘pr’ denotes the point cloud resolution, i.e., the average shortest distance among neighboring points in the point cloud. Thus, precision is defined as:
| (5) |
and recall is defined as:
| (6) |
where , , and represent the grouped inlier set by a grouping method, the true inlier subset in the grouped inlier set, and the true inlier subset in the raw correspondence set. F-score is given by .
We note that 3D correspondence grouping methods are typically applied to rigid registration tasks, e.g., point cloud registration and 3D object recognition, which require sparse and accurate correspondences [7]. Thus, the precision performance is more critical to these practical applications.
4.1.3 Implementation Details
For our method, the compatibility check and CF feature exaction modules are implemented in the point cloud library (PCL) [25], and the MLP classifier is trained in PyTorch with a GTX1050 GPU. The network is optimized via stochastic gradient descent (SGD) with a learning rate of 0.02. All evaluated methods in [34] are compared in our experiments, including similarity score (SS), nearest neighbor similarity ratio (NNSR) [13], spectral technique (ST) [11], random sampling consensus (RANSAC) [6], geometric consistency (GC) [2], 3D Hough voting (3DHV) [31], game theory matching (GTM) [23], search of inliers (SI) [1], and consistency voting (CV) [36].
To generate 3D feature correspondences between point clouds, we employ the Harris 3D (H3D) detector [29] for keypoints detection and the signatures of histograms of orientations (SHOT) [32] descriptor for local geometric feature extraction. By matching SHOT descriptors via distance, we can obtain initial correspondences. It has been verified in [34] that H3D+SHOT can generate correspondences with different spatial distributions, different scales, and different inlier ratios, enabling a thorough evaluation.
4.2 Method Analysis
The following experiments were conducted on the U3M dataset (the largest scale one) to analyze the rationality, peculiarities, and parameters of our method.
Dimensionality of CF features The dimensionality of CF features is a key parameter of the proposed method. We test the performance of our method with being 10, 20, 50, 100, and 200, respectively. The results are shown in Table 2.
| 10 | 20 | 50 | 100 | 200 | |
| P | 0.8031 | 0.7625 | 0.7483 | 0.7386 | 0.7468 |
| R | 0.4754 | 0.5364 | 0.5308 | 0.5114 | 0.4870 |
| F | 0.5973 | 0.6298 | 0.6211 | 0.6044 | 0.5896 |
| # Epochs | 77 | 44 | 7 | 15 | 9 |
| CE(1:1) | CE(1:4) | CE(1:8) | CE(1:10) | CE(raw) | FL(1:1) | FL(1:4) | FL(1:8) | FL(1:10) | FL(raw) | |
|---|---|---|---|---|---|---|---|---|---|---|
| P | 0.2893 | 0.4149 | 0.5688 | 0.6120 | NC | 0.2431 | 0.4362 | 0.5510 | 0.6180 | 0.7483 |
| R | 0.8615 | 0.7828 | 0.6736 | 0.6439 | NC | 0.8827 | 0.7692 | 0.6877 | 0.6394 | 0.5308 |
| F | 0.4332 | 0.5424 | 0.6168 | 0.6275 | NC | 0.3812 | 0.5567 | 0.6118 | 0.6285 | 0.6210 |
The results indicate that and achieve the best and the second best performance, respectively. Thus, a proper is needed to maximize the distinctiveness between the CF features of inliers and outliers. In addition, we find that the network converges much faster with than other settings, and we set to 50 by default.
Focal loss vs. cross entropy
To prepare training data, we have two alternatives: using equal or imbalanced numbers of positive samples and negative samples. The later one is closer to real matching case. Here, we compare the cross entropy loss and focal loss when varying the ratio of positive sample count to negative sample count. The results are reported in Table 3.
One can see that the performance of both losses improves when ratio of positive samples to negative samples decreases from 1:1 to 1:10, and their gap is marginal. When more negative samples are included (i.e., all samples in raw training data), focal loss achieves better precision performance while the network with cross entropy loss fails to converge. As expected, focal loss is more suitable to 3D correspondence grouping problem where a large portion of training data are outliers.
Varying compatibility metrics A critical factor to the proposed CF features is the definition of compatibility metrics. In our defined compatibility metric (Eq. 3), both distance and angle constraints are considered. Here, we test the effect when using looser constraints, i.e., solely using either distance constraint or angle constraint, as shown in Table 4.
| Distance | Angle | Both | |
|---|---|---|---|
| P | 0.6443 | NC | 0.7483 |
| R | 0.6885 | NC | 0.5308 |
| F | 0.6657 | NC | 0.6211 |
It is interesting to see that using a slightly looser constraint (distance only) can achieve better F-score performance than using both constraints. However, when the constraint is too loose (angle only), the network cannot converge because the generated CF features are ambiguous. Because using both constraints achieves the best precision performance, which is preferred in most application scenarios, so we consider both constraints to define the compatibility metric.
PointNet vs. MLP As similar to some 2D correspondence methods [20, 30], directly setting the coordinates of correspondences as the input to networks can be another way for grouping. We tested the performance of using coordinate information for learning with PointNet [21] on testing data with and without arbitrary rotations. The results are reported in Table 5.
| PointNet | PointNet () | Ours | Ours () | |
|---|---|---|---|---|
| P | 0.3888 | 0.1290 | 0.7483 | 0.7483 |
| R | 0.0355 | 0.0018 | 0.5308 | 0.5308 |
| F | 0.0651 | 0.0035 | 0.6211 | 0.6211 |
| 490k | 490k | 490k | 490k | |
| P | 0.7653 | 0.7533 | 0.7558 | 0.7483 |
| R | 0.5130 | 0.5219 | 0.5199 | 0.5308 |
| F | 0.6142 | 0.6166 | 0.6160 | 0.6211 |
| # Epochs | 156 | 96 | 48 | 15 |
| SS | NNSR [13] | ST [11] | RANSAC [6] | GC [2] | 3DHV [31] | GTM [23] | SI [1] | CV [36] | CF (Ours) | |
|---|---|---|---|---|---|---|---|---|---|---|
| (a) U3M dataset | ||||||||||
| \rowcolorgreen!30P | 0.0374 | 0.1289 | 0.3984 | 0.5442 | 0.2920 | 0.1960 | 0.5285 | 0.0380 | 0.1092 | 0.7483 |
| R | 0.3819 | 0.4084 | 0.5833 | 0.8493 | 0.7499 | 0.6999 | 0.5987 | 0.9996 | 0.9839 | 0.5308 |
| F | 0.0681 | 0.1960 | 0.4734 | 0.6634 | 0.4203 | 0.3062 | 0.5614 | 0.0733 | 0.1966 | 0.6211 |
| (b) BMR dataset | ||||||||||
| \rowcolorgreen!30P | 0.0243 | 0.0606 | 0.2993 | 0.3737 | 0.1458 | 0.1492 | 0.3946 | 0.0350 | 0.0700 | 0.8575 |
| R | 0.3405 | 0.0967 | 0.3734 | 0.8178 | 0.5740 | 0.5049 | 0.3626 | 0.5522 | 0.9438 | 0.1529 |
| F | 0.0454 | 0.0745 | 0.3323 | 0.5129 | 0.2325 | 0.2304 | 0.3779 | 0.0658 | 0.1303 | 0.2596 |
| (c) BoD5 dataset | ||||||||||
| \rowcolorgreen!30P | 0.0474 | 0.1635 | 0.5660 | 0.5961 | 0.5207 | 0.3927 | 0.7022 | 0.0748 | 0.3593 | 0.5699 |
| R | 0.2024 | 0.1136 | 0.4086 | 0.8747 | 0.7559 | 0.8890 | 0.4556 | 0.7337 | 0.9869 | 0.4151 |
| F | 0.0768 | 0.1341 | 0.4746 | 0.7090 | 0.6166 | 0.5448 | 0.5527 | 0.1359 | 0.5268 | 0.4804 |
| (d) U3OR dataset | ||||||||||
| \rowcolorgreen!30 P | 0.0171 | 0.0724 | 0.1119 | 0.5812 | 0.1918 | 0.1190 | 0.4907 | 0.0143 | 0.0523 | 0.8641 |
| R | 0.4111 | 0.5296 | 0.1670 | 0.2442 | 0.6302 | 0.3537 | 0.5224 | 1.0000 | 0.9461 | 0.3196 |
| F | 0.0328 | 0.1274 | 0.1340 | 0.3438 | 0.2941 | 0.1781 | 0.5061 | 0.0282 | 0.0991 | 0.4666 |
Two observations can be made from the table. 1) PointNet with coordinates being the input achieves significantly worse performance than our MLP architecture with CF features being input. This is because the range of 3D real-world coordinate information is too large, which makes the network very difficult to mine the patterns within dataset. 2) Coordinates are sensitive to rotations, making the performance of PointNet even worse when the testing data undergoing rotations. By contrast, because our CF features consist of compatibility scores computed based on rotation-invariant constraints, making CF and the CF-based learning network rotation-invariant as well.
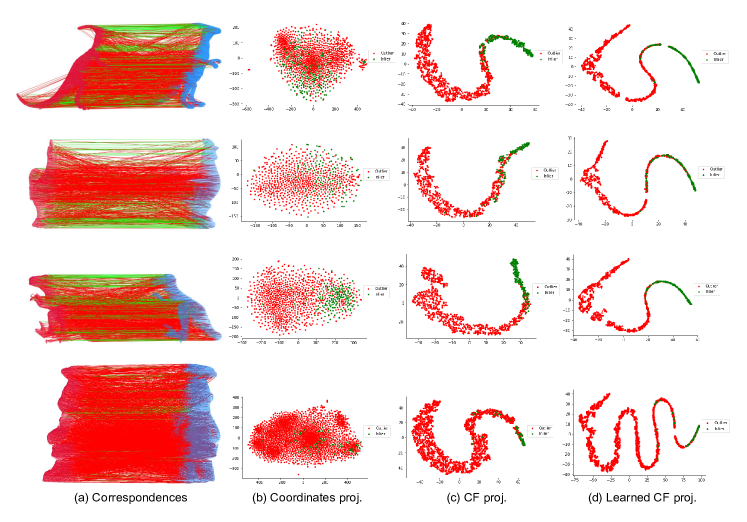
To further support our statement, we visualize some exemplar results of feature correspondences, projections of correspondence coordinates, CF features, and the features of the second last layer of MLP in Fig. 6. Obviously, one can hardly mine consistencies within inliers from the coordinate information. By contrast, CF features hold strong distinctiveness. In addition, learned CF features by MLP can further enhance the distinctiveness (the clusters of inliers and outliers in Fig. 6(d) are tighter than these in Fig. 6(c)).
Varying the amount of training data
The initial number of correspondences used for training in the U3M dataset is around 490k. We test the cases with less training data and report the results in Table 6.
The table suggests that our method behaves well even removing training data, while requiring much more training epochs. We note that dozens of point cloud pairs can generate correspondences at 490k level. As compared with methods relying over tens thousand of matching pairs [20, 38], our method can be trained with significantly less matching pairs.
4.3 Comparative Results & Visualization
Start-of-the-art comparison All evaluated methods in a recent evaluation [34] are compared with the proposed method on four experimental datasets. All methods are tested on the same testing data. The results are shown in Table 7.
| BMR | U3M+noise | U3M+simplification | ISS+FPFH | |
|---|---|---|---|---|
| P | 0.6928 | 0.7407 | 0.7088 | 0.7409 |
| R | 0.3241 | 0.4111 | 0.3247 | 0.4342 |
| F | 0.4416 | 0.5287 | 0.4454 | 0.5475 |
The following observations can be made from the table. 1) Our method achieves the best precision performance on the U3M, BMR, and U3OR dataset. Moreover, the gap between our method and the second best one is significant on the BMR and U3OR datasets. On the BoD5 dataset, our method is surpassed by GTM and RANSAC. However, this dataset is less challenging than the other three ones (Table 1). This indicates that our method can achieve superior precision performance especially on data with low inlier ratios. We also note that only 33 pairs of data are leveraged to train our network on the BoD5 dataset. 2) In terms of the recall performance, SI and CV, as two typical individual-based methods, achieve top-ranked performance. Unfortunately, their precision performance is quite limited. This could result in inaccurate and time-consuming rigid registration results due to heavy outliers in the grouped inlier set. We note that a looser geometric constraint can be used if a balance is needed between precision and recall (as verified in Table 4), indicating that our method is flexible. 3) Although the proposed method is an individual-based one, it is quite selective with superior precision performance. Notably, GTM appears to be the most selective method as evaluated by [34], while our method generally outperforms it by a large margin in terms of precision.
Generalization performance
We use the model trained on the initial U3M dataset to predict inliers on the following datasets: BMR dataset, variants of U3M datasets with 0.3 pr Gaussian noise, random data decimation, and “ISS detector [39] + FPFH descriptor [24]”, respectively. The results are shown in Table 8. One can see that the model trained on the U3M dataset also achieves decent performance when changing the testing dataset, injecting additional nuisances, and changing “detector-descriptor” combinations. This is potentially because the eventual results caused by above test conditions is the variation in inlier ratios, while our CF features can effectively mine the hidden consistencies of inliers and inconsistencies of outliers in different inlier ratio cases.
Visualization
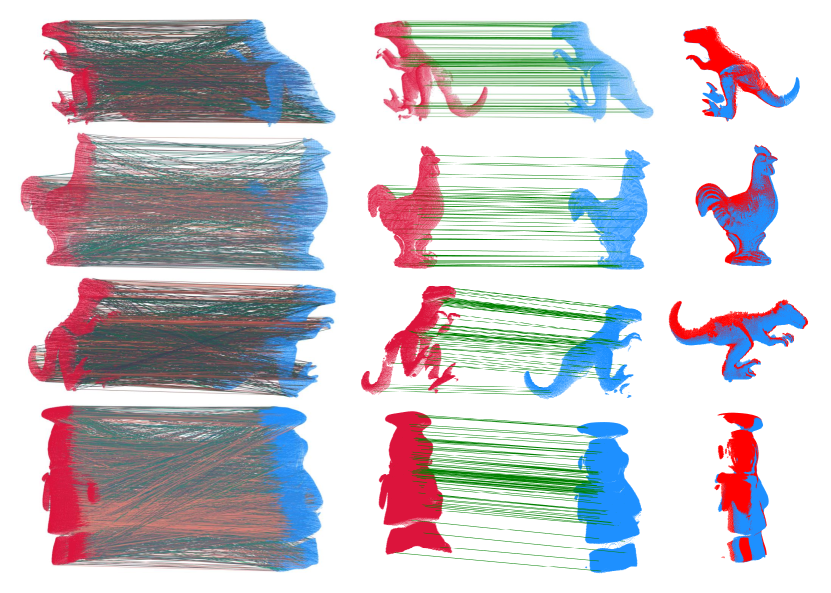
Finally, we give some visualization results of our method in Fig. 7. Two observations can be made. First, the colors of correspondences obtained by projecting CF features to 3D RGB space can reflect the consistency of inliers. Second, the grouped correspondences by our method are quite consistent and can achieve accurate 3D registration results.
5 Conclusion
We presented a novel representation to describe 3D feature correspondence named compatibility feature (CF), along with a CF-based 3D correspondence grouping method for 3D correspondence grouping. CF captures the main distinctiveness between inliers and outliers regarding pairwise geometrical compatibility, which is rotation-invariant as well. With CF features, a lightweight MLP network is able to classify them and achieve outstanding performance. Experiments on four standard datasets with a rich variety of application scenarios and nuisances paired with comparisons with nine state-of-the-art methods demonstrate the overall superiority of our method. We also find that the pipeline of our proposed CF-based 3D correspondence grouping method can be generalized to matching problems for many other data representations, such as 2D images and non-rigid point clouds/meshes, which remains an interesting future research direction.
References
- [1] Anders Glent Buch, Yang Yang, Norbert Krüger, and Henrik Gordon Petersen. In search of inliers: 3d correspondence by local and global voting. In Proc. IEEE Conference on Computer Vision and Pattern Recognition, pages 2075–2082. IEEE, 2014.
- [2] Hui Chen and Bir Bhanu. 3d free-form object recognition in range images using local surface patches. Pattern Recognition Letters, 28(10):1252–1262, 2007.
- [3] Christopher Choy, Wei Dong, and Vladlen Koltun. Deep global registration. In Proc. of the IEEE Conference on Computer Vision and Pattern Recognition, 2020.
- [4] Haowen Deng, Tolga Birdal, and Slobodan Ilic. Ppf-foldnet: Unsupervised learning of rotation invariant 3d local descriptors. In Proc. European Conference on Computer Vision, pages 602–618, 2018.
- [5] Jia Deng, Wei Dong, Richard Socher, Li-Jia Li, Kai Li, and Li Fei-Fei. Imagenet: A large-scale hierarchical image database. In Proc. IEEE Conference on Computer Vision and Pattern Recognition, pages 248–255. IEEE, 2009.
- [6] Martin A Fischler and Robert C Bolles. Random sample consensus: a paradigm for model fitting with applications to image analysis and automated cartography. Communications of the ACM, 24(6):381–395, 1981.
- [7] Yulan Guo, Mohammed Bennamoun, Ferdous Sohel, Min Lu, and Jianwei Wan. 3d object recognition in cluttered scenes with local surface features: A survey. IEEE Transactions on Pattern Analysis and Machine Intelligence, 36(11):2270–2287, 2014.
- [8] Yulan Guo, Ferdous Sohel, Mohammed Bennamoun, Min Lu, and Jianwei Wan. Rotational projection statistics for 3d local surface description and object recognition. International Journal of Computer Vision, 105(1):63–86, 2013.
- [9] Andrew Edie Johnson and Martial Hebert. Surface matching for object recognition in complex three-dimensional scenes. Image and Vision Computing, 16(9):635–651, 1998.
- [10] Alex Krizhevsky, Ilya Sutskever, and Geoffrey E Hinton. Imagenet classification with deep convolutional neural networks. In Advances in Neural Information Processing Systems, pages 1097–1105, 2012.
- [11] Marius Leordeanu and Martial Hebert. A spectral technique for correspondence problems using pairwise constraints. In Proc. International Conference on Computer Vision, volume 2, pages 1482–1489. IEEE, 2005.
- [12] Tsung Yi Lin, Priya Goyal, Ross Girshick, Kaiming He, and Piotr Dollar. Focal loss for dense object detection. IEEE Transactions on Pattern Analysis and Machine Intelligence, PP(99):2999–3007, 2017.
- [13] David G Lowe. Distinctive image features from scale-invariant keypoints. International Journal of Computer Vision, 60(2):91–110, 2004.
- [14] Jiayi Ma, Xingyu Jiang, Junjun Jiang, Ji Zhao, and Xiaojie Guo. Lmr: Learning a two-class classifier for mismatch removal. IEEE Transactions on Image Processing, 28(8):4045–4059, 2019.
- [15] Laurens van der Maaten and Geoffrey Hinton. Visualizing data using t-sne. Journal of Machine Learning Research, 9(Nov):2579–2605, 2008.
- [16] Ajmal Mian, Mohammed Bennamoun, and Robyn Owens. On the repeatability and quality of keypoints for local feature-based 3d object retrieval from cluttered scenes. International Journal of Computer Vision, 89(2-3):348–361, 2010.
- [17] Ajmal S Mian, Mohammed Bennamoun, and Robyn Owens. Three-dimensional model-based object recognition and segmentation in cluttered scenes. IEEE Transactions on Pattern Analysis and Machine Intelligence, 28(10):1584–1601, 2006.
- [18] Ajmal S Mian, Mohammed Bennamoun, and Robyn A Owens. Automatic correspondence for 3d modeling: an extensive review. International Journal of Shape Modeling, 11(02):253–291, 2005.
- [19] Ajmal S Mian, Mohammed Bennamoun, and Robyn A Owens. A novel representation and feature matching algorithm for automatic pairwise registration of range images. International Journal of Computer Vision, 66(1):19–40, 2006.
- [20] Kwang Moo Yi, Eduard Trulls, Yuki Ono, Vincent Lepetit, Mathieu Salzmann, and Pascal Fua. Learning to find good correspondences. In Proc. IEEE Conference on Computer Vision and Pattern Recognition, pages 2666–2674, 2018.
- [21] Charles R Qi, Hao Su, Kaichun Mo, and Leonidas J Guibas. Pointnet: Deep learning on point sets for 3d classification and segmentation. In Proc. IEEE Conference on Computer Vision and Pattern Recognition, pages 652–660, 2017.
- [22] Siwen Quan and Jiaqi Yang. Compatibility-guided sampling consensus for 3-d point cloud registration. IEEE Transactions on Geoscience and Remote Sensing, pages 1–13, 2020.
- [23] Emanuele Rodolà, Andrea Albarelli, Filippo Bergamasco, and Andrea Torsello. A scale independent selection process for 3d object recognition in cluttered scenes. International Journal of Computer Vision, 102(1-3):129–145, 2013.
- [24] Radu Bogdan Rusu, Nico Blodow, and Michael Beetz. Fast point feature histograms (fpfh) for 3d registration. In Proc. IEEE International Conference on Robotics and Automation, pages 3212–3217, 2009.
- [25] Radu Bogdan Rusu and Steve Cousins. 3d is here: Point cloud library (pcl). In Proc. IEEE International Conference on Robotics and Automation, pages 1–4, 2011.
- [26] Hamdi M Sahloul, Shouhei Shirafuji, and Jun Ota. An accurate and efficient voting scheme for a maximally all-inlier 3d correspondence set. IEEE Transactions on Pattern Analysis and Machine Intelligence, 2020.
- [27] Samuele Salti, Federico Tombari, and Luigi Di Stefano. Shot: Unique signatures of histograms for surface and texture description. Computer Vision and Image Understanding, 125:251–264, 2014.
- [28] Paul-Edouard Sarlin, Daniel DeTone, Tomasz Malisiewicz, and Andrew Rabinovich. Superglue: Learning feature matching with graph neural networks. arXiv preprint arXiv:1911.11763, 2019.
- [29] Ivan Sipiran and Benjamin Bustos. Harris 3d: a robust extension of the harris operator for interest point detection on 3d meshes. The Visual Computer, 27(11):963–976, 2011.
- [30] Weiwei Sun, Wei Jiang, Eduard Trulls, Andrea Tagliasacchi, and Kwang Moo Yi. Acne: Attentive context normalization for robust permutation-equivariant learning. In Proceedings of the IEEE/CVF Conference on Computer Vision and Pattern Recognition, pages 11286–11295, 2020.
- [31] Federico Tombari and Luigi Di Stefano. Object recognition in 3d scenes with occlusions and clutter by hough voting. In Proc. Pacific-Rim Symposium on Image and Video Technology, pages 349–355. IEEE, 2010.
- [32] Federico Tombari, Samuele Salti, and Luigi Di Stefano. Unique signatures of histograms for local surface description. In Proc. European Conference on Computer Vision, pages 356–369. 2010.
- [33] Jiaqi Yang, Zhiguo Cao, and Qian Zhang. A fast and robust local descriptor for 3d point cloud registration. Information Sciences, 346:163–179, 2016.
- [34] Jiaqi Yang, Ke Xian, Peng Wang, and Yanning Zhang. A performance evaluation of correspondence grouping methods for 3d rigid data matching. IEEE Transactions on Pattern Analysis and Machine Intelligence, 2019 (DOI: 10.1109/TPAMI.2019.2960234).
- [35] Jiaqi Yang, Ke Xian, Yang Xiao, and Zhiguo Cao. Performance evaluation of 3d correspondence grouping algorithms. In Proc. International Conference on 3D Vision, pages 467–476. IEEE, 2017.
- [36] Jiaqi Yang, Yang Xiao, Zhiguo Cao, and Weidong Yang. Ranking 3d feature correspondences via consistency voting. Pattern Recognition Letters, 117:1–8, 2019.
- [37] Jiahui Zhang, Dawei Sun, Zixin Luo, Anbang Yao, Lei Zhou, Tianwei Shen, Yurong Chen, Long Quan, and Hongen Liao. Learning two-view correspondences and geometry using order-aware network. In Proc. IEEE International Conference on Computer Vision, pages 5845–5854, 2019.
- [38] Chen Zhao, Zhiguo Cao, Chi Li, Xin Li, and Jiaqi Yang. Nm-net: Mining reliable neighbors for robust feature correspondences. In Proc. IEEE Conference on Computer Vision and Pattern Recognition, pages 215–224, 2019.
- [39] Yu Zhong. Intrinsic shape signatures: A shape descriptor for 3d object recognition. In Proc. International Conference on Computer Vision Workshops, pages 689–696. IEEE, 2009.