Evidence for dominant phonon-electron scattering in Weyl semimetal WP2
Abstract
Topological semimetals have revealed a wide array of novel transport phenomena, including electron hydrodynamics, quantum field theoretic anomalies, and extreme magnetoresistances and mobilities. However, the scattering mechanisms central to these behaviors remain largely unexplored. Here we reveal signatures of significant phonon-electron scattering in the type-II Weyl semimetal WP2 via temperature dependent Raman spectroscopy. Over a large temperature range, we find that the decay rates of the lowest energy modes are dominated by phonon-electron rather than phonon-phonon scattering. In conjunction with first-principles calculations, a combined analysis of the momentum, energy, and symmetry-allowed decay paths indicates this results from intraband scattering of the electrons. The excellent agreement with theory further suggests that such results could be true for the acoustic modes. We thus provide evidence for the importance of phonons in the transport properties of topological semimetals and identify specific properties that may contribute to such behavior in other materials.
Topological semimetals display a range of novel transport phenomena, including enormous magnetoresistance and mobilitiesShekhar et al. (2015); Wang et al. (2016); Kumar et al. (2017); Ali et al. (2014). Observations of such behavior in topological systems suggested the quantum geometry of the electronic bands was a crucial ingredient. However, non-topological semimetals such as LaAs or PtSn4 have revealed similarly remarkable magnetoresistances and mobilitiesYang et al. (2017); Mun et al. (2012); Du et al. (2018), suggesting that these properties are more endemic to semimetals in general, with some proposing the primary factor is the near-perfect electron-hole compensationYang et al. (2017). In addition, there is often enormous variation in the temperature dependence of these properties, indicating that temperature dependent scattering processes, such as those provided by electron-phonon coupling, are important.
The transition metal dipnictide WP2 is an ideal semimetal in which to study the role of coupling between the electron and phonon systems. The topological phase, WP2, displays the largest magnetoresistance of any topological semimetalKumar et al. (2017), with hints of hydrodynamic behavior at low temperaturesGooth et al. (2018). In WP2 the resistivity decreases, while the mobility increases, by four and five orders of magnitude respectively between room temperature and 2 KKumar et al. (2017). Over the temperature range where the majority of this change occurs the resistivity appears to be dominated by electron-phonon scatteringKumar et al. (2017); Jaoui et al. (2018). Previous computational works also suggested that electron-phonon coupling plays a large role in determining the macroscopic transport properties of WP2Coulter et al. (2018).
An important and related consideration is the phonon-electron scattering, i.e. the scattering of phonons by electrons. Phonon-electron scattering rates are a critical ingredient in the formation of a combined electron and phonon “fluid” which precipitates hydrodynamic behaviorLevchenko and Schmalian (2020); Varnavides et al. (2020). Such scattering is of considerable import when evaluating the lattice’s effect on transport properties. For example, if phonon-electron scattering rates exceed phonon-phonon rates, momentum lost to phonons may be returned to the charge carriers, leading to an enhanced conductancePeierls (1932); Wiser (1984); Varnavides et al. (2020). Evidence for strong phonon-electron coupling in topological semimetals (TSM) has been primarily reported via optical spectroscopies that directly probe the system’s phononsCoulter et al. (2019); Xu et al. (2017); Zhang et al. (2019); Sharafeev et al. (2017). However it is unclear what combination of factors contribute to the phonon-electron scattering and thus its role in the transport behavior of TSMs. To this end we performed a combined experimental, computational, and theoretical investigation of the phonon-electron coupling in WP2. Using Raman spectroscopy, first principles calculations, and symmetry analysis, we provide evidence that intraband phonon-electron scattering dominates over phonon-phonon scattering over a wide temperature range. The ab-initio calculations further elucidate the roles played by the relative phase space and phonon-electron coupling strength in the dominance of phonon-electron scattering. As such our work guides future efforts to understand and optimize novel transport phenomena in semimetals.
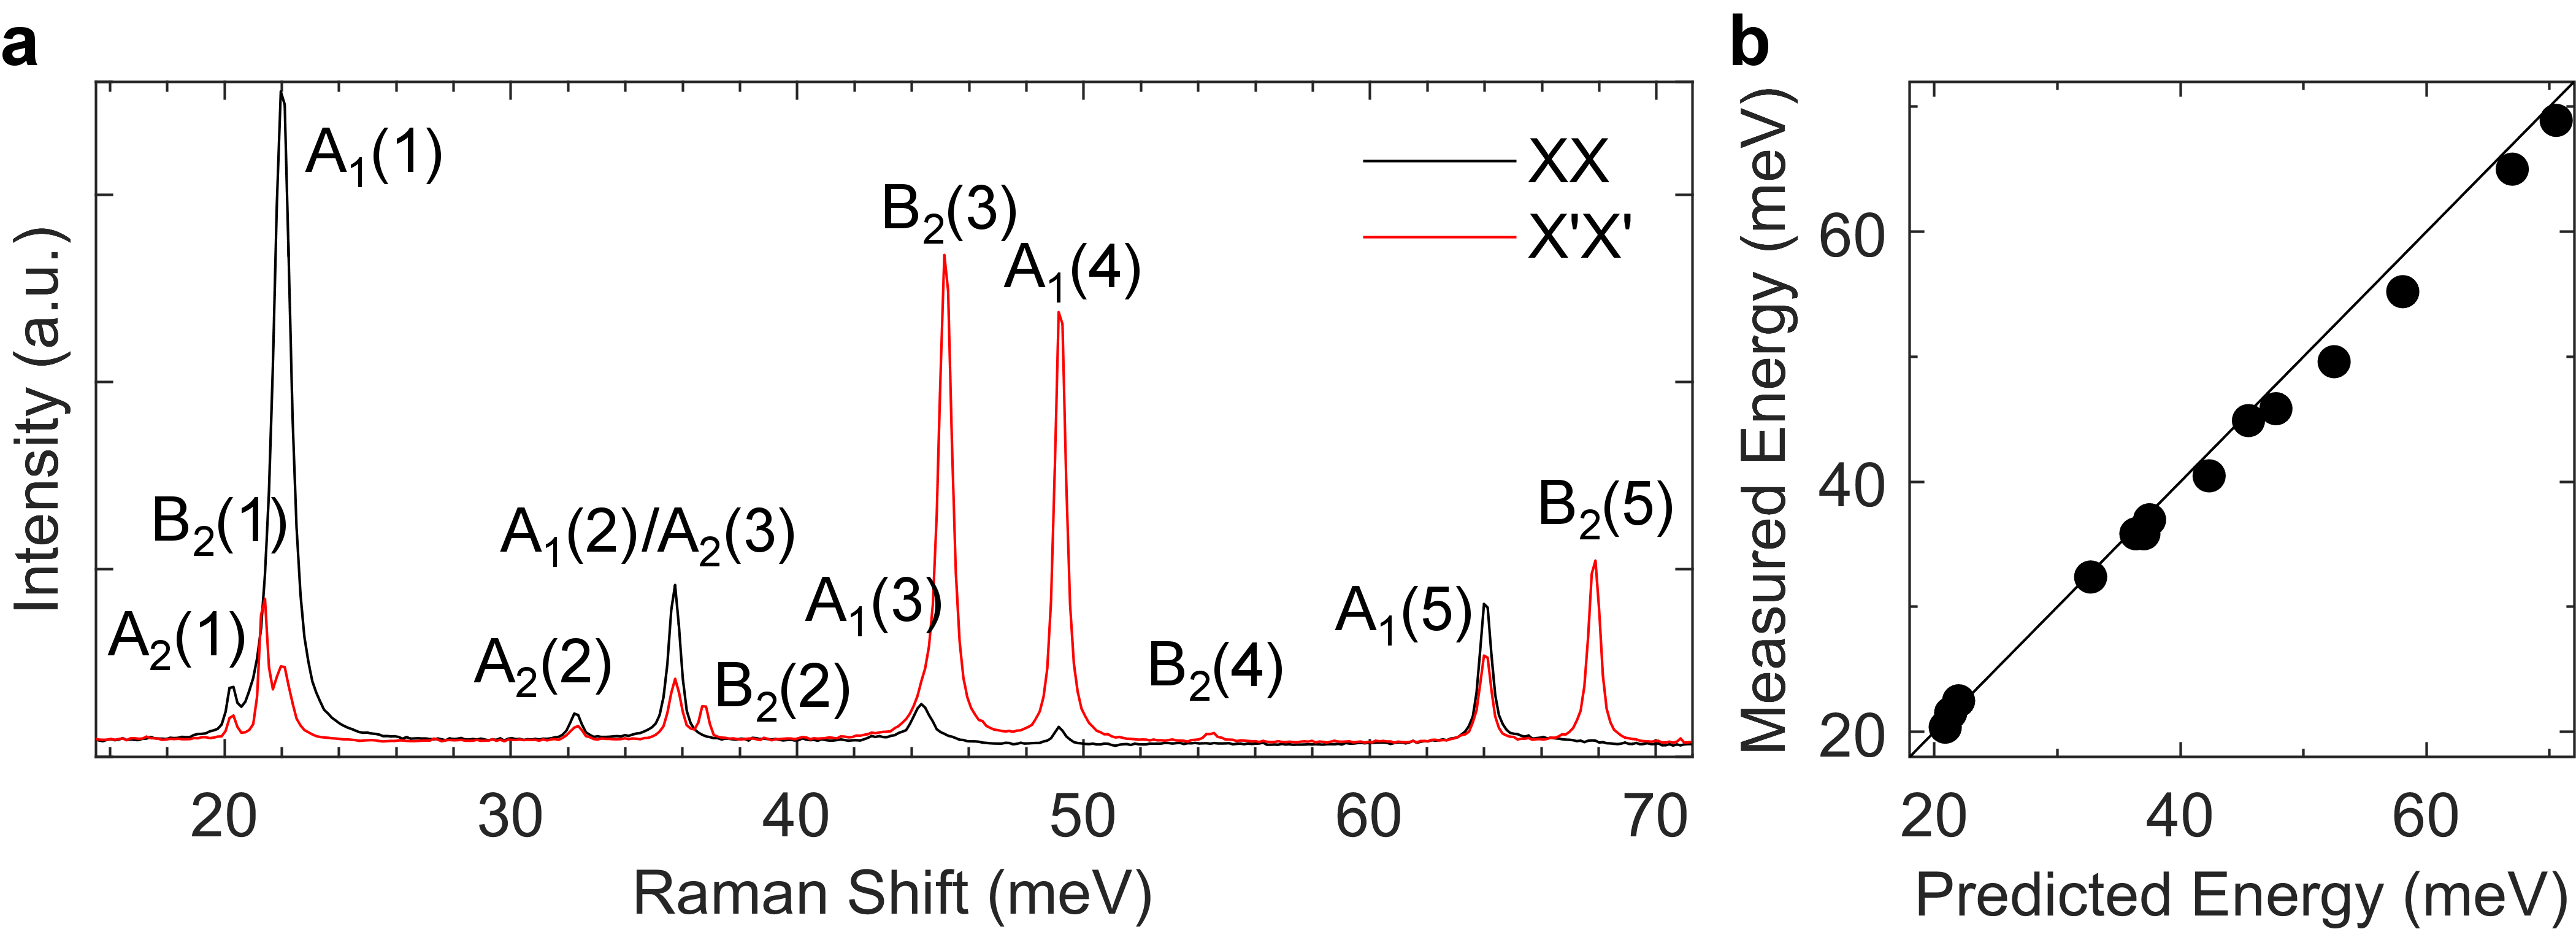
We utilized Raman spectroscopy due to its sensitivity to symmetry, high energy resolution, and the prevalence of phonon-electron coupling signatures in Raman spectra of other TSMsCoulter et al. (2019); Xu et al. (2017); Zhang et al. (2019); Sharafeev et al. (2017). As the role of symmetry has so far been largely overlooked, we begin by considering in detail the symmetry properties of WP2. The orthorhombic, nonsymmorphic space group , leads to a total of 18 phonon modes. The 15 optical modes are all Raman active and a group theoretical analysisKroumova et al. (2003) gives the irreducible representations 5, 3, 2, and 5. In Fig. 1a we show the room temperature Raman spectra of an as-grown WP2 crystal surface measured in XX and X′X′ polarization configurations, revealing 14 of the 15 optical modes. The full polarization dependence yields the mode assignments shown in Fig. 1a, which are consistent with previous studiesSu et al. (2019); Wulferding et al. (2020)(Supplemental Table 1). In Fig. 1b we show our measured versus computationally predicted mode energies. The solid diagonal line indicates ideal agreement, and the reported values all fall within 3% of this line.
We begin our search for signatures of phonon-electron coupling in the temperature dependence of the phonon energies. Typically the phonon energy decreases as the temperature is raised due to a combination of lattice expansion and anharmonic renormalizationBalkanski et al. (1983); Tian et al. (2017). The temperature dependent Raman spectra shown in Fig. 2a reveal behavior consistent with this, with all observed modes shifting to lower energies as the temperature is increased from 10 to 300 K. A previous report indicated an anomalous decrease in mode energies below 25 KWulferding et al. (2020), which was interpreted as evidence for phonon-electron coupling. In an initial run of low temperature measurements we observed similar behavior (see Supplementary Note 5). However, in subsequent measurements we found this anomolous softening was removed by allowing more time for the WP2 crystals to come to thermal equilibrium with the cryostat at each temperature.
To extract the quantitative behavior of the phonon energies and linewidths we fit each mode with a Voigt profile. While an asymmetric lineshape can be an indication of phonon-electron couplingXu et al. (2017); Fano (1961), we did not observe this in any WP2 mode. Such behavior requires an overlap in energy between an electronic continuum and the discrete phonon state. However the electronic Raman scattering (a quasi-elastic peak)Wulferding et al. (2020) appears below the energy of the optical phonons. In Fig. 2b we plot the percent change of each mode’s energy and observe that, while most of the modes display changes below 1%, the lowest energy mode shifts by almost 2%. While this could be a sign of phonon-electron coupling, the temperature dependence of phonon energies contains contributions from multiple sources, so unambiguous interpretation is challengingTian et al. (2017). We therefore turn to inspection of the phonon linewidths which only contain information related to the decay paths available to the phonon modeBalkanski et al. (1983); Coulter et al. (2019).
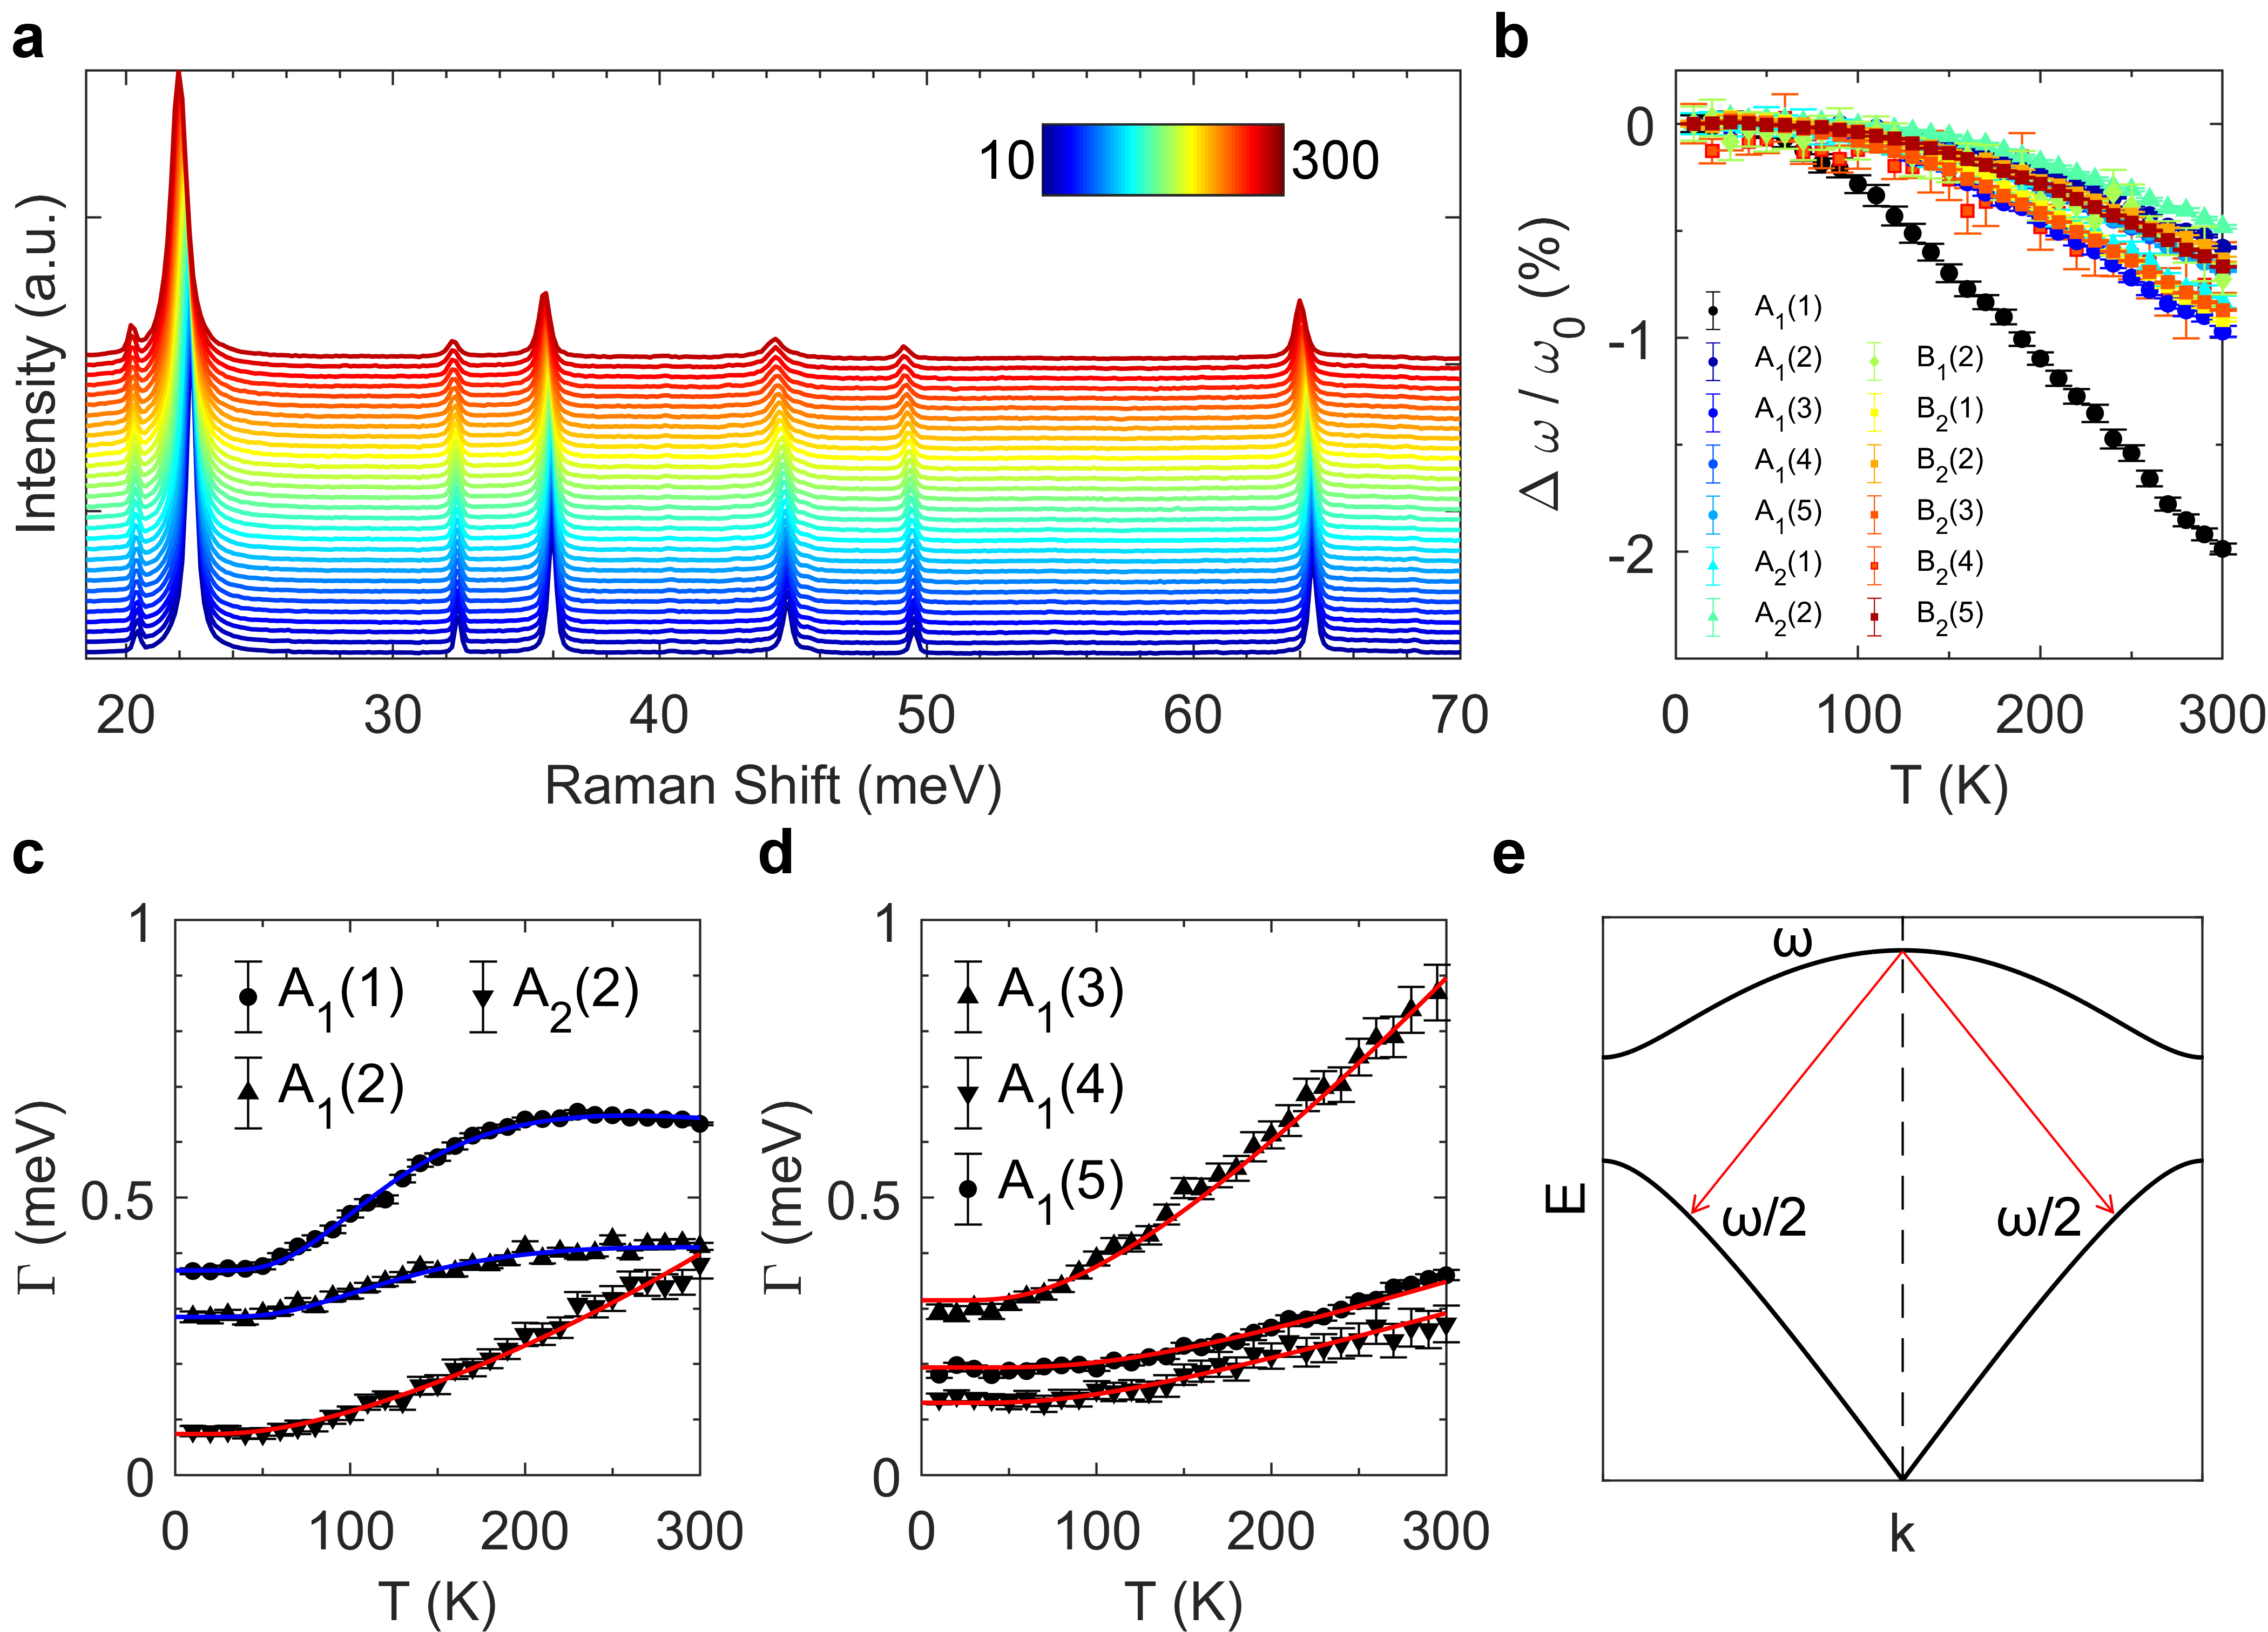
The temperature dependent linewidths of the two lowest energy modes are plotted in Fig. 2c. At temperatures below K, the mode’s linewidth maintains a nearly constant value of 0.36 meV. Above this temperature the linewidth grows rapidly, reaching a maximum value of meV at K, before slowly decreasing as it approaches room temperature. Though not as dramatically, similar behavior is also seen in the linewidth. This type of behavior is distinct from that predicted by phonon decay into acoustic phononsKlemens (1966), as depicted in Fig. 2e. In the Klemens’ model, an optical phonon of frequency is assumed to decay into two acoustic phonons of energy and momentum to satisfy both energy and momentum conservation. The inclusion of higher order processes in which an optical phonon decays into three acoustic phonons () constitutes the extended Klemens’ modelBalkanski et al. (1983); Tian et al. (2017). Due to the bosonic nature of phonons, the temperature dependence in both these models is governed by the Bose-Einstein distribution function . Therefore, the linewidth predicted by this model monotonically increases with temperature, a trend that is not displayed by the or modes. We instead identify their temperature dependence as resulting from decay into electron-hole pairs near the Fermi surfaceCoulter et al. (2019).
Linewidths indicative of optical phonon decay into electron-hole pairs have previously been observed in the semimetals TaAsXu et al. (2017); Coulter et al. (2019), NbAsCoulter et al. (2019), MoTe2Zhang et al. (2019), graphiteGiura et al. (2012); Liu et al. (2019) and Cd3As2Sharafeev et al. (2017). The model developed to describe such behavior assumes an optical phonon with decays into an electron-hole pair via an interband transition. The decay rate therefore depends on the difference in occupation functions between the electron and hole statesLazzeri et al. (2006). Since it is assumed the initial state is below and therefore occupied, the model developed for graphene predicts a linewidth monotonically decreasing as temperature is raised due to the occupancy change of the filled and empty states, accounted for by Fermi functions (). We modified this account for the nearly parallel spin-orbit split bands of WP2: , where is the energy of the optical phonon, and captures the distance between and the initial state of the electron (see Fig. 3a, additional details in Supplementary Note 7). The inclusion of the term can result in a non-monotonic temperature dependent behavior because at low temperature the empty initial state prevents the transition. As the temperature is raised the initial state becomes thermally populated and the decay processes turns on. The solid blue lines in Fig. 2c are the results of fitting this model to our measured linewidths, and over the entire measured temperature range it reproduces our experimental data very well. From the fits we find values of 24.48 meV and 22.64 meV for the and modes, respectively, consistent with transitions close to the Fermi level.
Having identified the mechanism responsible for the anomalous behavior in the lowest two energy modes, we turn to the mode whose energy is between the and modes. As can be seen in Fig. 2c, the linewidth of this mode does not display any anomalous behavior, and instead follows the dependence expected from the model of anharmonic decay. A fit to the data using the extended Klemens’ model, plotted as a solid red line, captures the observed trend and confirms this assessment. This observation suggests that the symmetry of the phonon mode plays is central to whether it decays into electron-hole pairs or other phonons. This is further supported by the lack of anomalous behavior in the or modes (see Supplementary Note 6). However, symmetry is unlikely to be the only determining factor, as evidenced by the linewidths for the three higher energy modes plotted in Fig. 2d. Despite sharing the same symmetry, these three modes display behavior consistent with the anharmonic model of decay. Taken together, these observations indicate both symmetry and energy of the optical phonon are factors in determining its primary decay channels. As discussed later, the availability of phonon decay paths, the phonon-electron coupling strength, and momentum conservation also contribute.
To understand the role of phonon energy, we turn to the available phase space for decay into electron-hole pairs. In Fig. 3a we show the calculated electronic band structure for WP2 within eV of the Fermi level, which agrees with previous workAutès et al. (2016); Coulter et al. (2018). Along the (), ( Y), and C (Y C0) cuts the gaps between neighboring bands appear to be on an energy scale similar to the optical phonons. To confirm this, Fig. 3c shows a low-temperature weighted joint-density of states (JDOS) (see Methods) for vertical () transitions between states within an optical phonon energy (70 meV) of . Available transitions exist across the entire range, with the largest JDOS occurring between 40 and 60 meV. The modes that display phonon-electron dominated linewidths have energies of 22.4 and 35.8 meV which have a comparatively smaller electronic JDOS. By contrast, the modes that fall in the 40–60 meV range display linewidths governed by anharmonic decay, indicating the availability of electronic states is not the largest contributing factor to the phonon linewidths. As discussed later, we find that momentum conservation is also required to understand the difference between these modes.
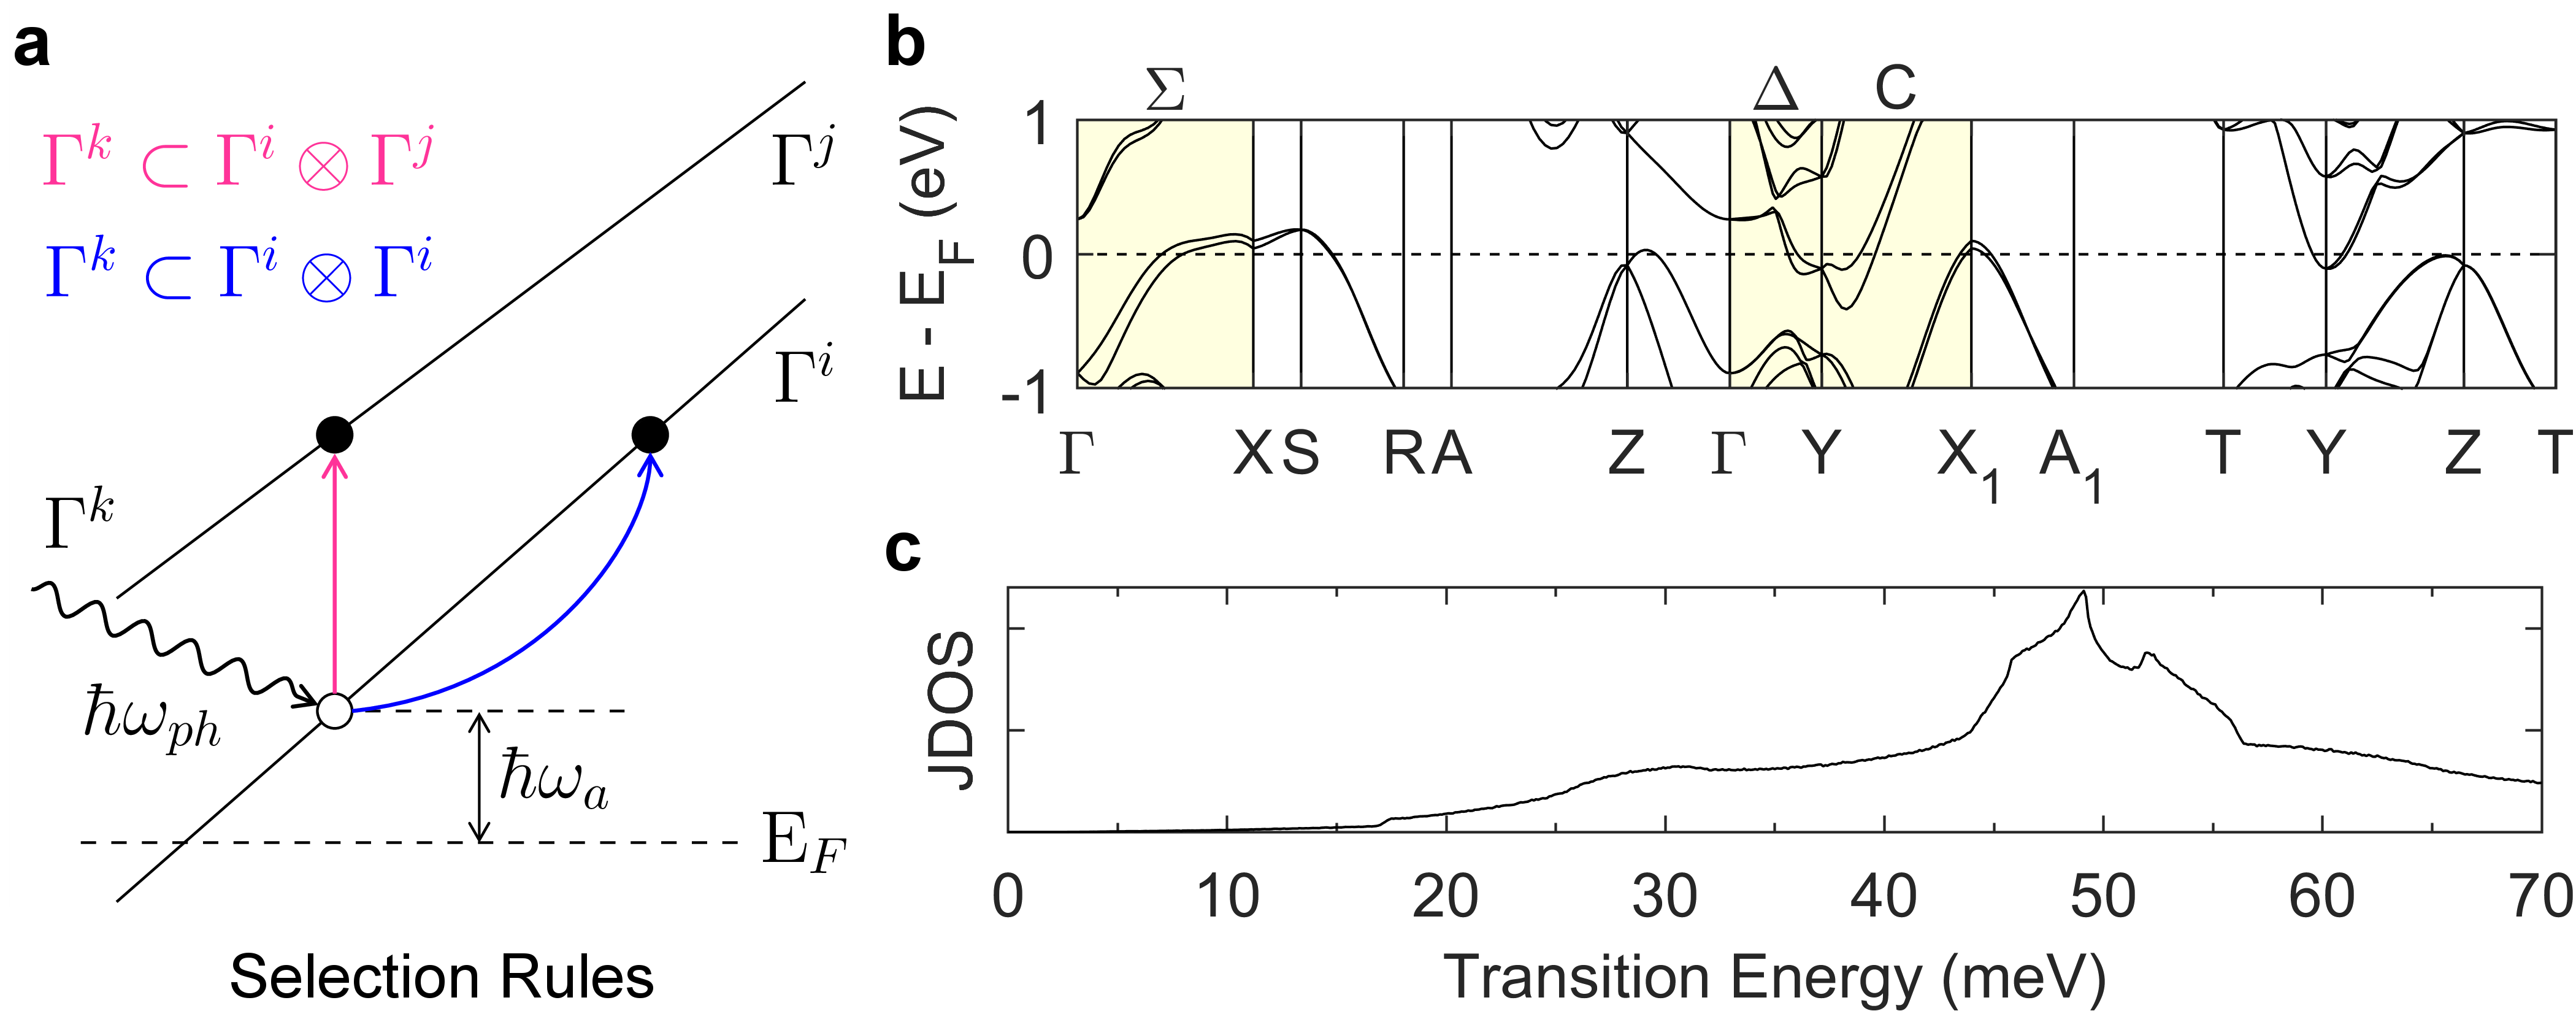
Before addressing momentum conservation, it is instructive to consider the phonon symmetry via the selection rules for transitions between electronic bands. Due to lattice symmetries there are only certain high symmetry points and lines that will allow transitions by phonons to occur. The and C cuts which both allow these transitions and intersect the Fermi surface are shaded in Fig. 3a. The irreducible representations of the electronic bands along these cuts may be found from compatibility relationsBirman (1962); Chen et al. (1968) as summarized in Table 1 and described in detail in the Supplementary information. Due to the inclusion of spin-orbit coupling, all of the electronic bands belong to representations from the double space group, indicated by a bar. By decomposing the direct products of the band representations, we identified the selection rules for phonon decay into both interband and intraband electron-hole pairs. This is schematically depicted in Fig. 3a. Summarizing our results, we find that phonons of , or ( or respectively) symmetry can produce interband transitions, while intraband transitions can result from , and phonons. These selection rules show that the and linewidth behavior observed in Fig. 2c must arise from the creation of electron-hole pairs within the same band. By necessity, this requires phonons of non-zero , a key detail which indicates we must now consider whether momentum conservation can be satisfied under our experimental conditions.
| Y | C | |||
|---|---|---|---|---|
| (1) | C(2) | |||
| Y(2) | C(1) | |||
| Y(3) | C(1) | |||
| Y(4) | C(2) | |||
We now consider whether the photons used in our Raman experiments can provide the finite required for the phonons to decay into electron-hole pairs. Near the Fermi energy we assume the electronic bands are approximately linearYao et al. (2019), with a slope given by the experimentally measured Fermi velocitiesGooth et al. (2018). The momentum obtained thus depends on the specific electron or hole pocket under consideration (see Supplementary Note 10 for details of the calculation), but for the and phonons we find and , respectively. In the backscattering configuration the transferred momentum is found from the relation , where is the wavelength dependent index of refraction for the th crystal direction, and is the wavelength of the optical excitation. We use the calculated index of refraction (see Supplementary Note 11), and find . We therefore see that the momentum provided by the laser is enough to produce phonons capable of intraband transitions. While it does fall short for the phonon, we note that uncertainties in the experimental and calculated values, and the finite angles of incidence from our high NA objective could accommodate this discrepancy. Regardless, it is clear that the momentum necessary for an intraband transition by the higher energy modes, which we estimate would have a minimum value of , is unable to be provided by our laser.
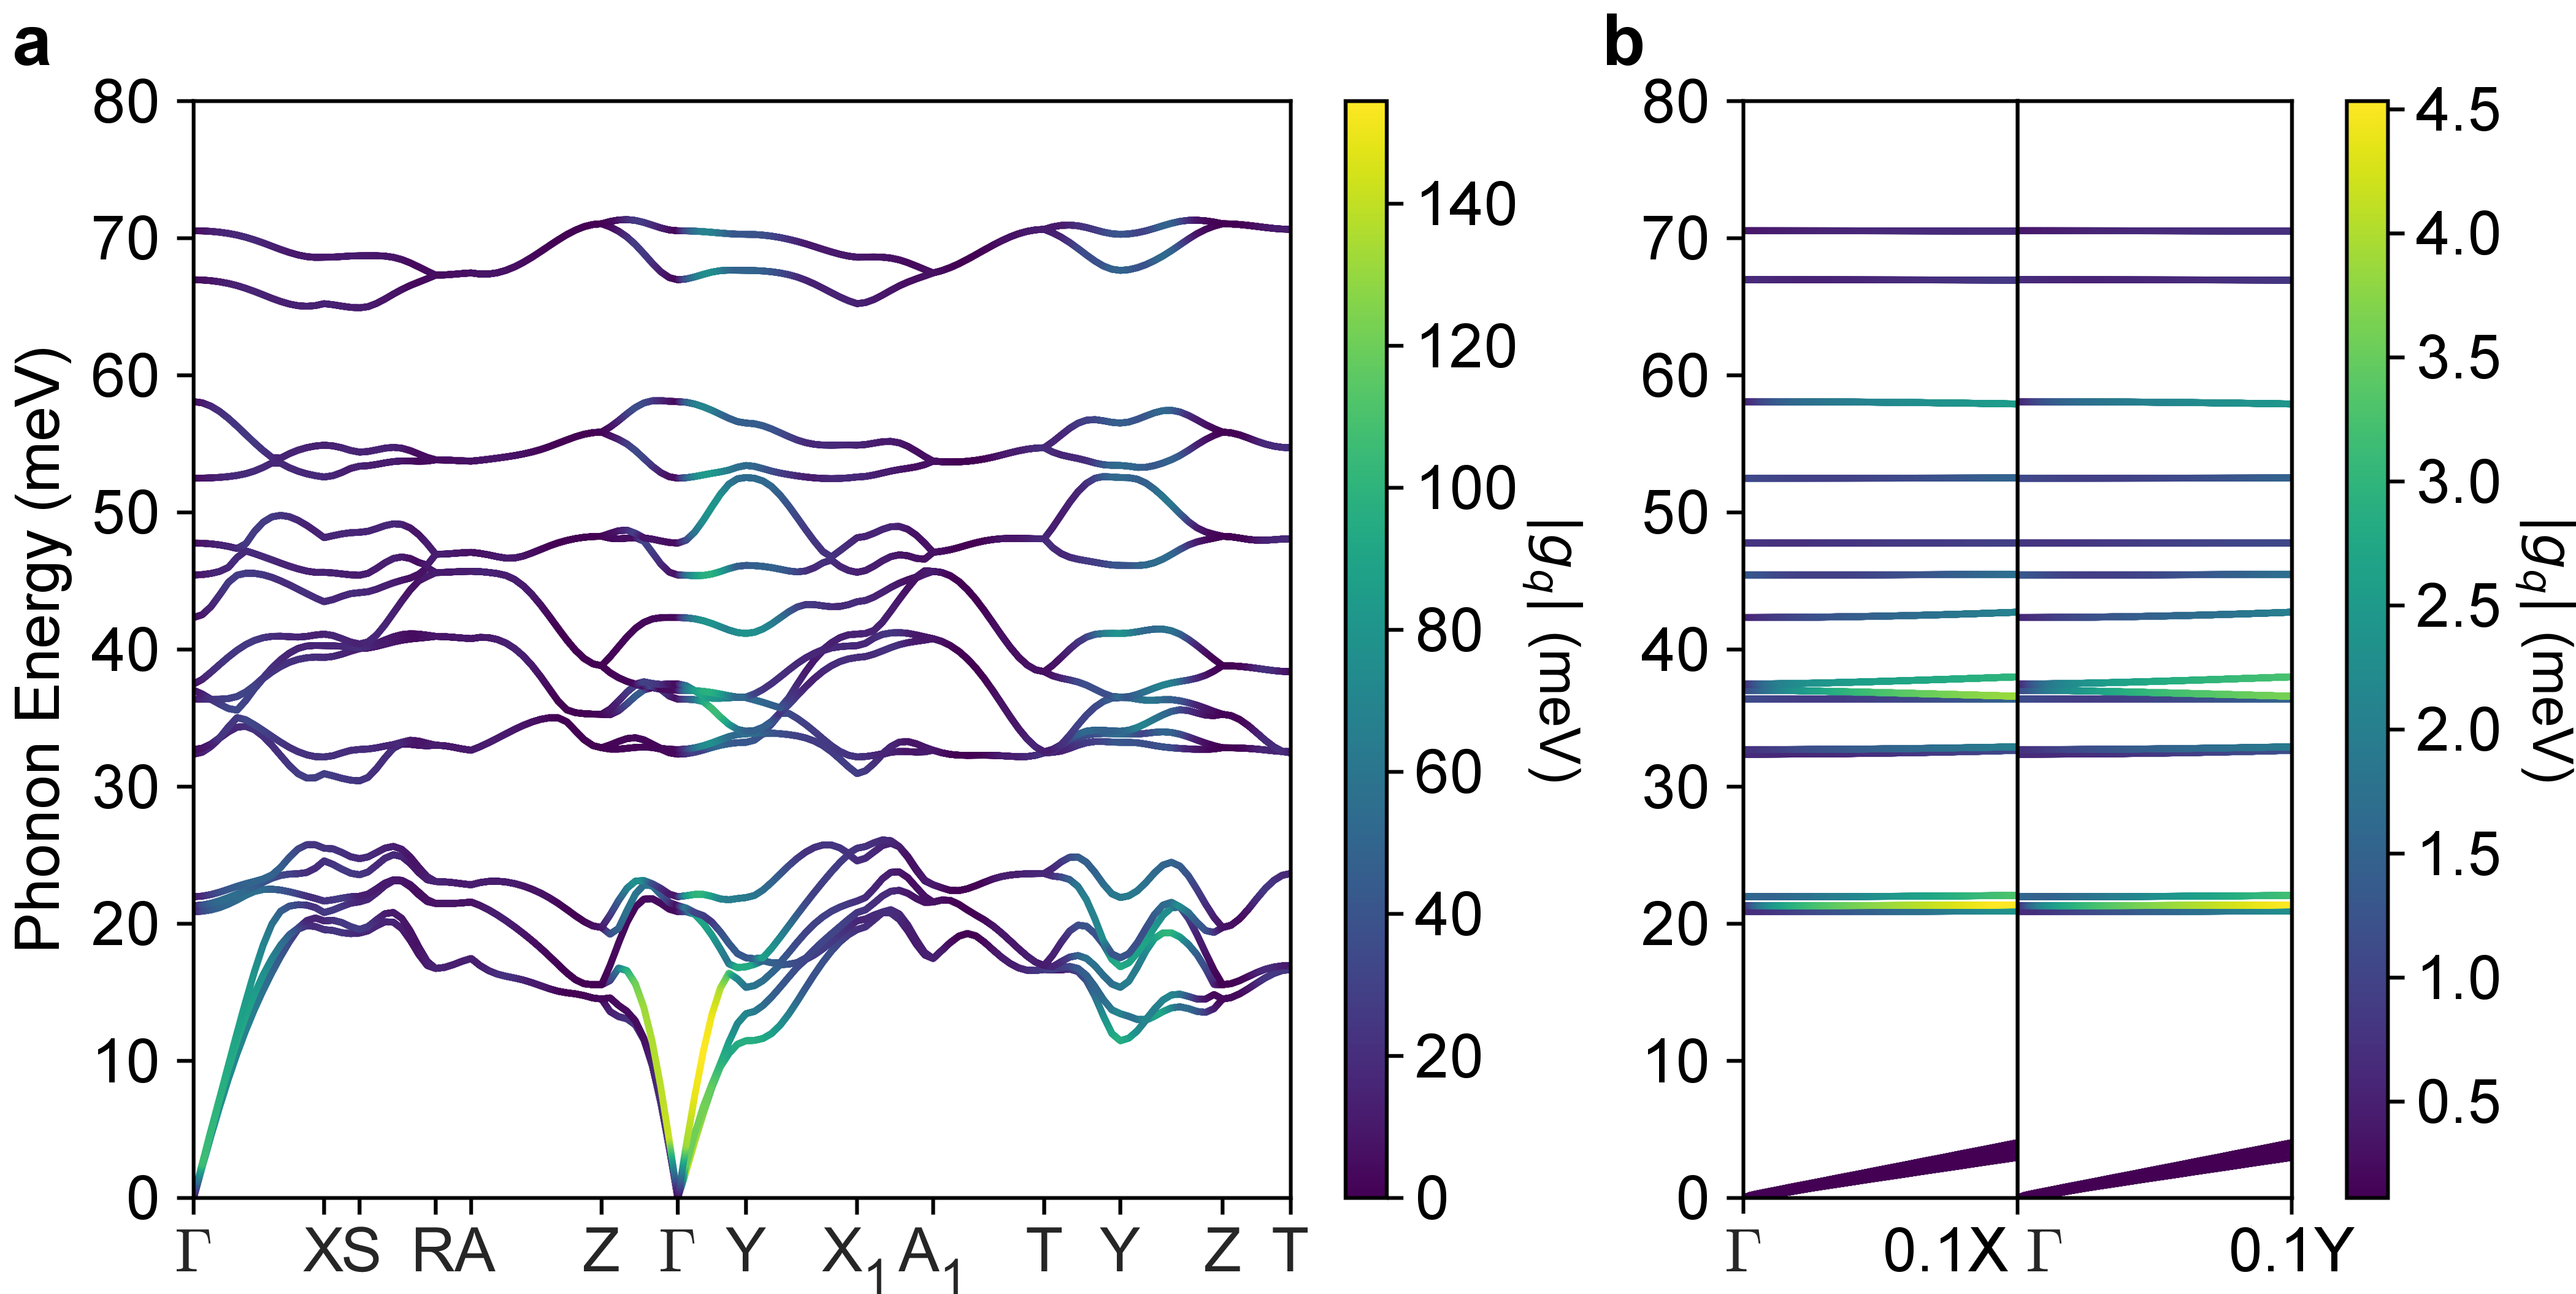
The presence of , and symmetries in the selection rules, combined with the lack of anomalous behavior in the linewidths for phonons of these symmetries, suggests that the phonon-electron coupling strength needs to be considered. Fig. 4a presents the calculated phonon dispersion for WP2, with the phonon-electron matrix element shown on each mode. Overall the acoustic branches display greater coupling, while the optical modes have considerable coupling along the and T to Y to Z cuts, corresponding to phonon wave vectors that connect separate parts of the Fermi surfaceCoulter et al. (2019). In Fig. 4b we show a close up of the optical phonon dispersion along the and cuts. For the phonon-electron coupling strength for all modes is very weak, with most modes displaying a on the order of 10 eV. This weak coupling is consistent with the lack of phonon-electron dominated linewiths for modes where interband transitions are symmetry allowed (, or ). For finite we see that for the and modes, the coupling strength increases by orders of magnitude, while for the higher energy modes the increase in coupling strength is not as dramatic. Noting that this finite is within our experimentally accessible range, we find these trends in the coupling strength to be consistent with our measurements and interpretation of the phonon linewidths.
The calculated phonon dispersions may also explain why phonon-electron decay dominates over phonon-phonon decay. As shown in Fig. 4a, there is no energy separation between the acoustic branches and the lowest energy optical modes. In addition, the acoustic branches have a very narrow bandwidth, similar to the “acoustic bunching” discussed for high thermal conductivity materialsLindsay et al. (2013). These features suggests there is a restricted phase space for decay into acoustic phonons, leading to longer phonon-phonon lifetimes for low energy modes, allowing phonon-electron processes to dominate the linewidth behavior. For the higher energy modes the available phonon-phonon phase space is much larger (Supplementary Note 12), explaining the dominance of phonon-phonon processes for the higher energy modes.
The bunching arguments presented above also apply to the phonon-phonon scattering rates for the acoustic modes.Lindsay et al. (2013) Given the much larger phonon-electron coupling strengths of the acoustic modes (Fig. 4a), we expect that this could lead to a predominance of phonon-electron scattering for these modes. We note that similar conclusions have been drawn from computational works as wellCoulter et al. (2018). Scattering by acoustic phonons may be intraband (at low energy and ) or interband (higher ), which leads to intraband scattering becoming more prevalent at lower temperatures. The acoustic modes are of , and symmetries, and therefore phonon-electron processes are symmetry allowed for two of the branches. If one further considers general -points beyond high-symmetry cuts, the symmetry requirements are relaxed and all three branches may contribute.
By examining the temperature dependence of the optical phonon linewidths of WP2 we identified electron-hole decay as the primary path for the lowest energy optical phonon modes over a broad temperature range. Through the use of group theory we further identified that such transitions must be intraband, clarifying why only certain Raman modes in this material display this behavior. Combined with first principles calculations, we also explained the importance of the phonon-electron coupling strength and the relative availability of phonon-phonon decay paths. This improved understanding of the differences between phonon induced intraband vs interband scattering is valuable in a material where electron-phonon coupling has been suggested to play a vital role in its macroscopic transport properties. We anticipate that these results could be beneficial to understanding similar phonon behavior that has recently been observed in other Weyl semimetalsCoulter et al. (2019); Zhang et al. (2019).
The much larger phonon-electron coupling strengths calculated for the acoustic modes suggest they may display similar behavior and primarily scatter off of charge carriers, potentially leading to enhancements of the conductivity at low temperatures and contributing to the development of hydrodynamic behavior.Peierls (1932); Wiser (1984); Varnavides et al. (2020) Our presented results suggest that enhancing phonon-electron coupling towards novel transport regimes requires lower symmetry systems, strongly bunched acoustic modes, and Fermi surfaces providing a large phase space for such processes. This will require future investigations into the phonon dynamics of topological semimetals utilizing e.g. resonant inelastic x-ray spectroscopy, Brillouin scattering, and new probes of spatially-resolved electrical and lattice transportVarnavides et al. (2019).
Methods
.1 Experimental Details
Raman spectra were collected in the backscattering configuration using a custom built setupTian et al. (2016). The 532 nm light from a frequency doubled Nd:YAG laser was focused by a 100X long-working distance objective to a spot size of 2 m in a Montana Instruments cryostation which enabled access to temperatures from 300 to 10 K. An incident power of ¡250 W was used to achieve satisfactory signal-to-noise ratios, with minimal laser induced heating. This was checked using the Stokes to anti-Stokes ratio at all temperatures where anti-Stokes signal was measurable ( 100 K). Polarization dependence was performed by the rotation of a double Fresnel rhomb which acts as a broadband half-waveplate (see Supplementary Information). Any presented spectra have been averaged and had background dark counts subtracted and cosmic rays removedWang et al. (2020).
.2 Computational Details
Calculations were performed using the ab initio package QUANTUM ESPRESSO Giannozzi et al. (2009, 2017) to evaluate electronic band structure, phonon dispersion and electron-phonon interactions, combining density functional theory (DFT) and density functional perturbation theory (DFPT). Fully relativistic optimized norm-conserving Vanderbilt (ONCV) pseudopotentials Hamann (2013) for the PBE exchange-correlation functional Perdew et al. (1996) were used for both W and P, which allowed us to calculate the electronic structure including spin orbit coupling (SOC). Furthermore, we calculated electron-phonon coupling matrix elements of WP2 with the EPW package Poncé et al. (2016), via interpolating the maximally localized Wannier functions Marzari and Vanderbilt (1997); Souza et al. (2001) on initial coarse and grids, from which we Fourier transformed back to much finer and grids.
For the weighted joint density of states (JDOS) and refractive index evaluations, separate DFT calculations were carried out using the implementation in JDFTx Sundararaman et al. (2017). Fully relativistic ultrasoft pseudopotentials Dal Corso (2014); Rappe et al. (1990) for the PBEsol exchange-correlation functional Perdew et al. (2008) were used, as well as a uniform grid for the 6-atom standard primitive unit cell, an energy cutoff of 28 Hartrees, Fermi-Dirac smearing with a 0.01 Hartree width, and a phonon supercell. Maximally localized Wannier functions Marzari and Vanderbilt (1997); Souza et al. (2001) were similarly obtained to interpolate quantities for Monte Carlo Brillouin zone integration on finer and meshes. Giustino et al. (2007) Each transition contributing to the JDOS at that transition energy is weighted by the factor , where is the Fermi-Dirac distribution function, and the transition occurs between energies and at the momentum for two bands indexed by and . The results presented in Fig. 3c are for K, with transitions restricted to be between states within meV of the Fermi level. The refractive index calculations are discussed in Supplementary Note 11.
Acknowledgements
Analysis and measurements performed by G.B.O. and V.M.P. as well as work done by K.S.B. was supported by the U.S. Department of Energy (DOE), Office of Science, Office of Basic Energy Sciences under Award No. DE-SC0018675. This research used resources of the National Energy Research Scientific Computing Center, a DOE Office of Science User Facility supported by the Office of Science of the U.S. Department of Energy under Contract No. DE-AC02-05CH11231, as well as resources at the Research Computing Group at Harvard University.
G.B.O. and V.M.P. performed the primary measurements, analyzed the data and provided the plots. G.B.O. performed the group theory analysis. C.A.C.G., Y.W. and P.N. performed the first principles calculations. J.G. and C.F. prepared the single crystal samples. G.B.O. and K.S.B. wrote the manuscript with contributions from other authors. P.N. and K.S.B. jointly conceived the project and ideas presented.
References
- Shekhar et al. (2015) C. Shekhar, A. K. Nayak, Y. Sun, M. Schmidt, M. Nicklas, I. Leermakers, U. Zeitler, Y. Skourski, J. Wosnitza, Z. Liu, Y. Chen, W. Schnelle, H. Borrmann, Y. Grin, C. Felser, and B. Yan, Nature Physics 11, 645 (2015).
- Wang et al. (2016) Z. Wang, Y. Zheng, Z. Shen, Y. Lu, H. Fang, F. Sheng, Y. Zhou, X. Yang, Y. Li, C. Feng, and Z.-A. Xu, Physical Review B 93, 121112 (2016).
- Kumar et al. (2017) N. Kumar, Y. Sun, N. Xu, K. Manna, M. Yao, V. Süß, I. Leermakers, O. Young, T. Förster, M. Schmidt, H. Borrmann, B. Yan, U. Zeitler, M. Shi, C. Felser, and C. Shekhar, Nature Communications 8, 1642 (2017).
- Ali et al. (2014) M. N. Ali, J. Xiong, S. Flynn, J. Tao, Q. D. Gibson, L. M. Schoop, T. Liang, N. Haldolaarachchige, M. Hirschberger, N. P. Ong, and R. J. Cava, Nature 514, 205 (2014).
- Yang et al. (2017) H.-Y. Yang, T. Nummy, H. Li, S. Jaszewski, M. Abramchuk, D. S. Dessau, and F. Tafti, Phys. Rev. B 96, 235128 (2017).
- Mun et al. (2012) E. Mun, H. Ko, G. J. Miller, G. D. Samolyuk, S. L. Bud’ko, and P. C. Canfield, Phys. Rev. B 85, 035135 (2012).
- Du et al. (2018) J. Du, Z. Lou, S. Zhang, Y. Zhou, B. Xu, Q. Chen, Y. Tang, S. Chen, H. Chen, Q. Zhu, H. Wang, J. Yang, Q. Wu, O. V. Yazyev, and M. Fang, Phys. Rev. B 97, 245101 (2018).
- Gooth et al. (2018) J. Gooth, F. Menges, N. Kumar, V. Sü, C. Shekhar, Y. Sun, U. Drechsler, C. Zierold, R.and Felser, and B. Gotsmann, Nature Communications 9, 4093 (2018).
- Jaoui et al. (2018) A. Jaoui, B. Fauqué, C. W. Rischau, A. Subedi, C. Fu, J. Gooth, N. Kumar, V. Süß, D. L. Maslov, C. Felser, and K. Behnia, npj Quantum Materials 3, 64 (2018).
- Coulter et al. (2018) J. Coulter, R. Sundararaman, and P. Narang, Physical Review B 98, 115130 (2018).
- Levchenko and Schmalian (2020) A. Levchenko and J. Schmalian, arXiv:2005.09694 (2020).
- Varnavides et al. (2020) G. Varnavides, A. S. Jermyn, P. Anikeeva, C. Felser, and P. Narang, “Generalized electron hydrodynamics, vorticity coupling, and hall viscosity in crystals,” (2020), arXiv:2002.08976 [cond-mat.mtrl-sci] .
- Peierls (1932) R. Peierls, Annalen der Physik 404, 154 (1932), https://onlinelibrary.wiley.com/doi/pdf/10.1002/andp.19324040203 .
- Wiser (1984) N. Wiser, Contemporary Physics 25, 211 (1984).
- Coulter et al. (2019) J. Coulter, G. B. Osterhoudt, C. A. C. Garcia, Y. Wang, V. M. Plisson, B. Shen, N. Ni, K. S. Burch, and P. Narang, Phys. Rev. B 100, 220301 (2019).
- Xu et al. (2017) B. Xu, Y. M. Dai, L. X. Zhao, K. Wang, R. Yang, W. Zhang, J. Y. Liu, H. Xiao, G. F. Chen, S. A. Trugman, J.-X. Zhu, A. J. Taylor, D. A. Yarotski, R. P. Prasankumar, and X. G. Qiu, Nature Communications 8, 14933 (2017).
- Zhang et al. (2019) A. Zhang, X. Ma, C. Liu, R. Lou, Y. Wang, Q. Yu, Y. Wang, T.-l. Xia, S. Wang, L. Zhang, X. Wang, C. Chen, and Q. Zhang, Phys. Rev. B 100, 201107 (2019).
- Sharafeev et al. (2017) A. Sharafeev, V. Gnezdilov, R. Sankar, F. C. Chou, and P. Lemmens, Phys. Rev. B 95, 235148 (2017).
- Kroumova et al. (2003) E. Kroumova, M. Aroyo, J. Perez-Mato, A. Kirov, C. Capillas, S. Ivantchev, and H. Wondratschek, Phase Transitions 76, 155 (2003), https://doi.org/10.1080/0141159031000076110 .
- Su et al. (2019) B. Su, Y. Song, Y. Hou, X. Chen, J. Zhao, Y. Ma, Y. Yang, J. Guo, J. Luo, and Z.-G. Chen, Advanced Materials 31, 1903498 (2019), https://onlinelibrary.wiley.com/doi/pdf/10.1002/adma.201903498 .
- Wulferding et al. (2020) D. Wulferding, P. Lemmens, F. Büscher, D. Schmeltzer, C. Felser, and C. Shekhar, arXiv:2004.00328v1 (2020).
- Balkanski et al. (1983) M. Balkanski, R. F. Wallis, and E. Haro, Phys. Rev. B 28, 1928 (1983).
- Tian et al. (2017) Y. Tian, S. Jia, R. J. Cava, R. Zhong, J. Schneeloch, G. Gu, and K. S. Burch, Phys. Rev. B 95, 094104 (2017).
- Fano (1961) U. Fano, Phys. Rev. 124, 1866 (1961).
- Klemens (1966) P. G. Klemens, Phys. Rev. 148, 845 (1966).
- Giura et al. (2012) P. Giura, N. Bonini, G. Creff, J. B. Brubach, P. Roy, and M. Lazzeri, Phys. Rev. B 86, 121404 (2012).
- Liu et al. (2019) H.-N. Liu, X. Cong, M.-L. Lin, and P.-H. Tan, Carbon 152, 451 (2019).
- Lazzeri et al. (2006) M. Lazzeri, S. Piscanec, F. Mauri, A. C. Ferrari, and J. Robertson, Phys. Rev. B 73, 155426 (2006).
- Autès et al. (2016) G. Autès, D. Gresch, M. Troyer, A. A. Soluyanov, and O. V. Yazyev, Physical Review Letters 117, 066402 (2016).
- Birman (1962) J. L. Birman, Phys. Rev. 127, 1093 (1962).
- Chen et al. (1968) L.-C. Chen, R. Berenson, and J. L. Birman, Phys. Rev. 170, 639 (1968).
- Yao et al. (2019) M.-Y. Yao, N. Xu, Q. S. Wu, G. Autès, N. Kumar, V. N. Strocov, N. C. Plumb, M. Radovic, O. V. Yazyev, C. Felser, J. Mesot, and M. Shi, Phys. Rev. Lett. 122, 176402 (2019).
- Lindsay et al. (2013) L. Lindsay, D. A. Broido, and T. L. Reinecke, Phys. Rev. Lett. 111, 025901 (2013).
- Varnavides et al. (2019) G. Varnavides, A. S. Jermyn, P. Anikeeva, and P. Narang, Phys. Rev. B 100, 115402 (2019).
- Tian et al. (2016) Y. Tian, A. A. Reijnders, G. B. Osterhoudt, I. Valmianski, J. G. Ramirez, C. Urban, R. Zhong, J. Schneeloch, G. Gu, I. Henslee, and K. S. Burch, Review of Scientific Instruments 87, 043105 (2016), https://doi.org/10.1063/1.4944559 .
- Wang et al. (2020) Y. Wang, G. B. Osterhoudt, Y. Tian, P. Lampen-Kelley, A. Banerjee, T. Goldstein, J. Yan, J. Knolle, H. Ji, R. J. Cava, J. Nasu, Y. Motome, S. E. Nagler, D. Mandrus, and K. S. Burch, npj Quantum Materials 5, 14 (2020).
- Giannozzi et al. (2009) P. Giannozzi, S. Baroni, N. Bonini, M. Calandra, R. Car, C. Cavazzoni, D. Ceresoli, G. L. Chiarotti, M. Cococcioni, I. Dabo, A. Dal Corso, S. de Gironcoli, S. Fabris, G. Fratesi, R. Gebauer, U. Gerstmann, C. Gougoussis, A. Kokalj, M. Lazzeri, L. Martin-Samos, N. Marzari, F. Mauri, R. Mazzarello, S. Paolini, A. Pasquarello, L. Paulatto, C. Sbraccia, S. Scandolo, G. Sclauzero, A. P. Seitsonen, A. Smogunov, P. Umari, and R. M. Wentzcovitch, Journal of Physics: Condensed Matter 21, 395502 (19pp) (2009).
- Giannozzi et al. (2017) P. Giannozzi, O. Andreussi, T. Brumme, O. Bunau, M. B. Nardelli, M. Calandra, R. Car, C. Cavazzoni, D. Ceresoli, M. Cococcioni, N. Colonna, I. Carnimeo, A. D. Corso, S. de Gironcoli, P. Delugas, R. A. D. Jr, A. Ferretti, A. Floris, G. Fratesi, G. Fugallo, R. Gebauer, U. Gerstmann, F. Giustino, T. Gorni, J. Jia, M. Kawamura, H.-Y. Ko, A. Kokalj, E. Küçükbenli, M. Lazzeri, M. Marsili, N. Marzari, F. Mauri, N. L. Nguyen, H.-V. Nguyen, A. O. de-la Roza, L. Paulatto, S. Poncé, D. Rocca, R. Sabatini, B. Santra, M. Schlipf, A. P. Seitsonen, A. Smogunov, I. Timrov, T. Thonhauser, P. Umari, N. Vast, X. Wu, and S. Baroni, Journal of Physics: Condensed Matter 29, 465901 (2017).
- Hamann (2013) D. Hamann, Physical Review B 88, 085117 (2013).
- Perdew et al. (1996) J. P. Perdew, K. Burke, and M. Ernzerhof, Phys. Rev. Lett. 77, 3865 (1996).
- Poncé et al. (2016) S. Poncé, E. R. Margine, C. Verdi, and F. Giustino, Computer Physics Communications 209, 116 (2016).
- Marzari and Vanderbilt (1997) N. Marzari and D. Vanderbilt, Phys. Rev. B 56, 12847 (1997).
- Souza et al. (2001) I. Souza, N. Marzari, and D. Vanderbilt, Phys. Rev. B 65, 035109 (2001).
- Sundararaman et al. (2017) R. Sundararaman, K. Letchworth-Weaver, K. A. Schwarz, D. Gunceler, O. Yalcin, and T. Arias, SoftwareX 6, 278 (2017).
- Dal Corso (2014) A. Dal Corso, Computational Materials Science 95, 337 (2014).
- Rappe et al. (1990) A. M. Rappe, K. M. Rabe, E. Kaxiras, and J. D. Joannopoulos, Physical Review B 41, 1227 (1990).
- Perdew et al. (2008) J. P. Perdew, A. Ruzsinszky, G. I. Csonka, O. A. Vydrov, G. E. Scuseria, L. A. Constantin, X. Zhou, and K. Burke, Physical Review Letters 100, 136406 (2008).
- Giustino et al. (2007) F. Giustino, M. L. Cohen, and S. G. Louie, Phys. Rev. B 76 (2007), 10.1103/PhysRevB.76.165108.