Multimessenger observations of counterparts to IceCube-190331A
Abstract
High-energy neutrinos are a promising tool for identifying astrophysical sources of high and ultra-high energy cosmic rays (UHECR). Prospects of detecting neutrinos at high energies ( TeV) from blazars have been boosted after the recent association of IceCube-170922A and TXS 0506+056. We investigate the high-energy neutrino, IceCube-190331A, a high-energy starting event (HESE) with a high likelihood of being astrophysical in origin. We initiated a Swift/XRT and UVOT tiling mosaic of the neutrino localisation, and followed up with ATCA radio observations, compiling a multiwavelength SED for the most likely source of origin. NuSTAR observations of the neutrino location and a nearby X-ray source were also performed. We find two promising counterpart in the 90% confidence localisation region and identify the brightest as the most likely counterpart. However, no Fermi/LAT -ray source and no prompt Swift/BAT source is consistent with the neutrino event. At this point it is unclear whether any of the counterparts produced IceCube-190331A. We note that the Helix Nebula is also consistent with the position of the neutrino event, and we calculate that associated particle acceleration processes cannot produce the required energies to generate a high-energy HESE neutrino.
keywords:
neutrinos — galaxies: active — BL Lacertae objects: general — quasars: general — galaxies: jets1 Introduction
Cosmic rays arriving at Earth have been detected up to the extreme energies of eV since more than a century ago – yet their origin remains elusive (e.g., Norman et al., 1995). A promising tool for identifying the astrophysical sources of high and ultra-high energy cosmic rays are high-energy neutrinos as they are not deflected in interstellar and intergalactic magnetic fields. Consistent with these expectations, a diffuse extraterrestrial flux of high-energy neutrinos has been observed by the IceCube neutrino observatory over more than a decade of observation (Aartsen et al., 2013; IceCube Collaboration, 2014; Haack & Wiebusch, 2017). Localisation uncertainties mean that the nature of these neutrinos is still unknown.
Blazars and other types of AGN have been predicted to produce neutrinos in jets (Biermann & Strittmatter, 1987; Mannheim et al., 1991; Mannheim, 1993, 1995) and/or in their cores (Eichler, 1979; Berezinskii & Ginzburg, 1981; Begelman et al., 1990; Stecker et al., 1991; Stecker, 2013). TeV and PeV neutrinos are expected from flat-spectrum radio quasars, while BL Lacs are expected to produce neutrinos at EeV energies. Recently, progress has also been made in explaining neutrinos from BL Lac objects (Murase et al., 2014; Dermer et al., 2014; Tavecchio & Ghisellini, 2015). We have shown that blazars can calorimetrically explain IceCube neutrinos (Krauß et al., 2014), low-significance coincidence between a blazar outburst and an astrophysical neutrino, IC 35 (and PKS 1424418; Kadler et al., 2016). To date, the neutrino candidate, IceCube-170922A has only been the second 3 association of neutrino emission to an astronomical source (SN 1987A; blazar TXS 0506+056; IceCube Collaboration, Fermi-LAT Collaboration et al., 2018; Keivani et al., 2018). However, it has also been shown that for realistic neutrino spectra, blazars can account for all IceCube high-energy neutrinos (Krauß et al., 2018); this is in disagreement with the 30% limit on the contribution of blazars found by Aartsen et al. (2017b) for all IceCube neutrinos. More stringent limits of 5–15% have been placed by Hooper et al. (2019); Yuan et al. (2020), which would still be consistent with a significant contribution of AGN, including blazars, to the PeV neutrinos (Murase & Waxman, 2016). It is possible that non-blazar AGN produce the entire or a large fraction of the astrophysical neutrino flux seen by IceCube (Hooper et al., 2019). Some authors have argued for a combination of BL Lac and pulsar wind nebula as the origin of the IceCube neutrinos (Padovani & Resconi, 2014).
While blazars and other active galactic nuclei (AGN) are excellent candidates for accelerating cosmic rays to ultra-high energies, significant contributions from other types of sources are not yet ruled out. Suggested populations include starburst galaxies (Murase et al., 2013; Senno et al., 2015; Bechtol et al., 2017), and (choked) GRBs (Murase & Ioka, 2013; Senno et al., 2016; Tamborra & Ando, 2016; Aartsen et al., 2017c).
IceCube and the Astrophysical Multimessenger Observatory Network (AMON)111see https://www.amon.psu.edu/ for details. started a real-time program in 2016 (Aartsen et al., 2017a) to identify and localise high-energy neutrinos in order to distribute them to follow-up observatories. Since 2019 IceCube provides these alerts at “bronze”, “silver” and “gold” levels. There have been 17 such alerts as of February 2020 (10 “bronze” alerts and 7 “gold” alerts), several of which resulted in extensive multimessenger campaigns to observe the location of the neutrino candidate in different wavelengths/messengers. IceCube-170922A has so far been the only event with a source identification (IceCube Collaboration, Fermi-LAT Collaboration et al., 2018).
On March 31, 2019, the IceCube Neutrino Observatory identified a high energy neutrino candidate (labelled IceCube-190331A), likely produced by a muon neutrino. This event was publicly distributed through the gamma-ray coordinates network (GCN; Barthelmy et al. 1995) within 34 seconds (GCN/AMON NOTICE IceCube-190331A, 2017). A subsequent search by Fermi/LAT determined there were no known -ray sources within the 90% IceCube-190331A localisation error (Buson & Garrappa, 2019). Given the event direction, this paper seeks to investigate a possible origin for this high-energy neutrino candidate by conducting follow-up observations of known sources within the uncertainty region.
We report the multiwavelength observations (radio, optical, UV, X-ray) of possible counterparts detected by Swift/XRT during follow-up observations of the IceCube-190331A high-energy neutrino candidate (Sec. 2) and discuss possible associations with the IceCube event (Sec. 3).
Throughout the paper we use the standard cosmological model with , , km s-1 Mpc-1 (Beringer et al., 2012).
2 Observations
In this section, we review the detection of the IceCube-190331A neutrino event,
and present observations and data analysis of electromagnetic
follow-up observations from Swift (X-ray, ultraviolet/optical,
-ray), ATCA (radio), X-shooter (ultraviolet, optical,
near-infrared), and NuSTAR (X-ray).
2.1 IceCube Detection
On March 31, 2019, the IceCube Neutrino Observatory identified a high-energy neutrino candidate through its High Energy Starting Event (HESE) stream. This event had a high probability of being produced by a muon neutrino of astrophysical origin with a deposited charge of about 198736.44 photoelectrons in the detector (GCN/AMON NOTICE IceCube-190331A, 2017). This event was recorded as having one of the highest deposited energies ever seen, making it a promising astrophysical neutrino candidate (Kopper & Blaufuss, 2017). After conducting a ground-based analysis using offline reconstruction algorithms, IceCube was able to report an event direction at RA=, Dec= (J2000; 90% containment ellipse; Kopper & Blaufuss, 2017; Ice Cube Collaboration, 2019). Subsequently, an additional search for track-like muon neutrino events arriving from the direction of IceCube-190331A was performed by IceCube for two days after the initial event time, as well as a search to include the previous month of data. No additional track-like events were found within the 90% spatial containment region in either search (Icecube Collaboration, 2019).
Several multiwavelength follow-up observations were conducted in order to find potential EM counterparts to the very high energy neutrino candidate. Although these searches did not find any high-confidence EM counterpart (Buson & Garrappa, 2019), we discuss two possible counterparts below (see Sect. 3).
2.2 Swift/BAT prompt observations
At the time of arrival of IceCube-190331A (T0), the neutrino localisation region was serendiptidously located near the highest sensitivity location of the coded field-of-view (89% partial coding fraction) of the Swift Burst Alert Telescope (BAT; Barthelmy et al., 2005). This allows us to set sensitive upper limits on the existence of a prompt gamma-ray transient coincident with (or directly preceding or succeeding) the high-energy neutrino emission. We perform a blind search on the BAT raw light curves with time-bins of 64 ms, 1 s, and 1.6 s. We find no evidence for any short or long GRB-like emission within T0 500 s of the neutrino arrival time, and set a conservative 5 upper limit for any short GRB of erg
We also performed a search for longer time-scale emission, on a survey image produced by the BAT from T0-580s to T0+ 660s. We find no new or uncatalogued hard X-ray sources within the neutrino localisation region, and set a 3 flux upper limit of 15 mCrab assuming a powerlaw spectral index of .
2.3 Swift/XRT observations
IceCube-190331A triggered the Neil Gehrels Swift Observatory in automated fashion via the AMON cyberinfrastructure (Ayala Solares et al., 2019), however prompt observation of the neutrino localisation was not possible with Swift as it was initially within the satellite’s Sun avoidance region.
| Sources | R.A. | Dec. | Significance |
|---|---|---|---|
| ID | [J2000] | [J2000] | |
| 1 | 337.3551 | 20.31325 | 5.56 |
| 2 | 337.5285 | 21.0994 | 5.06 |
| 3 | 338.0251 | 21.0493 | 4.52 |
| 4 | 338.0184 | 21.1199 | 4.16 |
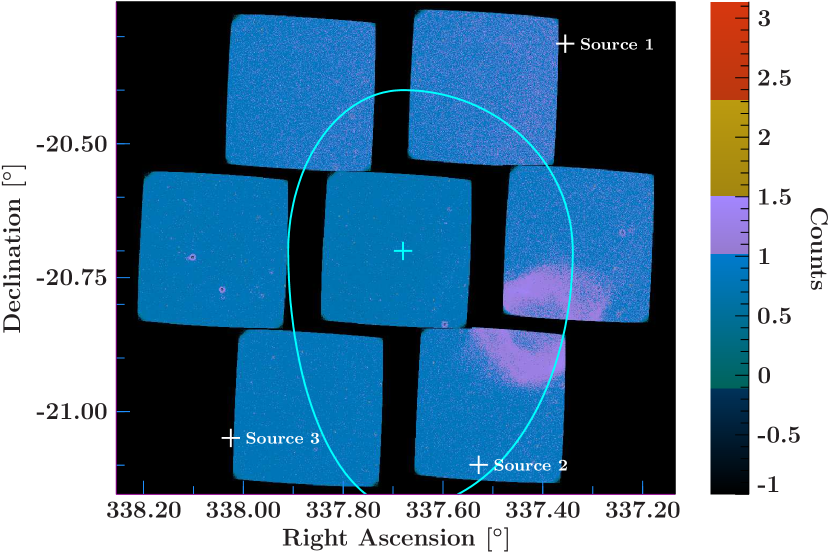
Swift observations of the IceCube-190331A field began on April 9, 2019, nine days after the event. Swift was able to observe a region of approximately 33′ radius centred on the event direction of RA=, Dec= (J2000), using an on-board 7-point tiling pattern (Keivani et al., 2019). During this initial observation, Swift/XRT collected approximately seconds of data per tile for a total of seconds the morning of April 9 and was able to detect four X-ray sources (see Table 1) with the new XRT detection system (Evans et al., 2019). The highest significance (source #1) found during these observations is catalogued at RA=, Dec= (J2000; 90 % containment region), matching the known X-ray source 1WGA J2229.42018 from ROSAT/WGACAT catalogue (15.37′′ distance; White et al., 1994). Another source, 5.3′′ away from X-ray source # 1 is listed in the Milliquas catalogue (Flesch, 2017) as the likely AGN WISEA J222925.59201846.0 and is consistent with the J=16.74 mag 2MASS source (2MASS J222925592018462, see Fig. 1; Skrutskie et al., 2006; Keivani et al., 2019). WISEA J222925.59201846.0 is not listed in the most recent ALLWISE catalogue, so the WISEA detection might not be real (Wright et al., 2010).
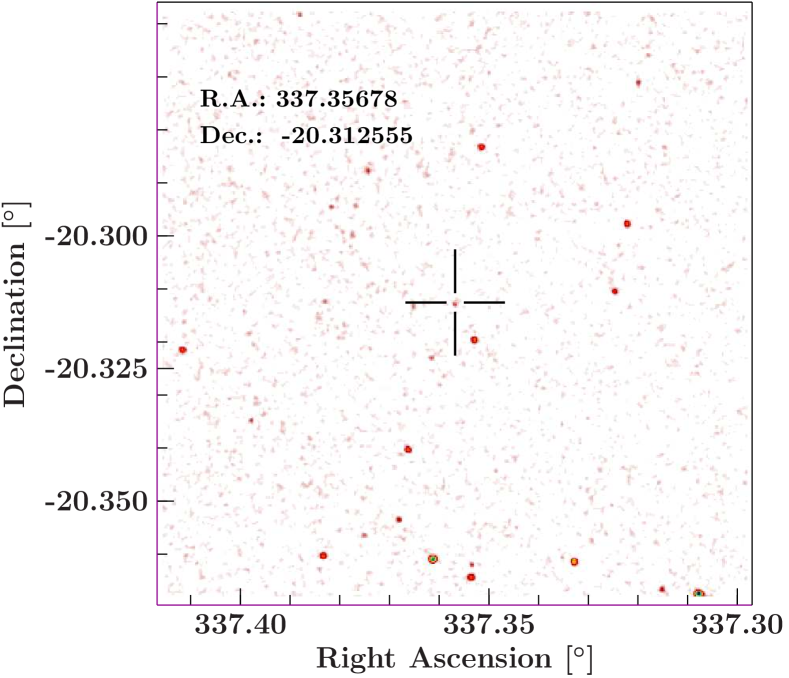
Although it seems that the sources (WISEA J222925.59201846.0 /2MASS J2229255920184 and 1WGA J2229.42018) are the same, it is possible that neither 1WGA J2229.42018 nor WISEA J222925.59201846.0 are real source detections, but rather background fluctuations, given their low detection significance and distance from the 2MASS J2229255920184 coordinates.
Swift/XRT performed a further observation centred on the location of source #1. The X-ray analysis following the observation period - MJD focused on data from the most significant sources and did not consider the lower-significance X-ray sources. The data used in analysis were from Swift/XRT observations of the position of 1WGA J2229.42018 (source #1) on April 9, 2019 and April 16, 2019. The newest calibration was applied using the xrtpipeline to the raw data using HEASoft (V. 6.26). Spectra were extracted from the reprocessed image using a source region with 54.218′′radius and an annulus for the background region of 82.506 and 235.721′′using XSELECT (V. 2.4). Due to the low count rate, data were binned to a signal-to-noise-ratio (SNR) of 1 in the Interactive Spectral Interpretation System (ISIS; V. 1.6.2-44; Houck & Denicola, 2000). Due to the low SNR we use Cash statistics to find a best fit (Cash, 1979). The data were fit with an absorbed power law with a convolution model to calculate the flux. For the absorption model we use tbnew222online at: http://pulsar.sternwarte.uni-erlangen.de/wilms/research/tbabs/ with the vern cross-sections (Verner et al., 1996) and the wilm abundances (Wilms et al., 2000). The hydrogen equivalent absorption column density was frozen to a value of (HI4PI Collaboration et al., 2016a).
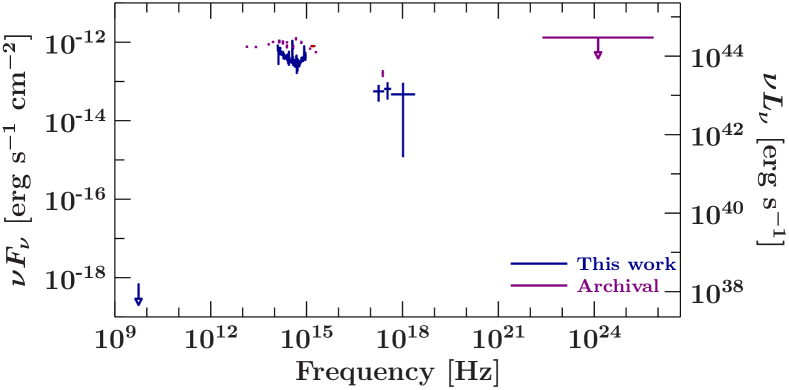
The photon indices for the observations on April 9 and April 16 were found to be and , respectively, with corresponding flux values of and erg s-1 cm-2, indicating a possible change in flux. Uncertainties for both the photon index and flux were calculated at the 90% confidence level. Both observations are combined in the SED and shown with a signal-to-noise ratio binning of 2 (see Fig. 2).
2.4 Swift/UVOT follow-up observations
The Swift/UltraViolet-Optical Telescope (UVOT) (Roming et al., 2005) also participated in both the tiling and targeted follow-up in response to IceCube-190331A. Only source #2 was within the field of view of the initial tiled UVOT observations (see Fig. 3). An additional follow-up observation on April 16 provided a UVOT image for source #1 for a cleaned exposure time of 2829 s in the uvw2 filter. UVOT images in one observations were summed using uvotimsum. Source counts were extracted using uvot2pha with a 5′′region at an updated source position of RA=3375298451, Dec= and annulus for the background region of 13 and 26′′, centred on the source position while ensuring no contamination from background sources. Source #1 was extracted with regions of the same size, centred on RA=3373566258, Dec=.
Additionally, uvw2 images detected WISEA J222925.59-2201846.0 at an AB magnitude of . No flux variability or changes were detected in the four observations.
We performed a search for uncatalogued sources in the UVOT u-band with observations taken during the 7-point tiling follow-up. No new or uncatalogued sources were found down to an average 5 upper limit of u=20.3 mag AB.
2.5 X-Shooter Observation
Medium-resolution spectroscopy of 1WGA J2229.4-2018 was obtained with the X-shooter spectrograph (Vernet et al., 2011) of the Very Large Telescope (VLT) UT2 at the ESO Paranal Observatory on 2019 April 26. The three arms of X-shooter, (UV: UVB, optical: VIS and near-infrared: NIR) were used with slit widths of 10, 09, and 09, respectively. These data provide quasi-simultaneous 300–2400 nm spectral coverage with average spectral resolutions of 5400, 8900, and 5600, respectively, in each arm. Observing conditions were intermediate, with a clear sky, a seeing of 15, and an airmass of 1.7. Individual exposure times are 445 s, 352 s, and 200 s for the UBV, VIS, and NIR arms, respectively, which lead to a total integration times of 3560 s, 2816 s, and 3200 s. Standard ABBA nodding observing mode was used to allow for an effective background subtraction.
Data were reduced using the ESO X-shooter pipeline (Goldoni et al., 2006; Modigliani et al., 2010) (v.2.9.3), producing a background-subtracted, wavelength-calibrated spectrum. The extracted 1D spectrum was flux calibrated with the X-shooter pipeline using a response function produced by observing the white dwarf standard LTT 3218 (R.A. 08h 41m 32s.43, Dec. -32∘ 56′ 32.9′′, J2000) during the same night. The spectrum was corrected from telluric absorption lines using the Molecfit package (Smette, A. et al., 2015), and the flux was dereddened using (Cardelli et al., 1989) with AV=0.1358 mag and RV=3.1.
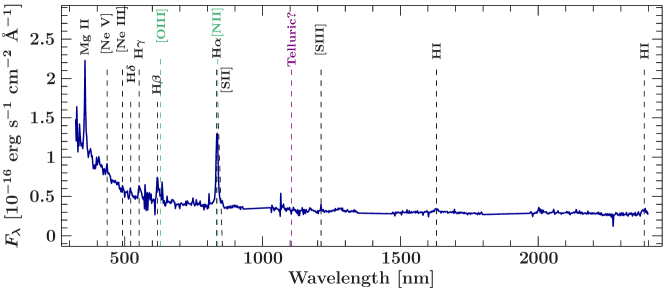
The reduced 1D spectrum is shown in Figure 4. It is dominated by strong MgII (279.8 nm - rest frame) and Balmer H, , , emission lines that allow to derive a source redshift of . Forbidden lines of [O III] (495.9 nm; 500.7 nm), [Ne V] (342.6 nm), [Ne III] (386.9 nm), [N II] (658.3 nm), [S II] (671.6 nm) and [S III] (953.1 nm) are also present. While HI and MgII broad allowed emission lines presumably form within the accretion disk or close to it, narrow forbidden lines of neon, oxygen and sulfur are supposed to come from lower density regions further away from the supermassive black hole. The X-shooter rest-frame spectrum of 1WGA J2229.4-2018 matches with the optical spectrum of a Seyfert 1.2 AGN with [O III] lines weaker than the H one. The optical/near-infrared spectral energy distribution of 1WGA J2229.4-2018 displays a deep trough around 1014.8 Hz which probably indicates the transition between the dusty torus and the disk contributions strengthening the classification of the source as a Seyfert 1.2 AGN.
Fig. 4 shows our spectrum of 1WGA J2229.42018. We derive a source redshift of using the emission lines of Mg II, Ne V, H, and H and we use this number to calculate the absolute luminosity of the source and its SED. Based on the optical spectrum the source can be identified as Seyfert type I AGN.
2.6 ATCA Observation
Following the detection of the neutrino candidate IceCube-190331A, we requested radio observations with the Australia Telescope Compact Array (ATCA; under project code CX433) targeting the four X-ray sources found by Swift/XRT within the neutrino location error region. The ATCA observations were carried out on 2019 April 21 and 22. On the first night ATCA observed X-ray sources 1, 3, and 4, while on the second night it targeted X-ray sources 1 and 2. The observations were recorded simultaneously at central frequencies of 5.5 and 9 GHz, with 2 GHz of bandwidth at each frequency. We used PKS 1934638 for bandpass and flux calibration, while the nearby source J2203188 was used for phase calibration. The data were edited, calibrated, and imaged following standard procedures within the Common Astronomy Software Application (CASA, version 5.1.0; McMullin et al., 2007). Imaging was done using a Briggs robust parameter of 2 to maximise sensitivity. Since X-ray source #1 was observed on both days, the two observations were combined to maximise sensitivity.
No radio counterpart was detected at any of the X-ray source positions. Upper limits were determined by stacking the 5.5 and 9 GHz data and taking three times the measured rms over the source position. They were extracted from regions of 30′′centred on the source positions. The flux densities of nearby sources are reported as the peak pixel flux density. To determine the position of these nearby radio sources, we fit for point sources in the image plane. The resulting values are given in Table 2.
| ID | RA | Dec | Flux UL |
|---|---|---|---|
| [J2000] | [J2000] | [Jy/beam] | |
| 1 | 337.35513 | 20.31324 | 12.36 |
| 2 | 337.53187 | 21.10525 | 27.62 |
| 3 | 338.02441 | 21.04247 | 46.72 |
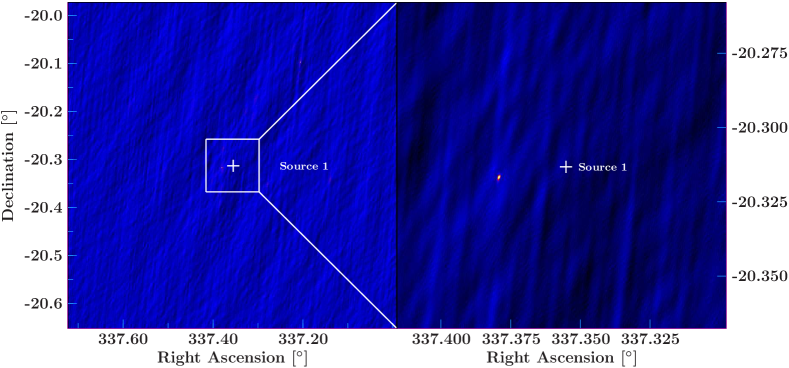
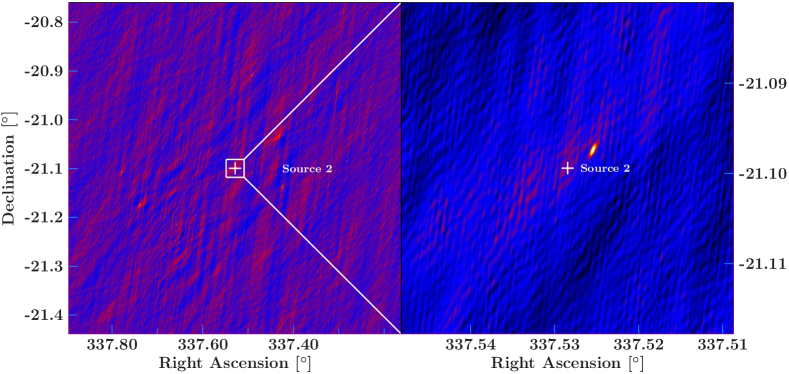
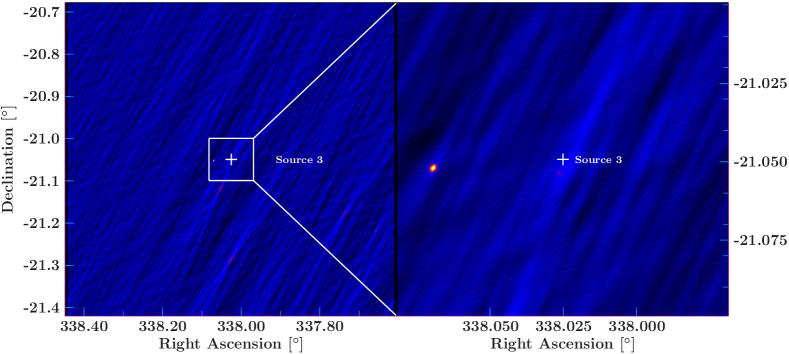
ATCA finds no source consistent with the X-ray detection of source 1 (see Fig. 5); it only finds a source offset from the X-ray position. Source 2 shows a possible ATCA counterpart with a faint jet feature in the stacked image (Fig. 6). Source 3 shows a very faint source south of the X-ray coordinates, which is likely unrelated to the X-ray source. A brighter AGN is visible, east of the coordinates.
The derived flux upper limit for source #1 is shown in the multiwavelength SED (Fig. 2).
2.7 NuSTAR observations
Following the detection of IceCube-190331A we requested target of opportunity observations using the NuSTAR X-ray satellite (Harrison et al., 2013) to search for hard X-ray sources coincident with the neutrino event.
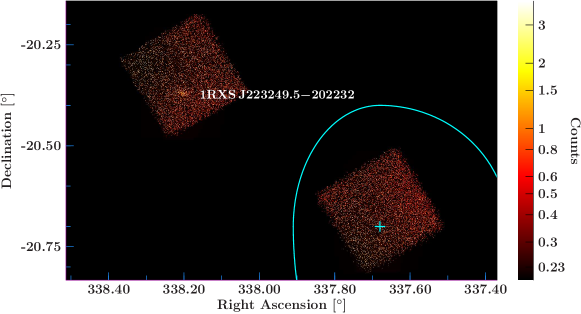
Two observations were performed: the first (ObsID 90502615001, started on 2019 April 2 UT) targeting the best-fit neutrino position, and the second (ObsID 90502616001, 2019 April 3) on the nearby Fermi/LAT source 4FGL J2232.6-2023, associated with the hard X-ray source 1RXS J223249.5-202232, a BL Lac object at a redshift of 0.386 (Jiménez-Bailón et al., 2012). A sky map containing data from both exposures plus their relative locations with respect to the neutrino event and Swift pointings is shown in Fig.8.
Both focal plane modules (FPMs A and B) were used to collect data, which were then processed using version 1.9.2 of the NuSTARDAS software included in HEASOFT v6.27.2 and analysed using XSPEC v12.11.0.
2.7.1 Observation of the IceCube-190331A position
A total exposure of 5.5 ks per FPM was collected at the IceCube-190331A position. The observations did not reveal any new X-ray sources and therefore we derive a flux upper limit at the best-fit neutrino location. The observations from both FPMs were first combined and a count rate upper limit was calculated using the uplimit routine in XIMAGE which implements the Bayesian approach of Kraft et al. (1991). This upper limit was calculated for a circular region with a 30” radius centred at the best-fit neutrino location, but given the homogeneity of the field we expect it to be illustrative of the entire NuSTAR exposure. The count rate upper limit is 4.66 counts / ks, which corresponds to a flux upper limit of erg cm-2 s-1 in the 3-10 keV range as calculated using the WebPIMMS tool333https://heasarc.gsfc.nasa.gov/cgi-bin/Tools/w3pimms/w3pimms.pl for a photon index of .
2.7.2 Observation of 1RXS J223249.5-202232
An exposure of 5.1 ks per FPM was obtained targeting 1RXS J223249.5-202232. The spectral data from both FPMs were combined using the addspec routine following the procedure recommended by the NuSTAR science team and then grouped requiring at least 30 counts in each spectral bin. The resulting spectrum covers the 3-15 keV range with good statistics after bad channels are excluded. The spectrum was then fit with an absorbed power-law model (phabs powerlaw, PL hereafter) where the absorption was kept fixed at the Galactic HI column contribution of cm-2 obtained from HI4PI Collaboration et al. (2016b)444https://heasarc.gsfc.nasa.gov/cgi-bin/Tools/w3nh/w3nh.pl.
The best-fit PL parameters (for the form ) were a flux normalisation cm-2 keV-1 s-1, at a normalisation energy of 1 keV, and a photon index . These parameters yield a good fit, with a /dof = 6.33/7 (-value of 0.502). A second fit was attempted to test for intrinsic absorption at the source using the zphabs model and the source redshift but this failed to constrain the intrinsic absorption given the limited statistics of the data set.
Using the best-fit model we calculate a flux of erg cm-2 s-1 in the 2-10 keV range. This flux is significantly lower and has a softer photon index than the values reported by Jiménez-Bailón et al. (2012) based on hard-band XMM-Newton EPIC observations obtained in 2008 in the same energy range ( erg cm-2 and ).
2.7.3 Summary of NuSTAR results
No new sources were identified in the NuSTAR observations near the best-fit neutrino position. Similarly, the known source 1RXS J223249.5-202232 was observed in a low flux state, and no evidence of gamma-ray activity is visible in the online Fermi All Sky Variability Analysis (FAVA)555https://fermi.gsfc.nasa.gov/ssc/data/access/lat/FAVA/LightCurve.php?ra=338.1725&dec=-20.3909, nor was reported at the time of the neutrino alert detection666https://gcn.gsfc.nasa.gov/gcn3/24040.gcn3.
We therefore claim no connection between this source and the observation of the IceCube-190331A event. The NuSTAR pointings do not cover the new Swift sources so no constraints can be derived on their hard X-ray fluxes from these observations.
2.8 Helix Nebula
We note that the planetary nebula NGC 7293, more commonly known as the Helix Nebula, is detected on the western side of the UVOT mosaic, within neutrino localisation area. The expected particle energies in a planetary nebula, however, are too low to explain a TeV neutrino event. Planetary nebulae can have fast winds up to km s-1 with a mass loss rate of year-1 (Huarte-Espinosa et al., 2012). Using the kinetic luminosity of , this yields the following magnetic luminosity (Blandford, 2000)
| (1) |
with the magnetic energy fraction , the magnetic field and the radius of the moving wind . After solving for and using the previously calculated kinetic luminosity, we can use it in
| (2) |
using the Hillas condition (v/c; Hillas, 1984), with the elementary charge and the speed of light , to yield
| (3) |
This yields a maximum particle energy of
| (4) |
The peak energy of neutrinos for E2 d/d for incident protons with single energy injection is about 3–5% of the energy of the proton (e.g., Waxman & Bahcall, 1997; Kelner et al., 2006; Murase et al., 2006). We would therefore not expect neutrinos above – GeV from the Helix nebula. For this reason, planetary nebulae have not been considered as sources for high-energy IceCube neutrinos.
3 Results & Discussion
We found four X-ray sources in the Swift/XRT observations. No new sources, or evidence of X-ray activity in a known source, were identified in the NuSTAR observations. We perform follow-up observations on all of them, particularly the brightest three sources. We note that only source #2 is strictly within the IceCube 90% confidence uncertainty region.
We performed detailed follow-up observations of Source # 1, the a priori most likely counterpart based on source brightness. The data has been gathered and collected in Fig. 2. With no radio detection and no Fermi/LAT detection, but a moderate X-ray luminosity ( erg s-1), we conclude that this source is a possible radio-quiet quasar. A X-Shooter optical spectrum confirms that this object is a type 1 Seyfert galaxy. Neutrinos have been predicted from the cores of AGN in the 10–100 TeV energy range (Murase et al., 2019). The flare contribution may be subdominant while the core contribution can be dominant in the bulk flux (Murase et al., 2019). This would change the current picture that particle acceleration in AGN jets is the dominant way to produce neutrinos from AGN (Kadler et al., 2016; IceCube Collaboration, Fermi-LAT Collaboration et al., 2018), and potentially counterindicated by the high observed energy of this neutrino event.
Neither of the other X-ray sources show obvious counterparts in Fermi/LAT or in ATCA observations. Radio sources are detected close to source #2 and source #3, but are not obviously counterparts to the XRT detections. As they have no known counterparts and the X-ray spectrum cannot distinguish between relevant models, we cannot speculate on what source type they are. They could be AGN, or Galactic X-ray sources, such as compact binary objects. However, IceCube-190331A was detected at a Galactic latitude of , which shows that a Galactic origin is unlikely.
3.1 X-ray coincidences
Here, we examine whether observing 1 X-ray sources within and 3 other near the neutrino uncertainty is noteworthy. Given the uncertainties in the right ascension and the declination ra+, ra-, dec+, and dec-, the equation for the area of the uncertainty region is given by
| (5) |
which yields 0.35 deg2 for IceCube-190331A. Currently, there is no deep full scan of the sky available in the Swift X-ray band. A full catalog would give us a precise estimate of the number of X-ray sources expected in this region. As an approximation, we use the ROSAT catalogue as a comparison tool (Boller et al., 2016). The 2RXS catalogue includes 135,118 sources. We select sources above Galactic latitudes of to give an estimate of the number of extragalactic sources, which yields 117,094 sources. The surface area of the night sky is 41253 deg2. The Galactic plane area that we exclude is given by , with the radius and the height . This yields a total area for the ROSAT sources of deg2. For the IceCube neutrino event, we’d therefore expect ROSAT sources within the uncertainty region of 0.35 deg2. While we do find exactly one X-ray source within the uncertainty region, it is not a ROSAT source. This is acceptable considering the low number statistics, and therefore does not point towards an association of the neutrino event and the X-ray source. Given that Swift/XRT has a wider energy range and more sensitivity, and that the observations were pointed, it is not surprising to find more X-ray sources in the near vicinty.
4 Conclusions
We have performed Swift/XRT, Swift/UVOT and NuSTAR follow-up observations of the IceCube neutrino alert IceCube-190331A. This event is important as it has a high likelihood of being astrophysical in origin (higher than IceCube-170922A). We find four X-ray sources in the tiled Swift/XRT mosaic observations, with two having high detection significance, while no new sources, or activity in a known one, were identified in the NuSTAR observations.
The brightest Swift/XRT source (#1) is consistent with 2MASS J2229255920184. Due to its known optical counterpart and its X-ray brightness it seemed to be the most likely source of neutrinos. A high X-ray brightness is required to explain the expected electromagnetic emission from secondary cascades of hadronic particles. The lack of -ray emission from the source is not fully consistent with this picture. The inconsistency may be explained if the high densities required for neutrino production in the source cause pair production of the high-energy photons (Zhang & Cheng, 1997). Additionally, we performed follow-up observations of source #1 with X-Shooter and ATCA. The source is not detected in ATCA with strong constraints on the radio flux, and it is not detected by Fermi/LAT. Given the radio-quietness, the low -ray flux and the X-ray detection, the source is either not a blazar or a very faint/distant one. Our X-Shooter spectra has confirmed that source #1 is a type 1 Seyfert galaxy. ATCA follow-up of sources #2 and #3 show possible radio counterparts near the X-ray position. However, neither of them has been detected by Fermi/LAT and they are not in any catalogue. We therefore conclude that there is no blazar counterpart and no other obvious high-energy source counterparts as such, and its likely astrophysical origin remains a mystery. The neutrino localisation region was serendiptidously located near the highest sensitivity location of the field-of-view of Swift/BAT. This constrains and rules out a bright GRB at the time and location of the neutrino. For future IceCube events at high signalness (high probability of being astrophysical in origin), a more rapid multiwavelength response with quasi-simultaneous data will help greatly in identifying the sources of high-energy neutrino alerts.
Acknowledgements
We thank the anonymous referee for useful comments that have improved the manuscript. We thank R. Ciardullo for useful discussions and feedback on the draft. F. K. was supported as an Eberly Research Fellow by the Eberly College of Science at the Pennsylvania State University. P. A. E. acknowledges UKSA support. P. M. acknowledges support from the Eberly Foundation. M. S. is supported by NSF awards PHY-1914579 and PHY-1913607. We thank J.E. Davis for the development of the slxfig module that has been used to prepare the figures in this work. This research has made use of a collection of ISIS scripts provided by the Dr. Karl Remeis-Observatory, Bamberg, Germany at http://www.sternwarte.uni-erlangen.de/isis/. This research has made use of the NASA/IPAC Infrared Science Archive, which is funded by the National Aeronautics and Space Administration and operated by the California Institute of Technology. This publication makes use of data products from the Two Micron All Sky Survey, which is a joint project of the University of Massachusetts and the Infrared Processing and Analysis Center/California Institute of Technology, funded by the National Aeronautics and Space Administration and the National Science Foundation.
References
- Aartsen et al. (2013) Aartsen M., et al., 2013, Science, 342, 1242856
- Aartsen et al. (2017a) Aartsen M. G., et al., 2017a, Astroparticle Physics, 92, 30
- Aartsen et al. (2017b) Aartsen M. G., et al., 2017b, ApJ , 835, 45
- Aartsen et al. (2017c) Aartsen M. G., et al., 2017c, ApJ , 843, 112
- Ayala Solares et al. (2019) Ayala Solares H. A., et al., 2019, Astroparticle Physics
- Barthelmy et al. (1995) Barthelmy S. D., Butterworth P., Cline T. L., Gehrels N., Fishman G. J., Kouveliotou C., Meegan C. A., 1995, Ap&SS , 231, 235
- Barthelmy et al. (2005) Barthelmy S. D., et al., 2005, Space Science Reviews, 120, 143
- Bechtol et al. (2017) Bechtol K., Ahlers M., Di Mauro M., Ajello M., Vandenbroucke J., 2017, ApJ , 836, 47
- Begelman et al. (1990) Begelman M. C., Rudak B., Sikora M., 1990, ApJ , 362, 38
- Berezinskii & Ginzburg (1981) Berezinskii V. S., Ginzburg V. L., 1981, MNRAS , 194, 3
- Beringer et al. (2012) Beringer J., et al., 2012, Phys. Rev. D. , 86, 010001
- Biermann & Strittmatter (1987) Biermann P. L., Strittmatter P. A., 1987, ApJ , 322, 643
- Blandford (2000) Blandford R. D., 2000, Physica Scripta Volume T, 85, 191
- Boller et al. (2016) Boller T., Freyberg M. J., Trümper J., Haberl F., Voges W., Nandra K., 2016, A&A , 588, A103
- Buson & Garrappa (2019) Buson S., Garrappa S., 2019, GRB Coordinates Network, 24040, 1
- Cardelli et al. (1989) Cardelli J. A., Clayton G. C., Mathis J. S., 1989, ApJ , 345, 245
- Cash (1979) Cash W., 1979, ApJ , 228, 939
- Dermer et al. (2014) Dermer C. D., Murase K., Inoue Y., 2014, JHEAp, 3-4, 29
- Eichler (1979) Eichler D., 1979, ApJ , 232, 106
- Evans et al. (2019) Evans P. A., et al., 2019, arXiv:1911.11710, pp 1–6
- Flesch (2017) Flesch E. W., 2017, VizieR Online Data Catalog, 7280
- GCN/AMON NOTICE IceCube-190331A (2017) GCN/AMON NOTICE IceCube-190331A 2017, IceCube-190331A, https://gcn.gsfc.nasa.gov/notices_amon/15947448_132379.amon
- Goldoni et al. (2006) Goldoni P., Royer F., François P., Horrobin M., Blanc G., Vernet J., Modigliani A., Larsen J., 2006, in Society of Photo-Optical Instrumentation Engineers (SPIE) Conference Series. p. 62692K, doi:10.1117/12.669986
- HI4PI Collaboration et al. (2016a) HI4PI Collaboration et al., 2016a, A&A , 594, A116
- HI4PI Collaboration et al. (2016b) HI4PI Collaboration Ben Bekhti N., Flöer L., Keller R., Kerp J., Lenz D., 2016b, A&A , 594, A116
- Haack & Wiebusch (2017) Haack C., Wiebusch C., 2017, PoS, ICRC2017, 1005
- Harrison et al. (2013) Harrison F. A., et al., 2013, ApJ , 770, 103
- Hillas (1984) Hillas A. M., 1984, ARA&A , 22, 425
- Hooper et al. (2019) Hooper D., Linden T., Vieregg A., 2019, J. Cosmology Astropart. Phys., 2019, 012
- Houck & Denicola (2000) Houck J. C., Denicola L. A., 2000, in Manset N., Veillet C., Crabtree D., eds, Astronomical Society of the Pacific Conference Series Vol. 216, Astronomical Data Analysis Software and Systems IX, ASP Conference Proceedings, edited by Nadine Manset, Christian Veillet, and Dennis Crabtree. Astronomical Society of the Pacific. p. 591
- Huarte-Espinosa et al. (2012) Huarte-Espinosa M., Frank A., Balick B., Blackman E. G., De Marco O., Kastner J. H., Sahai R., 2012, MNRAS , 424, 2055
- Ice Cube Collaboration (2019) Ice Cube Collaboration I., 2019, The Astronomer’s Telegram, 12616, 1
- IceCube Collaboration (2014) IceCube Collaboration 2014, Phys. Rev. Lett., 113, 101101
- IceCube Collaboration, Fermi-LAT Collaboration et al. (2018) IceCube Collaboration, Fermi-LAT Collaboration et al. 2018, Science, 361, eaat1378
- Icecube Collaboration (2019) Icecube Collaboration 2019, GRB Coordinates Network, 24039, 1
- Jiménez-Bailón et al. (2012) Jiménez-Bailón E., Chavushyan V., Schartel N., Santos-Lleó M., Huerta E. M., Krongold Y., 2012, AJ , 143, 64
- Kadler et al. (2016) Kadler M., et al., 2016, Nature Physics, 12, 807
- Keivani et al. (2018) Keivani A., Murase K., Petropoulou M., Fox D. B., et al., 2018, ApJ , 864, 84
- Keivani et al. (2019) Keivani A., Santander M., Kennea J. A., Evans P. A., Fox D. B., Krauss F., 2019, GRB Coordinates Network, 24094, 1
- Kelner et al. (2006) Kelner S. R., Aharonian F. A., Bugayov V. V., 2006, Phys. Rev. D. , 74, 034018
- Kopper & Blaufuss (2017) Kopper C., Blaufuss E., 2017, GRB Coordinates Network, Circular Service, No., 21916
- Kraft et al. (1991) Kraft R. P., Burrows D. N., Nousek J. A., 1991, ApJ , 374, 344
- Krauß et al. (2014) Krauß F., et al., 2014, A&A , 566, L7
- Krauß et al. (2018) Krauß F., et al., 2018, A&A , 620, A174
- Mannheim (1993) Mannheim K., 1993, A&A , 269, 67
- Mannheim (1995) Mannheim K., 1995, Astroparticle Physics, 3, 295
- Mannheim et al. (1991) Mannheim K., Biermann P. L., Kruells W. M., 1991, A&A , 251, 723
- McMullin et al. (2007) McMullin J. P., Waters B., Schiebel D., Young W., Golap K., 2007, in Shaw R. A., Hill F., Bell D. J., eds, Astronomical Society of the Pacific Conference Series Vol. 376, Astronomical Data Analysis Software and Systems XVI. p. 127
- Modigliani et al. (2010) Modigliani A., et al., 2010, in Observatory Operations: Strategies, Processes, and Systems III. p. 773728, doi:10.1117/12.857211
- Murase & Ioka (2013) Murase K., Ioka K., 2013, Phys. Rev. Lett., 111, 121102
- Murase & Waxman (2016) Murase K., Waxman E., 2016, Phys. Rev. D. , 94, 103006
- Murase et al. (2006) Murase K., Ioka K., Nagataki S., Nakamura T., 2006, ApJL , 651, L5
- Murase et al. (2013) Murase K., Ahlers M., Lacki B. C., 2013, Phys. Rev. D. , 88, 121301
- Murase et al. (2014) Murase K., Inoue Y., Dermer C. D., 2014, Phys.Rev., D90, 023007
- Murase et al. (2019) Murase K., Kimura S. S., Meszaros P., 2019, arXiv:1904.04226, pp 1–10
- Norman et al. (1995) Norman C. A., Melrose D. B., Achterberg A., 1995, ApJ , 454, 60
- Padovani & Resconi (2014) Padovani P., Resconi E., 2014, MNRAS , 443, 474
- Roming et al. (2005) Roming P. W. A., et al., 2005, Space Sci. Rev. , 120, 95
- Senno et al. (2015) Senno N., Mészáros P., Murase K., Baerwald P., Rees M. J., 2015, ApJ , 806, 24
- Senno et al. (2016) Senno N., Murase K., Mészáros P., 2016, Phys. Rev. D. , 93, 083003
- Skrutskie et al. (2006) Skrutskie M. F., et al., 2006, AJ , 131, 1163
- Smette, A. et al. (2015) Smette, A. et al., 2015, A&A, 576, A77
- Stecker (2013) Stecker F. W., 2013, Phys. Rev. D. , 88, 047301
- Stecker et al. (1991) Stecker F. W., Done C., Salamon M. H., Sommers P., 1991, Phys. Rev. Lett., 66, 2697
- Tamborra & Ando (2016) Tamborra I., Ando S., 2016, Phys. Rev. D. , 93, 053010
- Tavecchio & Ghisellini (2015) Tavecchio F., Ghisellini G., 2015, MNRAS , 451, 1502
- Verner et al. (1996) Verner D. A., Ferland G. J., Korista K. T., Yakovlev D. G., 1996, ApJ , 465, 487
- Vernet et al. (2011) Vernet J., et al., 2011, A&A , 536, A105
- Waxman & Bahcall (1997) Waxman E., Bahcall J., 1997, Phys. Rev. Lett., 78, 2292
- White et al. (1994) White N. E., Giommi P., Angelini L., 1994, in The WGA Catalog of ROSAT Point Sources. p. 41.11
- Wilms et al. (2000) Wilms J., Allen A., McCray R., 2000, ApJ , 542, 914
- Wright et al. (2010) Wright E. L., et al., 2010, AJ , 140, 1868
- Yuan et al. (2020) Yuan C., Murase K., Mészáros P., 2020, ApJ , 890, 25
- Zhang & Cheng (1997) Zhang L., Cheng K. S., 1997, ApJ , 475, 534
Data availability
Data from Swift and NuSTAR data are publicly available on HEASARC (https://heasarc.gsfc.nasa.gov/). 2MASS and WISE data are available publicly at https://irsa.ipac.caltech.edu/frontpage/. Raw ATCA data are available at https://atoa.atnf.csiro.au/query.jsp. X-Shooter data are available on request.