Study of eclipses for Redback pulsar J12274853
Abstract
We present a multi-frequency study of eclipse properties of a transitional redback millisecond pulsar J12274853 discovered in 2014 with the GMRT. Emission from this pulsar is eclipsed at 607 MHz for about 37% of its orbit around the superior conjunction. We observe eclipse ingress and egress transition which last 12% and 15% of its orbit respectively, resulting in only 36% of the orbit being unaffected by eclipsing material. We report an excess dispersion measure (DM) at eclipse boundaries of 0.079(3) pc cm-3 and the corresponding electron column density (Ne) is 24.4(8) x 1016 cm-2. Simultaneous timing and imaging studies suggests that the eclipses in J12274853 are not caused by temporal smearing due to excess dispersion and scattering but could be caused by removal of pulsar flux due to cyclotron absorption of the pulsed signal by intra-binary material constraining the companion’s magnetic field. Additionally, near inferior conjunction at orbital phase 0.71 and 0.82 the pulsed emission is significantly delayed which is associated with a fading of the pulsed and continuum flux densities. At orbital phase 0.82, we measure a change in DM of 0.035(3) pc cm-3 and Ne of 10.8(8) x 1016 cm-2 associated with a dimming of up to 30% of the peak flux density. Such flux fading around a fixed orbital phase is not reported for other eclipsing binaries. Moreover, this event around inferior conjunction could be caused by absorption of pulsed signal by fragmented blobs of plasma generated from mass loss through the L2 Lagrangian point.
1 Introduction
Millisecond pulsars (MSPs) are believed to be generated in a re-cycling process where the pulsar accretes mass from its companion star in a close binary system resulting in a faster spin period via transfer of angular momentum (e.g. Bhattacharya et al. (1992)). A special class of fast spinning MSPs (spin period 8 ms) in evolving compact binaries (less than a day), where the pulsar is in active interaction with its companion are classified as black widow and redback MSP systems. Such compact systems where companions are ablated away by energetic pulsar winds, are in general referred to as spider MSPs. In the majority of such system, the inclination of the binaries allow the intra-binary material to obscure the pulsar emission for a part of its orbit resulting in the observed eclipses. The volume occupied by the eclipsing material is well outside the companion’s Roche lobe, and thus is not gravitationally bound to the companion. The energy of an isotropic pulsar wind at the distance of the companion is given by , where is the spin-down energy of the pulsar and is the distance to the companion. in redback and black widow pulsars are 1034 , whereas for canonical MSPs is around . Roy et al. (2015) reported the discovery of a 1.69 millisecond pulsar J12274853, at a dispersion measure (DM) of 43.4 pc cm-3 associated with LMXB XSS J122704859, using the GMRT at 607 MHz. PSR J12274853 is in a 6.9 hours orbit with a companion of mass 0.170.46 and is eclipsed for large fraction of its orbit at 607 MHz.
The majority of black widow and redback pulsars exhibit long eclipses (10% of the orbital period) near their companion’s superior conjunctions. Thompson et al. (1994) gives a detailed prescription for investigation of the eclipse mechanism in such systems. However, the detailed study of the eclipse properties have been performed for only a few of the spider pulsars: PSR J15444937 (Bhattacharyya et al., 2013), PSR B1744-24A (Lyne et al. (1990), Nice & Thorsett (1992), Bilous et al. (2019)), PSR J18101744 (Polzin et al., 2018), PSR J1816+4510 (Polzin et al., 2020), B195720 (Fruchter et al. (1988), Ryba et al. (1991), Main et al. (2018), Li et al. (2019)), J20510827 (Stappers et al. (1996), Polzin et al. (2020). This could be due to lack of availability of sensitive instruments operating at low frequencies, where the effects of eclipses are expected to be larger. This is addressed by some of the more recent studies (e.g. Main et al. (2018), Li et al. (2019), Polzin et al. (2018) and Polzin et al. (2020)) with sensitive observations using the Arecibo, LOFAR, upgraded GMRT (uGMRT) and the Parkes telescope.
In this paper we present a detailed study of the eclipses in the PSR J12274853 system at multiple frequencies. Section 2 details the observations and analysis procedure. Different sub-sections of Section 3 presents the results from study of the eclipse properties of PSR J12274853. Section 3.1 concentrates on main eclipses at 607 MHz. Investigation of frequency dependent eclipsing is presented in Section 3.2. In addition to the main eclipse, we also observe excess dispersion around inferior conjunction, which is reported in Section 3.3. Flux fading observed at eclipse ingress and around inferior conjunction is reported in Section 3.4. Discussions on these results and a summary are presented in Section 4.
2 Observation and analysis
Following the discovery, PSR J12274853 is being regularly observed using the GMRT coherent array at 607 MHz. Most of the observations reported in this paper were carried out with the legacy GMRT system using GMRT Software Back-end (GSB; Roy et al. (2010)). We generated filter-bank data products having 5120.0651 MHz channels at 61.44 s time resolution. These data were incoherently de-dispersed at the pulsar DM and folded with the ephemeris using PRESTO (Ransom et al., 2002). We used a multi-Gaussian template for extracting times-of-arrival (TOAs) at each observing epoch. The TOAs were generated with typically 4 minutes integration time for achieving optimal signal-to-noise (S/N) as well as a time resolution sufficient to probe eclipse transition. Similar time resolution was used in the imaging analysis (described below). PSR J12274853 is eclipsed for around 2.8 hours, which is 40% of its orbit (Roy et al., 2015). Many of the timing observations typically of 1 hour duration regularly performed with the GMRT, partially samples eclipse phase allowing us to probe eclipse characteristics of PSR J12274853.
In order to probe the frequency dependence of eclipse characteristics we observed PSR J12274853 simultaneously at 300500 and 550750 MHz using the upgraded GMRT (uGMRT; Gupta et al. 2018). The increase of instantaneous band-width compensates for the reduction of the coherent array gain compared to our earlier observations resulting from splitting antennas into two sub-arrays. The 550750 MHz data was recorded in 40960.0488 MHz filter-bank output at 81.92 s time resolution, which was incoherently de-dispersed and folded. Whereas 300500 MHz data was recorded in 5120.390 MHz coherently de-dispersed filter-bank format at 10.24 s time resolution in order to avoid residual dispersion smearing reducing the TOA uncertainties.
Visibility data were recorded with 2 seconds time resolution in parallel with the beam-formed data. Every observation of the target pulsar is accompanied with observation of the phase calibrator 1154350 which is sufficiently close and strong enough to perform bandpass and gain calibration (7.8 Jy). Continuum imaging analysis is carried using an automated imaging pipeline (Kudale, Chengalur, Mohan, in preparation) which is composed of flagcal (Chengalur, 2013), PyBDSM (Mohan et al., 2015) & CASA111http://www.casa.nrao.edu. In total three self calibration and imaging cycles are carried out, of which the first two cycles of gain calibration were done with phase-only calibration and last was done with amplitude and phase calibration. Final imaging after the last self-calibration cycle is done only for the duration for which pulsar was in the non-eclipsing phase of its orbit. This enabled us to estimate average flux density on given observation epoch. The self-calibrated uvdata were then used to generate snapshot images of the pulsar with an average time duration 3 minutes to generate the lightcurve. Since the pulsar is a point source, we use the peak flux density obtained by fitting a 2D Gaussian to the pulsar image to estimate pulsar flux density. This was done using the imfit task of CASA, with same region box around the pulsar used to do the fit in all image frames. To obtain errorbars on the flux densities we used the task imstat of CASA to estimate the rms near the pulsar location. This we feel, is a conservative, but better estimate of the true uncertainty than the formal error to the peak of the Gaussian fit.
3 Results
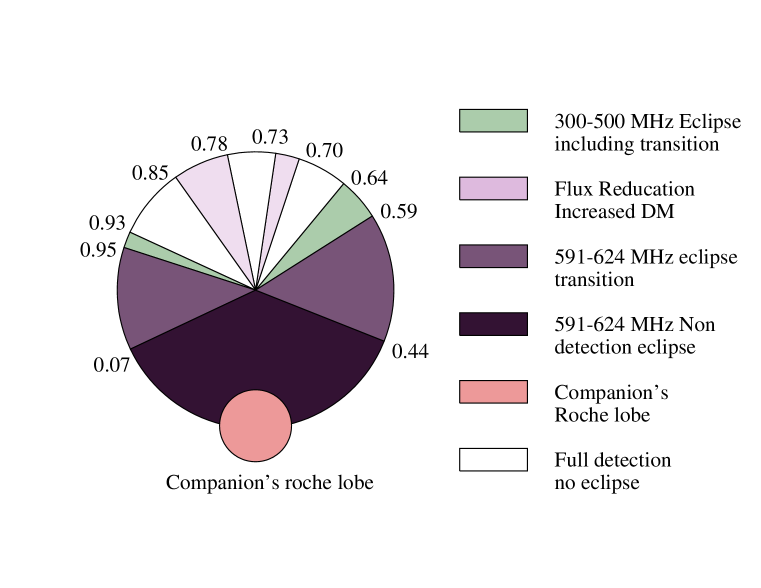
Even though the orbital period of PSR J12274853 is 6.9 hours, the source is visible at the GMRT sky for only 3.5 hours. Each observing session, typically of 1 hour duration, covers only a part of the orbital phase. However, regular timing observations performed with the GMRT, allowed us to use this collection of observations to probe eclipse boundaries. Similar to Fig. 1 by Polzin et al. (2019), we show a schematic diagram of the companion’s orbit for PSR J12274853 system highlighting companion’s Roche lobe (RL = 0.51 R⊙, Eggleton (1983), using 1.4 M⊙ as pulsar mass and 0.2 M⊙ as companion mass), eclipse regions at 591624 MHz and 300500 MHz. The observed flux fading near inferior conjunction associated with increase of the line-of-sight DM is also indicated in this figure. We describe the main results from multi frequency investigation of PSR J12274853 in the following sections.
3.1 Study of eclipses at 591624 MHz
Our sample consists of 13 epochs of observations at 591624 MHz, out of which 6 observations include an eclipse ingress and 7 observations include an eclipse egress. Timing residuals of these observations are presented in Fig. 2. We observed substantial delays in the timing residuals (888(28) s) due to line-of-sight excess DMs at the eclipse boundaries associated with corresponding drops in the flux density. Moreover, we find that the eclipse ingress and egress transitions are spread over a range of orbital phases as shown by shaded regions in Fig. 2. The eclipse ingress transition starts from = 0.95 and ends at 0.07, resulting in total ingress duration of 0.12 in orbital phase. Using the detection at latest ingress phase ( 0.07) and earliest egress phase ( 0.44) from a sample of 13 eclipses, we estimate the duration of the completely eclipsed phase to be 37% of the orbital period. This duration is smaller than the value reported in Roy et al. (2015), which was based on a single ingress and egress detection. The egress transition region is spread over orbital range from 0.44 to 0.59 resulting in total egress side transition duration of 0.15 in orbital phase. Thus the egress transition is seen for longer duration compared to the ingress transition (by 12.43 minutes ), which is also seen in other eclipsing binary systems, e.g. PSR J18101744 (Polzin et al., 2018), PSR J15444937 (Bhattacharyya et al., 2013). We find the center of the non-detection eclipse (excluding eclipse transitions) at an orbital phase of 0.255(5), which matches with the superior conjunction orbital phase. The estimated line-of-sight excess DM and electron column density (Ne) from timing residuals are shown in Fig. 2. The full eclipse and eclipse transition zones (shaded regions) seen in Fig. 2 can also be visualized in the schematic top view of the eclipse geometry in Fig. 1, where these regions are highlighted in dark purple and purple colors respectively.
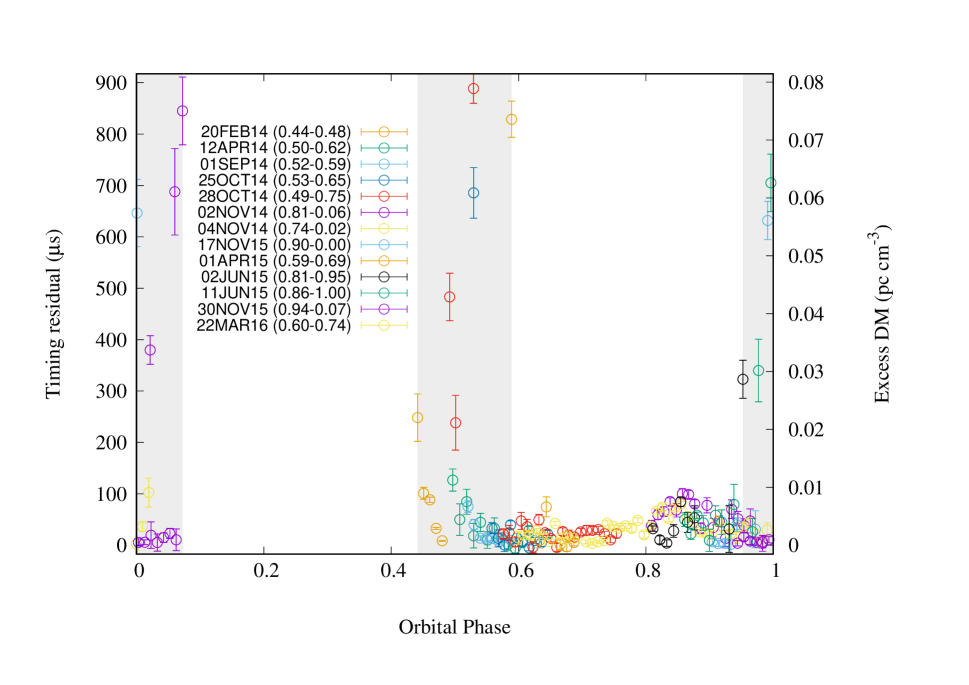
The maximum delay in timing residuals around eclipse transitions detected for PSR J12274853 is 888(28) s at 591624 MHz. This gives excess DM of 0.079(3) pc cm-3 and Ne of 24.4(8) x 1016 cm-2 (see Fig. 2). We estimate the corresponding electron density in the eclipse region (ne Ne/ ) as 1.5 x cm-3, which is at least an order of magnitude higher than the electron density expected in the stellar wind (according to Johnstone et al. (2015) ne due to the stellar wind at a distance similar to is 105 cm-3). This indicates that ablation from the companion is significantly contributing to the intra-binary material causing eclipses. This system also exhibits eclipses for a longer fraction of orbital phase. We compare the eclipse properties of PSR J12274853 with the known eclipsing binaries in Section 4.
3.2 Simultaneous dual frequency study of eclipses
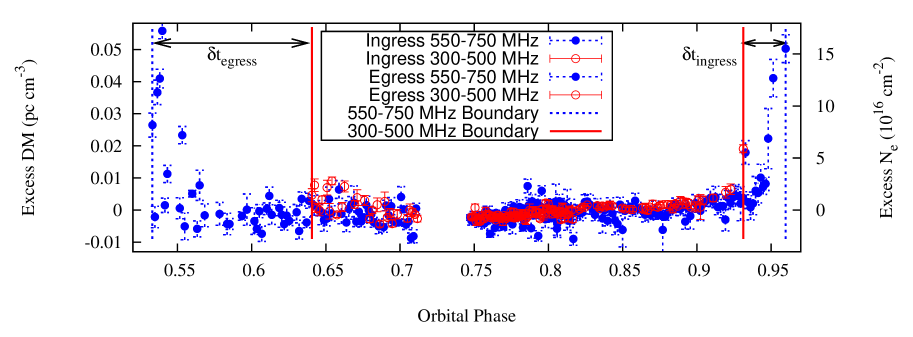
In order to probe the frequency dependence of the eclipse duration for PSR J12274853 we carried out simultaneous dual-frequency observations at 300500 and 550750 MHz using the uGMRT. Observations performed on 14 May 2019 and 24 May 2019 allowed us to probe the eclipse ingress and egress transitions respectively. This eliminates the effect of temporal variations of eclipse boundaries (as seen in Fig. 2) while estimating the frequency dependence of the eclipse duration. The eclipse region for 300500 MHz is shown by light green color in Fig. 1. Variation of the excess DM and Ne with orbital phase derived from the best-fit timing residuals are shown in Fig. 3. Eclipse boundaries are marked by vertical lines: red for 300500 MHz and blue for 550750 MHz. We observe a larger eclipse duration at the lower frequency band (i.e. 1.2 times longer for 300500 MHz band than 550750 MHz band) and we note a possible asymmetry in frequency dependence of eclipse transitions in ingress and egress phase in the 300500 MHz band compared to that in the 550750 MHz band. The ingress starts earlier, 11.860.5 minutes, and egress ends later, 44.570.5 minutes, at 300500 MHz. If we consider a power-law dependence of eclipse duration with frequency (), we estimate a power-law index of = 0.44 from these simultaneous observations. Frequency dependent eclipse durations are observed for some of the other eclipsing binaries as well. Earlier studies report that at lower frequencies the eclipse duration is seen to be larger compared to that of higher frequencies for a given system. We have listed excess DM, pulsar wind flux (), eclipse duration and power-law index for eclipsing binaries in Table 1. We observed an asymmetry in eclipse boundaries between the two observing bands where by 32.70.7 minutes. From this we can derive separate power-law frequency dependence for ingress () and egress () transitions (w.r.t superior conjunction), where = 0.19 and = 0.66.
|
3.3 Excess dispersion around inferior conjunction
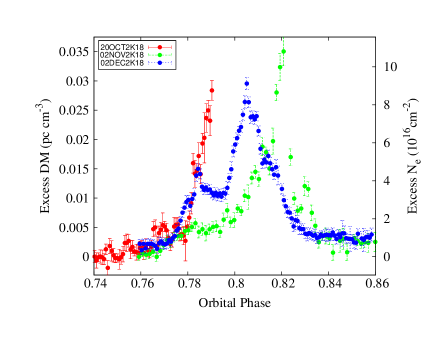
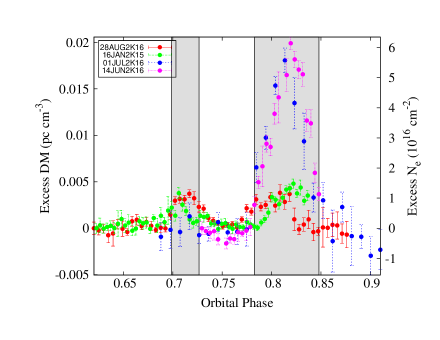
In addition to eclipses seen at orbital phases from 0.95 up to 0.59, PSR J12274853 exhibits occasional occurrences of residual delays around of 0.7 and 0.8 (marked by the light purple color in the eclipse geometry in Fig. 1). This is well outside the eclipse regions, centered around inferior conjunction, = 0.75 (seen in the top panel of Fig. 4). The largest excess DM and Ne we measured at = 0.82 is 0.0199(6) pc cm-3 and 6.1(2) x 1016 cm-2 respectively, which is factor of 4 lower than the values measured at the eclipse boundaries. Whereas at = 0.71 we measured an excess DM of 0.0037(6) pc cm-3 and Ne of 1.1(2) x 1016 cm-2. The durations of these phenomenon of excess dispersion measured at of 0.7 and 0.8 are 11.51.7 and 27.11.7 minutes respectively. We present three epochs of coherently de-dispersed observations at 550750 MHz probing excess dispersion around of 0.82 at higher time-resolution as seen in the bottom panel of Fig. 4. The higher S/N data from the coherently de-dispersed observations allow us to probe eclipses at time resolution of 26 seconds as compared to the 591624 MHz incoherently de-dispersed data which has time resolution of 2.3 minutes. These observations equipped with higher time-resolution and enhanced sensitivity (due to wider band-width) reveal a maximum excess DM of 0.035(3) pc cm-3 and Ne of 10.8(8) x 1016 cm-2. We estimate the corresponding electron density in the eclipse region (ne Ne/ ) as 0.3 x cm-3, which is at least an order of magnitude higher than the electron density in the stellar wind (according to Johnstone et al. (2015) ne due to stellar wind at a distance similar to separation between companion and inferior conjunction is 104 cm-3).
3.4 Continuum and pulsed flux
|
Aided by the capability of simultaneously recording visibilities along with the tied-array coherent beam from the GMRT interferometer, we estimated flux densities around eclipse boundaries using continuum imaging and compared that with the pulsed flux densities. Unlike pulsed flux densities the flux densities obtained from continuum imaging are expected to be unaffected by the temporal smearing caused by excess dispersion and/or scattering. This comparative study of continuum and pulsed flux densities can be used for understanding the eclipse mechanism, which was done by (Roy et al., 2015) for PSR J12274853 while probing the egress boundary. Apart from PSR J12274853, imaging studies for eclipsing binaries were done by Polzin et al. (2020) for PSRs B195720 & J18164510, by Polzin et al. (2018) for PSR J18101744 and by Broderick et al. (2016) for PSR J22155135.
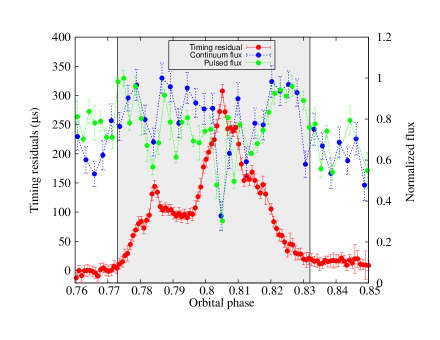
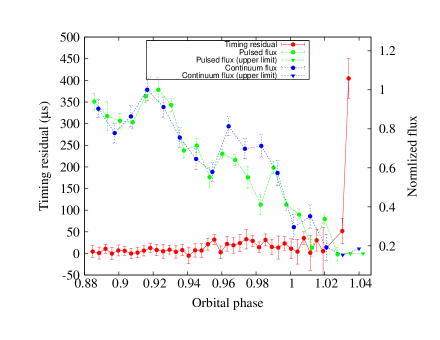
For PSR J12274853 we analyzed the imaging data (details in Section 2) to produce a lightcurve for the pulsar signal during eclipse ingress and during the instances of excess dispersion around inferior conjunction. The top panel of Fig. 5 shows the continuum (marked in blue) and pulsed (marked in green) flux densities as function of orbital phase for an eclipse ingress. A curve showing the timing residuals (marked in red) reaching up to 404 46 s is also added in this plot. The continuum and pulsed flux densities show correlated changes as the pulsar is transitioning into eclipse at 0.03, where the timing residuals are rapidly increasing. We have carried out similar lightcurve analysis for the 2 Dec 2018 event of excess dispersion around = 0.8. As seen in the bottom panel of Fig. 5, the TOAs (red curve) are delayed by about 307 11 s at = 0.8. The continuum flux density (blue curve) and pulsed flux density (green curve) fade in anti-correlation with the arrival times. The region with the excess dispersion delay is highlighted in bottom panel of Fig. 5. The two peaks of timing residual at = 0.783 and 0.805 are exactly coinciding with two dips of the continuum and pulsed flux densities. The observed continuum flux density at = 0.805 is around 30% of the peak continuum flux density measured at orbital phase =0.825. Overall the pulsed flux density is consistent with the continuum flux density. For the orbital range of 0.79 to 0.8 the pulsed flux density is a little bit lower than the continuum flux density. This could be due to the presence of temporal broadening caused by increased DM as also seen in Polzin et al. (2020). We performed light curve measurements of nearby point sources within the field-of-view showing no significant variation of flux densities over the observing span. We observed scintles of a few MHz in size, as well as flux brightening of a few minutes duration on both sides of the event of excess dispersion (orbital phase 0.805), which can explain the enhancement of flux densities (highlighted region in the bottom panel of Fig. 5).
4 Discussion and Summary
| Pulsar | Excess DM | α (10 | Eclipse | n | Referenceζ |
| Name | (pc cm | ( | durationβ | ||
| J10230038 (RB) | 0.15(700) | 0.33 | 40(685) | -0.41 | 1 |
| J1048+2339 (RB) | 0.008(327) | 0.03 | 57(327) | 10 | |
| J12274853(RB) | 0.079(607) | 0.29 | 64(607) | -0.44 | 2 |
| J12274853γ (RB) | 0.035(607) | 6(607) | 2 | ||
| J15444937 (BW) | 0.027(607) | 0.11 | 13(322) | 3 | |
| J17232837 (RB) | 0.04 | 26(1520) | 4 | ||
| B174424A (RB) | 0.6(1499.2) | 50δ(820) | 5 | ||
| J18101744 (BW) | 0.015(325) | 0.18 | 13(149) | -0.41 | 6 |
| J18164510 (RB) | 0.01(149) | 0.08 | 24(121) | -0.49ϵ | 8 |
| B195720 (BW) | 0.01(149) | 0.22 | 18(121) | -0.18 | 8 |
| J20510827 (BW) | 0.13(705-4023) | 0.06 | 28(149) | -0.41 | 7,8 |
| J22155135 (RB) | 0.28 | 66(149) | -0.21ϵ | 8,9 |
: Using https://apatruno.wordpress.com/about/millisecond-pulsar-catalogue/
: The eclipse duration (in % of orbit) includes non-detection and
associated ingress, egress transition.
: Parameters for excess dispersion observed around inferior conjunction.
: For majority of the observed eclipses. However,
observed eclipse durations are variable and sometimes completely
enshrouding the pulsar (Bilous et al., 2019).
: The value of the estimated power law index using all
available frequency measurements as given in the recent literature.
: List of references; 1: Archibald et al. (2009); 2: Current work; 3: Bhattacharyya et al. (2013); 4: Crawford et al. (2013); 5: Bilous et al. (2019); 6: Polzin et al. (2018); 7: Polzin et al. (2019); 8: Polzin et al. (2020); 9: Broderick et al. (2016), 10: Deneva et al. (2016)
We find that during ingress and egress the pulses are significantly delayed relative to best-fit timing model. The largest timing residual deviation that we measure is 888(28) s. We estimate excess DM and Ne as 0.079(3) pc cm-3 and 24.4(8) x 1016 cm-2 respectively. The eclipse duration including ingress, egress transition for PSR J12274853 is about 2653 minutes (64% of its orbit), indicating that for a larger fraction of its orbit the pulsar is enshrouded by the intra-binary materials. From Table 1 we note that the observed values of excess DM, Ne, eclipse duration and for PSR J12274853 are similar to PSR J10230038, which is the other LMXBMSP transitioning system. An asymmetry is seen between egress and ingress duration, egress being longer by 12.43 minutes. This asymmetry can be caused by a tail of eclipsing material swept back due to orbital motion of companion, which is also observed for other eclipsing binaries (e.g. Polzin et al. (2020)). Such asymmetries can be generated by the interaction of out-flowing gas from companion with pulsar radiation, which can create increased density in the trailing part of the outflow as shown using hydrodynamical simulation by Tavani et al. (1991) suggesting this as the explanation for the observed eclipses of PSR B195720 (Fruchter et al., 1990). From the dual frequency observations on two epochs one covering egress boundary and another covering ingress boundary, we observed that 300500 MHz eclipse duration is longer than 550750 MHz. A longer eclipse duration at lower frequencies is also observed for other eclipsing binaries (Broderick et al. (2016), Polzin et al. (2018), Stappers et al. (2001), Polzin et al. (2020)). In addition we observe that for PSR J12274853 ingress boundary starts earlier (11.9 minutes) and egress ends later ( 44.6 minutes) at lower frequency (300500 MHz) than at higher frequency (550750 MHz), i.e by 32.70.7 minutes.
We estimate the power law index for the frequency dependent eclipse duration as = 0.44. From Table 1, we find generally redback pulsars have relatively longer eclipse duration and excess DM at the eclipse boundaries compared to the black widow systems. Future study of a statistically significant sample of such eclipsing binaries over a wide frequency range is warranted for better understanding.
We observe a fading of the pulsar flux density around inferior conjunction ( 0.7 & 0.8) which is also associated with an excess timing delay on several occasions ( 25% of all observations). To our knowledge such systematic change of flux density around a fixed orbital phase (i.e. inferior conjunction in this case) is not reported for any other eclipsing binary. Occasional clustering of fragmented blobs of plasma around the inferior conjunction could possibly lead to such decrease in flux. The maximum value of excess DM and Ne observed around inferior conjunction ( = 0.82) is factor of two to four times lower than that observed at the eclipse boundary for PSR J12274853. In this context we note that for PSR J15444937 (having very similar excess DM and Ne as seen in PSR J12274853) frequency dependent eclipsing around superior conjunction is observed, where the pulsed signal exhibits a decrease in flux at higher frequency ( 607 MHz) and is completely eclipsed at lower frequency ( 322 MHz) as reported by Bhattacharyya et al. (2013). Future investigations of PSR J12274853 at lower frequencies may reveal frequency dependent eclipsing around inferior conjunction. Short eclipses are generally seen around eclipse region centered on superior conjunction in other eclipsing binaries, e.g. for PSR J15444937 by Bhattacharyya et al. (2013). However for PSR J12274853 we observe the phenomenon of excess dispersion with flux fading preferentially centered around inferior conjunction. According to de Martino et al. (2015), the X-ray emission originates in an intra-binary shock produced by the interaction of the outflow from the companion and the pulsar wind. We also note that de Martino et al. (2015) observed a dip in the count rate centered at = 0.75 while monitoring X-ray orbital modulation of the pulsar. Radio observations reported in this paper have at least an order of magnitude better orbital phase resolution than the X-ray observations, which possibly allowed us to resolve the single dip seen in X-ray in two symmetric dips observed in radio around inferior conjunction. Tavani et al. (1991) explained the observed eclipse properties for PSRs B195720 and B174424A using hydrodynamical simulations of the companion’s wind outflow. They showed that the eclipses are created due to the shocks generated by interaction between the pulsar radiation and the out flowing gas from the companion star. They explained drastic eclipse changes observed for PSR B174424A by Lyne et al. (1990), while inferring that the eclipse shape is dependent on the thermal and kinetic state of the out flowing gas which could be time variable. By progressively decreasing mass loss rate Tavani et al. (1993) arrived at a final mass configuration allowing the pulsar to be visible for a large fraction of orbital phase. Whereas for progressively increasing or for a constant but relatively large value of the mass loss rate, pulsar could get completely enshrouded. According to Linial et al. (2017) mass transfer through L2 Lagrangian point could happen for a system having rapid orbital evolution. In case of PSR J12274852 mass transfer during accretion phase through L2 could be responsible for material floating around inferior conjunction causing excess dispersion. The observed occasional flux fading around the inferior conjunction for J12274853 could also be caused by systematic changes in final mass configurations achieved via variations in the mass loss rate or other parameters such as temperature or Mach number. Frequent multi-frequency observations are planned to probe this in more detail.
From simultaneous timing and imaging analysis we find pulsed and continuum flux densities of PSR J12274853 follow a similar trend at eclipse ingress. Roy et al. (2015) reported similar finding at eclipse egress for the same pulsar. In earlier studies the decrease of continuum flux densities at eclipse boundaries were reported by Polzin et al. (2018) for PSR J18101744 and by Broderick et al. (2016) for PSR J22155135. We also measure the variations of continuum flux densities around inferior conjunction (presented in Section 3.3) and find that minima in continuum flux density coincides with the maxima in excess dispersion.
Now we investigate possible eclipse mechanisms following Thompson et al. (1994). In order to study the pulse smearing due to dispersion as a cause of the eclipse, DM 1.3 pc cm-3 is required to disperse pulsed emission completely. However, the measured largest excess DM at eclipse boundary is 0.079(3) pc cm-3 which is a factor of 16 less and hence rule out the dispersion as the cause of eclipse. The scattering due to excess Ne can broaden the pulse and change pulse profile. However, we have not seen any signature of profile evolution at eclipsing boundaries. Thus scattering as a cause is ruled out. Moreover, temporal smearing due to the dispersion or scattering is not expected to change the continuum flux density. For refraction to be the cause of the eclipse the expected group delay at the ingress or egress would be 10100 ms as reported by Thompson et al. (1994). We measure maximum time delay around eclipse boundary 888 s, for PSR J12274853, which is at least an order of magnitude smaller than the group delay required for refraction of radio beam causing eclipse. This implies refraction can not be the cause of eclipse. For an eclipsing binary system with temperature T and clumping factor of the eclipsing medium (), the optical depth due to free-free absorption is given by Equation 1 (Thompson et al., 1994), where is electron column density, L is absorption length.
| (1) |
Using Equation 1 we derive, T 102 x K, as relation between the temperature T and clumping factor of the eclipsing medium. This indicates that for free-free absorption to be the cause of eclipse (i.e. ) in PSR J12274853 with Ne = 24.4 x 1016 cm-2 at eclipse boundary and absorption length about twice the size of the eclipse zone, we need either very high clumping factor or very low temperature. Assuming a temperature range from an unheated star to an irradiated star (i.e. 5500 500000 K) according to de Martino et al. (2014), we expect the range of clumping factor to be 400 to 3.5 x 10⁵, which is not physically possible (Muijres, 2012), ruling out free-free absorption as the cause of eclipse. Considering PSR J12274853 has an average flux density at 650 MHz (S) 1.2 mJy, spectral index () 1.8 and distance (dkpc) 1.4 kpc, demagnification (M) , where is radius of curvature of plasma cloud and r is distance from center of curvature, the induced Compton optical depth can be calculated with Equation 2 (Thompson et al., 1994).
| (2) |
We calculate the upper limit of induced Compton depth 7.6 x , which rules out induced Compton scattering to be the cause of the eclipse. The decrease of continuum flux density at eclipse boundary as well as flux fading around inferior conjunction indicates absorption of pulsar flux by line-of-sight material could be a plausible cause of eclipse. In order to check if cyclotron-synchrotron absorption of pulsar emission by non-relativistic or relativistic electrons is the cause of the eclipse we estimate the magnetic field of the eclipsing plasma with Equation 3 (Thompson et al., 1994) where m = /, .
| (3) |
We calculate the magnetic field in the vicinity of the companion to be 27G, and the cyclotron fundamental frequency to be 77 MHz. Observed eclipses reported in this paper for PSR J12274853 are centered at 322 & 607 MHz which are 4th and 8th harmonics of this cyclotron fundamental frequency. In this context, we note that eclipses for PSR J15444937 have been seen up to 20th harmonic of its fundamental cyclotron frequency (Bhattacharyya et al., 2013). For PSR J12274853 cyclotron absorption at fundamental cyclotron frequency and its lower harmonics can be the cause of eclipse. The observed larger frequency dependence of the eclipse egress compared to the ingress can also be explained by the the presence of more stellar material around the eclipse egress than ingress which could result into enhanced frequency dependence of cyclotron absorption optical depth. Since cyclotron absorption optical depth decreases for higher harmonics, it will be useful to probe the eclipse phase for this pulsar at higher frequencies. We plan to estimate the companion’s magnetic field near the eclipse boundaries via studying the variation of rotation measure values (Polzin et al., 2019; Li et al., 2019).
To summarize, in this paper we report a detailed multi-frequency study of the eclipse properties for PSR J12274853. In addition to regular eclipses around superior conjunction, the system also shows evidence of excess dispersion and flux fading around inferior conjunction. Simultaneous studies of pulsed and continuum flux densities indicate flux removal possibly due to the cyclotron absorption rather than temporal smearing as the cause of eclipse, both for regular eclipse as well as for flux fading at inferior conjunction.
We acknowledge support of the Department of Atomic Energy, Government of India, under project no. 12-R&D-TFR-5.02-0700. The GMRT is run by the National Centre for Radio Astrophysics of the Tata Institute of Fundamental Research, India. We acknowledge support of GMRT telescope operators for observations. We acknowledge discussions with Devojyoti Kanasabanik. BWS acknowledges funding from the European Research Council (ERC) under the European Union’s Horizon 2020 research and innovation programme (grant agreement No. 694745)
References
- Archibald et al. (2009) Archibald, A. M., Stairs, I. H., Ransom, S. M., et al., 2009, Science, 324, 1411.
- Bhattacharyya et al. (2013) Bhattacharyya, B., Roy, J., Ray, P. S., et al., 2013, ApJ Letters, 773, 12.
- Bhattacharya et al. (1992) Bhattacharya, D., 1992, NATO Advanced Research Workshop on X-Ray Binaries and the Formation of Binary and Millisecond Radio Pulsars, p. 257.
- Bilous et al. (2019) Bilous, A. V., Ransom, S. M., Demorest, P., 2019, The Astrophysical Journal, 877, 125.
- Broderick et al. (2016) Broderick, J. W., Fender, R. P., Breton, R. P., 2016, MNRAS 459, 2681.
- Chengalur (2013) Chengalur, J. N., 2013, Technical Report NCRA/COM/001.
- Crawford et al. (2013) Crawford, F., Lyne, A. G., Stairs, I. H., et al., 2013, The Astrophysical Journal, 776, 20.
- de Martino et al. (2014) de Martino, D., Casares, J., Mason, E., et al., 2014, MNRAS 444, 3004.
- de Martino et al. (2015) de Martino, D., Papitto, A., Belloni, T., et al., 2015, MNRAS 454, 2190.
- Deneva et al. (2016) Deneva, J. S., Ray, P. S., Camilo, F., et al., 2016, ApJ, 823, 105.
- Eggleton (1983) Eggleton P. P., 1983, ApJ, 268, 368.
- Fruchter et al. (1990) Fruchter, A. S., Berman, G., Bower, G., et al., 1990, ApJ, 351, 642.
- Fruchter et al. (1988) Fruchter, A. S., Gunn, J. E., Djorgovski, S. G., et al., 1988, IAU Circ., No. 4617, #1.
- Johnstone et al. (2015) Johnstone C. P., Gdel, M., Lftinger, T., et al., 2015, A&A, 577, 22.
- Li et al. (2019) Li, D., Lin, F., Main, R., 2019, MNRAS, 484, 5723.
- Linial et al. (2017) Itai Linial, Re’em Saree, 2017, MNRAS, 469, 2441.
- Lyne et al. (1990) Lyne, A. G., Manchester, R. N., D’Amico, N., et al., 1990, Nature, 347, 650.
- Main et al. (2018) Main, R., Yang, I-Sheng, Chan, V., et al., 2018, Nature, 557, 522.
- Mohan et al. (2015) Mohan, N., Rafferty, D., 2015, Astrophysics Source Code Library, 2015ascl.soft02007M.
- Muijres (2012) Muijres L. E., Vlink, J. S., de Koter, A., et al., 2012, A&A 526, A32.
- Nice & Thorsett (1992) Nice, D. J., Thorsett, S. E., 1992, ApJ, 397, 249.
- Polzin et al. (2018) Polzin, E. J., Breton, R. P., Clarke, A. O., 2018, MNRAS 476, 1968.
- Polzin et al. (2019) Polzin, E. J., Breton, R. P., Stappers, B. W., et al., 2019, MNRAS, 490, 889.
- Polzin et al. (2020) Polzin, E. J., Breton, R. P., Bhattacharyya, B., et al., 2020, MNRAS, 494, 2948.
- Roy et al. (2010) Roy, J., Gupta, Y., Ue-Li Pen et al., 2010, Experimental Astronomy, 28, 25.
- Roy et al. (2015) Roy, J., Ray, P. S., Bhattacharyya, B., Stappers, B., et al., 2015, ApJ Letters, 800, 12.
- Ryba et al. (1991) Ryba, M. F., Taylor, J. H., 1991, ApJ, 371, 739.
- Ransom et al. (2002) Ransom, S. M., Eikenberry, S. S., Middleditch, J., 2002, AJ, 124, 1788.
- Stappers et al. (1996) Stappers, B. W., Bails, M., Lyne, A. G., et al., 1996, ApJ, 465, 119.
- Stappers et al. (2001) Stappers, B. W., Bailes, M., Lyne, A. G., et al., 2001, MNRAS, 321, 576.
- Tavani et al. (1991) Tavani, M., Brookshaw, L., 1991, ApJ, 381, 21.
- Tavani et al. (1993) Tavani, M., Brookshaw, L., 1993, A&A, 267, 1.
- Thompson et al. (1994) Thompson, C., Blandford, R. D., Evans, C. R., et al., 1994, ApJ, 422, 304.