Self-consistent Color-Mass-to-Light-Ratio relations for Low Surface Brightness Galaxies
Abstract
The color stellar mass-to-light ratio relation (CMLR) is a widely accepted tool to estimate the stellar mass (M∗) of a galaxy. However, an individual CMLR tends to give distinct M∗ for a same galaxy when it is applied in different bands. Examining five representative CMLRs from literature, we find that the difference in M∗ predicted in different bands from optical to near-infrared by a CMLR is 0.10.3 dex. Therefore, based on a sample of low surface brightness galaxies (LSBG) that covers a wide range of color and luminosity, we re-calibrated each original CMLR in , , , J, H, and K bands to give internally self-consistent M∗ for a same galaxy. The - is the primary color indicator in the re-calibrated relations which show little dependence on red ( - ) or near-infrared (J - K) colors. Additionally, the external discrepancies in the originally predicted by the five independent CMLRs have been greatly reduced after re-calibration, especially in near-infrared bands, implying that the near-infrared luminosities are more robust to predict . For each CMLR, the re-calibrated relations provided in this work could produce internally self-consistent M∗ from divergent photometric bands, and are extensions of the re-calibrations from Johnson-Cousin filter system by the pioneering work of McGaugh & Schombert (2014) to SDSS filter system.
1 Introduction
Stellar mass (M∗) is one of the fundamental physical properties of a galaxy since it traces star formation and evolution process of the galaxy, and is crucial to decompose the contributions from stars and dark matter to the dynamics of a galaxy. The stellar population synthesis (SPS) technique is an efficient way to estimate M∗ of a galaxy, whereby fitting the SPS models that rely on the extant stellar evolution theory to galaxy data, either in the form of observed multi-band spectral energy distributions (SEDs), spectra, or spectral indices of the galaxy. Such fit method requires data of SED or spectra, However, not all the galaxies have multi-band imaging or spectroscopic data, so a simple color-based method is more practical to estimate M∗ of a galaxy. The pioneering work of Bell de Jong (2001)(hereafter Bdj01) and Bell et al. (2003)(hereafter B03) have defined relations between color and stellar mass-to-light ratio () of galaxies in the form of equation (1).
| (1) |
The of a galaxy can be predicted from the color stellar mass-to-light ratio relation (CMLR), and subsequently multiplied by the galaxy luminosity to yield M∗ of the galaxy. The CMLR method requires the minimal data and is hence expedient in all applications related to M∗ estimate. Afterwards, a variety of CMLRs have emerged. A number of these CMLRs are calibrated on model galaxies (e.g., Gallazzi & Bell (2009), Zibetti et al. (2009) (hereafter Z09), Into & Portinari (2013)(hereafter IP13), Roediger & Courteau (2015) (hereafter RC15)), and some are calibrated on samples of observed galaxies, such as spiral galaxies(e.g., B03,Portinari et al. (2004), Taylor et al. (2011)), dwarf galaxies (e.g., Herrmann et al. (2016)), and low surface brightness galaxies (e.g., Du et al. (2020)). For galaxies the CMLR method could recover from a single color within an accuracy of 0.1-0.2 dex (Bell de Jong, 2001), and could produce equivalent M∗ to those derived from SED fit method on average (Roediger & Courteau, 2015; Du et al., 2020).
However, in the aspect of the CMLR-based M∗, McGaugh & Schombert (2014)(hereafter MS14) found the existing CMLR tends to give different M∗ for the same galaxy when it is applied in different photometric bands. Based on a sample of disk galaxies, they re-calibrated several representative CMLRs in Johnson-Cousin filter system to ultimately produce internally self-consistent M∗ for the same galaxy when it is applied to different bands of , , , and [3.6] bands (with B-V as color indicator). Inspired by MS14, we expect to extend their work from the Johnson-Cousins bands to the SDSS optical bands and near-infrared (NIR) bands in this work, based on a sample of low surface brightness galaxies (LSBGs), by first examining the internal self-consistency of a CMLR in M∗ estimates from different bands and then re-calibrating the CMLR to be able to give internally self-consistent M∗ estimates from different bands for the same galaxy.
We describe the data in Section 2 and introduce the five representative CMLR models in Section 3. We estimated M∗ from different bands for the sample by the CMLRs, and internally compared M∗ from different bands by each individual CMLR, and then externally compared M∗ predicted by different CMLRs in Section 4. In Section 5, each individual CMLR is re-calibrated to be internally self-consistent in M∗ estimates for the sample, when it is applied in different bands from optical to NIR. We make a discussion in Section 6, including the possible second color term to the re-calibrated relations in Section 6.1, the error budget in predicted by the re-calibrated relations in Section 6.2, comparison between originally predicted and those predicted by the re-calibrated relations in Section 6.3, and comparison between re-calibrated relations in this work and those by MS14 in Section 6.4. A summary and conclusion is given in 7. Throughout the work, the magnitude is in AB magnitude system, and the galaxy distance used to calculate the absolute magnitude and luminosity is directly from the Arecibo Legacy Fast ALFA Survey (ALFALFA) catalogue Haynes et al. (2018), which adopts a Hubble constant of = 70 km s-1 Mpc-1.
2 Data
2.1 LSBG Sample
Since low surface brightness galaxies (LSBGs) are typically gas-rich, we have defined a sample of LSBGs from a survey combination of .40 Hi (Haynes et al., 2011) and SDSS DR7 photometric (Abazajian et al., 2009) surveys, and selection about this sample have been detailedly reported in Du et al. (2015) and Du et al. (2019). This sample includes 1129 LSBGs which have B-band central surface brightnesses () fainter than 22.5 mag arcsec-2 ( 22.5), and has extended the parameter space covered by the previous LSBG samples to fainter luminosity, lower Hi gas mass, and bluer color (Figure 1). In color, the full range of this sample is -0.8 1.7 (the peak at 0.28 and 1 scatter of 0.21), with 95.4 within -0.14 0.70 and 68.3 within 0.07 0.49. In absolute magnitude, the full range of the sample spans over 10 mag, with 95.4 within -13 M -21 mag and 68.3 within -15 M -19 mag. In terms of luminosity, it is composed of the dwarf (M-17.0 mag; 54 of the sample), moderate-luminosity (-19.0M-17.0 mag; 43), and giant galaxies (M-19.0 mag; 3). In terms of morphology, it is dominated by the late-type spiral and irregular galaxies (Sd/Sm/Im; 84.1 of the sample), then the early- and middle-type spiral galaxies (Sa/Sab/Sb/Sbc/Sc/Scd;13.4), and finally the early-type galaxies (E/S0; 0.2)(Du et al., 2019). In this work, we intend to re-calibrate several literature CMLRs (Section 3) based on this sample of LSBGs.

2.2 Photometry
The optical images ( bands) of the sample were downloaded from SDSS DR7 (Abazajian et al., 2009), and the NIR images (JHK bands) were obtained from UKIDSS (Lawrence et al., 2007). For each image, we subtracted the sky background, excluded the bright disturbing objects around the target galaxy, and replaced the masked pixels with the mean value of the surrounding background pixels. The magnitudes of the target galaxy were then measured in these bands in Du et al. (2020) with SExtractor (Bertin & Arnouts, 1996) in the dual-image mode, in which the -band image is regarded as a reference and is used to detect the galaxy source and define the photometric apertures (center, size and shape). Images of the same galaxy in all other bands are photometrically measured within the same aperture defined in the band. The measured magnitudes in all the bands are corrected for Galactic extinction using the prescription of Schlafly & Finkbeiner (2011). As LSBGs are poor in dust content, we do not correct the internal extinction to magnitudes. Finally, magnitudes in all the bands were converted to AB magnitude system. We adopt a distance given in ALFALFA catalogue (Haynes et al., 2018) to compute absolute magnitude and luminosity in each band of JHK. As the aperture definition for each galaxy does not vary between wavelength bands, such measurement gives internally consistent colors.
| model | IMF | TP-AGB | ar | br | ai | bi | az | bz | aJ | bJ | aH | bH | aK | bK |
|---|---|---|---|---|---|---|---|---|---|---|---|---|---|---|
| B03 | ‘diet’ Salpeter | Girardi | -0.306 | 1.097 | -0.222 | 0.864 | -0.223 | 0.689 | -0.172 | 0.444 | -0.189 | 0.266 | -0.209 | 0.197 |
| IP13 | Kroupa | Marigo | -0.663 | 1.530 | -0.633 | 1.370 | -0.665 | 1.292 | -0.732 | 1.139 | -0.880 | 1.128 | -0.945 | 1.153 |
| Z09 | Chabrier | Marigo | -0.840 | 1.654 | -0.845 | 1.481 | -0.914 | 1.382 | -1.007 | 1.225 | -1.147 | 1.144 | -1.257 | 1.119 |
| RC15(BC03) | Chabrier | Girardi | -0.792 | 1.629 | -0.771 | 1.438 | -0.796 | 1.306 | – | – | -0.920 | 0.980 | – | – |
| RC15(FSPS) | Chabrier | Marigo | -0.647 | 1.497 | -0.602 | 1.281 | -0.583 | 1.102 | – | – | -0.605 | 0.672 | – | – |
| Notes. Stellar mass-to-light ratios () in SDSS , , and NIR J, H, K bands are given by the CMLRs of Bell et al. (2003, B03), Into & Portinari (2013, IP13), Zibetti et al. (2009, Z09), Roediger & Courteau (2015) based on BC03 model (RC15(BC03)), and Roediger & Courteau (2015) based on FSPS model (RC15(FSPS) in the formula of log = +. For reference, the initial mass function (IMF) and the TP-AGB prescription adopted by each CMLR model are also given. For IMF, the ‘Kroupa’ denotes the Kroupa (1998) IMF, and ‘Chabrier’ denotes the Chabrier (2003) IMF. For TP-AGB, the ‘Girardi’ denotes the simplified TP-AGB prescriptions (e.g. Girardi & Bertelli, 1998; Girardi et al, 2000; Girardi et al., 2002), while ‘Marigo’ denotes the relatively new TP-AGB prescriptions (e.g. Marigo & Girardi, 2007; Marigo et al., 2008), which incorporate a larger number of TP-AGB stars. | ||||||||||||||
3 CMLR Models
In the pioneering work of MS14, the CMLRs of B03, Z09, IP13, and Portinari et al. (2004)(P04) are re-calibrated in the V, I, K, and [3.6] bands with B - V as the color indicator. In this work, we aim to extend MS14 from Johnson-Cousins filters to SDSS optical and two more NIR filters. Besides the three CMLRs of B03, Z09, and IP13 studied in MS14 which also provide relations in SDSS bands, two more CMLRs of the RC15 based on the BC03 stellar population model (RC15(BC03)) and the FSPS model (RC15(FSPS)) will be considered.
B03 is an empirical relation while the others (Z09, IP13, RC15) are theoretical. B03 is based on a sample of observed galaxies, which are mostly bright galaxies (13 17.5 mag) with high surface brightnesses (HSB; 21 mag arcsec-2), and spans a full range of 0.2 - 1.2 with most galaxies within the range of 0.4 -1.0. (Figure 5 in B03 paper). For the theoretical relations, Z09 is based on a library of stellar population models from the 2007 version of BC03 (CB07), which covers from 0 to 20 Gyr in age, 6 values in metallicity (Z=0.0001 to 0.05), and spans a range of -0.3 - 2.6. IP13 is based on a sample of stellar population models from the isochrones of the Padova, which covers from 0.1 to 12.6 Gyr in age, 7 values in metallicity (Z=0.0001,0.0004,0.001,0.004,0.008,0.019,0.03), and spans a range of from 0.25 - 0.75. RC15 is also based on stellar population models from BC03 or FSPS, which spans a range of -0.25 -1.65 for RC15(BC03) and a range of -0.1 - 1.65 for RC15(FSPS) (Figure 7 in RC15). By comparison, the sample of observed data of LSBGs (Section 2), have a range of 21 mag arcsec-2 and 17.5 mag, and 73 of the sample is bluer than -=0.4. In Table 1, we tabulated these 5 representative CMLRs of B03, IP13, Z09, RC15(BC03), and RC15(FSPS), in , , , J, H, and K bands with - as the color indicator.
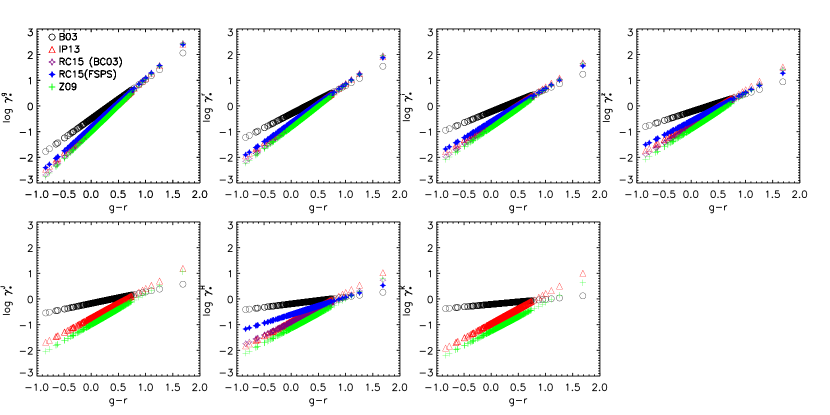
Figure 2 presents the stellar mass-to-light ratios () in band (, =, , , , J, H, K) predicted by each CMLR (Table 1) for the sample, showing the beads-on-a-string nature of from the single color-based CMLR method. It uncovers that the CMLR-based method fails to reproduce the intrinsic scatter of expected from variations in star formation histories (SFH). In each panel, from different CMLRs differ from each other due to distinct choices of initial mass function (IMF), star formation history (SFH), and stellar evolutionary tracks by different CMLR models.
Different IMFs primarily differ in the treatment of low mass stars. The IMF that includes a larger number of low mass stars normally produces a higher at a given color than the IMFs incorporating a smaller number of low mass stars. This is in principle because the low mass stars could greatly enhance the stellar mass but alter little the luminosity. Therefore, diverse IMFs would predominantly lead to difference in the zero-point of CMLRs. For example, stellar mass estimates based on a Chabrier or Salpeter IMF differ by 0.3 dex, with the latter being higher (Roediger & Courteau, 2015). As listed in Table 1, B03 adopts a ‘diet’ Salpeter IMF, which includes more low mass stars than the Chabrier IMF utilized by RC15 and Z09 CMLRs and the Kroupa (1998) IMF used by IP13 CMLR, so B03 gives a higher than other CMLRs at a given color (Figure 2).
Galaxies are expected to have a wide range of SFHs. The best-fit stellar mass could be significantly changed by different SFHs, in particular whether the SFH is continuous (rising/declining) or bursty. Any burst of star formation will bias the models towards lower values than the smooth star formation models at a given color . The uncertainties of in optical due to different SFHs are 0.2 dex for quiescent galaxies, 0.3 dex for star-forming galaxies (Kauffmann et al., 2003), 0.5 dex at a given -, and could be up to 0.6 dex in extreme cases (Courteau, 2014). For the CMLRs in this work, IP13 adopts a single component model of exponential SFH while other CMLRs in this work are all based on two-component models of SFH. Z09 and RC15(BC03) both consider the exponentially declining SFHs with a variety of random bursts superimposed. RC15(FSPS) uses the exponential SFH with only one instantaneous burst added. B03 assumes the exponential SFH (starting from 12 Gyr in the past) with bursts superimposed, but limits the strength of bursts to 10 by mass constrains the burst events to only take place in the last 2 Gyr, so it is relatively smooth.
In Figure 2, the discrepancies in among the CMLRs in the NIR bands (J, H, and K) are obviously larger than the discrepancies in the optical bands (). This primarily rises from the different treatments of the TP-AGB stars which are the low to intermediate mass stars (0.6 10 M⊙) in their late life stage, and emit a considerable amount of light in the NIR but little light to the optical. As listed in Table 1, B03 and RC15(BC03) adopt a simplified prescription (Girardi et al, 2000; Girardi et al., 2002) for TP-AGB stars, whereas IP13, RC15(FSPS), and Z09 consider a relatively new prescription (Marigo & Girardi, 2007; Marigo et al., 2008) for TP-AGB stars. The latter prescription incorporates a larger number of TP-AGB stars, and would hence greatly enhance the NIR luminosity but alter little to the optical luminosity. This inevitably results in lower NIR but change little to the optical .
4 Stellar Mass
The average in the band suffers more from the perturbations of the young, luminous, blue stars which formed recently and radiated a significant amount of light in the blue bands but contribute little to the galaxy mass. Additionally, the SDSS -band data are of low quality, so we shall exclude the -band from the following analysis.
For the LSBG sample, we predict (=, , , , J, H, and K bands) by each independent CMLR with - as the color indicator (Table 1), as - serves as a good color indicator for . The predicted are then multiplied by luminosities in band (Section 2.2) to produce M∗ estimates from band (M). We list the mean and the median M originally by each CMLR for the sample in the left part in Table 2.
We can check external consistency of different CMLRs by comparing M∗ from different CMLRs. It is apparent that the five CMLRs produce distinct M estimates from the band (=, , , , J, H, and K bands). In the same band, B03 gives the highest M∗ while Z09 yields the lowest M∗ for the sample. The difference between M∗ predicted by B03 and Z09 is 0.30.5 dex in optical bands, and dramatically rises up to 0.60.8 dex in NIR bands due to the different treatments for TP-AGB stars (Section 3). The external inconsistency is caused by the different choices of the IMF, SFH, and SPS models.
We can examine each CMLR for the internal consistency from different bands. For any individual CMLR, M∗ predicted from band (M) are closely consistent with M∗ predicted from band (M). However, M (=, , J, H, and K), especially = J, H, and K, deviate from M to varying degrees, and the deviation is progressively increasing as the band goes redder. For instance, the deviation of M from M is 0.1 dex by B03, -0.3 dex by Z09, and -0.1 -0.3 dex by the three other CMLRs. This implies that B03 is nearly internally self-consistent in M∗ estimate from different bands, but it has a small tendency to overestimate M∗ estimates from NIR bands, whereas the four other CMLRs all underestimate M∗ from NIR bands, compared with M.
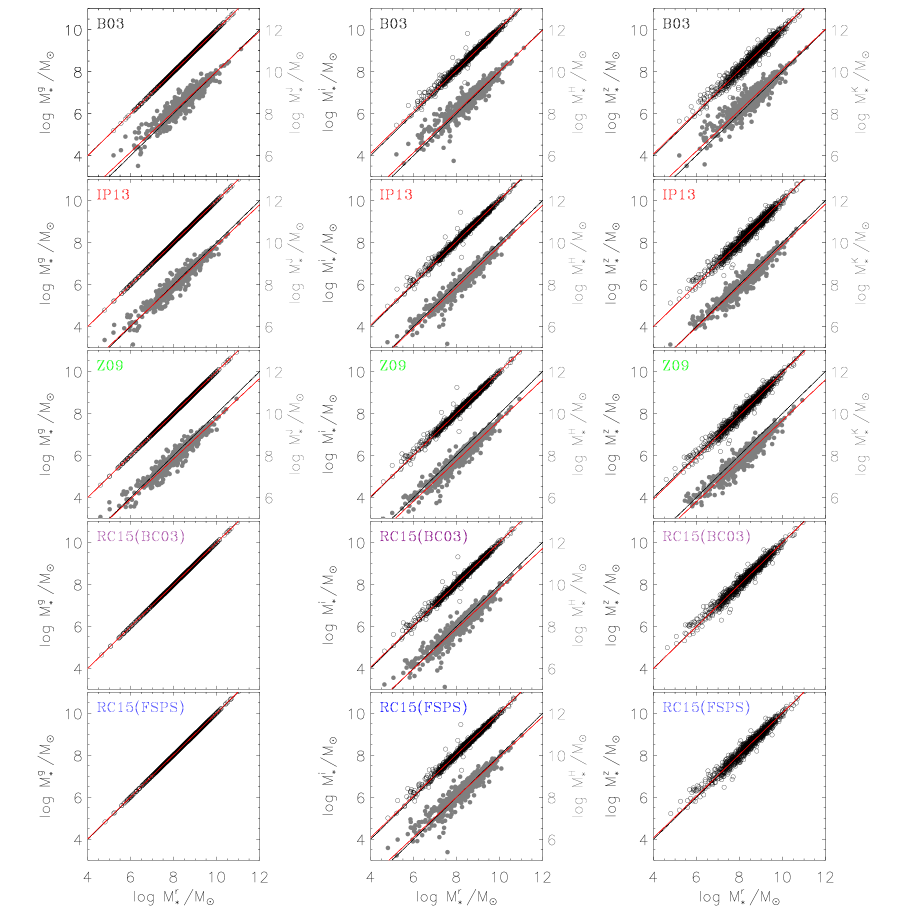
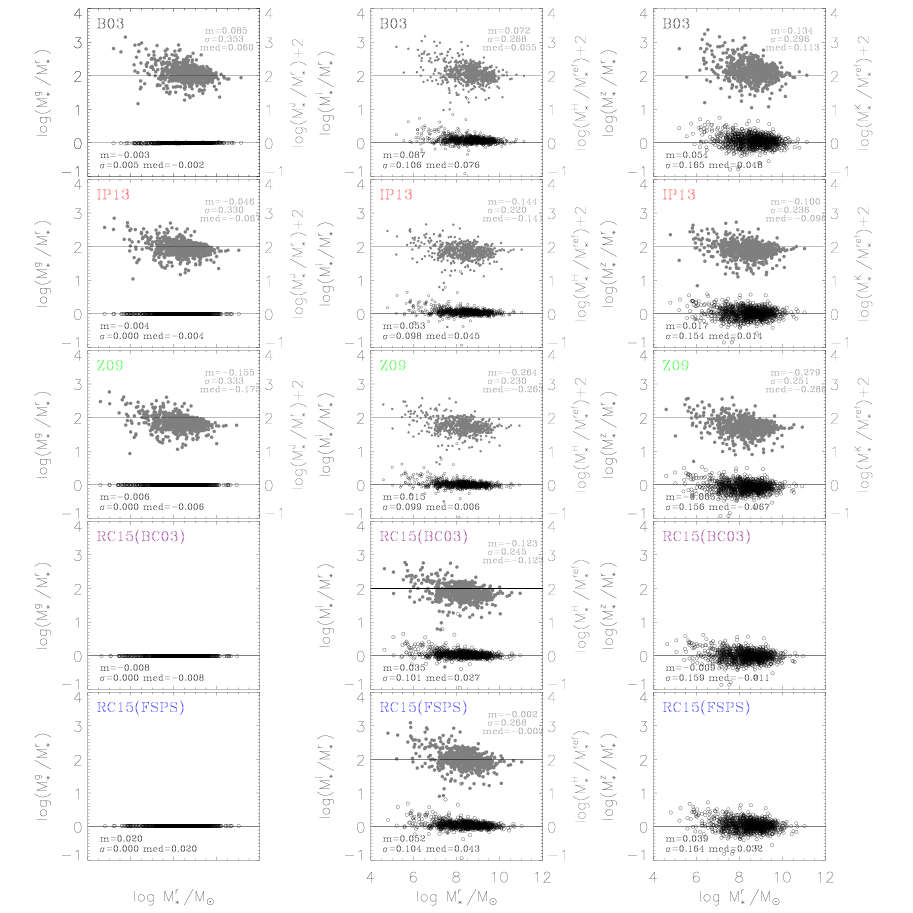
In Figure 3, we show M (= , , , , J, H, and K) against M predicted by each CMLR for the sample (black open circles or grey filled circles). For each panel, the black dashed lines represent the line of unity for the data. If the CMLR is internally self-consistent in M∗ estimate from band to band, the data should exactly follow the line of unity. However, it does not seem to be the fact given that the data (black open circles or grey filled circles) in each panel obviously deviate from the line of unity (black dashed lines) to different degrees, except for the data in the panel of M versus M. This demonstrates that M are highly consistent with M while M (= , , J, H, and K) deviates from M, and the deviation is progressively increasing as the band goes redder. In order to clearly display the deviation of data from the line of unity, we plot the residuals of data from the line of unity in Figure 4. In the case of internally inconsistency of each CMLR from band to band, we shall calibrate each CMLR to be internally self-consistent in M∗ estimates from different bands, based on this LSBG sample in 5.
| band | B03 | IP13 | R15(BC03) | R15(FSPS) | Z09 | B03 | IP13 | R15(BC03) | R15(FSPS) | Z09 |
|---|---|---|---|---|---|---|---|---|---|---|
| 8.64 | 8.43 | 8.30 | 8.44 | 8.26 | 8.64 | 8.43 | 8.30 | 8.44 | 8.26 | |
| 8.65 | 8.43 | 8.31 | 8.42 | 8.27 | 8.65 | 8.43 | 8.31 | 8.42 | 8.27 | |
| 8.73 | 8.48 | 8.35 | 8.47 | 8.29 | 8.66 | 8.42 | 8.32 | 8.43 | 8.28 | |
| 8.70 | 8.44 | 8.30 | 8.46 | 8.21 | 8.66 | 8.42 | 8.32 | 8.43 | 8.28 | |
| J | 8.68 | 8.30 | – | – | 8.06 | 8.62 | 8.38 | – | – | 8.24 |
| H | 8.68 | 8.21 | 8.15 | 8.38 | 7.97 | 8.62 | 8.37 | 8.28 | 8.39 | 8.23 |
| K | 8.75 | 8.26 | – | – | 7.97 | 8.64 | 8.38 | – | – | 8.24 |
| 8.75 | 8.55 | 8.42 | 8.56 | 8.38 | 8.75 | 8.55 | 8.42 | 8.56 | 8.38 | |
| 8.76 | 8.55 | 8.43 | 8.54 | 8.39 | 8.76 | 8.55 | 8.43 | 8.54 | 8.39 | |
| 8.84 | 8.60 | 8.46 | 8.59 | 8.40 | 8.77 | 8.54 | 8.43 | 8.55 | 8.39 | |
| 8.82 | 8.55 | 8.42 | 8.58 | 8.32 | 8.77 | 8.54 | 8.44 | 8.55 | 8.39 | |
| J | 8.83 | 8.43 | – | – | 8.20 | 8.77 | 8.52 | – | – | 8.38 |
| H | 8.80 | 8.33 | 8.28 | 8.51 | 8.09 | 8.75 | 8.49 | 8.4 | 8.52 | 8.35 |
| K | 8.88 | 8.38 | – | – | 8.08 | 8.77 | 8.49 | – | – | 8.35 |
5 Self-consistent M/L-color relations
5.1 Self-Consistent Stellar Masses
For each individual CMLR, the M∗ estimates from band (M) closely agree with those from band (M) for the sample. However, the M∗ estimates from , , J, H, and K bands differ from M for the sample to varying degrees, respectively (Section 4). Assuming M as the reference M∗ for a galaxy, we can fit the relations between M ( = , , J, H, and K) and M of the sample in the function form below following MS14
| (2) |
where is the slope of the linear fit line, and is the M∗ where band intersects band. A ‘robust’ bi-square weighted line fit method is adopted to fit data of the LSBG sample. The fit lines are over-plotted as red solid lines in each panel in Figure 3, which show deviation from the line of unity in panels of , , J, H, and K bands, demonstrating the problem of self-inconsistency in M∗ estimates from different bands for the same sample. The coefficients from the fit are tabulated in Table 3.
| model | log | log | log | log | log | |||||
|---|---|---|---|---|---|---|---|---|---|---|
| B03 | 0.994 | 20.609 | 0.994 | 16.132 | 0.965 | 10.288 | 0.988 | 13.395 | 0.981 | 14.738 |
| IP13 | 0.995 | 17.362 | 1.005 | 6.132 | 0.969 | 6.302 | 0.995 | -21.17 | 0.988 | 0.482 |
| Z09 | 0.994 | 9.032 | 1.004 | 28.181 | 0.968 | 2.897 | 0.984 | -7.583 | 0.983 | -8.188 |
| RC15(BC03) | 0.992 | 11.488 | 0.999 | -8.445 | – | – | 0.981 | 1.729 | – | – |
| RC15(FSPS) | 0.992 | 13.331 | 0.991 | 11.927 | – | – | 0.976 | 7.872 | – | – |
| Notes. The coefficients are for the red solid lines in Fig. 3 in the function form of equation (2). | ||||||||||
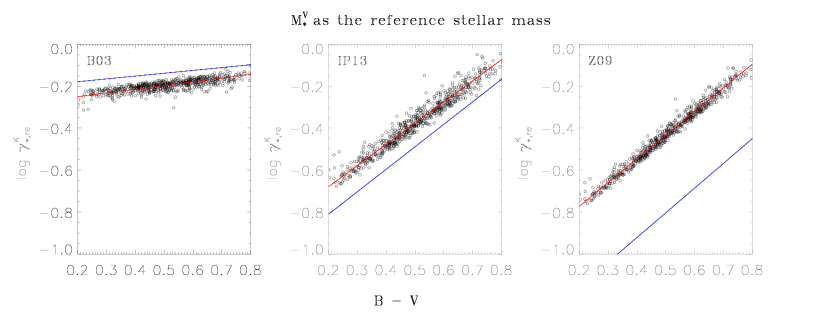
5.2 Re-calibrated CMLRs
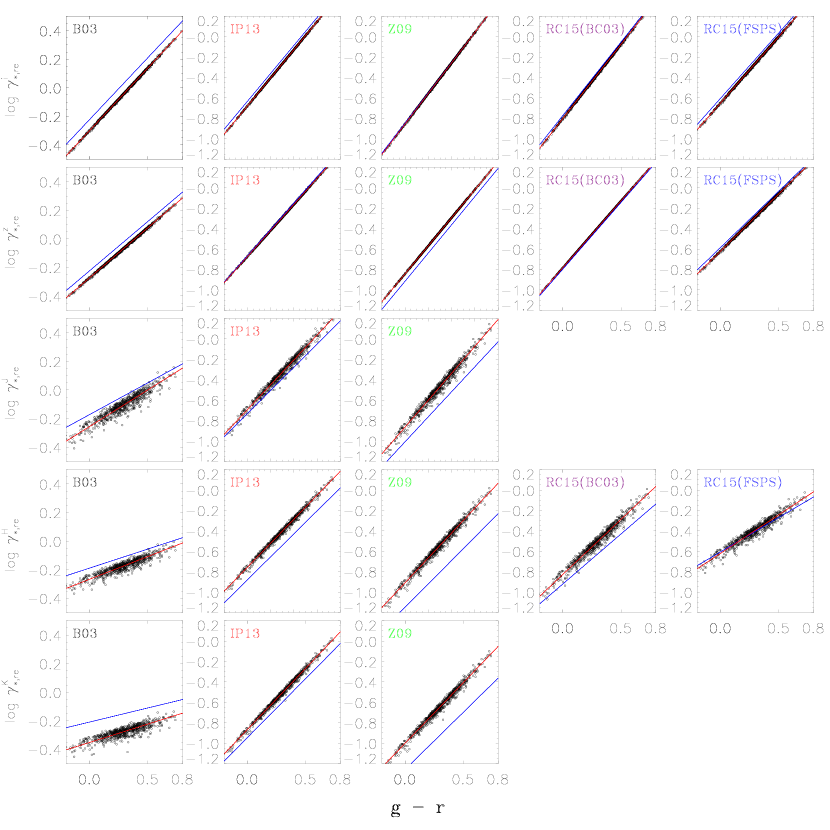
According to the coefficients in Table 3, we renormalize M (=, , J, H, and K) to the reference mass M. Then, the renormalized M (M) were divided by the luminosity in band to generate the renormalized (). Next, the were plotted against - in Figure 5. For each panel, galaxies of the LSBG sample are shown as black open circles, which show clear correlations between and - color. We then fit the relations between the and - in the function form of equation (1), using the bi-weight line fit method. The fit line is over-plotted as red solid line in each panel in Figure 5, and the blue solid line represents the original CMLRs (Table 1) for comparison. The re-calibrated CMLRs are tabulated in Table 4, which could produce internally self-consistent M∗ estimates from different bands for the galaxy, and this self-consistent M∗ should be highly consistent with the assumed reference mass which is M in this work.
Compared with M, the original B03 slightly overestimated M∗ from NIR bands (M) while the four other original CMLRs underestimated M (Table 2). After re-calibration, the overestimate or underestimate are corrected correspondingly. As shown in each panel in Figure 5, the re-calibrated B03 is below the original relation (blue solid line), and the four other re-calibrated relations of Z09, IP13, RC15(BC03), and RC15(FSPS) are all above the original relation, especially in NIR bands. Furthermore, the original B03 require the smallest corrections, while the original Z09 relations require the largest corrections in each band, in particular in NIR bands. This is because Z09 is based on the prescription for the TP-AGB phase, which incorporates a larger number of TP-AGB stars. It can greatly enhance the luminosities in the NIR but alter little the luminosities in the optical, inevitably resulting in a lower from the NIR bands than from the optical bands.
| model | ar | br | ai | bi | az | bz | aJ | bJ | aH | bH | aK | bK |
|---|---|---|---|---|---|---|---|---|---|---|---|---|
| B03 | -0.306 | 1.097 | -0.299 | 0.874 | -0.272 | 0.699 | -0.245 | 0.499 | -0.253 | 0.283 | -0.333 | 0.226 |
| IP13 | -0.663 | 1.530 | -0.679 | 1.380 | -0.674 | 1.280 | -0.684 | 1.199 | -0.742 | 1.138 | -0.860 | 1.175 |
| Z09 | -0.840 | 1.654 | -0.854 | 1.495 | -0.842 | 1.374 | -0.852 | 1.291 | -0.896 | 1.178 | -0.990 | 1.150 |
| RC15(BC03) | -0.792 | 1.629 | -0.801 | 1.456 | -0.781 | 1.308 | – | – | -0.803 | 1.017 | – | – |
| RC15(FSPS) | -0.647 | 1.497 | -0.648 | 1.298 | -0.619 | 1.120 | – | – | -0.604 | 0.714 | – | – |
| Notes. The coefficients are for the red solid lines in Fig. 5 in the function form of equation (1). | ||||||||||||
6 Discussion
6.1 Secondary Color Dependence
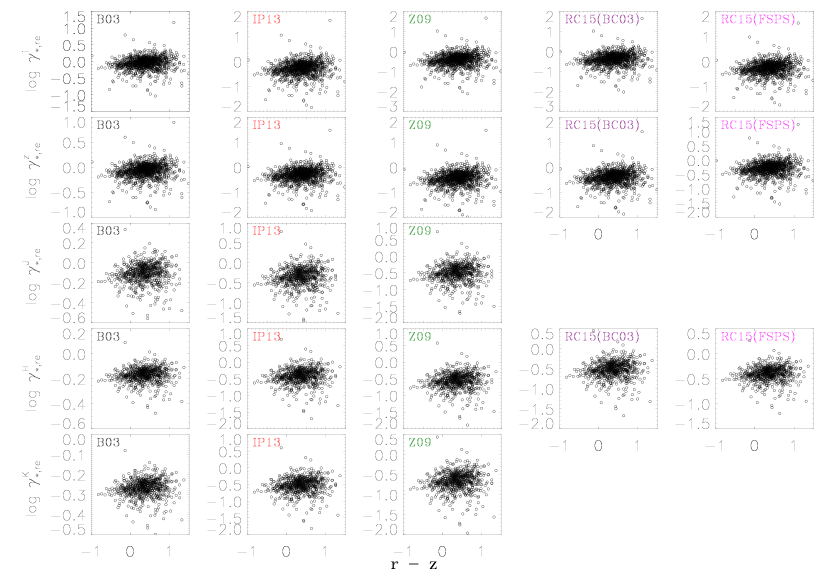
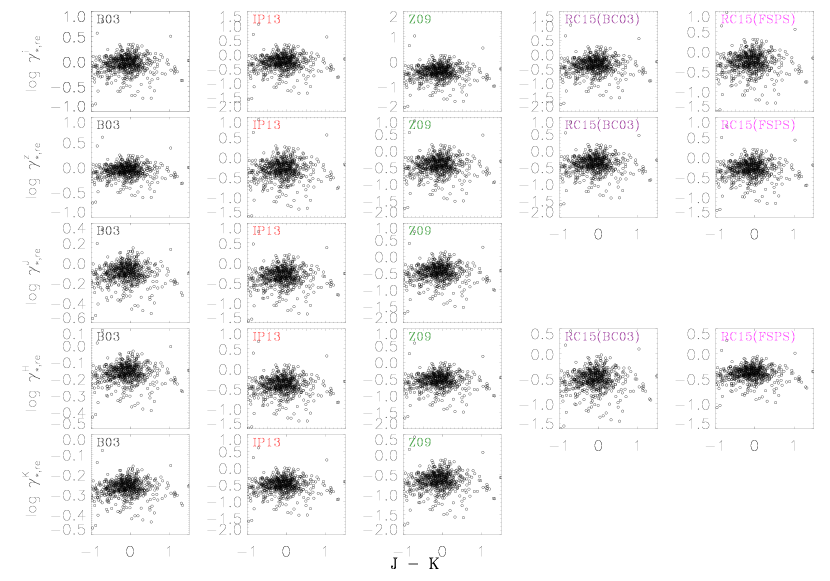
- acts as a primary color indicator of (Figure 5 ). In this section, we shall examine whether the re-calibrated CMLRs based on - could be improved furthermore by including - or - as a secondary color term. Firstly, we plot against - (Figure 6) or J - K (Figure 7) for each CMLR. Although it appears little dependence of on either - or J - K, the two colors could not be completely avoided without a further examination in quantity. For convenience, we denote the from band predicted by the re-calibrated CMLRs (Table 4) as , and those predicted by the renormalized M (Table 3) as (= , , J, H, K). The residuals of from are denoted as (=-), which are in fact the difference between the data (black open circles) and the re-calibrated line (red solid line) in each panel in Figure 5.
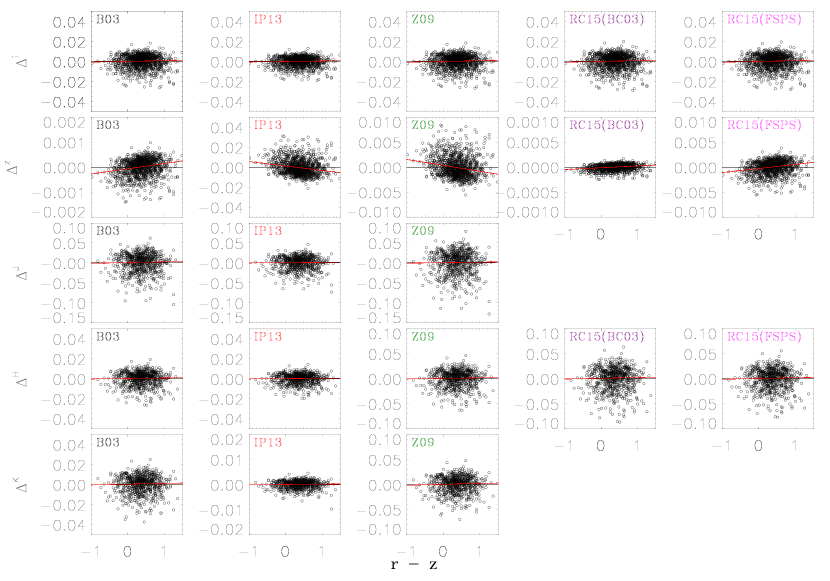
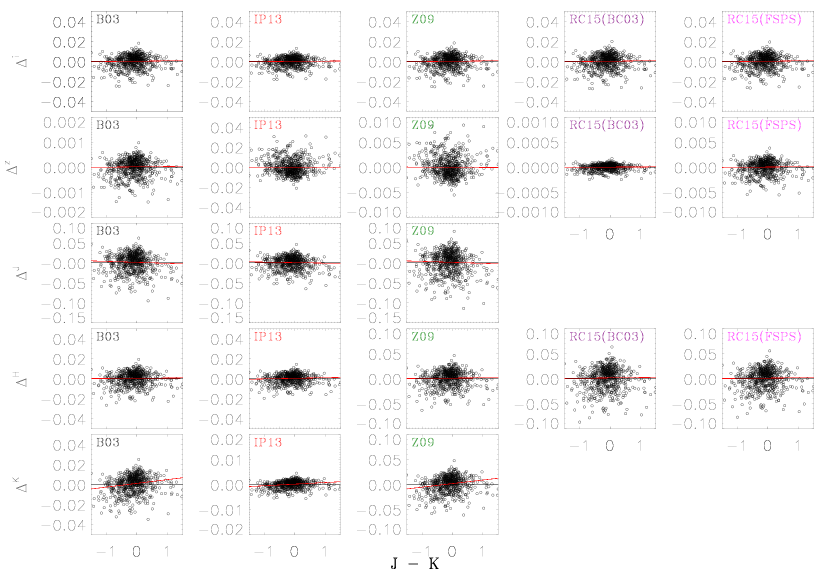
If is dependent on the colors of - or -, the re-calibrated CMLR based on only - color could be improved by equation (3),
| (3) |
In order to check whether depends on - or J - K , we additionally plot against - (Figure 8) or - (Figure 9), and fit a linear relation between and the color in each panel (red solid line). It shows that the fit line is almost flat and completely overlaps the zero-residual line (black line), implying that depends little on either color of - or - . Therefore, there is no need for a secondary color term based on - or J - K ( in equation (3)) to improve the re-calibrated CMLRs in this work. This demonstrates that the variation of can be well traced by the optical color but is minimized in NIR color, which has already been proved in McGaugh & Schombert (2014), where they changed the age of a solar metallicity stellar population Schombert & Rakos (2009) from 1 to 12 Gyr, and the induced changes in - are 0.37 mag but only 0.03 mag in - .
| model | ||||||||||||
| Original CMLR models | ||||||||||||
| B03 | 1.09 | 0.96 | 0.91 | 0.78 | 0.71 | 1.98 | 1.55 | 1.24 | 0.93 | 0.81 | 0.74 | 0.73 |
| IP13 | 0.60 | 0.53 | 0.41 | 0.29 | 0.25 | 1.55 | 1.29 | 0.89 | 0.63 | 0.56 | 0.33 | 0.41 |
| Z09 | 0.40 | 0.32 | 0.23 | 0.16 | 0.12 | 1.11 | 0.82 | 0.53 | 0.35 | 0.26 | 0.16 | 0.21 |
| RC15B | 0.46 | 0.39 | – | 0.24 | – | 1.24 | 0.97 | – | 0.47 | – | – | – |
| RC15F | 0.61 | 0.56 | – | 0.40 | – | 1.47 | 1.20 | – | 0.63 | – | – | – |
| Re-calibrated CMLR models | ||||||||||||
| B03 | 0.92 | 0.87 | 0.79 | 0.67 | 0.53 | 1.68 | 1.40 | 1.13 | 0.84 | 0.63 | 0.56 | 0.60 |
| IP13 | 0.54 | 0.51 | 0.47 | 0.40 | 0.31 | 1.41 | 1.24 | 1.09 | 0.89 | 0.71 | 0.41 | 0.54 |
| Z09 | 0.39 | 0.37 | 0.34 | 0.29 | 0.23 | 1.11 | 0.96 | 0.85 | 0.67 | 0.51 | 0.30 | 0.50 |
| RC15(BC03) | 0.43 | 0.41 | – | 0.31 | – | 1.18 | 1.01 | – | 0.66 | – | – | – |
| RC15(FSPS) | 0.55 | 0.52 | – | 0.40 | – | 1.35 | 1.13 | – | 0.68 | – | – | – |
| Notes. The stellar mass-to-light ratios predicted from different bands (, , J, H, K) by each CMLR before (Table 1) and after re-calibration (Table 4) are given at - =0.3 (the mean and the median colors of the LSBG sample) and - = 0.6. Additionally, predicted by MS14 from K band at B-V=0.6 () are listed, and for comparison, predicted by our re-calibrated relations (Table 4) in Section 5 from K band at -=0.4 () are also given for comparison, since -=0.4 is equivalent to B - V=0.6 according to the filter transformation prescription of Smith et al. (2002). | ||||||||||||
6.2 Error budget
The typical uncertainties are 0.1 (0.2) dex in the optical (NIR) for B03, 0.1 dex for IP13, and 0.10.15 dex for Z09. For RC15, it could be deduced (from their Figures 2 and 3 in RC15 paper) that the scatter in from BC03 model is 0.1 dex, but the scatter from FSPS model is not clearly available. These typical uncertainties that are inherent in the original CMLRs should be directly transplanted into the re-calibrated CMLRs in this work, because the re-calibrating in this work does not change the models on which the CMLRs are based. For the LSBG sample, the uncertainty in predicted by a CMLR should be a combination of the inherent uncertainty in the CMLR and the photometric error. The uncertainty in - color of the LSBG sample in this work are 0.08 mag for 95 of the galaxies, which would be ultimately propagated to be uncertainties of 0.08 ( 0.03), 0.11 (0.10), 0.11 (0.10), 0.11 (0.08), and 0.10 (0.05) dex in log predicted in optical (NIR) bands by the re-calibrated relations, and almost the same values of uncertainties in log predicted by original relations of B03, IP13, Z09, RC15(BC03), and RC15(FSPS), respectively, Therefore, for this LSBG sample, the total uncertainties in predicted by each CMLR before or after re-calibration are almost the same.
6.3 and M∗ from re-calibrated CMLRs
In Table 4, from band were estimated by each independent re-calibrated CMLR at - =0.3 (, = , J, H, K), which is the mean of color distribution of the sample in this work, and at - =0.6 () were also tabulated in order to give an intuition for estimates at some redder color by these re-calibrated CMLRs. In addition, the originally predicted were also listed for a comparison.
Apparently, B03 always gives the highest , and Z09 gives the lowest values no matter before or after re-calibration, which is primarily due to the differences in the IMF. In quantity, the span in originally predicted are 0.44, 0.48, 0.60 0.69, and 0.77 dex at the blue color (-=0.3), and are 0.25, 0.28 0.37, 0.42, and 0.49 dex at the redder color (-=0.6) for = , , J, H, and K bands, respectively. In contrast, the span in predicted by the re-calibrated relations has been greatly narrowed to 0.37, 0.37, 0.37, 0.36, and 0.36 dex at the blue color, and to 0.18, 0.16, 0.12, 0.09, and 0.09 dex at the red color in the corresponding bands. So it is clear that the range in by re-calibrated CMLRs is much narrower than originally predicted, especially in the NIR bands. This demonstrates that the NIR luminosities are more robust than the optical luminosities to predict the of galaxies. It is worth noting that the uncertainties (Section 6.2) in predicted by the original or re-calibrated relation for each CMLR are almost the same, so these errors do not alter the comparison above.
We can examine each re-calibrated CMLR for the internal consistency in M∗ from band to band. We listed the mean and median M∗ predicted by each re-calibrated CMLR in the right part in Table 2. It is apparent that M (=, , , J, H, and K) are highly consistent with M which is the reference stellar mass. For instance, the difference of M from M is reduced to 0.03 dex (from the original 0.1 dex) by B03, 0.04 dex (from the original 0.3 dex) by Z09, 0.06 dex (from the original 0.27 dex) by IP13, and 0.03 dex (from the original 0.1 - 0.2 dex) by RC15 CMLRs after re-calibration. This demonstrates that each CMLR could produce internally self-consistent M∗ after re-calibration when it is applied in different photometric bands.
6.4 Comparison with MS14
In the pioneering work of MS14, several CMLRs were re-calibrated in filters of V, I, K, or [3.6] based on a sample of disk galaxies (B-V as the color indicator). In this work, three CMLRs that are common with MS14 were re-calibrated, but in SDSS and NIR filters of , , , J, H, or K based on a sample of LSBGs (- as the color indicator). So we shall compare our re-calibrated relations with those of MS14 for the three common CMLRs (B03, IP13, and Z09) in the common K band in this section.
In MS14, the from K band at B-V=0.6 () predicted by their re-calibrated relations are 0.60, 0.54 and 0.50 by B03, IP13, and Z09, respectively. In contrast, the originally predicted are correspondingly 0.73, 0.41, and 0.21 (the last column in Table 5). It is apparent that the range in has been enormously narrowed to 0.08 dex from the original 0.54 dex by their re-calibrations. In order to compare with MS14, we additionally tabulate at - = 0.4 () predicted by our re-calibrated relations, which are 0.57, 0.41, and 0.30 by B03, IP13, and Z09 (Table 5), since - = 0.4 is equivalent to B-V=0.6 according to the filter transformation prescriptions of Smith et al. (2002). By comparison, the originally predicted are 0.74, 0.33, and 0.16 , so the range in has been reduced to 0.28 dex from the original 0.67 dex by our re-calibrations. However, compared with predicted by MS14 re-calibrated relations, predicted by our re-calibrated relations in this work are 0.03, 0.09, 0.26 dex lower, respectively, by B03, IP13, and Z09.
In order to find out the sources of the differences, we examined the only three different ingredients between this work and MS14, which are the independent procedures, the different assumptions of reference M∗, and the distinct data sets.
For the procedures, although the procedure in this work was coded to implement the same methodology as adopted by MS14, it is independent of and not identical with the MS14 procedure. so we investigate the possible offset in re-calibrated relations due to the minor differences between our and MS14 procedures, by repeating the exact work of MS14 on their data using our procedures. It was found that, compared with MS14 procedures, our procedures would drag down by 0.05, 0.01, and 0.04 dex, respectively, by B03, IP13, and Z09. These minor offsets in caused by minor differences between our and MS14 procedures are denoted as for convenience (Table 7).
For the assumption of reference M∗, we assumed M∗ estimates from SDSS band (M) as the reference M∗ to which M∗ estimates from other filter bands were renormalized in this work, while MS14 assumed M∗ from Johnson band (M) as their reference M∗. The different assumptions are the choices in the different filter systems (SDSS versus Johnson-Cousin), but it is necessary to investigate the possible offset in re-calibrated relations due to the different choices of reference M∗ between this work and MS14 (M-based versus M-based). We present the investigation in Appendix A, which concludes that predicted by the M-based re-calibrated relations are 0.03, 0.11, and 0.23 dex lower than those predicted by M-based re-calibrated relations. These major offsets in caused by the different assumptions of the reference M∗ are denoted as for convenience (Table 7).
In this case, for the three common CMLRs of B03, IP13, and Z09, the seeming differences (0.03, 0.09, 0.26 dex) between (this work) and (MS14) could be completely explained by the combination of (0.03, 0.11, and 0.23 dex) and (0.05, 0.01, and 0.04 dex; Table 7) . This implies that the seeming differences between our re-calibrated relations in this work and those in MS14 in the common K band are totally caused by the systematic offsets due to the major differences in the assumptions of reference mass and the minor differences in procedures between this work and MS14. Therefore, taking into account of the different assumptions of reference mass and the independent procedures, our re-calibrated CMLRs based on a sample of LSBGs in this work yield very consistent in the common K band with the re-calibrated CMLRs based on a sample of disk galaxies by MS14 . So there is no room left for any apparent difference in the re-calibrated relations introduced by the possible difference of our LSBG sample from the disk galaxy sample in MS14.
It is beyond the scope of this work and also difficult to evaluate which assumption of reference mass is better, because the different assumptions are only the choices in different filter systems (SDSS versus Johnson-Cousins). Additionally, this work is motivated to re-calibrate each individual CMLR to give internally self-consistent M∗ for a same galaxy, when it is applied in different bands of SDSS and NIR filters, and the internally self-consistent M∗ from any band predicted by each re-calibrated CMLR should be highly consistent with the reference M∗. So, we examined the offset between different reference M∗ in Appendix, which gives that M are systematically 0.11, 0.25, and 0.33 dex lower than M by B03, IP13, and Z09 (Table 6) for the same sample in this work.
7 Summary and Conclusions
Based on a sample of LSBGs, we examined five representative CMLRs of B03, IP13, Z09, RC15(BC03), and RC15(FSPS). For each individual CMLR, it gives different stellar mass (M∗) estimates for the same sample, when it is applied in different photometric bands of SDSS optical , , , , NIR J, H, and K. M closely agree with M, but M (=, , J, H, K) all deviate from M, with the deviation relatively larger in NIR bands. Assuming M as a reference M∗, we re-normalized M∗ estimates from each of the other bands of (M) to the reference mass, and subsequently obtain the re-calibrated CMLR by fitting the relations between - and calculated from the re-normalized M for each original CMLR (=, , J, H, K). The - is the primary color indicator in the re-calibrated relations, which have little dependence on - or J - K. Each re-calibrated CMLR could produce internally self-consistent M∗ estimates for the same galaxy, when it is applied in different bands of (=, , , J, H, K), and the self-consistent M∗ should be “the same as” or highly consistent with the reference mass of M. Besides, the differences in original predicted by the five different CMLRs have been largely reduced, particularly in NIR bands.
Compared with the pioneering work of MS14, the predicted by the re-calibrated CMLRs in this work are, respectively, 0.03, 0.09, 0.26 dex lower than predicted by MS14 re-calibrations by B03, IP13, and Z09. These offsets could be fully explained by the combination of the major systematic offsets caused by the different choices of reference mass (0.03, 0.11, and 0.23 dex) and the minor systematic offsets caused by independent procedures (0.05, 0.01, and 0.04 dex) between this work and MS14. This implies that, considering the major effect of different choices of reference M∗ and the minor effect of independent procedures, the re-calibrated CMLRs in this work based on a sample of LSBGs give very consistent with the re-calibrated CMLRs by MS14 at the equivalent color. So there is no room left for any difference in the re-calibrations caused by the possible bias of the LSB galaxy sample from the disk galaxy sample in MS14.
It is difficult to judge which choice of reference mass is better because the choices have to be made in different photometric filter systems. However, it is necessary to give the offsets between the final self-consistent M∗ predicted by the re-calibrated relations with different assumptions of the reference mass (M versus M). The M-based re-calibrated relations in this work (Table 5) produce the final self-consistent M∗ which are systematically 0.11, 0.25, and 0.33 dex lower than those produced by the M-based re-calibrated CMLRs in MS14, by B03, IP13, and Z09.
Appendix A Effect of reference stellar mass
The sample in this work has photometric data in SDSS optical (, , , , ) and near-infrared J, H, K bands. In order to examine the possible effect of different assumptions of reference M∗ (M versus M) on re-calibrated relations, we firstly transformed magnitudes in SDSS and filters to Johnson B and V filters by using the transformation prescriptions of Smith et al. (2002) for the sample. This sample now has photometric data in both SDSS filter and Johnson-Cousin B and V bands, and near-infrared J, H, and K bands.
For the sample, M∗ from the V band (M) or band (M) were predicted by the original CMLRs of B03, IP13 and Z09, respectively (based on B-V color). Comparing the distribution of M with that of M, M is systematically 0.11, 0.25, and 0.33 dex lower than M by B03, IP13, and Z09 for this same sample ( in Table 6). This proves that the assumption of M as reference M∗ would bias the baseline of M∗ and the re-normalized in each band toward lower values, compared with the assumption of M as reference M∗.
In analogy to Section 5, we furthermore re-calibrated each of the three CMLRs (B03, IP13, Z09) in K band (on B-V color) based on the sample of LSBGs, assuming M or M as reference M∗, respectively. More specifically, for each of the three CMLRs (B03, IP13, Z09), we first re-normalized M∗ estimates from K band (M) to the reference mass of M, then divided the re-normalized M by the K-band luminosity to obtain the re-normalized (), and ultimately fit the relations between and B-V color to obtain the re-calibrated relations in K band, which is denoted as M-based re-calibrated relations for convenience. Similarly, we obtained M-based re-calibrated relations in band by assuming the reference mass of M. These two sets of re-calibrated CMLRs in K band are shown in Figures 10 - 11, where it clearly shows that, compared with the M-based re-calibrations (red solid line in Figures 11), the M-based re-calibrated relations (red solid line in Figures 10) obviously dragged down in each panel for each CMLR, in particular for IP13 and Z09, since the two figures share the same y-axis range and scale for convenient comparison.
In Table 7, we listed in K band at B-V =0.6 predicted by M-based ((M) ) and M-based ((M)) re-calibrated CMLRs, and predicted by MS14 ((MS14)) for a comparison. It is apparent that (M) are very consistent with (MS14) which also assumed M as reference M∗, and the small differences between the two are caused by the minor difference in the procedures between this work and MS14 ( in Table 7 and already discussed in Section 6.4). This implies that assuming M∗ from the same V band as the reference M∗, the re-calibrated CMLRs in K band (on B-V color) based on the sample of LSBGs give very consistent with those given by MS14 based on a sample of disk galaxies, which further indicates that there appears no apparent bias in that was introduced by differences in samples between this work and MS14.
Compared with (M), (M) are 0.03, 0.11, and 0.25 dex lower by B03, IP13, and Z09. These offsets should be only caused by the difference in the assumption of reference M∗ (M or M), so they were denoted as in Table 7, since these two sets of re-calibrated relations only differ in the assumption of reference M∗. This implies that different assumptions of reference M∗ (M or M) would cause evident offsets in values predicted by re-calibrated CMLRs. Quantitatively, M-based re-calibrated CMLRs give that are 0.03, 0.11, and 0.25 dex systematically lower than those given by M-based re-calibrated CMLRs (Table 7).
For the difference between and discussed in Section 6.4, are 0.57, 0.42, 0.30, and are 0.60, 0.50, 0.54 by B03, IP13 and Z09 after re-calibration, and the difference between the two are 0.02, 0.08, 0.26 dex, by B03, IP13, and Z09 (Table 5). Numerically, the difference could be fully explained by the major offsets caused by the different assumptions of reference M∗ ( 0.03, 0.11, and 0.23 dex) and the minor offsets due to differences in procedures between this work and MS14 ( 0.05 dex) (Table 7). This explanation should be plausible because was predicted by MS14, which assumed M as the reference mass, while was predicted by our re-calibrated relations (Table 1), which assumed M as the reference mass. So considering the different assumptions of the reference M∗ and the minor difference in procedures between this work and MS14, the re-calibrated CMLRs (B03, IP13, Z09) in SDSS filters in this work (Table 1) are fundamentally consistent in at the equivalent colors with those in Johnson-Cousin filters by MS14.
In a brief, the analysis in this Appendix demonstrate that,compared with an assumption of M as the reference mass (MS14), the assumption of M as the reference mass (Section 5.2 ) would lower the self-consistent (also reference) M∗ down by 0.11, 0.25, and 0.33 dex, and lower down by 0.03, 0.11, and 0.25 dex by B03, IP13, and Z09.
| model | mean(M) | (M) | mean(M) | (M) | |
| B03 | 8.65 | 0.81 | 8.76 | 0.75 | 0.11 |
| IP13 | 8.41 | 0.85 | 8.66 | 0.77 | 0.25 |
| Z09 | 8.27 | 0.87 | 8.60 | 0.79 | 0.33 |
| Notes. The values are all in logarithm. M is estimated from the -band luminosities with the - as the indicator color of . M is estimated from the V-band luminosities with the B-V as the indicator color of . is the difference of the mean value of M distribution from that of M distribution. | |||||
| model | (M) | (M) | (MS14) | ||
| B03 | 0.62 | 0.66 | 0.60 | 0.03 | 0.05 |
| IP13 | 0.41 | 0.53 | 0.50 | 0.11 | 0.01 |
| Z09 | 0.28 | 0.48 | 0.54 | 0.25 | 0.04 |
| Notes. is the difference between (M) and (M). is the systematic bias in caused by the minor difference in procedures between this work and MS14. | |||||
References
- Abazajian et al. (2009) Abazajian, K. N., Adelman-McCarthy, J. K., Agüeros, M. A., et al. 2009, ApJS, 182, 543
- Bertin & Arnouts (1996) Bertin, E., & Arnouts, S., 1996, A&AS, 117, 393
- Bell de Jong (2001) Bell, E. F. & de Jong, R. S. 2001, ApJ, 550, 212
- Bell et al. (2003) Bell, E. F., McIntosh, D. H., Katz, N., & Weinberg, M. D. 2003, ApJS, 149, 289 (B03)
- Conroy (2013) Conroy, C., 2013, ARAA, 51, 393
- Chabrier (2003) Chabrier, G. 2003, PASP, 115, 763
- Courteau (2014) Courteau, S., Cappellari, M., de Jong, R., et al. 2014, arXiv:1309.3276v2
- da Cunha, Charlot & Elbaz (2008) da Cunha, E., Charlot, S. & Elbaz, D. 2008, MNRAS, 388, 1595
- Du et al. (2015) Du, W., Wu, H., Lam, Man I, et al., 2015, AJ, 149, 199
- Du et al. (2019) Du, W., Cheng, C., Wu, H., Zhu, M., & Wang Y. G., 2019, MNRAS, 483, 1754
- Du et al. (2020) Du, W., Cheng, C., Zheng, Z., Wu, H., 2020, AJ, 159, 138.
- Fukugita et al. (1996) Fukugita, M., Ichikawa, T., Gunn, J. E., et al. 1996, AJ, 111, 1748.
- Gallazzi & Bell (2009) Gallazzi, A., & Bell, E. F., 2009, ApJS, 185, 253
- Girardi & Bertelli (1998) Girardi, L., & Bertelli, G., 1998, MNRAS, 300, 533
- Girardi et al (2000) Girardi, L., Bressan, A., Bertelli, G., & Chiosi C., 2000, AAS, 141, 371
- Girardi et al. (2002) Girardi, L., Bertelli, G., Bressan, A., Chiosi, C., Groenewegen, M. A. T., et al. 2002, AA, 391, 195
- Haynes et al. (2011) Haynes, M. P., Giovanelli, R., Martin, A. M. et al., 2011, AJ, 142, 170
- Haynes et al. (2018) Haynes, M. P., Giovanelli, R., Kent, B. R. et al., 2018, ApJ, 861, 49
- Herrmann et al. (2016) Herrmann, K. A., Hunter, D. A., Zhang, H. X., & Elmegreen, B. G., 2016, AJ, 152, 177
- Into & Portinari (2013) Into, T., & Portinari, L. 2013, MNRAS, 430, 2715 (IP13)
- Kauffmann et al. (2003) Kauffmann, G. et al. 2003, MNRAS, 341, 33
- Kroupa (1998) Kroupa, P. 1998, in ASP Conf. Ser. 134, Brown Dwarfs and Extrasolar Planets, ed. R. Rebolo, E. L. Martin, & M. R. Zapatero Osorio (San Francisco, CA: ASP), 483
- Lawrence et al. (2007) Lawrence, A., Warren, S. J., Almaini, O., Edge, A. C., Hambly, N. C. et al., 2007, MNRAS, 379, 1599
- Marigo & Girardi (2007) Marigo, P., & Girardi, L. 2007, AA, 469, 239
- Marigo et al. (2008) Marigo, P., Girardi, L., Bressan, A., Groenewegen, M. A. T., Silva, L., Granato, G. L. 2008, AA, 482, 883
- McDonald, Courteau & Tully (2009) McDonald, M., Courteau, S., & Tully, R. B. 2009, MNRAS, 394, 2022
- McGaugh & Schombert (2014) McGaugh, S. S. & Schombert, M. J. 2014, AJ, 148, 77 (MS14)
- Portinari et al. (2004) Portinari, L., Sommer-Larsen, J., & Tantalo, R. 2004, MNRAS, 347, 691
- Pforr, Maraston & Tonini (2012) Pforr, J, Maraston, C, & Tonini C., 2012, MNRAS, 422, 3285
- Roediger & Courteau (2015) Roediger, J. C., & Courteau, S. 2015, MNRAS, 452, 3209 (RC15)
- Schombert & Rakos (2009) Schombert, J. M. Rakos, K., 2009, AJ137, 528
- Schlafly & Finkbeiner (2011) Schlafly, E. F. Finkbeiner, D. P., 2011, ApJ737, 103
- Smith et al. (2002) Smith, J., Tucker, D., Kent, S., Richmond, M., Fukugita, M., et al. 2002, AJ, 123, 2121
- Taylor et al. (2011) Taylor, E. N., Hopkins, A. M., Baldry, I. K., et al. 2011, MNRAS, 418, 1587
- Zibetti et al. (2009) Zibetti, S., Charlot, S., & Rix, H.-W. 2009, MNRAS, 400, 1181 (Z09)