Spatial regularity of the young stellar population in the ring
of NGC 6217
The relative contribution of various physical processes to the spatial and temporal distribution of molecular clouds and star-forming regions in the disks of galaxies has not yet been the subject of extensive study. Investigating the spatial regularity in the distribution of the young stellar population in spiral and ring structures is a good test for studying this contribution. In this paper, we look at the photometric properties of the ring and spiral arms in the barred spiral galaxy NGC 6217 based on an analysis using GALEX ultraviolet, optical and H surface photometry data. The ring in the galaxy is located near the corotation area. We found evidence of spatial regularity in the distribution of the young stellar population along the galaxy ring. The characteristic scale of spacing is about 700 pc. At the same time, we did not find a similar regularity in the distribution of the young stellar population along the spiral arms of NGC 6217. The spatial regularity in the concentration of young stellar groupings along spiral arms is a quite rare phenomenon and it has never previously been seen in galactic rings.
Key Words.:
Galaxies: individual: NGC 6217 – Galaxies: star formation – Galaxies: ISM1 Introduction
Various physical processes, such as gravitational collapse and turbulence compression, are believed to play a main role in the creation of molecular clouds and their further evolution into star formation regions. The sizes of these structures and their spatial distribution in galactic disks can be explained in terms of gravitational or magnetogravitational instability (see, e.g., Elmegreen & Elmegreen, 1983; Elmegreen, 1994b). However, the influence of the magnetic field and shock waves on the spatial distribution of gas clouds and young stellar groups is still not fully understood. Galactic spiral arms and rings are good laboratories for studying the relative effect of different physical processes on the spatial distribution of star-forming regions.
The regular spatial distribution of young star complexes is a rather unique phenomenon which was visually detected by Elmegreen & Elmegreen (1983) in spiral arms of only 22 grand design galaxies. We note that among these galaxies, present in only seven stellar systems, the regular chains of star complexes are observed in both spiral arms. The data of Elmegreen & Elmegreen (1983) remains the only published result of a systematic search for regular chains of stellar complexes in spiral arms.
In later years, Efremov (2009, 2010, 2011) found the regularities in the distribution of H ii superclouds in spiral arms of our Galaxy and in the distribution of star complexes in M31. Gusev & Efremov (2013) confirmed the result of Elmegreen & Elmegreen (1983), finding that only one of the spiral arms in NGC 628 has a regular chain of star complexes with a separation of kpc. However, they also found the existence of the same characteristic separation ( pc) between adjacent fainter star-formation regions in both spiral arms of the galaxy. Finally, Elmegreen et al. (2018) found regularly spaced infrared peaks in the dusty spiral arms of M100 with a typical spacing between the clumps of pc.
| Parameter | Value |
|---|---|
| Type | (R’L)SB(rs)b |
| Total apparent magnitude () | 11.89 mag |
| Absolute magnitude ()a | mag |
| Inclination () | |
| Position angle (PA) | |
| Apparent corrected radius ()b | 2.30 arcmin |
| Apparent corrected radius ()b | 13.8 kpc |
| Distance () | 20.6 Mpc |
| Galactic absorption () | 0.158 mag |
Along with spiral arms, galactic rings are the product of evolutionary processes taking place in galactic disks. These appear to be related to specific orbital resonances with the pattern speed of a bar (Buta, 2017). Unlike arms, the physical and dynamic parameters of medium (gas density, temperature, pressure, rotation velocity) along rings are likely to be constant. On the other hand, strong shock waves are not expected to be present in rings. These features make them interesting objects for the study of the spatial distribution of star-forming regions.
Based on general ideas about physics and evolution of rings, investigating spatial regularity in the distribution of star clusters, as well as in arms, is not an impossible undertaking. Elmegreen (1994a) theoretically described the possibility of the existence of regularly spaced starburst spots in galactic rings. However, this had not been seen in observations before. Only Artamonov et al. (1999) noted quasi-periodic characteristic distances of kpc between adjacent star complexes in the ringed barred galaxy NGC 6217. The purpose of our study is to verify the possible regularity in the distribution of star formation regions along the ring of NGC 6217.
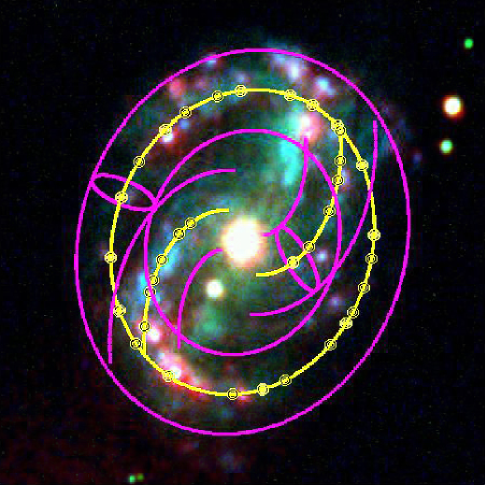
NGC 6217 is a galaxy with a prominent bar, two strong spiral arms, and two rings. One peculiarity of the galaxy is that its spiral arms begin from the nuclear region and, upon crossing the ends of the bar, they form a (pseudo-)ring with a major projected radius of 40.2 arcsec (Comerón et al., 2014) (Fig. 1). The faint outer ring has radius that is times larger then the inner one (81.6 arcsec according to Comerón et al., 2014). However, it is not considered in this paper and so, it is not shown in Fig. 1.
The photometry and kinematics of the galaxy have been studied in a wide range of wavelengths from UV to radio (see van Driel & Buta, 1991; Elmegreen et al., 1996; Artamonov et al., 1999; James et al., 2004; Hernandez et al., 2005; Garrido et al., 2005; Font et al., 2019, and references therein). We note that the NGC 6217 inner ring that is the subject of current studies is located near the corotation region (van Driel & Buta, 1991; Elmegreen et al., 1996; Font et al., 2014).
The fundamental parameters of NGC 6217 are presented in Table 1, where the morphological type is taken from Buta et al. (2015), Galactic absorption, , taken from the NED222http://ned.ipac.caltech.edu/ database, and the remaining parameters are taken from the LEDA333http://leda.univ-lyon1.fr/ data base. The adopted value of the Hubble constant is equal to km s-1Mpc-1. With the assumed distance to NGC 6217, we estimate a linear scale of 100 pc arcsec-1. We note that the kinematic positional angle of the galaxy () is significantly different from the photometric one (Font et al., 2019). However, given the low inclination of NGC 6217, this does not substantially affect our results.
2 Observational data
The results of the photometry for the galaxy were published in Gusev et al. (2015). We also use the H image, obtained in the GHASP survey (Epinat et al., 2008) and downloaded from the NED data base, in our study. The absolute calibration of this image was carried out using the parameters of descriptors from the original FITS file (image) and their explanations in Epinat et al. (2008). We already used H data for NGC 6217 in Gusev et al. (2018).
Ultraviolet GALEX NUV-reduced FITS-images of NGC 6217 were downloaded from the B. A. Miculski Archive for space telescopes.444http://galex.stsci.edu/GR6/; files AIS_21_sg76-nd-*.fits The observations were carried out on November 11, 2011, with a total exposure of 96 s. The description of the GALEX mission, parameters of NUV passband, files description, and data reduction are presented in Morrissey et al. (2005).
Images of the galaxy in all bands were transformed to the face-on position using the values of and the position angle (PA) from Table 1. Those face-on images were used for the further analysis. Photometric magnitudes are corrected for Galactic extinction and for projection effects: . Our image resolution is equal to 1.7 arcsec for , 1.4 arcsec for and , 3.3 arcsec for H, and 5.3 arcsec for NUV.
3 Results
3.1 Along-ring and -arm photometry
For the next steps in our analysis, we used a technique developed by us in Gusev & Efremov (2013). In the first step, we define the geometric parameters of the spiral arms and the ring by fitting the curves of both main arms and the ring, which are clearly outlined in the optical bands (see Fig. 1). The arms and the ring are defined by a visual selection of pixels in the part of these images that belongs to the center lines of the spiral arms or the ring. Pixels in this region are then fitted with a logarithmic spiral for the arms or a circle for the ring using linear least-squares. Here we assume that the pitch angle is constant along the arm and equal for both spirals.
Using the classic equation for the logarithmic spiral , where , we obtained the following parameters for the spiral arms, arcsec (960 pc) and , which corresponds to a pitch angle . The zero point angle for the eastern arm and for the western arm (where is counted from north towards east, the same as the PA; see Fig. 1). As a result of the fitting, we also obtained a radius of the ring arcsec ( kpc). The ring parameters used by us ( and PA) are close to those obtained by Comerón et al. (2014). The resulting spiral arms and the ring are shown in Fig. 1 in projection to the apparent plane of the galaxy.
We note the extremely high pitch angle, which is times larger than the average value for galaxies of the same morphological type (Díaz-García et al., 2019). Apparently, this is a consequence of the high central-mass concentration in NGC 6217. It is known that the galaxy has a very bright nucleus in a wide range of wavelengths (see Williams et al., 2019, and references therein), a high H i central surface density (van Driel & Buta, 1991), and it exhibits signs of nuclear activity (Véron-Cetty & Véron, 2010).
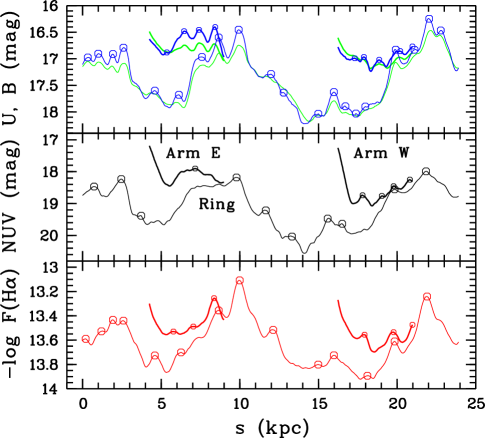
To study variations in brightness along the ring and spiral arms, we obtained photometric profiles along these structures. We used the elliptical aperture ( arcsec2), with a minor axis along the spiral arm and ring (see Fig. 1) with a step of by PA This step corresponds to a linear distance of pc for the ring and varies from to pc for the spiral arms. The strip of 20 arcsec wide captures all star-forming regions in the ring (spiral arms), but does not include areas outside them. The exception is the large star complex in the northwestern part of the bar (Fig. 1), however, in the analysis it is superimposed on the young stellar region in the ring having the same PA. The obtained photometric profiles in NUV, , , and H along the ring and arms are presented in Fig. 2.
3.2 Spatial regularity of young stellar population along the ring and arms
Longitudinal displacement along the ring, denoted as , is equal to , where is in radians. For the logarithmic spirals, . We adopted a zero-point for the displacement along the ring, , corresponding to PA. It increases from north toward east, the same as the PA. The displacement values along the spiral arms were combined with the displacements along the ring: at the points of intersection between the spiral arms and the ring at the outer ends of the arms, their displacement was taken equal to the displacement along the ring, .
Using mostly profiles in the band and H line, and involving profiles in the NUV band, we found the local brightness maxima on the profiles. We prefer to use the band image, since it has sufficient resolution and is sensitive to the presence of a young stellar population. In addition, the H-image was used to identify H ii regions those are weakly visible in the passband. The low-resolution NUV image, as well as the image in the band, were used for control.
The local maxima of brightness were determined as the lower extrema of the functions , , for the ring and both spiral arms. To locate them, we looked for points with the first derivative of the function, or , and the second derivative, or on the profiles. We selected peaks whose widths exceed three measurement points (corresponding to the angular resolution of the images in optical bands) and whose amplitude exceeds 0.043 mag for the , 0.017 dex for H and 0.24 mag for the NUV (which corresponds to the threshold above the average background level in the corresponding images within the used aperture, arcsec2).
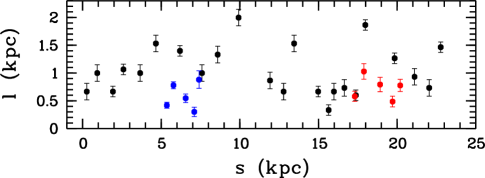
As a result, we obtained 23 local maxima of brightness in the ring, with 6 maxima in the eastern arm (Arm E), and 6 maxima in the western arm (Arm W). The positions of these maxima are shown in Fig. 2. Some local maxima of brightness do not appear in or in H (see Fig. 2), which is a reflection of the photometric evolution of young star clusters with an age from to Myr (Whitmore et al., 2011). The typical errors of maximum positions are measurement points, which corresponds to an error of pc for the ring; the maximum does not exceed 140 pc (see Fig. 3).
In the next step, we measure separations, , between adjacent local maxima of brightness along the ring and arms (Fig. 3). The separation between the and maxima is defined as . For the ring, we looped the profile so that . Figure 3 shows a rather regular separation between adjacent local maxima of brightness along the ring.
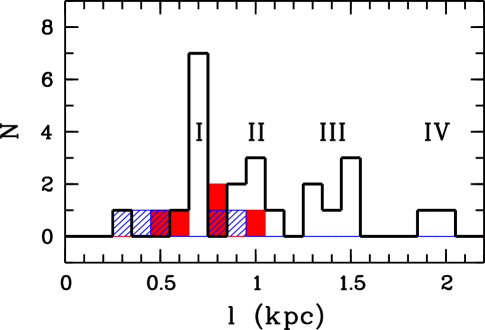
We built a histogram of the distribution of separations in the ring and in the spiral arms (Fig. 4). We note that the arm distributions do not show noticeable regularity. For the ring, the histogram shows a well-pronounced main peak in the distribution at pc and several secondary peaks.
We estimated the mean and median separations between local maxima of brightness in the ring of the galaxy for four separate subsets of objects, numbered in Fig. 4. Our results are presented in Table 2, where the confidence intervals correspond to a 95% confidence probability (0.05 significance level in the framework of Student’s -test). The errors in the table do not include the intrinsic measurement errors in pairs, that is, equal to kpc, which does not depend on the affiliation of pairs to a particular subset.
| Subset | Mean (kpc) | Median (kpc) | |
|---|---|---|---|
| I | 8 | ||
| II | 6 | ||
| III | 6 | ||
| IV | 2 |
We also note that there is no correlation between the affiliation of pairs of local maxima of brightness to different subsets and the accuracy of measurement of their positions and peak amplitudes.
Thus, the distribution of separations can be multimodal. Given the sample size is too small to make a robust multimodality test, we calculated distances between the peaks relative to their widths according to the definition by Ashman et al. (1994): , where , are the means of subsets and (I and II or II and III), , are the standard deviations. For both pairs of subsets , as well as for a mixture of two Gaussian distributions, is required for a clean separation between the modes. Additionally, we calculated distances between peaks and check if they exceed (where comprises both statistical errors and measurement errors for a pair of subsets): kpc, whereas kpc; and kpc, whereas kpc.
The most important result obtained from the analysis of the distribution over is the multiplicity of secondary peaks relative to the main one. The characteristic (mean) separations in subset II are about one and a half times greater (, considering the internal positioning errors of pairs), while in subset III, they are about two times greater (), and in subset IV, they are about three times greater () than the separation in subset I. We do not discuss subset IV as it contains only two measurements, which is insufficient for a statistic analysis.
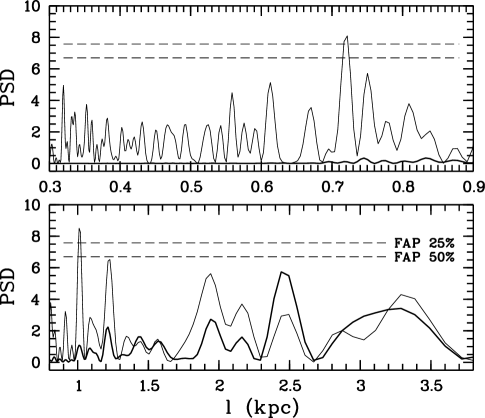
Additionally, to estimate the power spectrum of our data, we computed the Lomb-Scargle periodograms for the -band profiles along the ring shown in Fig. 2, and for the function . The function is a collection of Gaussians, centered at points of local maxima of brightness on the profiles, with equal to the peak positioning error. The Gaussian amplitudes are assumed to be equal to the measured peak amplitudes, normalized to the maximum amplitude. If significant peaks were recorded in several bands (, NUV, H), the largest normalized amplitude was adopted. Outside of the Gaussians, the function is valid for all other points.
The periodograms, obtained using the technique developed by Scargle (1982), Horne & Baliunas (1986), and Press & Rybicki (1989), also thoroughly explained by VanderPlas (2018), are presented in Fig. 5. The Fourier analysis data, obtained for profiles and for functions , complement each other to support the presence of the spatial regularity of local maxima of brightness. The former shows characteristic low frequencies ( kpc, bottom panel in Fig. 5), the latter represents high frequencies ( kpc, upper panel).
The periodograms have noticeable peaks with a false-alarm probability (FAP; see Horne & Baliunas, 1986, for details) of and kpc, which corresponds to the characteristic separations in subsets I and II, respectively. Hence, the results of the Fourier analysis support the estimation of characteristic separations of local maxima of brightness in the ring based on their distributions in Figs. 3 and 4 and also presented in Table 2.
4 Discussion
Earlier in this paper, we use NGC 628 as an example to discuss the effect of a shock wave on the formation of regularity in the distribution of young stellar groupings, along with a possible anti-correlation between shock wave signatures and the presence of chains of star complexes (Gusev & Efremov, 2013). This galaxy has two primary spiral arms, one of them showing an absence of shock wave and hosting the regular chain of star complexes, while the other does not. Nevertheless, both spiral arms in NGC 628 have the same regular characteristic separation between fainter star-formation regions that are adjacent to one another.
NGC 6217 is an example of a galaxy in which a similar regularity in the distribution of young stellar groups occurs in the ring located near the corotation radius. No shock waves are expected to be observed in this area. The detection of regularity here is a rather unusual result. In the corotation region, H i/H2 clouds, the progenitors of H ii regions and young stellar groups are not expected to experience any significant mutual influence and they do not show a tendency towards concentration. A possible reason for the structural features observed in the ring of NGC 6217 may be that it may be, in fact, a pseudo-ring. A prominent bar can act as the driver of the Jeans instability wave. We note that the largest distances between adjacent maxima of brightness are observed directly in front of the bar (relative to the direction of rotation of the galaxy; see Fig. 1).
We obtained the characteristic distance, pc, which seems to correspond to a double wavelength of spacing regularity. Elmegreen et al. (2018) in M100 and Gusev & Efremov (2013) in M74 (NGC 628) obtained the characteristic spacings of pc, half as large. Our subset II corresponds to , which may indicate the existence of a wavelength of . The power spectral density of the profile has the largest peak at kpc (Fig. 5) that is close to . Our linear resolution is insufficient to look for spatial regularities on the scale of .
The characteristic spacing wavelength for hydrogen clouds is , where is the sound speed and is the mass column density of the gas (Elmegreen & Elmegreen, 1983). Spatial regularity in the ring of NGC 6217 indicates the constancy of parameters of the gas medium along the ring. The mass column density of H i near the ring is pc-2 (van Driel & Buta, 1991). The sound speed is a few km s-1 for both and , which is a typical speed in a diffuse H i medium.
5 Conclusions
For the first time, a spatial regularity was found in the distribution of the young stellar population in the galaxy ring located near the corotation region. This refines our understanding of the physical processes that contribute to the formation of a regular wave of star formation in rings and arms. The presence or absence of shock waves does not appear to affect the genesis of regularity in regions of star formation.
The obtained characteristic separation, between adjacent young stellar groupings in the ring of NGC 6217 is equal to pc, that is twice as much as the characteristic separation obtained for young stellar groups in the spiral arms of M100 and M74. However, we suspect a characteristic separation with a scale of along the ring of NGC 6217, the same as was found earlier in spiral arms of M100 and M74. This may indicate a unified mechanism for the formation of such regularities in spiral arms and in the rings of galaxies. Achieving greater clarity around the characteristic separations in the rings requires the search and analysis of regularities in nearer ringed galaxies with improved spatial resolution.
Acknowledgements.
We are grateful to the referee for their constructive comments. We would like to honor Prof. Yu. N. Efremov, who was the initiator of this research program, and who left us in August 2019. The authors acknowledge the use of the HyperLeda data base (http://leda.univ-lyon1.fr), the NASA/IPAC Extragalactic Database (http://ned.ipac.caltech.edu), Barbara A. Miculski Archive for space telescopes (https://archive.stsci.edu), and the IDL Astronomy User’s Library (https://idlastro.gsfc.nasa.gov). This study was supported by the Russian Foundation for Basic Research (project no. 20-02-00080). A.G. acknowledges the support from the Lomonosov Moscow State University Development Program (Leading Scientific School ”Physics of stars, relativistic objects and galaxies”).References
- Artamonov et al. (1999) Artamonov, B. P., Badan, Yu. Yu., Bruevich, V. V., & Gusev, A. S. 1999, Astron. Rep., 43, 377
- Ashman et al. (1994) Ashman, K. M., Bird, C. M., & Zepf, S. E. 1994, AJ, 108, 2348
- Buta (2017) Buta, R. J. 2017, MNRAS, 470, 3819
- Buta et al. (2015) Buta, R. J., Sheth, K., Athanassoula, E. et al. 2014, ApJS, 217, 32
- Comerón et al. (2014) Comerón, S., Salo, H., Laurikainen, E. et al. 2014, A&A, 562, id. A121
- Díaz-García et al. (2019) Díaz-García, S., Salo, H., Knapen, J. H., & Herrera-Endoqui, M. 2019, A&A, 631, id. A94
- Efremov (2009) Efremov, Yu. N. 2009, Astron. Lett., 35, 507
- Efremov (2010) Efremov, Yu. N. 2010, MNRAS, 405, 1531
- Efremov (2011) Efremov, Yu. N. 2011, Astron. Rep., 55, 108
- Elmegreen (1994a) Elmegreen, B. G. 1994a, ApJ, 425, L73
- Elmegreen (1994b) Elmegreen, B. G. 1994b, ApJ, 433, 39
- Elmegreen & Elmegreen (1983) Elmegreen, B. G., & Elmegreen D. M. 1983, MNRAS, 203, 31
- Elmegreen et al. (1996) Elmegreen, B. G., Elmegreen, D. M., Chromey, F. R., Hasselbacher, D. A., & Bissell, B. A. 1996, AJ, 111, 2233
- Elmegreen et al. (2018) Elmegreen, B. G., Elmegreen, D. M., & Efremov, Yu. N. 2018, ApJ, 863, 59
- Epinat et al. (2008) Epinat, B., Amram, P., & Marcelin, M. 2008, MNRAS, 390, 466
- Font et al. (2014) Font, J., Beckman, J. E., Querejeta, M. et al. 2014, ApJS, 210, 2
- Font et al. (2019) Font, J., Beckman, J. E., James, P. A., & Patsis, P. A. 2019, MNRAS, 482, 5362
- Garrido et al. (2005) Garrido, O., Marcelin, M., Amram, P. et al. 2005, MNRAS, 362, 127
- Gusev & Efremov (2013) Gusev, A. S., & Efremov, Yu. N. 2013, MNRAS, 434, 313
- Gusev et al. (2015) Gusev, A. S., Guslyakova, S. A., Novikova A. P. et al. 2015, Astron. Rep., 59, 899
- Gusev et al. (2018) Gusev, A. S., Shimanovskaya, E. V., Shatsky, N. I. et al. 2018, Open Astronomy, 27, 98
- Hernandez et al. (2005) Hernandez, O., Carignan, C., Amram, P., Chemin, L., & Daigle, O. 2005, MNRAS, 360, 1201
- Horne & Baliunas (1986) Horne, J. H., & Baliunas, S. L. 1986, ApJ, 302, 757
- James et al. (2004) James, P. A., Shane, N. S., Beckman, J. E. et al. 2004, A&A, 414, 23
- Morrissey et al. (2005) Morrissey, P., Schiminovich, D., Barlow, T. A. et al. 2005, ApJ, 619, L7
- Press & Rybicki (1989) Press, W. H., & Rybicki, G. B. 1989, ApJ, 338, 277
- Scargle (1982) Scargle, J. D. 1982, ApJ, 263, 835
- VanderPlas (2018) VanderPlas, J. T. 2018, ApJS, 236, 16
- van Driel & Buta (1991) van Driel, W., & Buta, R. J. 1991, A&A, 245, 7
- Véron-Cetty & Véron (2010) Véron-Cetty, M.-P., & Véron, P. 2010, A&A, 518, id. A10
- Whitmore et al. (2011) Whitmore, B. C., Chandar, R., Kim, H. et al. 2011, ApJ, 729, 78
- Williams et al. (2019) Williams, D. R. A., McHardy, I. M., Baldi, R. D. et al. 2019, MNRAS, 486, 4962