Intermittent flow and transient congestions of soft spheres passing narrow orifices
Abstract
Soft, low-friction particles in silos show peculiar features during their discharge. The outflow velocity and the clogging probability both depend upon the momentary silo fill height, in sharp contrast to silos filled with hard particles. The reason is the fill-height dependence of the pressure at the orifice. We study the statistics of silo discharge of soft hydrogel spheres. The outflow is found to become increasingly fluctuating and even intermittent with decreasing orifice size, and with decreasing fill height. In orifices narrower than two particle diameters, outflow can stop completely, but in contrast to clogs formed by rigid particles, these congestions may dissolve spontaneously. We analyze such non-permanent congestions and attribute them to slow reorganization processes in the container, caused by viscoelasticity of the material.
I Introduction
The peculiarities of granular materials stored in containers have raised the interest of scientists already centuries ago. One of the earliest scientific reports on the outflow of sand from storage containers dates back to 1829, when Pierre Huber-Burnand Huber-Burnand (1829) described the pressure conditions in a granular bed within vertical cylinders. He noticed already that the flow of grains is essentially pressure independent. Gotthilf Hagen (known for the Hagen-Poiseuille law) reported, in great detail, experiments and calculations on the pressure in dry sand Hagen (1852). An important step forward was made by Janssen Janssen (1895); Sperl (2006) who measured the pressure in wheat-filled silos and provided a quantitative explanation. He predicted that the pressure characteristics changes with increasing fill level from a hydrostatic behaviour at fill heights comparable to the container diameter to a saturated maximum pressure. The latter is fill-level independent, but relates to the friction properties of the grains and the bin width. Many dynamic features of hard particles discharging from silos with small orifices at the bottom are well-known: The grains flow freely and without interruptions when the orifice size is sufficiently large (about five particle diameters or more). The discharge velocity is described quite reliably by Beverloo’s equation Franklin and Johanson (1955); Beverloo et al. (1961); Neddermann et al. (1982) and some refinements proposed later Mankoc et al. (2007). With smaller orifice sizes, the discharge rate decreases continuously. The outflow rate is practically independent of the pressure at the container bottom, and thus also independent of the container fill height Neddermann et al. (1982); Anand et al. (2008). This is true at least when the instantaneous fill height is larger than the orifice size.
Below a certain outlet diameter, hard particles form a stable clog at the orifice Beverloo et al. (1961); To et al. (2001). This structure blocks further outflow, and it can only be destroyed by external forcing like vibration of the silo Hunt et al. (1999); Wassgren et al. (2002); Mankoc et al. (2009); Janda et al. (2009); Lozano et al. (2012); Zuriguel et al. (2017); Guerrero et al. (2018, 2019) or air flushes through the opening Zuriguel et al. (2005). The destruction of clogged states by container vibrations, also called unjamming, has been extensively studied quantitatively in the past. Vibrations have also been applied during avalanches to study inhibiting or supporting effects on discharge rates Takahashi et al. (1968); Suzuki et al. (1968); Lindemann and Dimon (2000); Chen et al. (2006); Kumar et al. (2020).
The amount of grains discharged between two clogs, the so-called avalanche size , is one of the key figures of merit in silo discharge. Avalanche sizes are statistically distributed. Their mean size increases with increasing outlet width, more specifically with increasing ratio of orifice width to particle size. Empirically, a power law has been proposed for the relation Zuriguel et al. (2005). A crude estimate of the orifice width necessary for free uninterrupted flow of hard spheres is five times the particle diameter Zuriguel et al. (2005); Mankoc et al. (2009). On the other hand, an exponential dependence was derived theoretically by Thomas and Durian Thomas and Durian (2015) on the basis of a microscopic model. In their description, there is no critical orifice size that sharply separates the free-flowing from the clogging regime Thomas and Durian (2015). However, the avalanche sizes become very large when exceeds a value of approximately 5. For typical avalanche sizes found in experiments, the two models are practically indistinguishable. The Beverloo equation describes the discharge rate both during avalanches and in the free flow regime.
Most experiments and numerical simulations have been performed with hard monodisperse spherical grains in the past. Few experiments of non-spherical shapes Zuriguel et al. (2005); Börzsönyi et al. (2016); Ashour et al. (2017); Szabó et al. (2018) demonstrated that many features of the discharge can be compared to those of spheres when an effective particle radius is introduced. Examples of numerical simulations of silo discharge of non-spherical particles with multisphere-DEM include rods Török et al. (2017) and mixtures of spherical and rodlike grains Lattanzi and Stickel (2019).
Many features of silo discharge are not only qualitatively but even quantitatively similar in two-dimensional (2D) and three-dimensional geometries. The 2D container geometry offers the advantage that internal structures and dynamic processes can be directly observed with non-invasive optical techniques. Interesting features are the spontaneous formation of blocking arches Tang and Behringer (2011); Zuriguel et al. (2014), the preceding kinetics Rubio-Largo et al. (2015), and the identification of force networks in the blocking structures Hidalgo et al. (2013); Vivanco et al. (2012). The detailed structure and stability of clogs of hard grains has been investigated Drescher et al. (1995, 1995); Manna and Herrmann (2000); Pugnaloni et al. (2001); To et al. (2001); To and Lai (2002); Zuriguel et al. (2003); Pugnaloni and Barker (2004); Lozano et al. (2012); Garcimartín et al. (2013). For 3D systems, a few results on clogging structures were obtained using X-ray imaging Börzsönyi et al. (2016); Török et al. (2017).
It was also shown that non-adhesive colloidal particles in suspension flow across constrictions in a way that is very similar to the behavior of dry non-cohesive granular materials Marin et al. (2018); Souzy et al. (2020).
Silo discharge of hard grains has been investigated in numerous studies in the past, yet in agriculture, pharmacy and many technological processes, one frequently encounters soft particles. Nevertheless, soft granular material has been investigated only scarcely so far Hong et al. (2017); Ashour et al. (2017); Stannarius et al. (2019, 2019). In earlier experiments, gas bubbles in a liquid Bertho et al. (2006) and liquid droplets in an oily emulsion Hong et al. (2017, 2017) were investigated. Hydrogel spheres (HGS) served as elastic solids Hong et al. (2017); Ashour et al. (2017); Stannarius et al. (2019, 2019). These HGS are incompressible and moderately deformable, with elastic moduli of the order of 10 kPa to 100 kPa. As a descriptive measure of this softness, one can regard the amount of deformation induced by the pressure at the silo bottom. In a silo of about 1 m fill height, as used in our experiments, the particles are compacted by up to about 20% of their diameter (compensated by a transverse expansion because of volume conservation).
Several peculiarities distinguish silo discharge of this soft material from that of hard grains. First, it is a striking new feature that these low-friction soft grains do hardly clog, even when the orifice size is only slightly larger than two particle diameters Hong et al. (2017); Ashour et al. (2017). Only below that size, the system forms clogged states. Second, the very low friction coefficient of these HGS leads to a nearly hydrostatic pressure characteristics, at least at practical fill heights up to about 100 particle diameters Ashour et al. (2017). This pressure in the quasi-2D hopper is linearly related to the fill height. In contrast to rigid grains, there is also a clear fill-height dependence of the discharge rate and even of the discharge characteristics. For each orifice size below two particle diameters, one finds a characteristic fill height at which the outflow stops permanently Ashour et al. (2017). An aspect that has been disregarded in the earlier studies is the occurrence of transient clogs in these systems. These are blocking structures that dissolve spontaneously after some time. Such structures have been found earlier in other contexts, viz. oil droplets in emulsions Hong et al. (2017), living matter like animals passing a gate Zuriguel (2014) or pedestrians Helbing and Molnar (1995); Helbing et al. (2000, 2005).
In the present study, we analyze the flow of soft, low-friction grains through small orifices and the spontaneous formation and dissolution of non-permanent congestions of the outlet.
II Experimental setup
The setup consists of a flat box of 80 cm height and 40 cm width, slightly thicker than the particles’ diameter, with an adjustable orifice in the center of the bottom plate Ashour et al. (2017). A front view is shown in Fig. 1. In the images, the side edges are hidden by 3 cm wide aluminum bars carrying the front and rear glass plates, so that the optically accessible area in the pictures is only 34 cm wide. Two symmetric sliders at the bottom are used to fix the orifice width . They are tapered towards their ends. The bin can hold about 9,500 grains with a total weight of kg. At the top of the container, there is an additional storage volume that can comprise another kg of grains.
Hydrogel spheres were acquired from a commercial supplier (Happy Store, Nanjing) in dry form. They were soaked before the experiments for at least 24 h in a NaCl solution. The final size of the swollen HGS depends upon the salt concentration which was chosen such that we obtained uniformly-sized HGS with 6.5 mm diameter, which varied by approximately 3 %. The mass of a single HGS is 0.185 g. The friction coefficient is very low, of the order of 0.01 or lower. The elastic modulus is approximately 50 kPa (they are slightly softer in the outer shell than in their cores). We determined the elastic moduli from diameters of Hertzian contacts under given weights. A reasonable measure of the softness of the particles is the ratio of the pressure at the bottom of the container (of the order of a few kPa for fill heights of up to 1 m) and the elastic modulus. In our setup, this ratio can reach a value of 0.1.


The setup is observed with a commercial video camera (XiaoYi 4K+ Action Camera), and videos are taken with a frame rate of 60 fps and, if not stated otherwise, with a spatial resolution of 0.327 mm/pixel. Below the orifice, we collect the discharged particles in a tray mounted on a balance. The HGS are taken from the storage bath, placed on tissue to remove excess water and then filled into the silo from above, while the orifice is closed. After filling, the orifice is opened and we record in parallel the weight of the discharged material and the video of the silo front side. Video and mass measurements can be synchronized better than 0.5 s.
In order to demonstrate the differences of the behavior of the soft, low friction grains in comparison to hard frictional particles of a similar size and density, we have performed some experiments with hard plastic ammunition (Airsoft bullets, ASB). These have a similar density as the HGS and a comparable diameter of 6 mm. ASB have a friction coefficient of approximately 0.3. Their deformability can be neglected in our experiments.
| Material | Orifice | Character of discharge | |
|---|---|---|---|
| ASB | 34 mm | 5.7 | free flow |
| HGS | 18 mm | 2.77 | free flow |
| HGS | 15 mm | 2.30 | free flow |
| HGS | 12 mm | 1.85 | fluctuating flow, cm |
| HGS | 11 mm | 1.69 | intermittent flow, cm |
| HGS | 10 mm | 1.55 | intermittent flow, cm |
Table 1 lists the combinations of orifice sizes and materials in this study, and the character of the discharge. Free flow means an uninterrupted discharge where the flow rate is either constant or decreases with decreasing fill heights. Fluctuating flow is identified by randomly varying flow rates, superimposed on the general trend to lowering rates with decreasing fill heights. Intermittent flow is characterized by phases where flow is completely interrupted. The distinction between intermittent and fluctuating flow cannot be defined sharply. There is no clear criterion, since the fluctuations can become large enough to practically stop the flow. Empirically, we may set some threshold time where the observer by eye does not perceive motion of the grains blocking the orifice. These details will be clarified in the following sections.
III Experimental results
III.1 Packing structures
The ASB are packed in domains of a perfect hexagonal lattice with few defects and dislocations forming the domain borders. The effective 2D packing fraction (in the container midplane) is close to the maximum packing density for identical disks in a hexagonal 2D lattice. During the discharge, the packing fraction lowers noticeably in the flowing region, in particular near its edges and directly above the orifice, owing to Reynolds dilatancy.
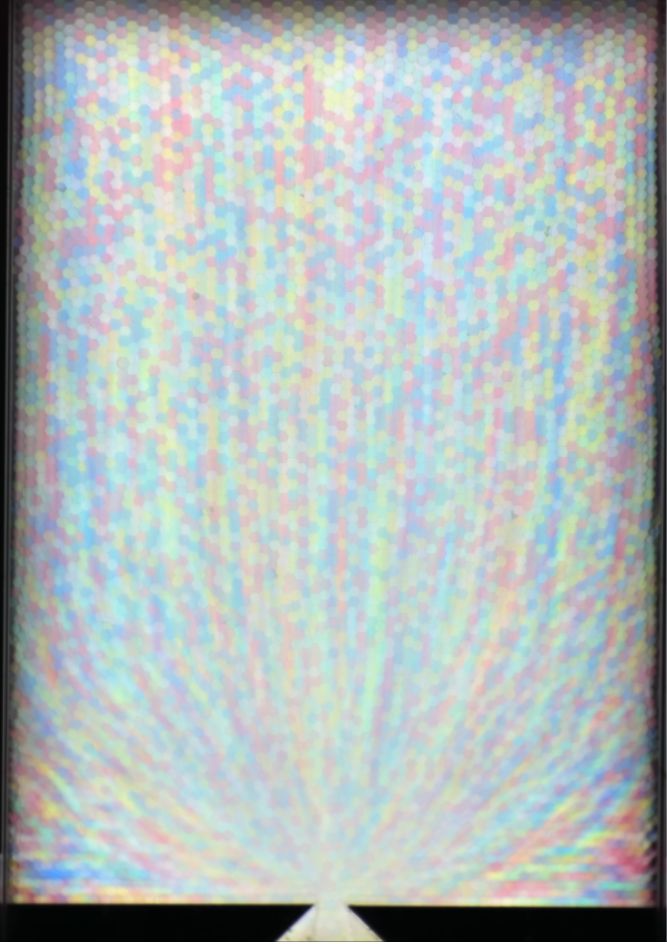
The situation for the HGS particles is quite different. They also form a hexagonal lattice, but practically without dislocations or defects. However, there are long-range distortions of the lattice (see Fig. 1). Since the HGS can be substantially deformed, the 2D packing fraction is, although still applicable, not the most reasonable presentation. While we determine the local packing densities by counting the spheres per area, we present the results in terms of the 3D packing fraction . The densest packing of uniform spheres with diameter in a cell with thickness yields .
It is evident that the packing structure of the soft HGS is denser at the bottom than at the top (see Fig. 1, bottom). Moreover, the packing fraction depends in a complex fashion on the history of the ensemble. After filling the hopper, we counted a 2D packing density of approximately 3.07 spheres/cm2 in an upper part, approximately 45 cm above the orifice (still approximately 30 cm below the top of the granular bed). This corresponds to a space filling of . The spheres are flattened and squeezed out of the central plane so that the distance between neighbors is smaller than the original sphere diameter. At the bottom of the container, approximately 50 cm below the top of the granular bed, we found on average 3.55 spheres/cm2 (), i. e. more material of the HGS was squeezed out of the midplane. The pressure in HGS-filled cells has been measured earlier by Ashour Ashour et al. (2017). It was found that the static pressure at the bottom of the silo grows nearly linearly with height, at a rate of about 7 kPa/m.
As soon as the outflow starts, the packing fraction gradually decreases, starting from the region near the orifice. During the phases of continuous flow in a hopper with 10 mm orifice, the average packing fraction near the bottom ( cm above the orifice) dropped by more than 15 % to about 3.0 spheres/cm2 () and near the top layer by approximately 5 % to about 2.93 spheres/cm2 (). We will show in more detail in the next section how the packing fraction relaxes during the discharge. The packing fraction fluctuates during the discharge by a few percent until the outlet gets blocked. After a longer (several seconds) stagnation of the outflow, the average packing fraction near the bottom is increased again to roughly 0.756 (approximately ), and it drops again as soon as the discharge continues.
The focus of the following experiments will be the fluctuations of the outflow that are related to the elastic and frictional characteristics of the HGS. First, we will concentrate on the flow field inside the container and the reorganization of the packing structures, before we analyze the dynamics at the orifice. Note that in both ASB and HGS experiments, we used monodisperse ensembles. As stated above, this leads to more or less perfect lattice structures with dislocations in the container. This influences the flow field particularly in the hard particle experiment. Polydisperse mixtures may differ in some features.
III.2 Flow inside the silo
The structure of the flow field SI can be directly visualized by averaging subsequent images of the recorded videos. Figure 2a shows averages of 1000 frames of the front view of ASB. The image is blurred in flowing regions. The most characteristic feature is that there is a pronounced flow along the trigonal lattice planes, indicated by ray-like lines, most prominent at the lateral edges of the flowing zone. A comparable average is shown in Fig. 2b for the soft HGS. Qualitatively, the flow profiles inside the container do not depend significantly upon the orifice sizes, but strongly on the material properties.

a) b)
In the ASB-filled silo, two stagnant zones are identified by their stationary hexagonal lattice. At the right hand side, one sees a dislocation in the lattice structure. In the HGS, the flow is slower in the corners, but there is no stagnant region at all. This finding is in perfect agreement with observations by X-ray tomography in 3D containers Stannarius et al. (2019, 2019).
a) 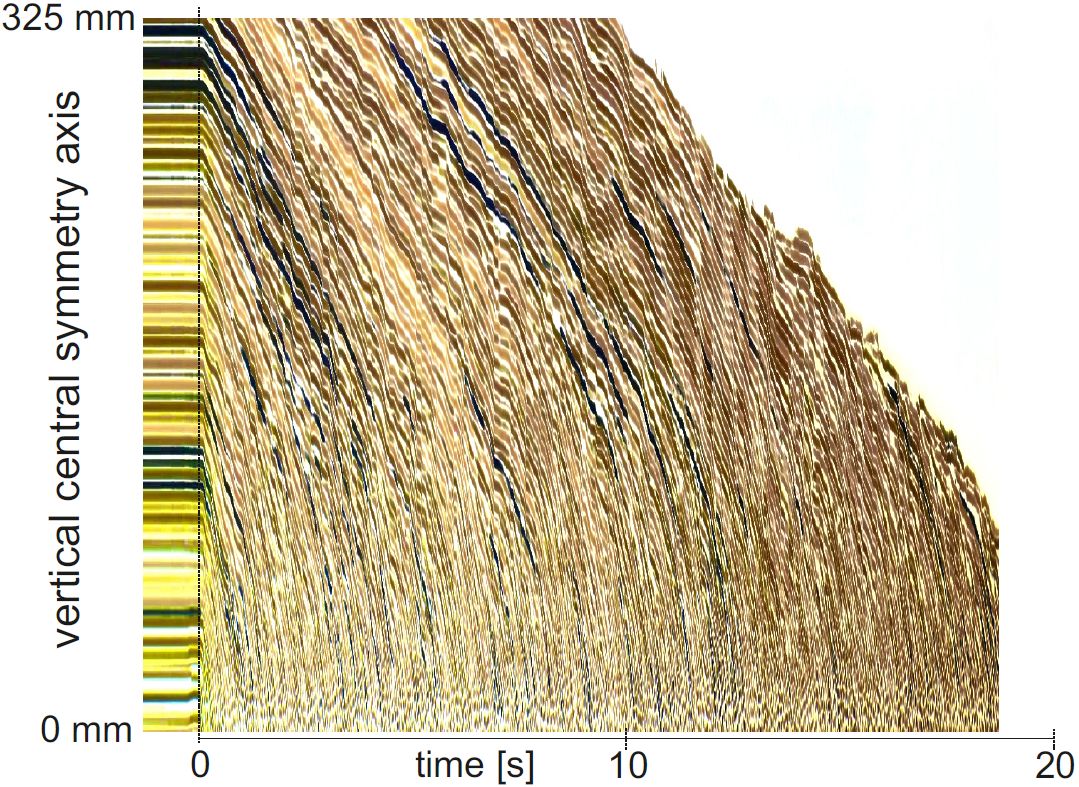
b) 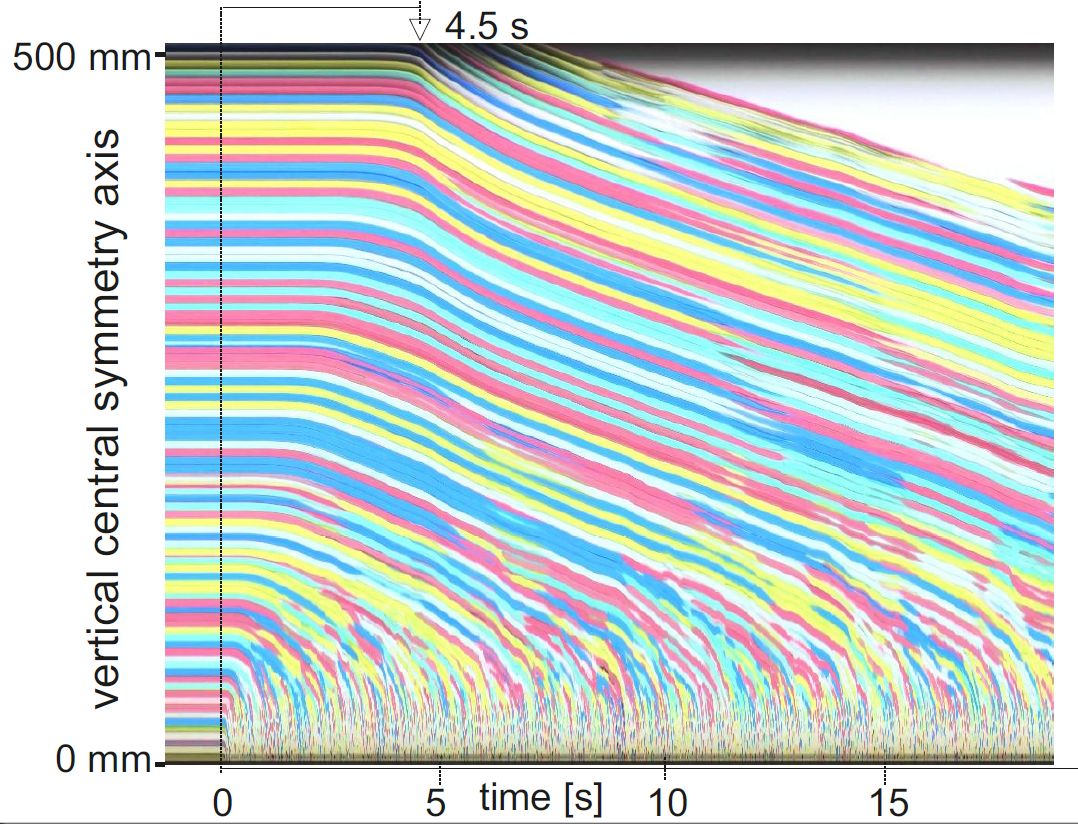
The soft, low-friction grains remarkably differ from hard particles during silo discharge in another aspect: After the start of the discharge, the local packing fractions change considerably. In the silo filled with hard grains, this quantity changes only marginally, primarily in the sheared regions near the edges of the flowing zone and in the direct vicinity of the outlet. As a consequence, the flow starting at the outlet causes motion practically instantly in all layers. This is visualized in Fig. 3a. The image shows the space-time plot of a vertical cut along the central vertical symmetry axis of the silo, above the outlet. After the orifice is opened at time zero (vertical line), the positions of all grains stacked along this cut start to move down almost immediately. In different experiments, we found delays no longer than 0.1 and 0.2 seconds. The behavior of the soft, low-friction grains (Fig. 3b) is in sharp contrast. Initially, flow sets in only in the vicinity of the outlet, while the positions of the upper grains remain unchanged. The material expands at the bottom first, lowering the effective 2D packing fraction as stated above. This is obviously a consequence of the viscoelastic properties of the HGS. Only after a substantial amount of material has flown out, in this case roughly 150 g or nearly 1000 spheres, the granular bed has sufficiently diluted and the flowing region has reached the height of 50 cm, the upper edge of the image. From then on, the material flows with roughly uniform velocity in the central axis. The downward flow accelerates only within the final 10 cm above the orifice, where the flow velocity is slower at the sides (cf. Fig. 2b).
III.3 Outflow velocity and fluctuations in the outflow rate
a)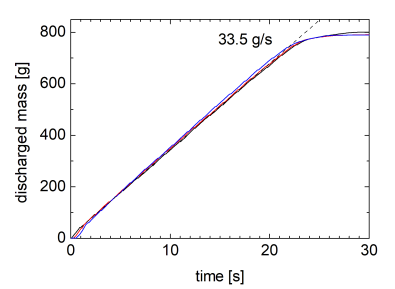 b)
b)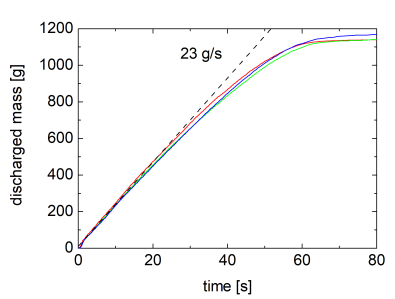 c)
c)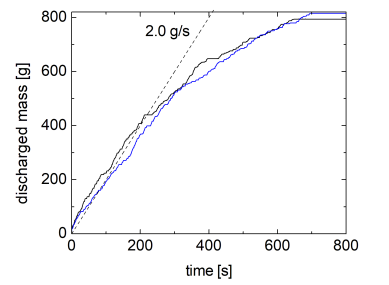
The most significant difference between the flow of hard and soft grains is the temporal variation of the outflow rate. Figure 4a shows the outflow of rigid ASB from the same silo, where we have set the orifice size to 34 mm (orifice to particle size ratio ). It represents the standard behavior of hard particles. We find a continuous outflow until the silo is nearly emptied. The outflow slows down only when the silo is almost empty and the stagnant zones erode from above until the static angle of repose is reached. Finally, some material remains in the bottom corners. At smaller orifice sizes, the same features are found, except that the discharge will stop completely when a permanent clog blocked further outflow.
In the HGS-filled silo with large enough orifice sizes, the behaviour is similar to that of the hard grains, but there is a slight pressure dependence of the outflow rate. This becomes more evident with decreasing orifice size. When the orifice is approximately 3 particle diameters wide (Fig. 4b), there is still continuous outflow of the HGS without clogging. However, one observes a clear pressure dependence (dependence upon the instantaneous fill height) of the discharge rate, even when the silo is still half-filled (cf. Fig. 6). For comparison, hard ASB will permanently clog at this relative orifice size with mean avalanche sizes of only 65 grains ( g) Ashour et al. (2017).
When the orifice size is further decreased, the dependence of the mean outflow rate on fill height gets more pronounced. In addition, the outflow rate starts to fluctuate. This is evident in Fig. 4c where we show the discharge through a 10 mm orifice (). Not only is the initial flow rate reduced respective to the 18 mm orifice by one order of magnitude, but the discharge curve also shows clear plateaus where the outflow stops for several seconds.
a)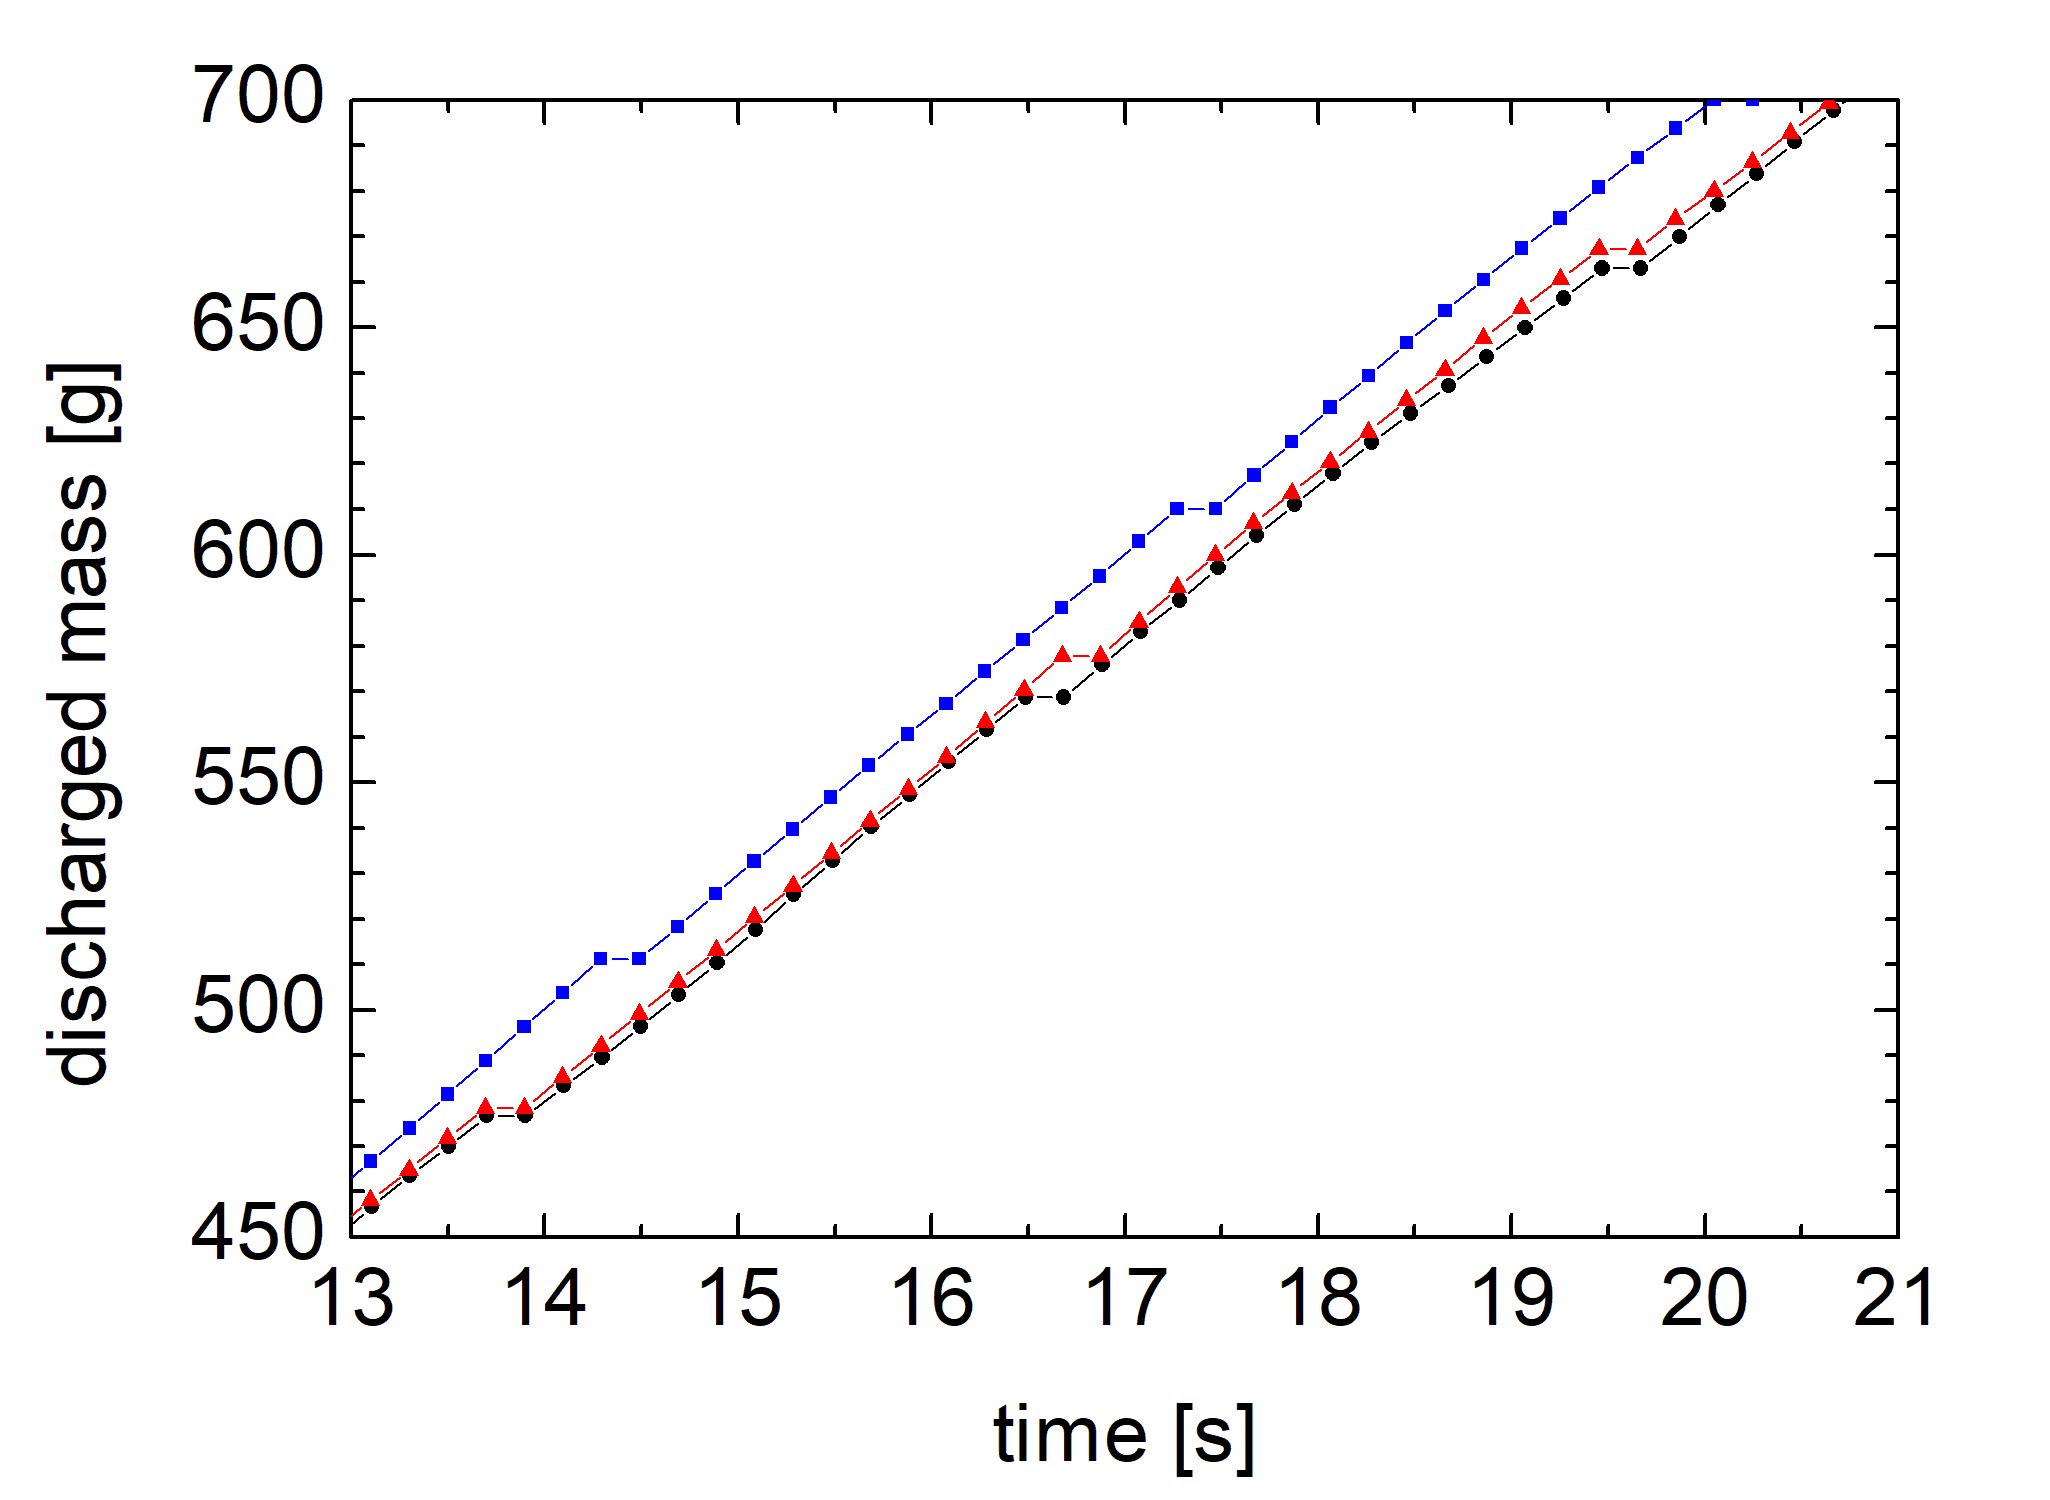 b)
b)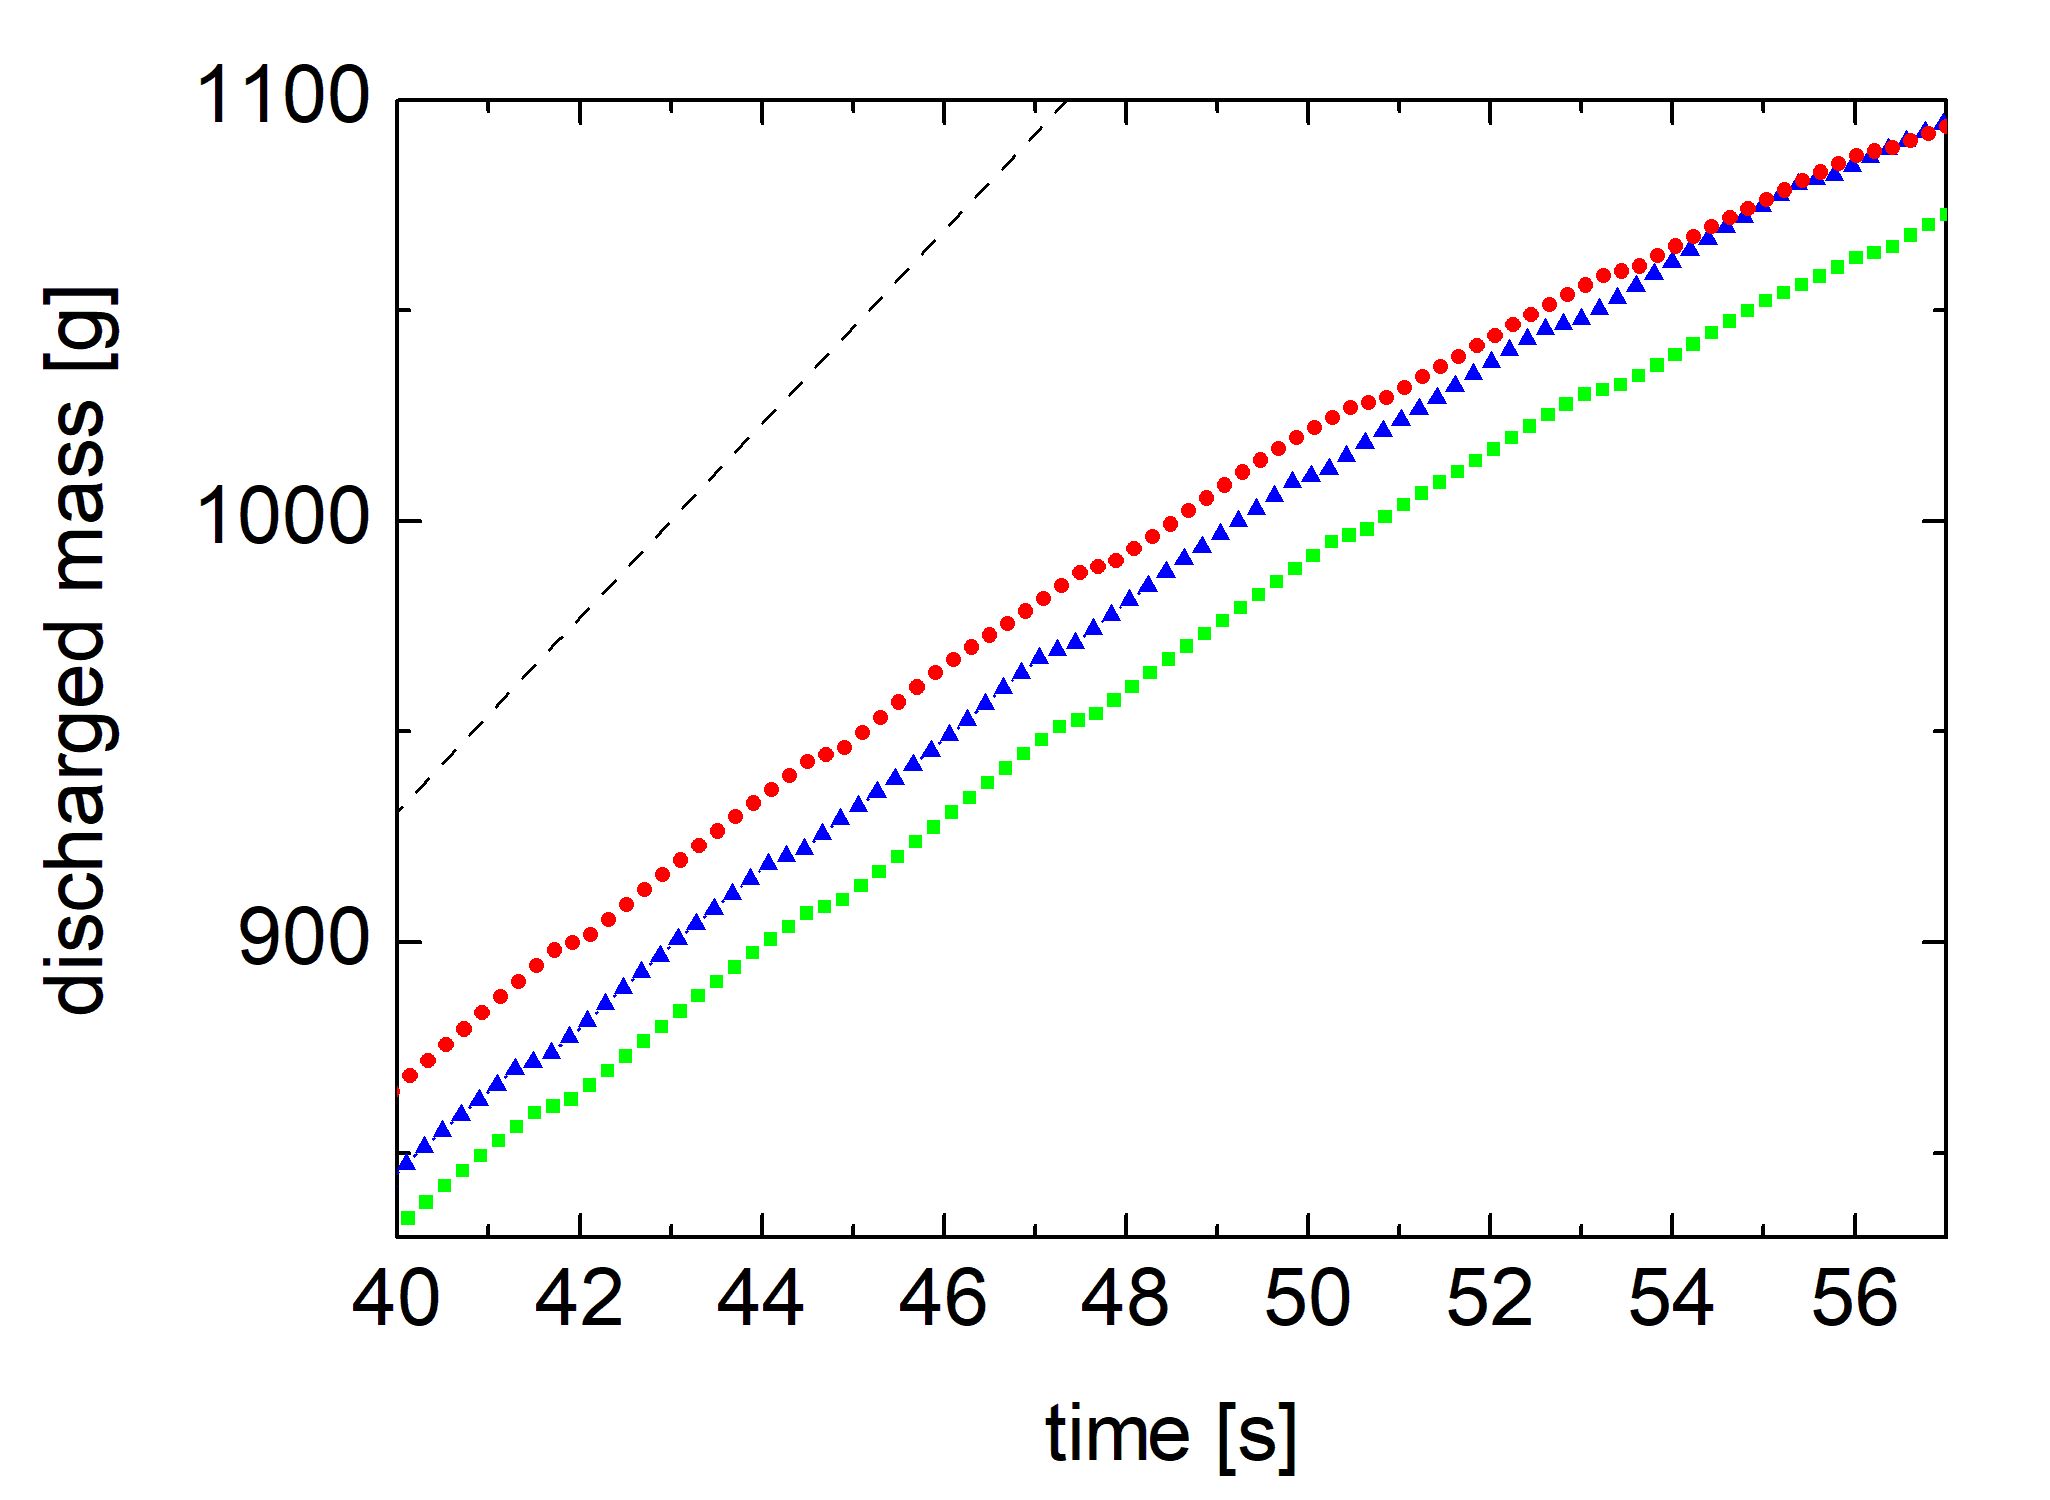 c)
c)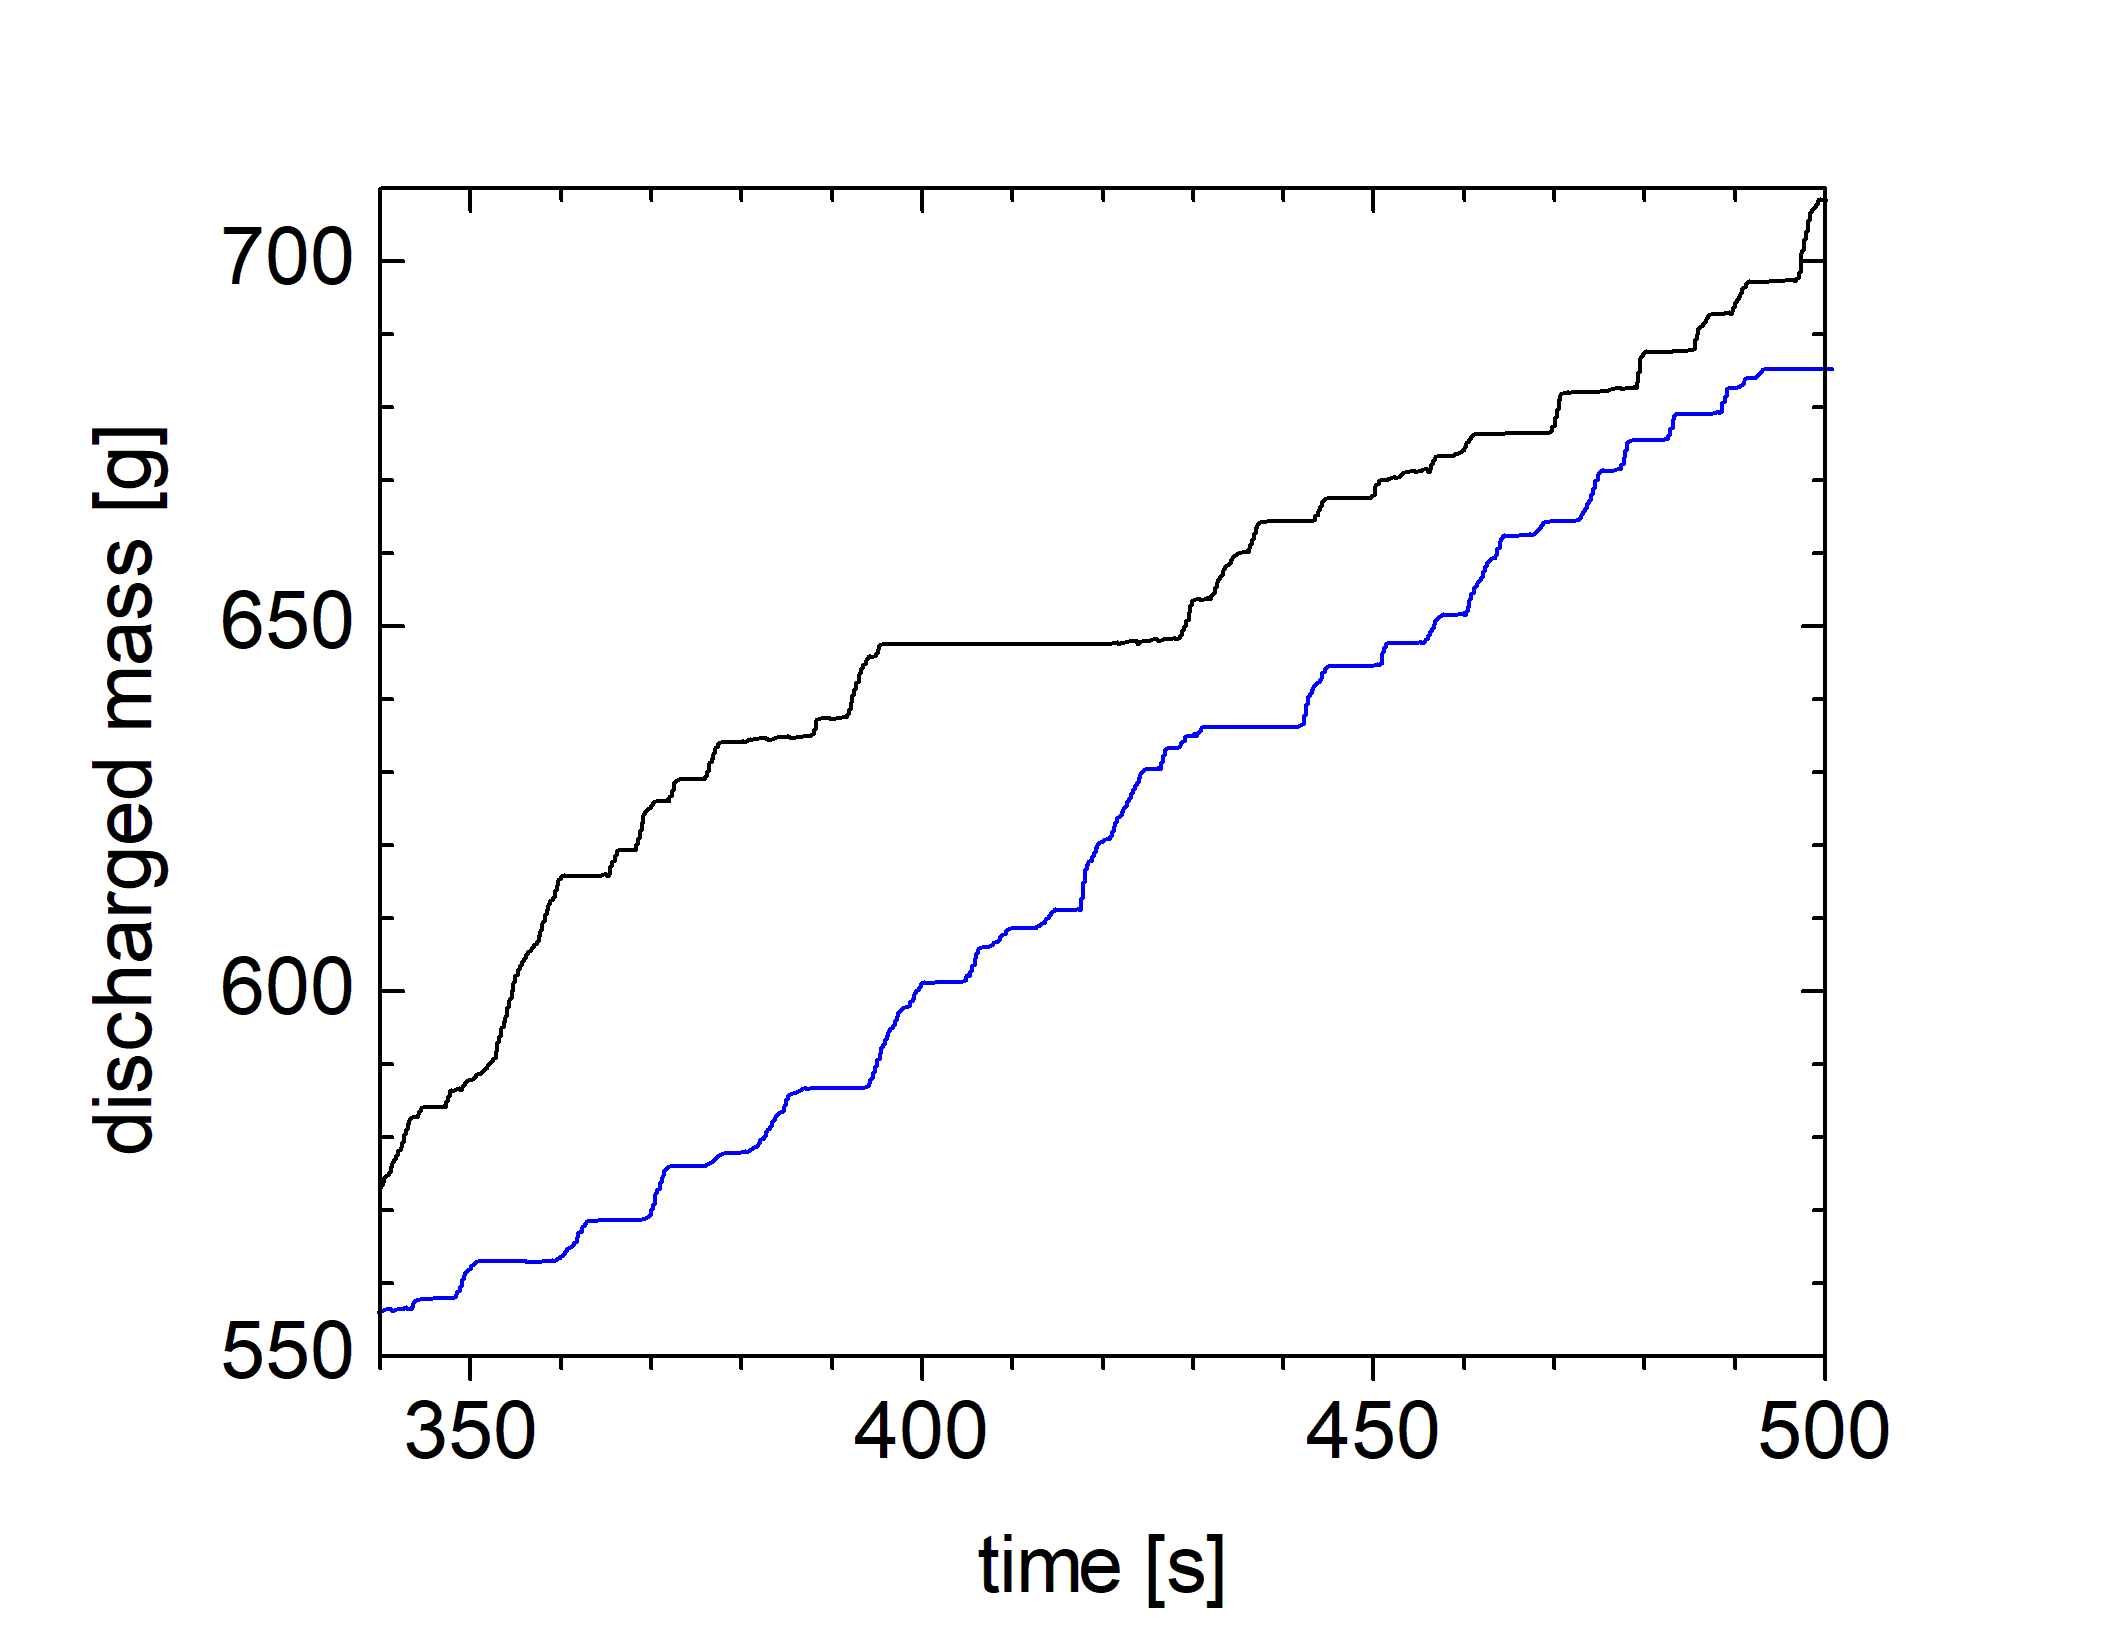
a) b)
b)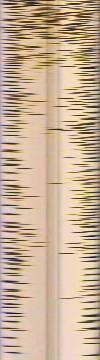 c)
c)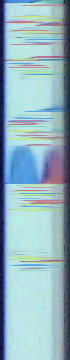 d)
d)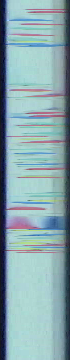 e)
e) 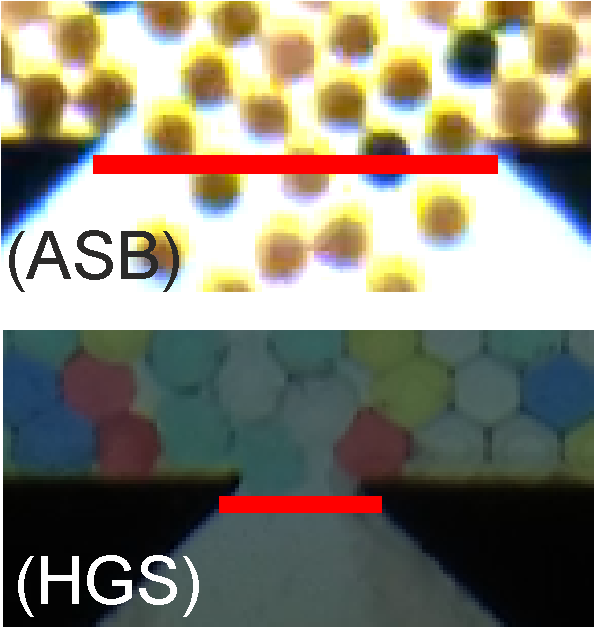
Zoomed-in details for the same data as in Fig. 4 are shown in Fig. 5. The discharge rate of the hard grains (Fig. 5a) is linear within the experimental resolution of our setup. Small steps seen in the curves are artifacts of the measurement technique, resulting from the time resolution of the balance: The balance updates its values every 0.214 s, while the computer samples these data every 0.1 s, thus each balance datum is regularly read out twice, but three times every 1.5 s.
The 18 mm HGS curve (Fig. 5b) is not straight but still smooth except for the readout artifacts. In clear contrast, the 10 mm HGS plot (Fig. 5c) shows strong fluctuations and steps that are no artifacts (note the different scales of the time axes).
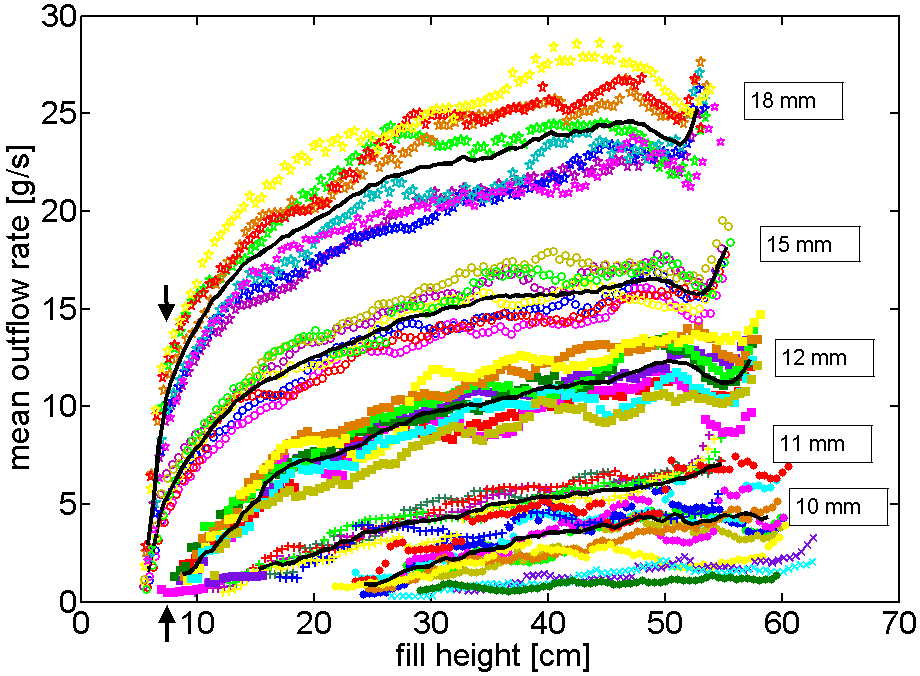
Since the outflow rate is primarily determined by the pressure at the container bottom, it is more instructive to plot the outflow rates depending on the remaining fill heights instead of time. In Fig. 6, the momentary rates are presented as functions of the instantaneous container fill level. In order to smooth these graphs, we averaged these data over periods where the fill level dropped by 5 cm. The top edge of the flowing granular bed is v-shaped, we use the mean height of this edge as the relevant parameter. The arrows in the figure indicate where the tip of the v has reached the outlet (independent of the orifice widths), and the granular bed splits in two cones left and right of the orifice, from which particles slide down and pass the gap.
As seen in the figure, all rates are strongly fill-level dependent, and the discharge rates for given orifice sizes vary considerably between individual runs of the experiment, with no systematic trend. For narrow orifices in particular, the outflow rates depend sensitively on the preparation of the samples. Even though the HGS surfaces are dried with tissue before filling them into the silo, slight variations in moisture on the HGS surfaces may affect cohesion of the spheres by capillary bridges and influence the magnitude of the flow.
Next, we analyze the temporal fluctuations of the outflow. One can directly visualize the differences between hard and soft grains without having to rely on the limited time resolution of the weight measurement: We have constructed space-time plots of a horizontal cut just below the orifice in the video frames. Figure 7 shows exemplary plots for the ASB at 34 mm opening and HGS at 10 mm opening. The ASB pass the orifice rather continuously, practically independent of the container fill height. The plot (b) of the final phase of the discharge shows that it is not a reduced rate of particles passing the orifice that flattens the graph in Fig. 4a near the end. Instead, particles do not pass through the complete outlet gap anymore. When the stagnant zones erode, grains rolling down the slopes of the remaining piles only pass the lateral sides of the orifice.
a)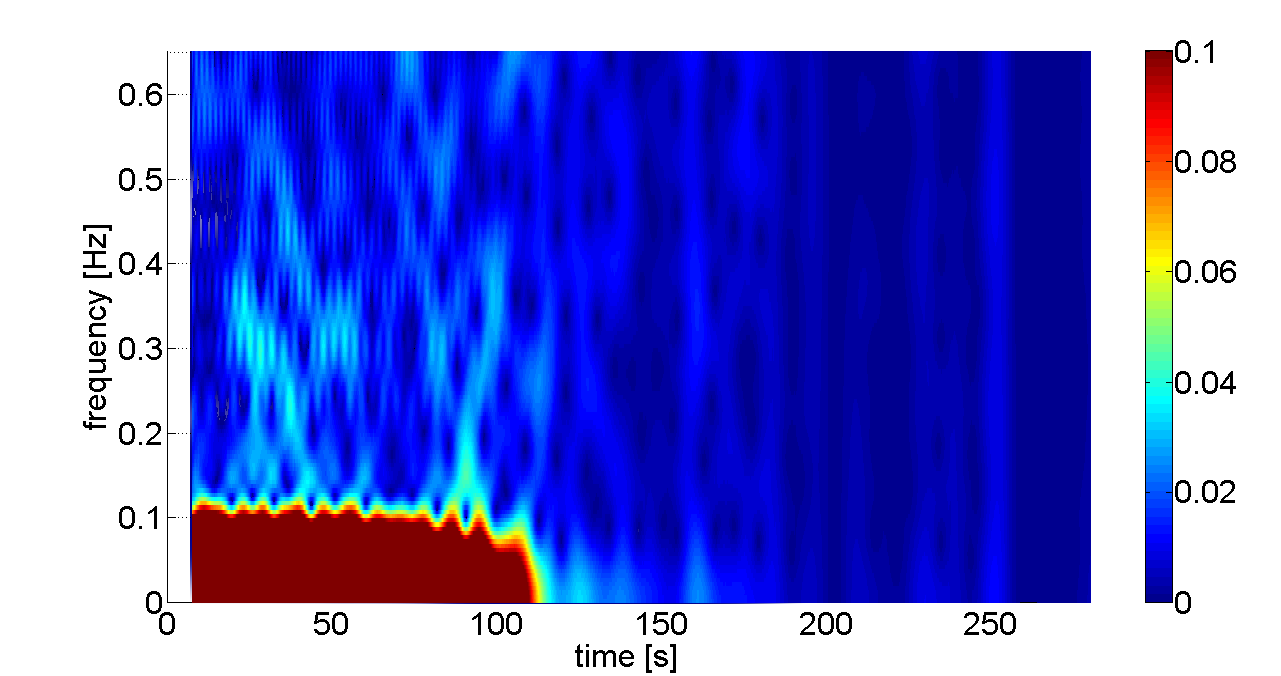 b)
b)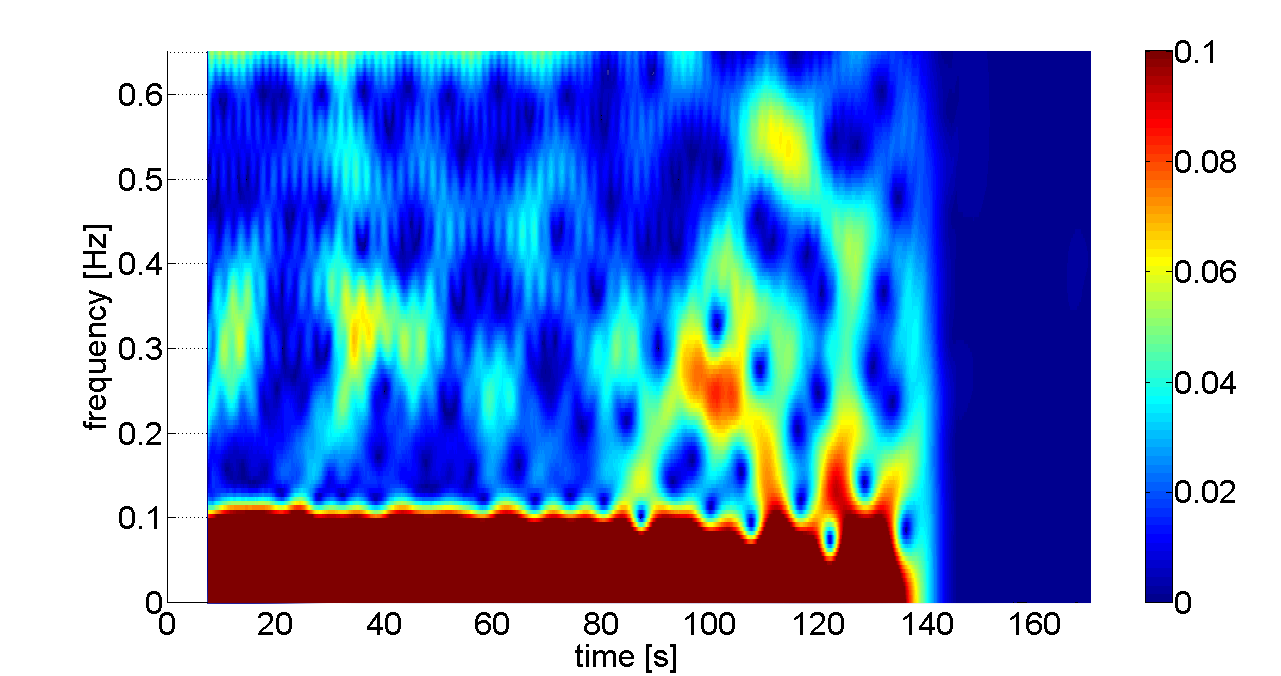
c)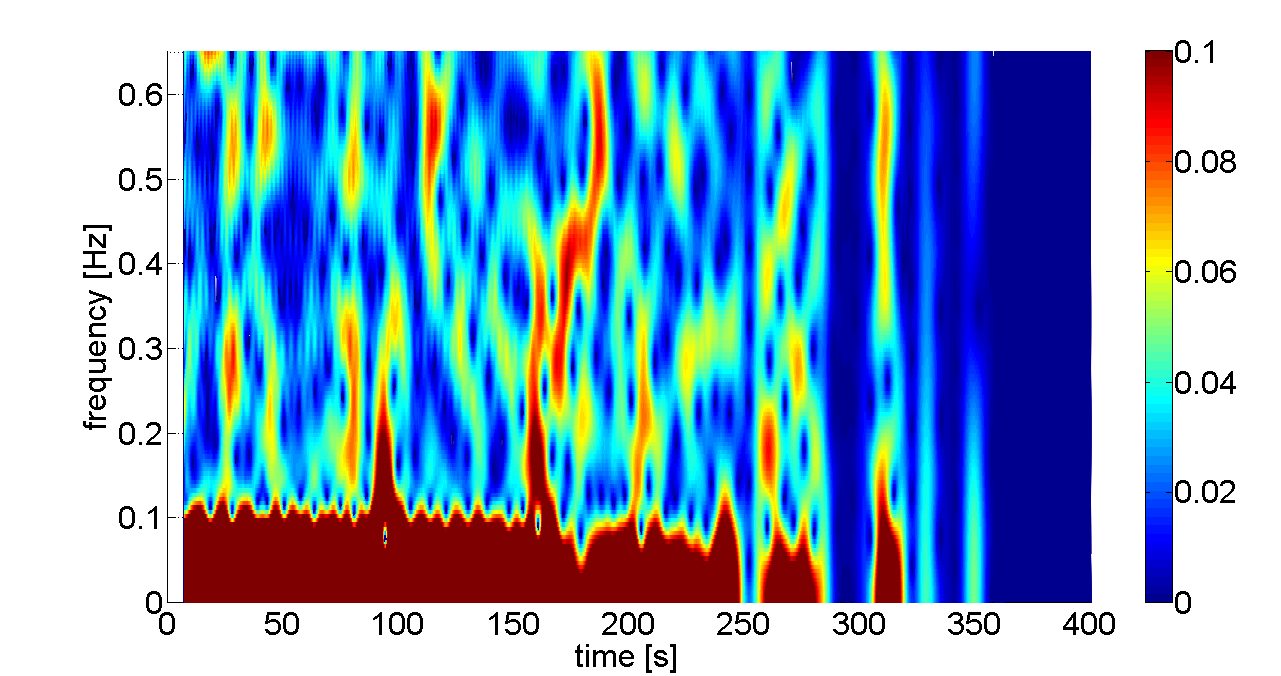 d)
d)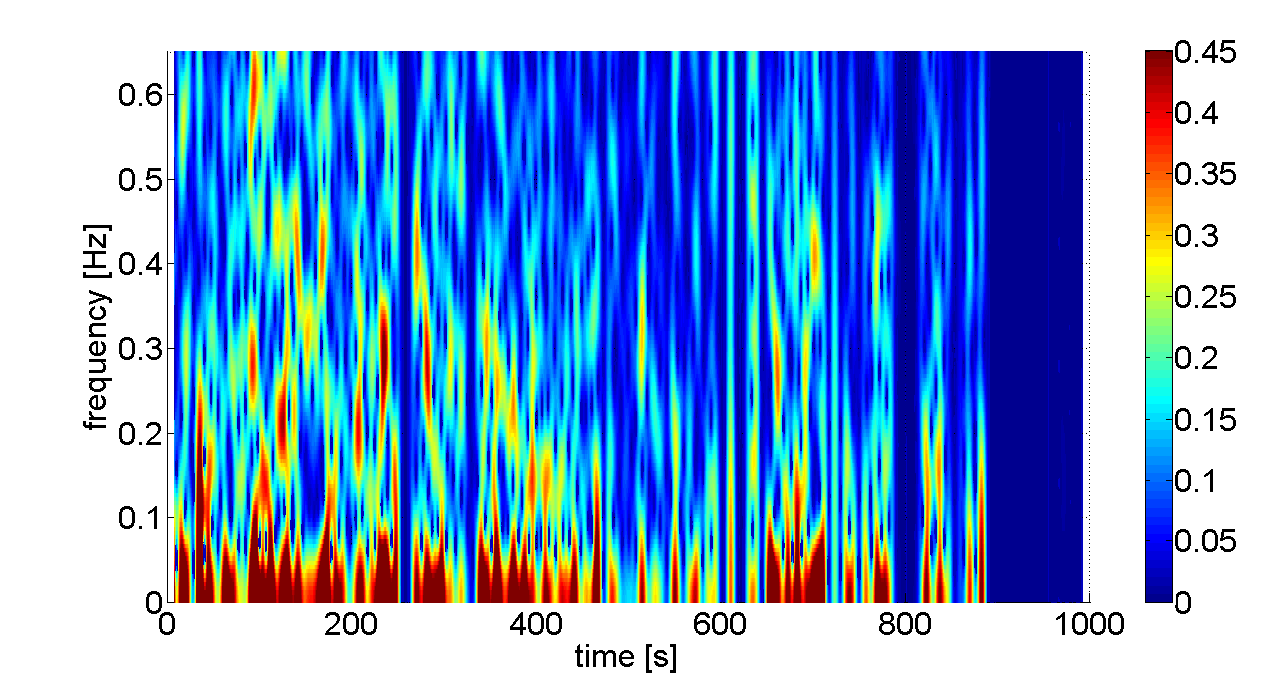
In clear contrast, the passage of soft, low-friction grains through the outlet is fluctuating substantially. At orifice sizes between and , these fluctuations set in only when the container is nearly empty and pressure is low. At orifice sizes below , they are permanently present in our setup. This is seen in the space-time plots of Figure 7c,d. While there are phases when the grains leave the opening at a rate comparable to the hard grains, there are clearly distinguished phases where the orifice is blocked temporarily. These phases where the outflow is clogged completely are distributed in lengths, they can persist for several seconds as seen in Figs. 5c and 7c,d, and they dissolve spontaneously. The mechanism is discussed below.
Most of these transient clogs are formed by arches of 4 particles, whose configurations are not static in time. From time to time, the 10 mm orifice is blocked by a pair of particles that has already partially passed the bottleneck (Fig. 7c,d). In the space-time plots of cross-sections taken mm below the narrowest part of the orifice, such particles exhibit a bell-shaped signature. (blue and red particles after about 2.5 seconds in (c), red and blue particles after about 3 s in (d)). Their signature in the plots evidences that they are continuously squeezed into the gap, and then suddenly drop down, releasing a new avalanche. The nature of this discontinuous flow makes it difficult to define avalanche sizes for the soft, low-friction grains at narrow orifice sizes, since there is no clear definition of what can be considered a clog. A similar problem was discussed by Hidalgo Hidalgo et al. (2018) and Souzy Souzy et al. (2020) in the context of colloidal systems.
It is important to emphasize that with respect to the internal state of the granular ensemble, the non-permanent congestions that we observe are not static. Each of the discharge scenarios shown, e. g., in Figs. 4c, 7c,d, has to be considered one single avalanche until the permanent clog has formed. This is explained in detail in the following Section III.4.
The fluctuations in the outflow rate can be characterized quantitatively by windowed Fourier Transforms of the discharge rates that were extracted from the balance data. We restrict this analysis to the low-frequency range below 0.6 Hz. Thereby, the artifacts from the balance readout at 2/3 Hz are outside the observed frequency range. We focus on the fluctuations on time scales of several seconds. Figure 8 shows four different typical frequency spectra. All spectra are normalized with the respective maximum Fourier amplitude at zero frequency and clipped the low-frequency part of the spectrum for better visibility at . In none of the spectra, we observed a persistent frequency. At 18 mm orifice size (not shown), fluctuations are hardly seen in the spectrum. At 15 mm (Fig. 8a), one can observe slight fluctuations with amplitudes of about 4% of . This trend increases significantly for . At 12 mm orifice width (Fig. 8b), the fluctuations considerably intensify towards the end of the discharge. Fig. 8c shows that at 11 mm orifice width, the fluctuations reach already 10 %, even at the beginning of the discharge. In Fig. 8d, for the smallest orifice size of 10 mm (), fluctuations reach more than 40 %, and some interruptions extend over the full width of the Fourier Transform time window, i.e. some congestions last longer than 15 s.
III.4 Non-permanent congestions
We will now analyze in more detail what causes the interruptions and restart of the outflow through small orifices (), seen for example in Figs. 5c, 7c,d and 8c,d and in the supplemental video SI . The phenomenon of spontaneous non-permanent clogging has been described earlier for active matter like pedestrians and animals and for thermal systems like colloids Hidalgo et al. (2018). Zuriguel et al. Zuriguel (2014) have coined the term ’clogging transition’ for such scenarios. A characteristic figure of merit of such transitions is the distribution of durations of clogged states, which was found to follow a power law for sufficiently long clogs. On the other hand, a problem is the clear distinction between delays between passages of individual particles and short clogs. The definition of a clogged state in these systems can influence the avalanche statistics substantially Hidalgo et al. (2018). The difference to the present soft granular system is the existence of thermal noise or activity of the involved entities in those systems which can destroy an existing clog.
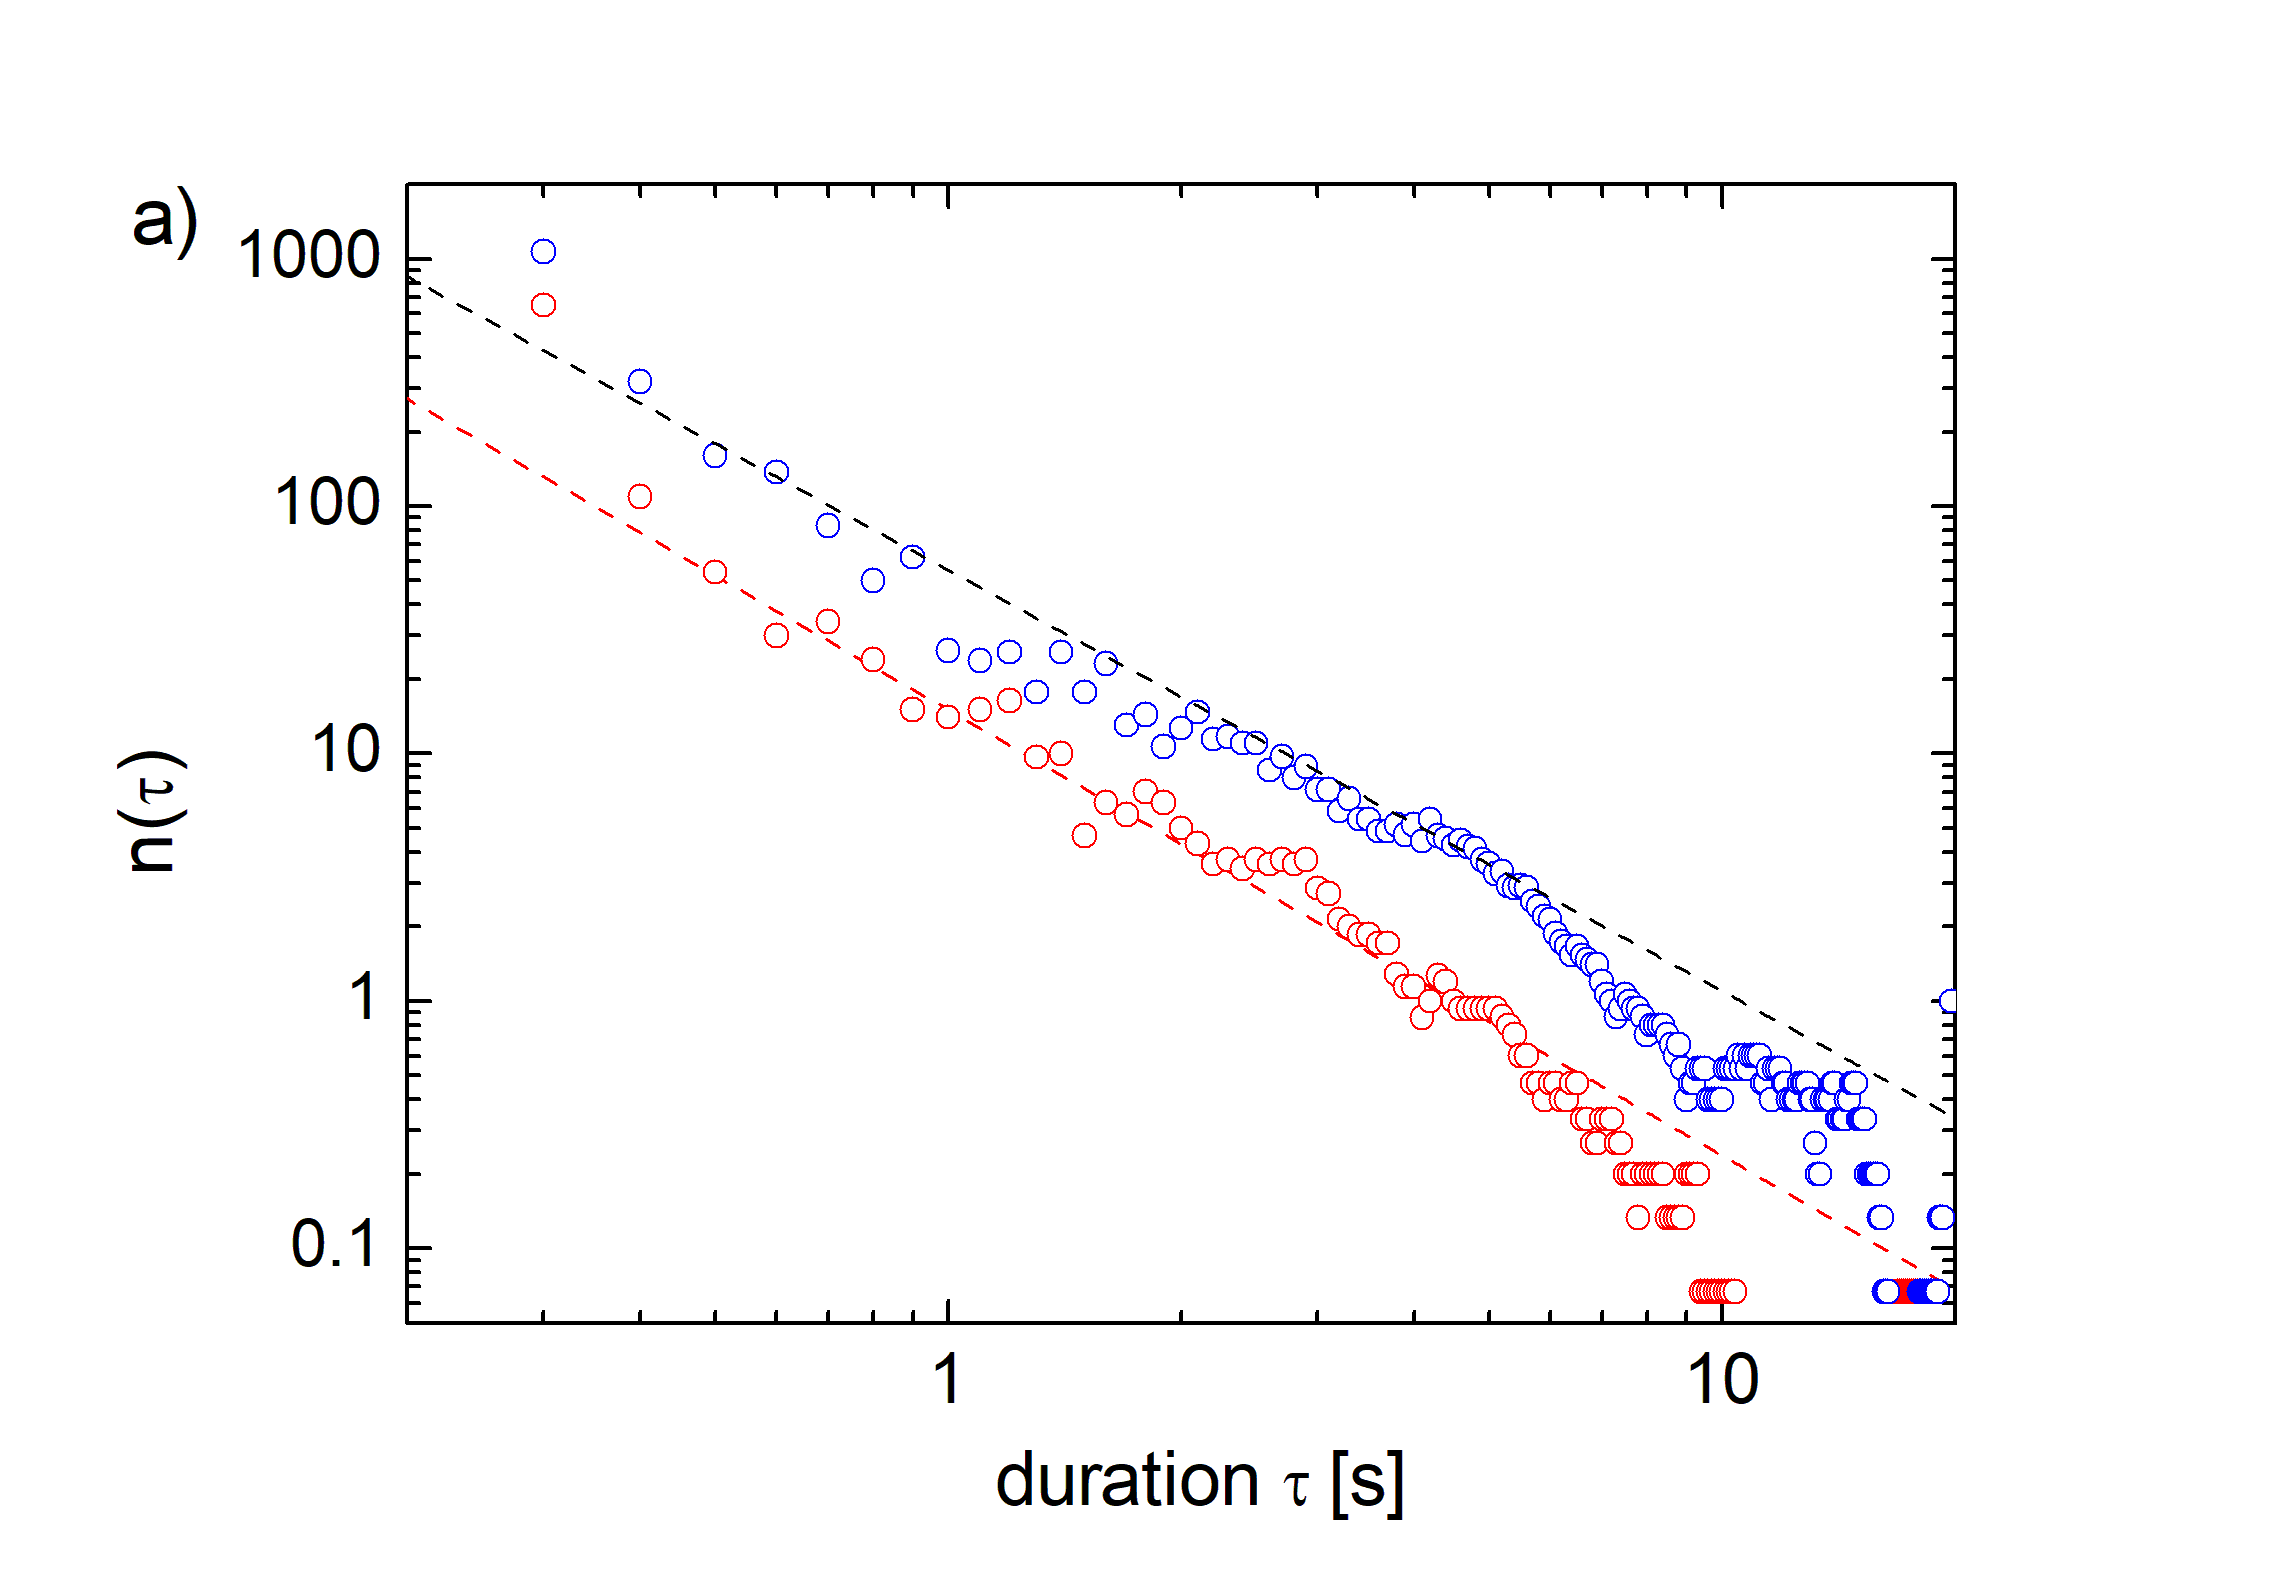
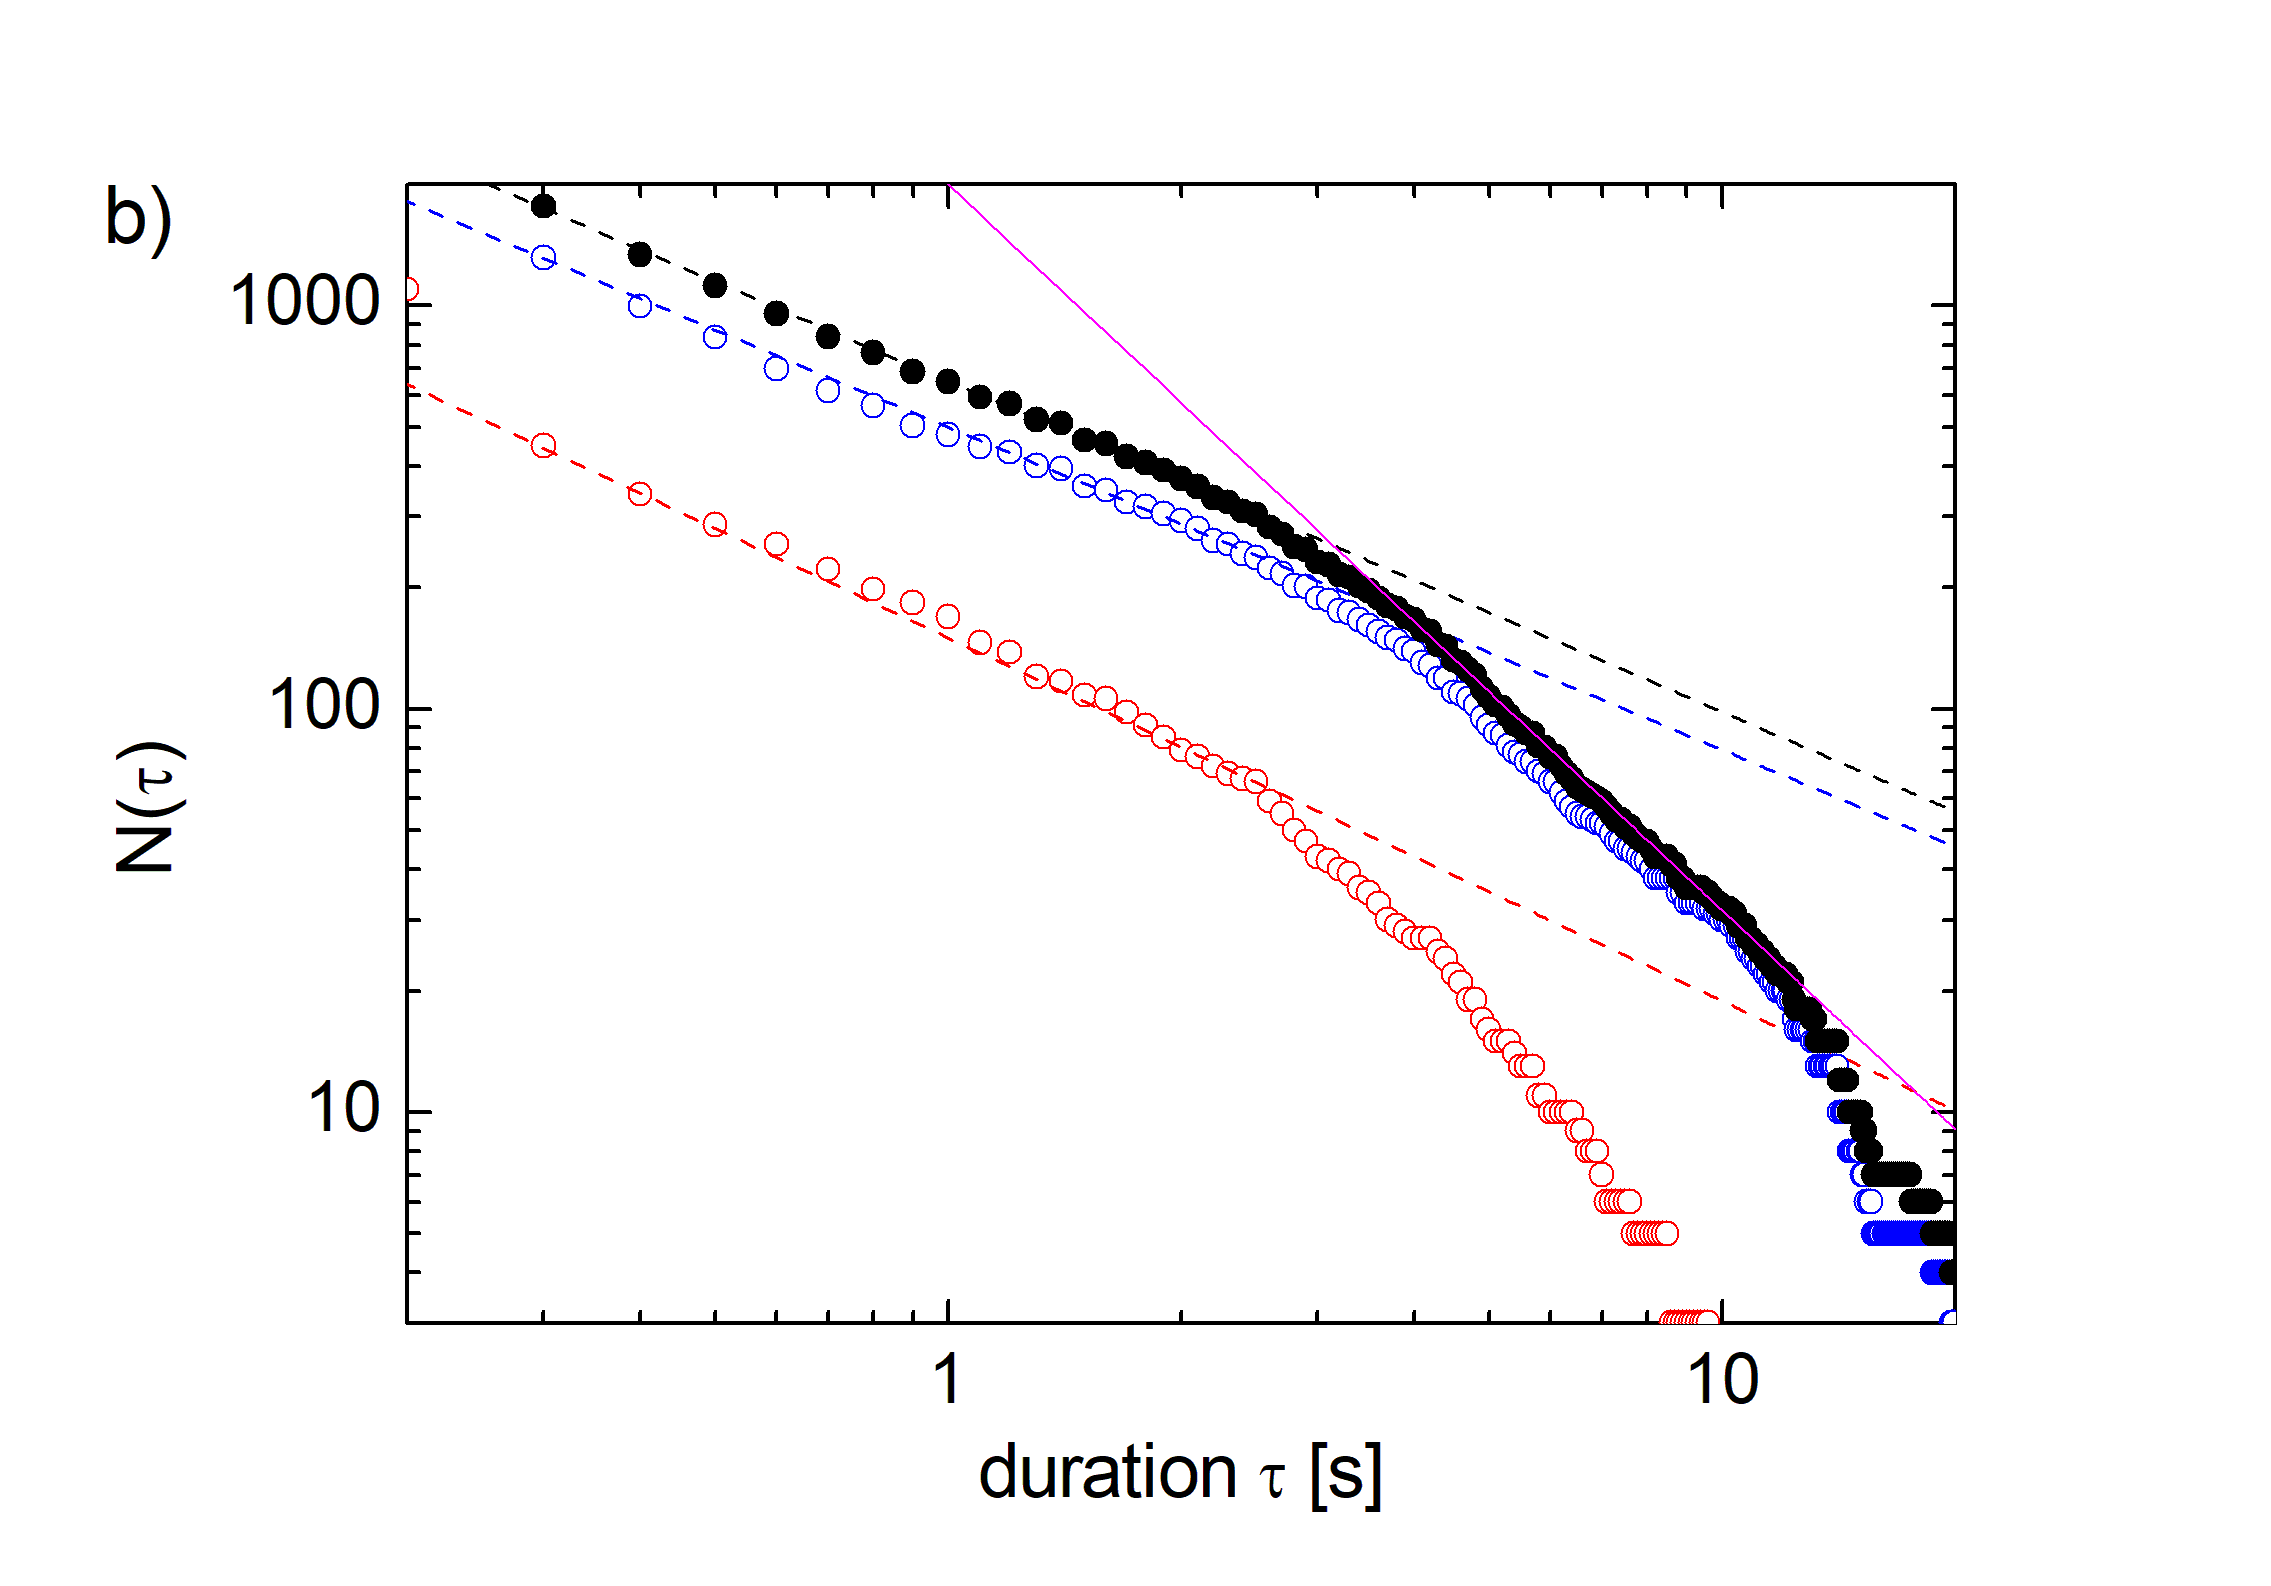
Figure 9a presents the distribution of ’clog lengths’ for the 10 mm orifice HGS-filled silo. We have evaluated the plateaus of the mass curves, i. e. the time intervals in which the balance readout was constant. The number of short stopped phases (up to about 3 seconds) follows approximately a power law with exponent . The graphs give no indication as to when the system can clearly be declared clogged. We argue that in the athermal, passive granular system studied here, the non-permanent states of stopped outflow are never static in the complete container. Therefore, we prefer to avoid the established technical term clog for them, and suggest the alternative denomination ’congestion’ to describe the phases of stopped outflow that dissolve spontaneously in this system. They represent mere fluctuations of the discharge, but no equilibrium states in the container. The durations of the congestions show the tendency to increase with smaller fill level, i. e. with decreasing pressure at the bottom of the silo, yet the exponents are practically identical. Figure 9a separately shows data collected during the outflow of the first 400 g of granular material, and during the remaining discharge until a permanently clogged state is reached. Within the experimental uncertainty, both curves can be described with the same . Actually, the exponent is reliable only for the first couple of seconds. Congestions much longer than 10 s are clearly underrepresented. This is supported in particular by the cumulative distributions of intervals longer than (see Fig. 9b). The exponent of the power law describing the first 3 seconds is constistent with . An exponent (i. e. ) means that if the distributions would follow these power laws for all , the mean congestion length would diverge. For clogs longer that 10 seconds, however, the exponent (solid line in Fig. 9b) is well below -1 and in principle, a finite mean congestion duration exists. These quantitative scaling parameters are very preliminary, the accurate analysis of the long-term behaviour of congestions requires much more data, particularly measurements at approximately constant fill heights.
From an external viewpoint, the observed congestions are practically indistinguishable from clogs in active and living matter. Internally, they have a completely different origin:
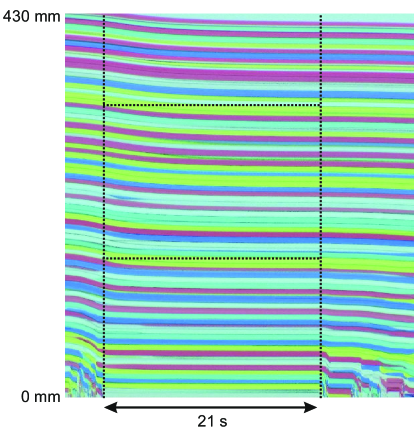
After we have identified and quantitatively characterized the features of intermittent outflow of the elastic grains from the silo, we will now discuss their physical origin: The reason for this behavior is that the material never reached an equilibrium configuration inside the silo before the blocking arch is destroyed. Even when the particles near the orifice locally form a stable blocking arch, there is still reorganization of the structures in the granular bed above. These redistributions of particles and of the force network can occur anywhere in the container, and they can finally reach and affect the blocking arch and relieve the congested state. This is exemplarily shown in the picture of an HGS-filled silo with 10 mm opening width in Fig. 10. The space-time plot shows a cut along the vertical central axis of the silo, right above the orifice. Within the 35 s time window shown, the discharge stops after 3.5 s. The position of the grains at the bottom remain practically fixed. For the following 21 s, the outflow rate is zero. Then, the discharge sets in again. The vertical cross-sections show that the upper particles still move downward while the blocking particles and the surroundings of the orifice remain static.
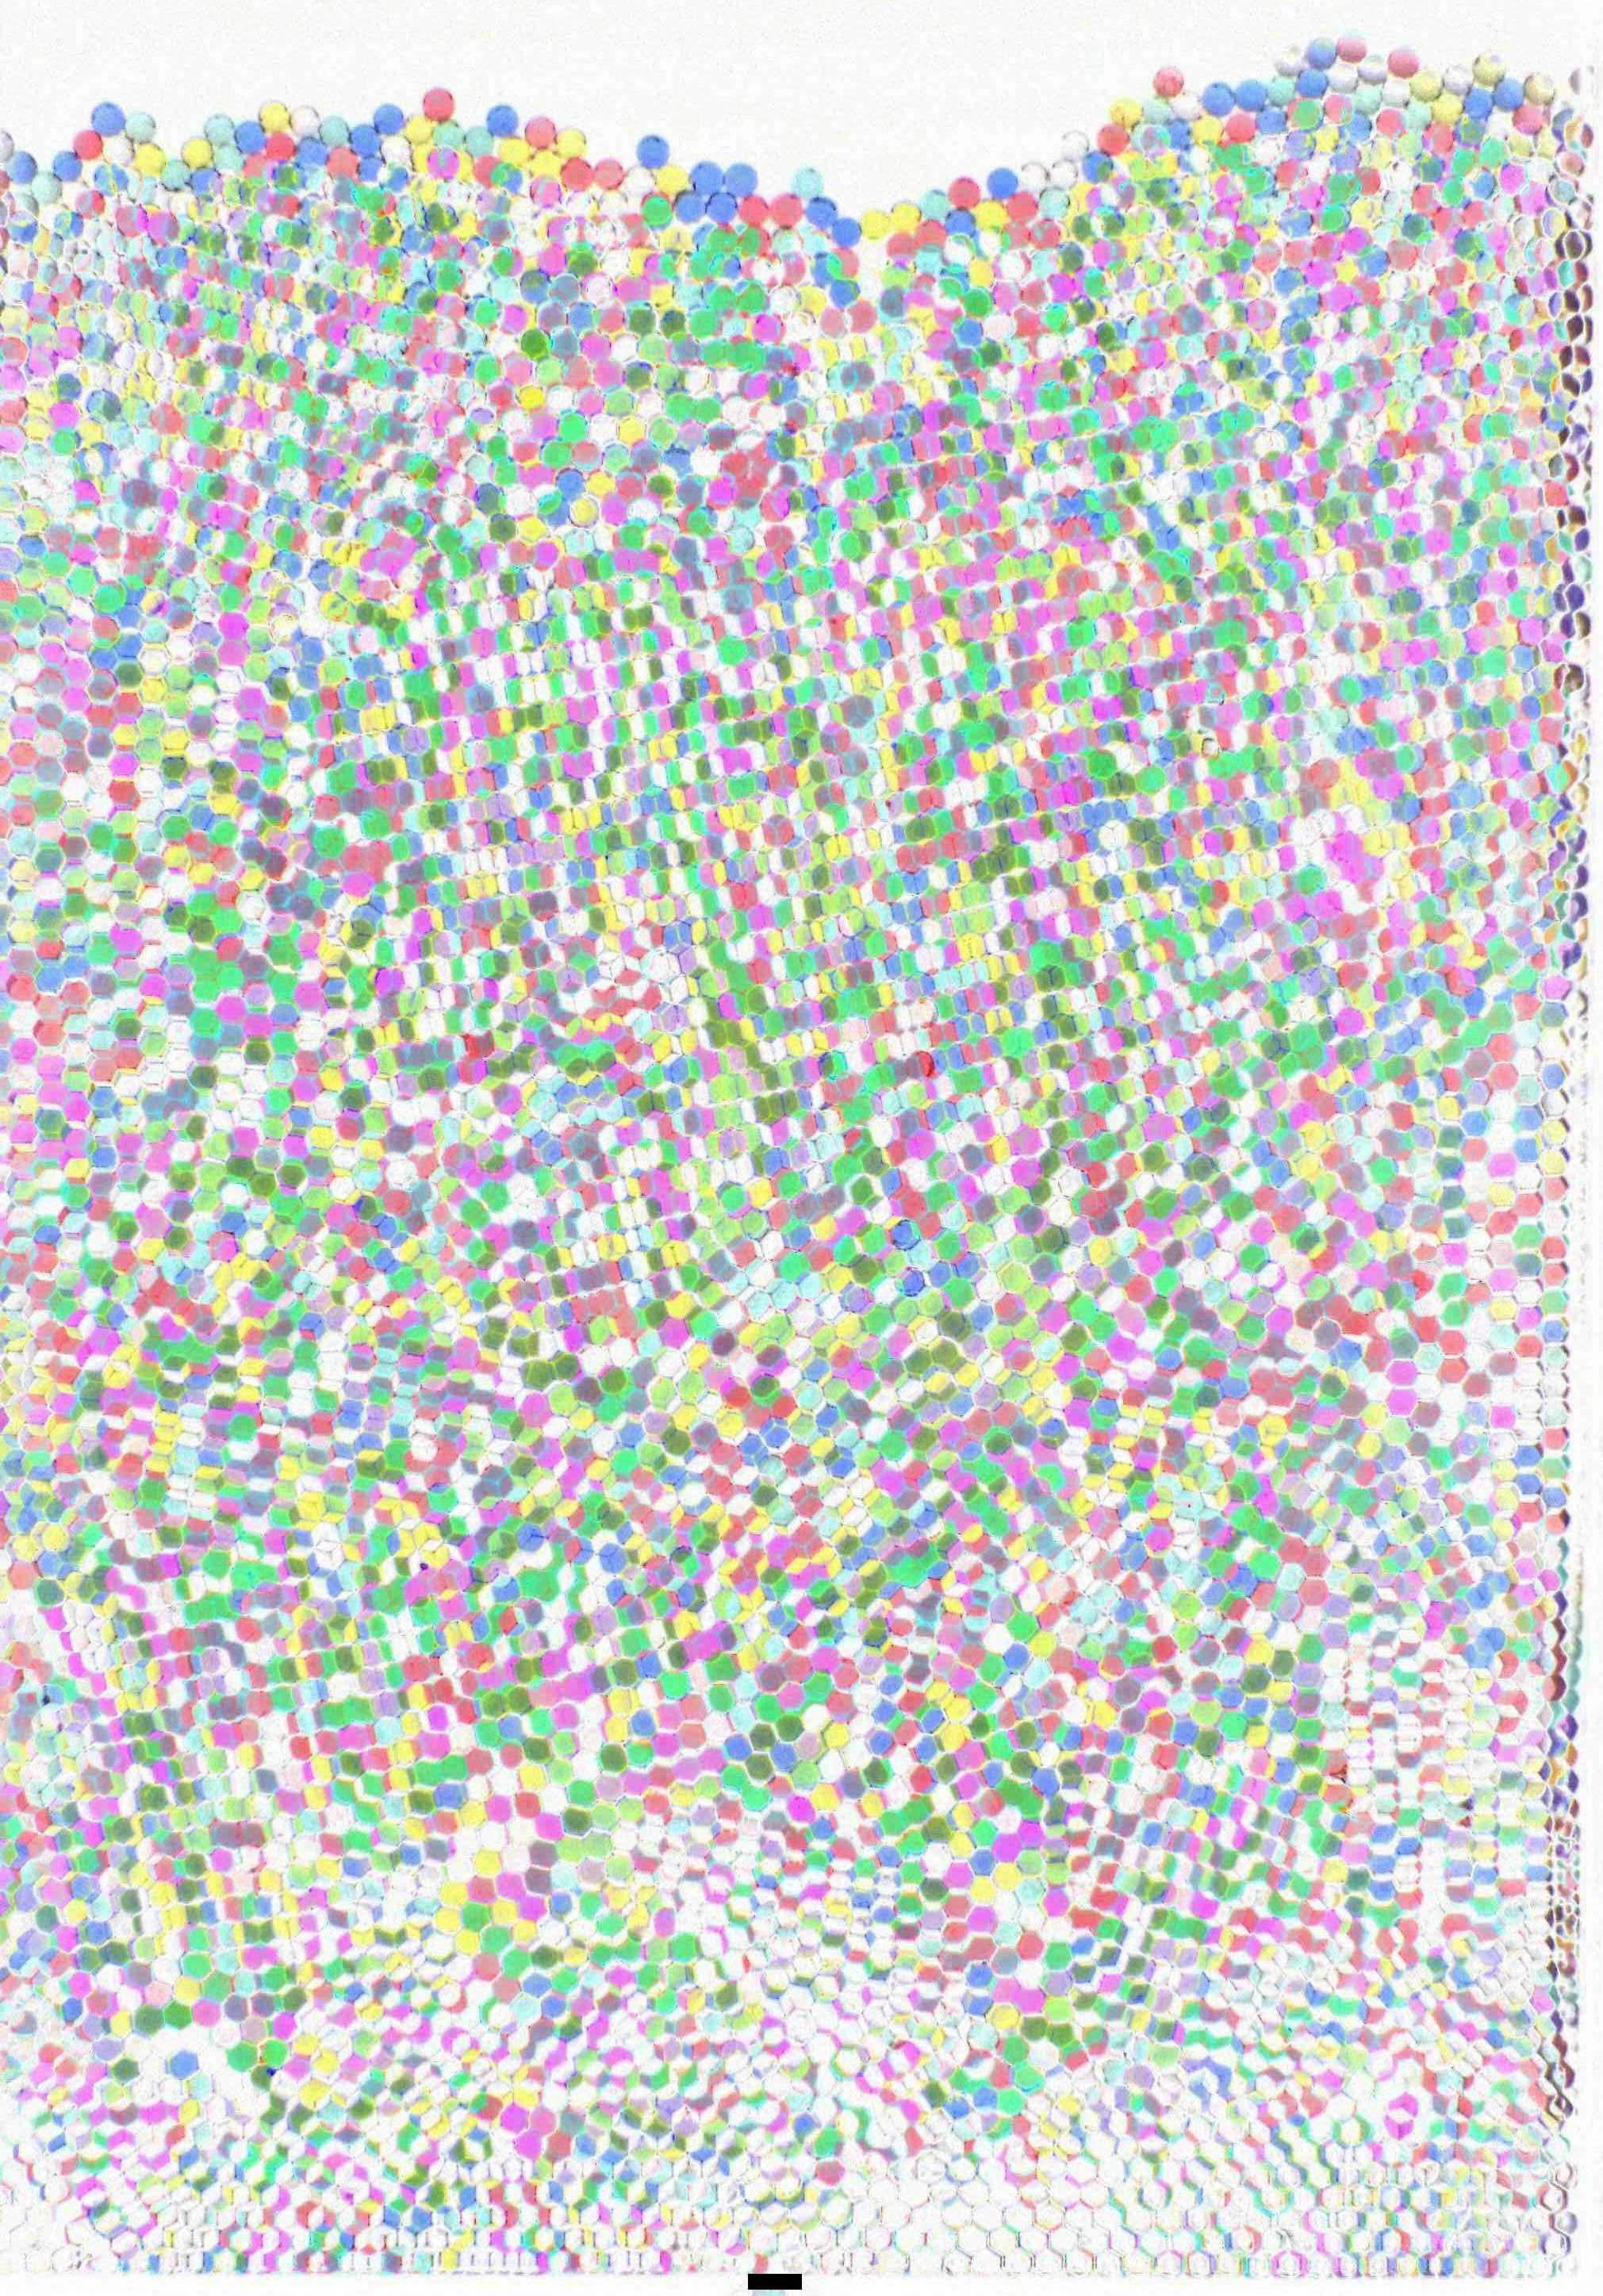
The corresponding 2D redistributions in the complete silo are shown in Fig. 11: We have computed the difference between an image recorded immediately after the outflow stopped and an image recorded shortly before the discharge continued, 21 s later. White regions in the image are unchanged, while colors indicate where a sphere has been replaced by one of a different color. Near the orifice, the grains have shifted only slightly. However, one recognizes considerable reorganization and compaction in the upper parts. The essential point is that the majority of these rearrangements proceed very slowly compared to the time scale of silo discharge (of individual grains). This is related to viscoelasticity of the HGS. These processes set the time frame for the dissolution of blocking arches in the soft grain system. A reasonable estimate of the time scales of such rearrangements can be extracted already from Fig. 3b. Not only do the HGS slowly build up pressure near the congested outlet, they can also perform quick local reconfigurations. Unless all these internal motions have ceased, there is the chance that the force equilibrium of the blocking structure gets broken and the avalanche continues.
Permanent clogs occur only after all transient rearrangements in the container have ceased while the blocking structure is still there. Then, the clogs are permanent and can only be destroyed by external forcing. This is regularly observed in silos with small apertures below a certain fill-height Ashour et al. (2017). These observations are not specific to the quasi-2D geometry of our setup, they are expected to be similar in 3D containers, where the observation of internal flow requires specific tomographic techniques Stannarius et al. (2019).
IV Discussion and summary
We have analyzed the outflow of soft, low-friction hydrogel spheres from a 2D silo with small aperture experimentally, in particular its fluctuations and intermittent character at small orifice sizes. Furthermore, the internal reorganization processes and packing densities were monitored. We have discussed the stability of blocking structures and the life times of congestions that are specific for the type of materials investigated here.
Fluctuations of flow rates have been described earlier for hard grains: Unac et al. Unac et al. (2012) reported oscillations with a narrow frequency spectrum. Such instabilities are not present in our material. One reason may be that the HGS mass flow rate is considerably lower, and the grains are much rounder and have a viscoelastic character, so that oscillatory density waves are rapidly dampened. Rather, we find fluctuations in a broad frequency range that are related to the slow propagation of density and velocity fluctuations through the soft granular bed. Far regions react to local flow variations with a considerable retardation (Fig. 3b), so that density inhomogeneities or flow divergences are not compensated rapidly. This causes strong fluctuations in positions and force networks, particularly when the orifice is narrow, less than two particles wide. Then, the system can build up considerable pressure near the orifice when the flow ceases, on a time scale of seconds. This pressure is relieved when the flow continues, causing the system to expand again.
One consequence is that the stresses that build up after the outlet is blocked and the related rearrangements of grains can spontaneously restart the outflow from the container after some delay. This is a qualitatively new observation for passive granular materials that are not agitated by external forcing. Intermittent clogs that look very similar in terms of the outflow rates are found with hard particles in vibrated containers Mankoc et al. (2009); Zuriguel et al. (2017); Guerrero et al. (2018, 2019), in silos with oscillating bottom To and Tai (2017), or in flocks of animals passing a gate Zuriguel et al. (2014). In these systems, however, momentarily existing clogs can be broken by external forces like vibrations, or by the activity of bacteria, animals or pedestrians. Similar intermittent clogging was recently reported in suspensions of non-Brownian microparticles Souzy et al. (2020). The authors suspect that these clogs are dissolved by flow through interstices of the blocking particles.
In our passive soft sphere system, there are no such external forces. However, the system is never in an equilibrium unless a stable overall configuration is reached. As a consequence, the problem of the definition of avalanche sizes can be solved straightforwardly: avalanches are separated only by stable clogs that must be destroyed by external forcing. Plateaus in the discharged mass curve do not separate avalanches. Nevertheless, for practical purposes it may be useful to define a certain empirical delay as a minimum clog duration to distinguish avalanche events from clogs. One can then calculate mean avalanche durations and other useful statistical features. As stated above, one has to be aware then, that this statistics will depend on the arbitrary ad hoc definition of Hidalgo et al. (2018).
In a theoretical study, Manna and Herrmann Manna and Herrmann (2000) predicted that internal avalanches in a 2D hopper filled with frictionless hard disks lead to self-organized criticality and intermittent clogging. In experiments, it seems that such processes are hard to observe because the systems quickly reach an overall equilibrium or the flow continues. The time scales of internal rearrangements of the material are comparable to those of the passage of individual particles through the orifice. In contrast, in the hydrogel system, there is a clear separation of these time scales. Particles pass the orifice in a few hundredths of a second, but the internal redistributions of grains require seconds. In principle, ideas similar to those simulated in Ref. Manna and Herrmann (2000), cascades of internal avalanches in combination with the elastic deformations of the grains near the outlet may explain the intermittent outflow characteristics of soft, low-friction grains through narrow orifices. It suggests itself that the mean time interval observed for grain rearrangements (cf. Fig. 3) is closely related to the seconds range of the power law in Figs. 9a,b.
If one considers mean flow rates, then there is a clear discrepancy for small () apertures between the behavior of the soft material studied here and Beverloo’s Beverloo et al. (1961) classical equation. This arises from the fact that Beverloo’s model does not account for the clogged or congested states. Yet, even for larger orifices, the fill-level dependence of the outflow is not explained within Beverloo’s model and requires a more detailed analysis of how deformable grains pass narrow bottlenecks.
Conflicts of interest
The authors declare no conflict of interest.
Acknowledgments
This project has received funding from the European Union’s Horizon 2020 research and innovation programme under the Marie Skłodowska-Curie grant agreement CALIPER No 812638. Torsten Trittel is cordially acknowledged for important contributions to the construction of the setup. K.H. acknowledges funding by DFG within project HA8467/2-1. The content of this paper reflects only the authors’ view and the Union is not liable for any use that may be made of the information contained therein.
References
- Huber-Burnand [1829] P. Huber-Burnand, Polytechnisches Journal, 1829, 34, 270.
- Hagen [1852] G. Hagen, Verhandl. der Kgl. Preuß. Akad. der Wiss. Berlin, 1852, 35–42.
- Janssen [1895] H. A. Janssen, Zeitschr. d. Vereines dt. Ing., 1895, 39, 1045.
- Sperl [2006] M. Sperl, Granular Matter, 2006, 8, 59–65.
- Franklin and Johanson [1955] F. C. Franklin and L. N. Johanson, Chem. Eng. Sci., 1955, 4, 119–129.
- Beverloo et al. [1961] W. A. Beverloo, H. A. Leniger and J. J. Van de Velde, Chem. Eng. Sci., 1961, 15, 260.
- Neddermann et al. [1982] R. M. Neddermann, U.Tuzun, S. B. Savage and G. T. Houlsby, Chem. Eng. Sci., 1982, 37, 1597–1609.
- Mankoc et al. [2007] C. Mankoc, A. Janda, R. Arévalo, J. M. Pastor, I. Zuriguel, A. Garcimartín and M. D., Granular Matter, 2007, 9, 407–414.
- Anand et al. [2008] A. Anand, J. S. Curtis, C. R. Wassgren, B. C. Hancock and W. R. Ketterhagen, Chem. Eng. Sci., 2008, 63, 5821.
- To et al. [2001] K. To, P. Lai and H. K. Pak, Phys. Rev. Lett., 2001, 86, 71.
- Hunt et al. [1999] M. L. Hunt, R. C. Weathers, A. T. Lee, C. E. Brennen and C. R. Wassgren, Phys. Fluids, 1999, 11, 1.
- Wassgren et al. [2002] C. R. Wassgren, M. L. Hunt, P. J. Freese, J. Palamara and C. E. Brennen, Phys. Fluids, 2002, 14, 10.
- Mankoc et al. [2009] C. Mankoc, A. Garcimartín, I. Zuriguel and D. Maza, Phys. Rev. E, 2009, 80, 011309.
- Janda et al. [2009] A. Janda, R. Harich, I. Zuriguel, D. Maza, P. Cixous and A. Garcimartin, Phys. Rev. E, 2009, 79, 031302.
- Lozano et al. [2012] C. Lozano, G. Lumay, I. Zuriguel, R. C. Hidalgo and A.Garcimartín, Phys. Rev. Lett., 2012, 109, 068001.
- Zuriguel et al. [2017] I. Zuriguel, A. Janda, R. Arévalo, D. Maza and A. Garcimartín, EPJ Web of Conferences, 2017, 140, 01002.
- Guerrero et al. [2018] B. V. Guerrero, C. Lozano, I. Zuriguel and A. Garcimartín, Phys. Rev. E, 2018, 97, 042904.
- Guerrero et al. [2019] B. V. Guerrero, B. Chakraborty, I. Zuriguel and A. Garcimartín, Phys. Rev. E, 2019, 100, 032901.
- Zuriguel et al. [2005] I. Zuriguel, A. Garcimartín, D. Maza, L. A. Pugnaloni and J. M. Pastor, Phys. Rev. E, 2005, 71, 051303.
- Takahashi et al. [1968] H. Takahashi, A. Suzuki and T. Tanaka, Powder Technol., 1968, 2, 65.
- Suzuki et al. [1968] A. Suzuki, H. Takahashi and T. Tanaka, Powder Technol., 1968, 2, 72.
- Lindemann and Dimon [2000] K. Lindemann and P. Dimon, Phys. Rev. E, 2000, 62, 5420.
- Chen et al. [2006] K. Chen, M. B. Stone, R. Barry, M. Lohr, W. McConville, K. Klein, B. L. Sheu, A. J. Morss, T. Scheidemantel and P. Schiffer, Phys. Rev. E, 2006, 74, 011306.
- Kumar et al. [2020] R. Kumar, A. K. Jana, S. R. Gopireddy and C. M. Patel, Sdhan, 2020, 45, 67.
- Thomas and Durian [2015] C. C. Thomas and D. J. Durian, Phys. Rev. Lett., 2015, 114, 178001.
- Börzsönyi et al. [2016] T. Börzsönyi, E. Somfai, B. Szabó, S. Wegner, P. Mier, G. Rose and R. Stannarius, New J. Phys., 2016, 18, 093017.
- Ashour et al. [2017] A. Ashour, S. Wegner, T. Trittel, T. Börzsönyi and R. Stannarius, Soft Matter, 2017, 13, 402.
- Szabó et al. [2018] B. Szabó, Z. Kovács, S. Wegner, A. Ashour, D. Fischer, R. Stannarius and T. Börzsönyi, Phys. Rev. E, 2018, 97, 062904.
- Török et al. [2017] J. Török, S. Lévay, B. Szabó, E. Somfai, S. Wegner, R. Stannarius and T. Börzsönyi, EPJ Web of Conferences, 2017, 140, 03076.
- Lattanzi and Stickel [2019] A. M. Lattanzi and J. J. Stickel, AICHE Journal, 2019, 66, e16882.
- Tang and Behringer [2011] J. Tang and R. Behringer, Chaos, 2011, 21, 041107.
- Zuriguel et al. [2014] I. Zuriguel, D. R. Parisi, R. C. Hidalgo, C. Lozano, A. Janda, P. A. Gago, J. P. Peralta, L. M. Ferrer, L. A. Pugnaloni, E. Clément, D. Maza, I. Pagonabarraga and A. Garcimartín, Scientific Reports, 2014, 4, 7324.
- Rubio-Largo et al. [2015] S. M. Rubio-Largo, A. Janda, D. Maza, I. Zuriguel and R. C. Hidalgo, Phys. Rev. Lett., 2015, 114, 238002.
- Hidalgo et al. [2013] R. C. Hidalgo, C. Lozano, I. Zuriguel and A. Garcimartín, Granular Matter, 2013, 15, 841–848.
- Vivanco et al. [2012] F. Vivanco, S. Rica and F. Melo, Granular Matter, 2012, 14, 563–576.
- Drescher et al. [1995] A. Drescher, A. J. Waters and C. A. Rhoades, Powder Technol., 1995, 84, 165.
- Drescher et al. [1995] A. Drescher, A. J. Waters and C. A. Rhoades, Powder Technol., 1995, 84, 177.
- Manna and Herrmann [2000] S. S. Manna and H. J. Herrmann, Eur. Phys. J. E, 2000, 1, 341–344.
- Pugnaloni et al. [2001] L. A. Pugnaloni, G. C. Barker and A. Mehta, Adv. Complex Syst., 2001, 4, 289.
- To and Lai [2002] K. To and P.-Y. Lai, Phys. Rev. E, 2002, 66, 011308.
- Zuriguel et al. [2003] I. Zuriguel, L. A. Pugnaloni, A. Garcimartín and D. Maza, Phys. Rev. E, 2003, 68, 030301.
- Pugnaloni and Barker [2004] L. A. Pugnaloni and G. C. Barker, Physica A, 2004, 337, 428.
- Garcimartín et al. [2013] A. Garcimartín, C. Lozano, G. Lumay and I. Zuriguel, AIP Conference Proceedings, 2013, 1542, 686.
- Marin et al. [2018] A. Marin, H. Lhuissier, M. Rossi and C. J. Kähler, Phys. Rev. E, 2018, 97, 021102(R).
- Souzy et al. [2020] M. Souzy, I. Zuriguel and A. Marin, arxiv.org: 2004.04413, 2020.
- Hong et al. [2017] X. Hong, M. Kohne, M. Morrell, H. Wang and E. R. Weeks, Phys. Rev. E, 2017, 96, 062605.
- Ashour et al. [2017] A. Ashour, T. Trittel, T. Börzsönyi and R. Stannarius, Phys. Rev. Fluids, 2017, 2, 123302.
- Stannarius et al. [2019] R. Stannarius, D. S. Martinez, T. Finger, E. Somfai and T. Börzsönyi, Granular Matter, 2019, 21, 56.
- Stannarius et al. [2019] R. Stannarius, D. S. Martinez, T. Börzsöny, M. Bieberle, F. Barthel and U. Hampel, New J. Phys., 2019, 21, 113054.
- Bertho et al. [2006] Y. Bertho, C. Becco and N. Vandewalle, Phys. Rev. E, 2006, 73, 056309.
- Hong et al. [2017] X. Hong, M. Kohne and E. R. Weeks, arXiv: 1512.02500v2, 2017.
- Zuriguel [2014] I. Zuriguel, Papers in Physics, 2014, 6, 060014.
- Helbing and Molnar [1995] D. Helbing and P. Molnar, Phys. Rev. E, 1995, 51, 4282–4286.
- Helbing et al. [2000] D. Helbing, I. J. Farkas and T. Vicsek, Nature, 2000, 407, 487–490.
- Helbing et al. [2005] D. Helbing, L. Buzna, A. Johansson and T. Werner, Transportation Science, 2005, 39, 1–24.
- [56] A video with a 60 s sequence from the discharge of HGS from a 2D silo with 10 mm orifice width is provided as supplemental material.
- Hidalgo et al. [2018] R. C. Hidalgo, A. Goi-Arana, A. Hernández-Puerta and I. Pagonabarraga, Phys. Rev. E, 2018, 97, 012611.
- Unac et al. [2012] R. O. Unac, A. M. Vidales, O. A. Benegas and I. Ippolito, Powder Technol., 2012, 225, 214–220.
- To and Tai [2017] K. To and H.-T. Tai, Phys. Rev. E, 2017, 96, 032906.