Tracking Passengers and Baggage Items using
Multi-camera Systems at Security Checkpoints
Abstract
We introduce a novel tracking-by-detection framework to track multiple objects in overhead camera videos for airport checkpoint security scenarios where targets correspond to passengers and their baggage items. Our approach improves object detection by employing a test-time data augmentation procedure that provides multiple geometrically transformed images as inputs to a convolutional neural network. We cluster the multiple detections generated by the network using the mean-shift algorithm. The multiple hypothesis tracking algorithm then keeps track of the temporal identifiers of the targets based on the cluster centroids. Our method also incorporates a trajectory association mechanism to maintain the consistency of the temporal identifiers as passengers travel across camera views. Finally, we also introduce a simple distance-based matching mechanism to associate passengers with their luggage. An evaluation of detection, tracking, and association performances on videos obtained from multiple overhead cameras in a realistic airport checkpoint environment demonstrates the effectiveness of the proposed approach.
Index Terms:
Detection, Tracking, Association, Homography, Tracklet, Multi-camera, Surveillance.I Introduction
Automated video surveillance requires the detection, tracking, and recognition of objects of interest in a scene. Accurate and precise surveillance in crowded scenes is one of the greatest challenges in computer vision applications. To address the difficult problem of visual surveillance in the domain of airport checkpoint security, the Department of Homeland Security (DHS) ALERT (Awareness and Localization of Explosives-Related Threats) center of excellence at Northeastern University initiated the CLASP (Correlating Luggage and Specific Passengers) project. CLASP is a multi-institution initiative that aims to assist the Transportation Security Administration (TSA) in the detection of security incidents such as theft of items or abandoned bags.
Most recent multiple object tracking frameworks adopt tracking-by-detection approaches [1, 2, 3, 4], some of which propose a close integration between the tracker and a convolutional neural network (CNN) detector [3]. However, state-of-the-art detection algorithms [5, 6, 7, 8] are unable to detect multiple objects in realistic overhead camera scenarios due to domain-specific challenges such as perspective distortions and object-to-camera pose variations. In the context of passengers and luggage detection and tracking in airport checkpoints, previous approaches used models based on Gaussian Mixtures [9] and optical flow [10] for detection and separate trackers for passengers and security bins. These methods divide the image area within each camera’s field of view into several regions of interest where certain passenger behaviors are expected (e.g., passengers divest their items near the conveyor belt). Thus, while effective within individual regions of interest, such approaches cannot detect and track passengers and their belongings throughout an entire checkpoint.
To solve these problems, we propose a multistage framework in which we use the Mask-RCNN network (MRCNN) [5] pre-trained on the COCO dataset [11] to detect multiple object classes. The network detects most passengers from an overhead perspective with high probability even without fine-tuning. However, because of perspective variations, the network has difficulty detecting children and other classes of interest such as backpacks and handbags. Fine-tuning pre-trained models to generate dataset-specific detectors would substantially impede the practical application of our framework in actual airport security scenarios. We resort instead to geometric transformations, including translations and rotations, as a preprocessing step to improve detection performance.
We then cluster multiple detections obtained from the geometrically transformed images using the mean-shift method [12, 13] so that each cluster corresponds to the detection of one object of interest observed at each frame. We use the Multiple Hypothesis Tracking [1] algorithm to track passengers and baggage items separately and maintain associations among them to verify that each person leaves the checkpoint with the same bags with which they entered it. We evaluate the detection and tracking performances of our algorithms on videos from a simulated airport checkpoint and demonstrate that our approach substantially outperforms methods based on the YOLO [7], SSD [6], and MRCNN [5] models in such a scenario.
Finally, we propose a multi-camera tracklet association algorithm to maintain the temporal identifiers of passengers across cameras. Our ability to accurately track passengers and bags across the checkpoint allows us to apply simple spatio-temporal rules to keep track of the association between passengers and their baggage items. We use this information to assign ownership of an item at divestiture time and to verify ownership when an item is retrieved.
In summary, the key contributions of this work are:
-
•
A novel data augmentation and clustering mechanism that substantially improves detection performance in overhead camera scenes without resorting to fine-tuning.
-
•
A robust and accurate multiple object tracking algorithm for overhead camera scenarios.
-
•
A new tracklet association algorithm to address the identity hand-off issue during transitions across camera views.
-
•
A distance-based association algorithm to keep track of the ownership of each baggage item across an airport checkpoint.
-
•
Upon acceptance for publication of this paper, we will make the corresponding source code publicly available.
The remainder of this paper is organized as follows. Section II discusses related work in the area of multiple target tracking and target tracking using multiple cameras, as well as detection algorithms commonly used in tracking-by-detection frameworks. Section III describes our proposed detection, tracking, and association algorithms. In Section IV, we present the dataset used to evaluate our methods along with experimental results in terms of detection and tracking metrics. Section V concludes the work and briefly discusses limitations and potential directions for future work.
II Related Work
Multiple target tracking using camera networks is an active research topic with several potential applications [14, 15, 16, 17, 18]. Most works on camera networks, however, focus on the multi-camera aspect of the problem and do not consider the challenges associated with camera perspectives. Although generic object tracking algorithms could be used in these scenarios (e.g. [19, 20, 21, 22, 23]), when object categories are known, trackers based on specialized detectors are preferable since they are more accurate and less prone to model drift problems [24, 4]. This observation has led to the development of a variety of multiple target tracking algorithms that specialize in tracking humans [25, 26, 27, 28, 29, 30]. However, in many scenarios, it is desirable to track additional objects of previously known categories. In these cases, more flexible detection algorithms are needed.
Several object detection methods based on CNNs have been proposed in recent years. The YOLO (You Only Look Once) network [7] predicts bounding boxes and class probabilities in real time by dividing images into grid cells. The single shot multibox detector (SSD) [6] uses a set of default boxes of different scales and aspect ratios to improve prediction accuracy of object shapes. However, as our experiments demonstrate, both YOLO and SSD have difficulties with small objects and hence fail to detect most of the divested items observed by overhead cameras in airport security scenarios.
The region proposal-based MRCNN [5] predicts bounding boxes and class probabilities as well as segmentation masks for each object of interest. MRCNN has recently been augmented with the ResNeXt backbone [31, 32] and a Feature Pyramid Network (FPN) [33] to generate multi-scale object bounding box proposals, outperforming most existing CNN-based detectors [6, 7, 8] in several scenarios, including overhead camera scenes [34]. Although MRCNN can detect persons with relatively high accuracy, for our application, its performance on baggage-related classes is not satisfactory due to the unavailability of sufficiently diverse training datasets.
Test-time data augmentation is an effective mechanism for improving the robustness of CNNs in a wider variety of scenarios than those available in training datasets [35, 36]. However, the performance of such approaches depends on the mechanisms used to combine the response of the network to augmented test samples. In multi-target tracking applications, multiple detections mapped to a common coordinate system can be interpreted as a non-parametric distribution of the probability of occupancy of the area observed by the cameras [37]. In these scenarios, mean-shift clustering [12, 13] makes it possible to map the modes of this distribution to unique target detections.
In addition to accurate object detection, a systematic solution to the data association problem [38] is another important component in multi-target tracking-by-detection methods [39, 40, 41, 42, 43, 44, 45, 46, 47, 48, 49, 1, 50, 51, 52]. The popular Multiple Hypothesis Tracking (MHT) algorithm [1] uses bounding box detections to form global track hypotheses for all the targets at each frame. The algorithm associates track hypotheses across multiple frames using motion and appearance features to determine the most likely trajectory of each target. We use MHT to associate detections generated by MRCNN, which allows us to obtain satisfactory tracking performance in airport checkpoint security applications.
Finally, multi-camera tracking systems require sophisticated target trajectory association mechanisms to maintain the temporal identifiers of targets across camera views [53, 54, 55]. Even within a single camera view, temporary occlusions among targets must be addressed using similar strategies [51, 56]. Most trajectory association approaches attempt to devise trajectory similarity scores based on a combination of dataset-specific appearance and motion features [53, 54, 55, 51, 56]. Learning these features requires the availability of a relatively large number of long, continuous trajectories [57], which are difficult to obtain with typical ceiling-height overhead cameras due to their limited fields of view. Multi-camera methods also need to project trajectories onto a global 3D coordinate frame, which requires camera calibration information. This limits their applicability to practical security scenarios where obtaining such information would introduce additional barriers to adoption. Hence, to address both the within-camera and cross-camera trajectory association problems, we leverage the fact that our system is comprised of overhead cameras with partially overlapping fields of view to employ a simple but effective geometry-based trajectory association method where the centroids of target detections are projected to neighboring cameras using homographies between their image planes.
III Proposed Model
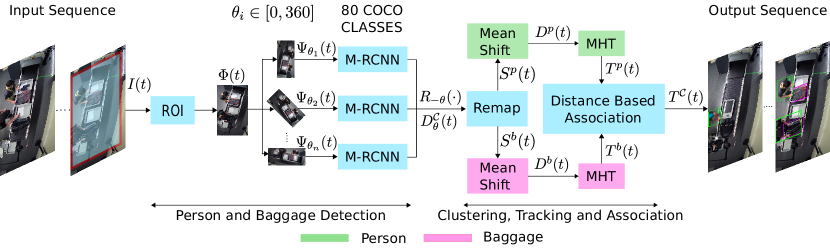
As Fig. 1 indicates, our proposed method comprises two main steps: i) person and baggage detection, and ii) clustering, tracking, and association. We employ the pre-trained MRCNN model [5] with a ResNeXt-101 backbone [31, 32] as a detector. Since the categories of interest are persons and their belongings, we use a model trained on the COCO dataset [11], which includes object classes related to these categories (i.e., person, handbag, backpack, and suitcase). However, although the COCO dataset includes object classes of interest, in the scenario under consideration, the pre-trained model does not perform particularly well in the detection of children and baggage-related classes such as backpacks, handbags, and suitcases. The main reasons for this poor performance are perspective variations and geometric distortions seen in overhead camera scenes as well as insufficient instances of baggage-related objects in the training sets. Therefore, we incorporate test-time geometric data augmentation steps to reduce the effect of overhead camera distortions.
Because of the geometric augmentation step, in most frames, the same target object is detected multiple times. We cluster the person and baggage detections separately using the mean-shift algorithm. After detecting the person and baggage classes, the results are fed into MHT to track objects individually. Additionally, we propose a novel multi-camera target trajectory association algorithm to maintain the unique identification of passengers throughout the checkpoint. Finally, we employ a distance-based algorithm that uses temporal and spatial information to associate passengers with their belongings.
III-A Detection Algorithm
Our detection algorithm, summarized in Alg. 1, uses the MRCNN network to detect objects and classify them as people or baggage items. We retain only outputs corresponding to the classes person, handbag, backpack, and suitcase. The person class corresponds to passengers and detections of handbag, backpack, and suitcase items are treated as baggage items for our purposes. Let be the set of detections on image at time of object class , where (i.e., person or baggage). That is, , where is the detection of the -th object and is the number of objects of class in frame . Each detection consists of the coordinates and dimensions of the target’s bounding box as well as its detection confidence score. That is, since we are interested in tracking passengers and items at the bounding-box level, segmentation masks provided by the network are not taken into consideration. Because the COCO dataset consists mostly of images captured at roughly eye-level, MRCNN performs worse on overhead datasets because bags are viewed from an unfamiliar perspective. To address this limitation, we propose a new test-time data augmentation approach that applies a set of geometric transformations to each video frame.
Our first step is to define a region of interest (ROI) that excludes areas where objects are unlikely to appear. These areas include portions of the image where people and bags are not allowed such as regions surrounding metal detectors (see Fig. 6). In line 3 of Alg. 1, the function computes the ROI , where and are the coordinates of the center of the ROI and and are its corresponding width and height.
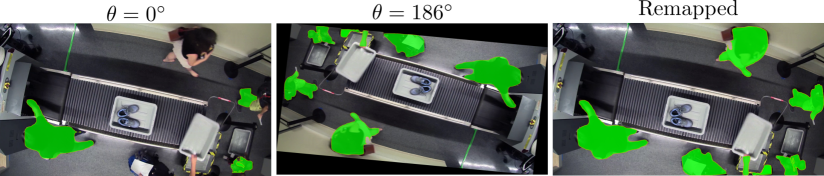
We empirically observed that the MRCNN-based detector performs better when objects are observed at more commonly occurring angles (e.g., upright). Therefore, to reduce the negative effect of perspective variations, we generate multiple rotated copies of the ROI (line 5 in Alg. 1), where is the rotation operator, which rotates the image by an angle . The angle of rotation varies between and at intervals of , i.e., , where determines the rotation resolution. At each rotation step, we compute the detection set for both classes using a single call to the function (line 6). We then remap the resulting detections to the coordinate frame of the original image by first removing the implicit translation imposed by the ROI using the operator and then by applying the inverse rotation operation to each of the detections in (line 7). To avoid localization errors introduced by rotating axis-aligned bounding boxes, we apply the rotation operation to the binary segmentation masks produced by MRCNN and compute the corresponding bounding boxes using the rotated masks. At the end of the first for loop, the set contains the detections at all the rotation angles . Fig. 2 illustrates the detections at two rotation angles and the result of mapping them back to the original coordinate system.
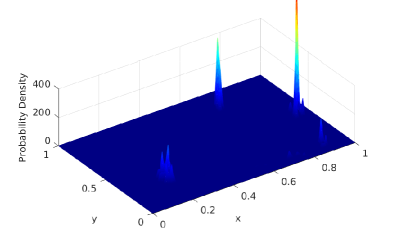
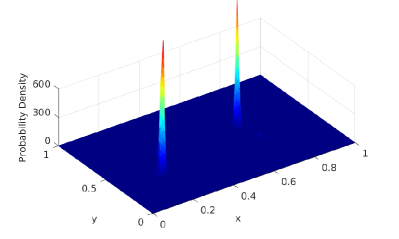
As Fig. 3 indicates, the detections and their corresponding confidence scores form a non-parametric distribution of the probability of occupancy at the image. Therefore, we use the mean-shift algorithm [12, 37] to identify the modes of that distribution and cluster the detections corresponding to common targets. Let , be the coordinates of the center and the dimensions of the bounding box . We cluster the detections according to using a multivariate Gaussian kernel [37] with bandwidth . We use the sample variances of the center coordinates and dimensions of the different object classes at each frame to determine the bandwidth, i.e.,
| (1) |
where is the sample mean of . The kernel bandwidth is then given by
| (2) |
where is the diagonal of the matrix , and are the sample variances of the and coordinates of the detections for objects of class , and and are the corresponding width and height sample variances. The correlations among the elements of are negligible and can be safely ignored.
Each call to the mean-shift algorithm (line 12 in Alg. 1) thus produces a set of clusters such that each element of is a set of detections assigned to the same target. We consider the detections of passengers and baggage items separately. Hence, two separate invocations of the mean-shift procedure are required to produce the sets and . To remove false positive detections, we discard clusters with low total probability scores. The normalized probability score of cluster is defined as the ratio between the total score of the detections within that cluster and the number of rotation angles considered in the augmentation process, i.e.,
| (3) |
where is the confidence score of detection . Lines 14 and 15 of Alg. 1 compute the cluster confidence scores and discard clusters with scores lower than a threshold .
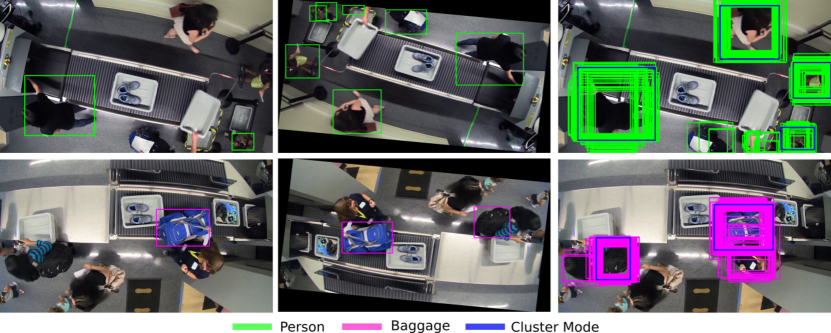
As Fig. 2 illustrates, our detections consist of axis-aligned bounding boxes. As a result, even if they are generated using the remapped segmentation masks, their sizes and corresponding center-points may vary at different orientation angles. Hence, rather than considering the average detection value within a cluster as the resulting detection, we select the mode of the cluster (i.e., the detection with the highest score) as the representative detection for that cluster. Lines 16 and 17 of Alg. 1 identify these detections for each of the clusters that satisfy the score threshold and include them in the resulting detection set .
III-B Tracking and Association Algorithms
Alg. 2 shows our tracking and association algorithm. We use separate instances of the MHT algorithm to track person and baggage detections throughout an image sequence. That is, the detections and are tracked separately with distinct parameter sets, and , which are optimized for the object class under consideration. In Alg. 2, this is performed in line 2, which represents the two calls to the function .
The output of the MHT algorithm at each image frame is a set , where is the number of targets of class present at frame and , where is the target bounding box estimated by MHT and is a unique identifier label associated with each bag and person in the frame. These labels remain the same throughout the video sequence and hence perform temporal association among detections.
The tracking results and are combined using a dictionary of labels that associates each label in with the closest element in based on the Euclidean distance between them. That is, let be the temporal label of the -th bag. If the label did not exist in previous frames, a dictionary entry is created between the label and the label corresponding to a person in that frame according to
| (4) | |||||||
| s.t. | |||||||
where and are the coordinates (i.e., the first two elements) of and , respectively, and is the distance association threshold. To mitigate the effects of bounding box size variations observed as passengers move their arms to interact with their baggage items, we compute the distances considering only the center positions of the bounding boxes.
III-C Multi-camera Tracklet Association
Since passengers may temporarily leave and later re-enter the field of view of individual cameras in the system, their corresponding trajectories may be fragmented into multiple segments. Similarly, temporary occlusions among passengers (particularly children) may lead to the fragmentation of trajectories within the field of view of a camera. We call the segments of fragmented trajectories tracklets.
To address the issue of trajectory segmentation within the field of view of a single camera, we associate new tracklets with recently terminated previous tracklets such that the intersection over union (IoU) between the last detection of the previous tracklet and the first detection of the new tracklet is maximized. That is, let and be two distinct tracklets, their association cost is given by
| (5) |
where and are the first detection of and the last detection of , and is the maximum temporal offset to consider two tracklets for association. We then compute the optimal tracklet assignment using the Hungarian algorithm based on the costs .
To associate tracklets across camera views, we must consider the fact that two tracklets corresponding to the same target include temporally overlapping detections. For that purpose, let the camera whose partial tracklets we wish to complete be our primary camera, and let the auxiliary camera be the one whose tracklets will be used to complement the tracklets observed in the primary camera. As Alg. 3 shows, we use the homography to project detections from the auxiliary camera onto the primary camera. However, due to projective distortions, the corresponding bounding boxes in the two cameras may not necessarily overlap. Hence, we compute the optimal association cost using the Hausdorff distance [58, 56] between the centroids of the detections in each tracklet as follows
| (6) |
where and are the temporally overlapping segments of tracklets and , is the Hausdorff distance of the centroids of their corresponding detections, and is the maximum Hausdorff distance threshold that allows tracklet pairs to be considered for association.
We use the Hungarian algorithm again to determine optimal tracklet associations according to the costs . However, since the trajectory of a passenger that re-enters the field of view of a camera multiple times consists of a sequence of tracklets, we iteratively update the association costs until no further associations are possible. We keep track of indirectly associated tracklets by constructing the reacheability graph , which contains one edge for each pair of associated tracklets. We then set the temporal identifiers of all the tracklets in associated with a common tracklet to the first identifier among them. That is, the temporal label of a tracklet is given by
| (7) |
where is the temporal label of tracklet , and is the set of tracklets that can be reached from tracklet on the reacheability graph, which we obtain through a depth-first search on .
For simplicity, our tracklet association methods are performed offline, i.e., after all the tracklets have been generated. However, it would be simple to implement online versions of the algorithms since the single-view association method can be executed whenever a new trajectory is initiated and each iteration of the multi-camera association algorithm can be performed once a trajectory in an auxiliary camera is terminated. The implementation of online versions of our tracklet association methods is part of our future work.
IV Results and Discussion
In this section, we first discuss the datasets that we used to evaluate our algorithms. We then present the assessment of our passenger and baggage detection approach followed by the evaluation of our tracking, tracklet association, and event detection algorithms. We base our evaluation of the proposed algorithms on the Multi-Object Detection (MOD) and Tracking (MOT) metrics [59, 60].
IV-A Datasets
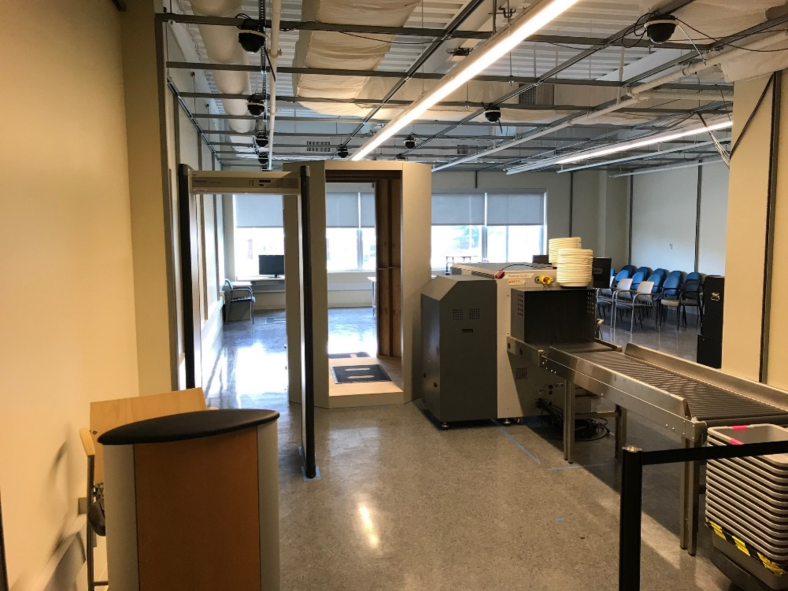
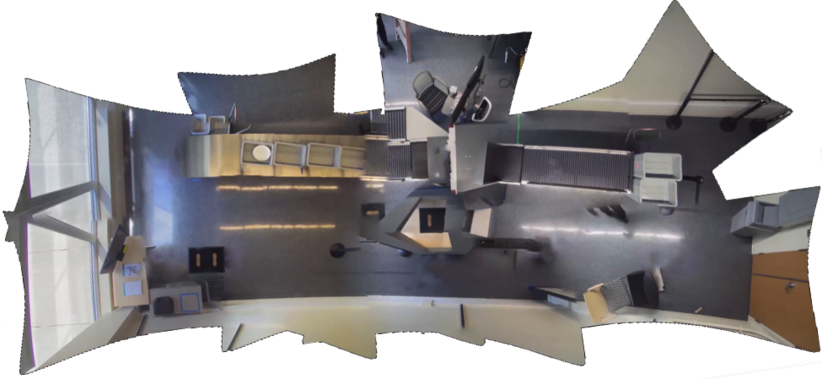
The video datasets used in this work were recorded at the Kostas Research Institute (KRI) video analytics laboratory at Northeastern University. The laboratory is configured to emulate a realistic airport checkpoint (Fig. 4). It is equipped with 14 standard IP surveillance cameras (Bosch NDN-832-V03P) with resolution and focal lengths between 3 mm and 9 mm. The cameras are installed at a height of approximately three meters from the floor with partially overlapping fields of view. Fig. 5 shows a panoramic perspective of the fields of view of the cameras.
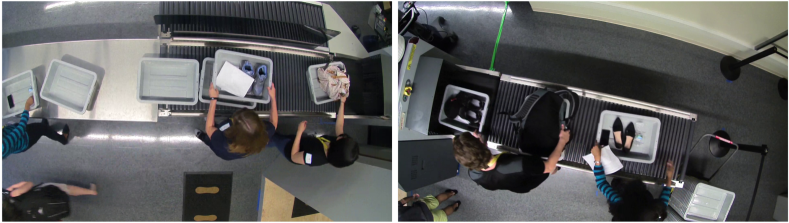
In the videos collected at the laboratory, several actors traverse the checkpoint with their baggage items while performing a variety of activities commonly observed in real airports.111The datasets are available upon request at alert-coe@northeastern.edu. These activities range from simple scenarios in which just a few passengers go through the checkpoint in a sequential order to crowded scenarios in which multiple passengers divest and retrieve their items in a more erratic manner. Fig. 6 shows sample frames of the videos. Passengers place their baggage and other belongings into bins or directly onto the conveyor belt in the divestiture area. Then, after passing through the metal detector, they collect their belongings in the baggage retrieval area.
| Dataset | Passengers | Bags | Frames | GT (fps) | Labels / Frames |
|---|---|---|---|---|---|
| A | 12 | 7 | 6030 | 1 | 960 / 532 |
| B | 12 | 7 | 6180 | 2 | 1432 / 920 |
| C | 8 | 8 | 6030 | 2 | 798 / 761 |
| D | 12 | 8 | 6030 | 2 | 1175 / 778 |
| E | 9 | 7 | 4128 | 10 | 4254 / 2753 |
In this work, we focus on videos with the highest passenger density. Of the 14 cameras in the laboratory, most interactions among passengers take place on cameras 9 and 11. Camera 9 monitors the divestiture area (Fig. 6 - right) and camera 11 observes the baggage retrieval area (Fig. 6 - left). We manually annotate the videos with uniquely identified axis-aligned bounding boxes at rates of one, two, and ten frames per second over time intervals of 69 to 206 seconds. In these videos, 54 passengers carrying 37 baggage items (backpacks, handbags, and suitcases) and two Transportation Security Officers (TSO) leave and re-enter the field of view of the two cameras several times. Table I summarizes the characteristics of the datasets used in our evaluation. We use datasets A and B solely to perform qualitative analyses and adjust the parameters of our method. The evaluation on the remaining datasets was performed using the same parameter values.
IV-B Passenger Detection
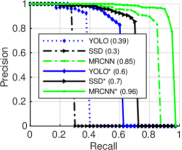
Fig. 7 shows the precision-recall curves for passenger detection using the three baseline detectors (dotted lines) and for the corresponding detectors extended using our proposed approach (solid lines). All the results are based on an IoU threshold of , which allows for the correct detection of passengers despite the substantial variability in bounding box size as passengers change their orientations or as they move their arms to interact with baggage items. In our evaluation, we use the same detection and non-maximum suppression thresholds of and for the three networks. The number of rotation angles used for data augmentation is . In the methods augmented with our proposed approach, because of the low recall values of the detectors based on YOLO and SSD, we set the cluster confidence score threshold to , whereas for the method based on MRCNN, we use . We have observed that further performance improvements are possible by adjusting the value of according to the dataset under consideration, but we refrain from using dataset-specific values to demonstrate the generalization capability of our method. For a fair comparison, none of the methods under evaluation is fine-tuned using data from our simulated checkpoint. As previously mentioned, although fine-tuning the baseline models would lead to performance improvements across the board, it would also limit the applicability of our method in real-world scenarios. As the figure shows, our algorithm increases the area under the curve for all three detectors, leading to a maximum of 98% for MRCNN.
As shown in Table II, our detection approach (marked with a ) substantially improves the performance of the three baseline detectors. In most of the scenarios under consideration, our algorithm substantially increases the true positive (TP) detections while reducing false positive (FP) and false negative (FN) detections, which results in noticeable improvements in recall (Rcll), precision (Prcn), and MODA results as well. The results in the table correspond to the point that maximizes the score of the individual algorithms in Fig. 7. Hence, in some scenarios, we observe a substantial increase in recall values at the cost of some degradation in the corresponding precision values. As Fig. 7 indicates, it is possible to select an operating point where both metrics are higher than those obtained by the corresponding baseline methods, but that would cause an overall degradation of performance when considering the combined metrics. Overall, our algorithm shows a relative improvement of the MODA scores of 17%, 103%, and 23% with respect to YOLO, SSD, and MRCNN respectively.
| Cam. | Method | Rcll | Prcn | TP | FP | FN | MODA |
|---|---|---|---|---|---|---|---|
| 9 | YOLO | 39.5 | 91.5 | 130 | 12 | 199 | 35.9% |
| 43.8 | 96.6 | 144 | 5 | 185 | 42.2% | ||
| SSD | 28.6 | 97.9 | 94 | 2 | 235 | 28.0% | |
| 71.1 | 83.6 | 234 | 46 | 95 | 57.1% | ||
| MRCNN | 85.7 | 79.7 | 282 | 42 | 47 | 63.8% | |
| 86.6 | 96.6 | 285 | 10 | 44 | 83.6% | ||
| 11 | YOLO | 52.3 | 95.8 | 115 | 5 | 105 | 50.0% |
| 62.7 | 92.6 | 138 | 11 | 82 | 57.7% | ||
| SSD | 39.1 | 96.6 | 86 | 3 | 134 | 37.7% | |
| 82.7 | 82.4 | 182 | 39 | 38 | 65.0% | ||
| MRCNN | 88.6 | 86.7 | 195 | 30 | 25 | 75.0% | |
| 90.5 | 94.8 | 199 | 11 | 21 | 85.5% |
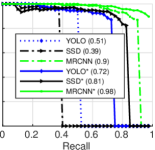
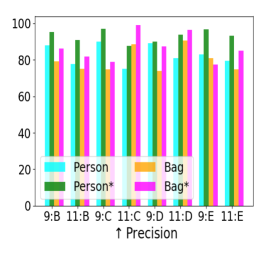
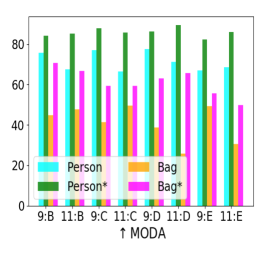
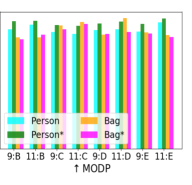
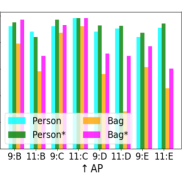
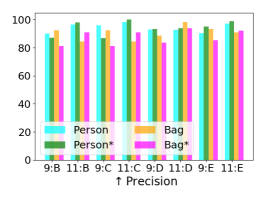
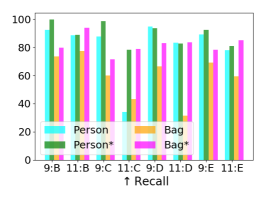
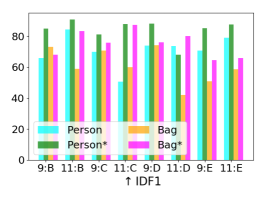
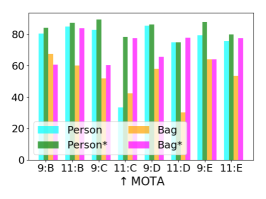
As Fig. 9 shows, we observed similar performance improvements in datasets B, C, D, and E. Since the detector based on MRCNN outperforms the other methods by a large margin, we omit the results for YOLO* and SSD*. The high recall, precision, and MODA values indicate that our approach detects most of the passengers correctly in these video sequences. Although the geometric transformations slightly increase the number of false positives caused by the detection of body parts of passengers near the edges of the scene, by retaining clusters with normalized probability score above , we are able to ignore most of them (see Fig. 2). As shown in subsection IV-E, MHT effectively handles the few remaining false positives.
IV-C Baggage Detection
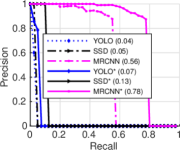
Fig. 8 shows the precision-recall curves for baggage items for an IoU threshold of . In these results, we use for MRCNN and for YOLO and SSD because these networks show substantially lower confidence levels in the detection of baggage items. Again, for all three networks, , and the number of rotation angles is . As the figure indicates, the maximum average precision for MRCNN alone is , which is almost lower than what is obtained using our approach. The average precision of baggage detection using YOLO or SSD is less than . Although our approach substantially improves the average precision for both methods, their performance is still not satisfactory for any practical application. Therefore, we use MRCNN in the evaluation of our tracking and association algorithms discussed in the following subsections.
| Cam. | Method | Rcll | Prcn | TP | FP | FN | MODA |
|---|---|---|---|---|---|---|---|
| 9 | YOLO | 3.4 | 63.6 | 7 | 4 | 199 | 1.5% |
| 7.3 | 78.9 | 15 | 4 | 191 | 5.3% | ||
| SSD | 3.9 | 88.9 | 8 | 1 | 198 | 3.4% | |
| 12.1 | 96.2 | 25 | 1 | 181 | 11.7% | ||
| MRCNN | 50.5 | 91.2 | 104 | 10 | 102 | 45.6% | |
| 72.3 | 90.3 | 149 | 16 | 57 | 64.6% | ||
| 11 | YOLO | 9.8 | 76.9 | 20 | 6 | 185 | 6.8% |
| 18.5 | 90.5 | 38 | 4 | 167 | 16.6% | ||
| SSD | 2.9 | 100.0 | 6 | 0 | 199 | 2.9% | |
| 19 | 83.0 | 39 | 8 | 166 | 15.1% | ||
| MRCNN | 47.3 | 89.8 | 97 | 11 | 108 | 42.0% | |
| 70.2 | 90.6 | 144 | 15 | 61 | 62.9% |
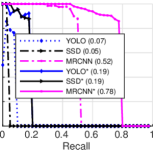
The additional metrics listed in Table III further highlight that, for baggage items, the baseline methods alone fail to detect most of the targets. Our proposed approach more than doubles the MODA of YOLO and SSD for both cameras. For MRCNN, we observe a relative improvement of the MODA score of 61.8% for camera 9 and 54.5% for camera 11. The increase in FP for MRCNN is mostly due to the detection of relevant items such as small purses, clothes, and bins as baggage items that have not been annotated in the ground truth dataset. As with passenger detection, we observed comparable baggage detection improvements in the remaining datasets (Fig. 9).


IV-D Computational Complexity
The computational complexity of our approach increases linearly with the number of rotation angles used for augmentation. That is, for a baseline detection algorithm with computational complexity , the complexity of our approach is , where is the number of rotation angles. For example, for , the run-time is 20 times that of a single detection without augmentation. However, these operations are parallelizable as long as the hardware resources support the simultaneous execution of multiple networks.
| Class | Cam. | Method | IDF1 | IDR | IDP | Rcll | Prcn | FAR | MT | ML | FP | FN | IDs | MOTA | MOTP |
|---|---|---|---|---|---|---|---|---|---|---|---|---|---|---|---|
| Person | 9 | MRCNN+MHT | 65.1 | 67.4 | 62.9 | 88.6 | 82.8 | 0.31 | 18 | 2 | 60 | 37 | 20 | 64.0% | 72.6% |
| +MHT | 79.4 | 78.8 | 80.0 | 89.8 | 91.2 | 0.14 | 16 | 2 | 28 | 33 | 8 | 78.8% | 79.7% | ||
| 11 | MRCNN+MHT | 63.0 | 65.9 | 60.4 | 91.5 | 83.9 | 0.20 | 12 | 1 | 37 | 18 | 9 | 69.7% | 67.6% | |
| +MHT | 73.4 | 75.8 | 71.1 | 95.7 | 89.8 | 0.12 | 15 | 0 | 23 | 9 | 6 | 82.0% | 75.7% | ||
| Bag | 9 | MRCNN+MHT | 50.9 | 39.2 | 72.3 | 49.1 | 84.2 | 0.09 | 3 | 4 | 16 | 88 | 2 | 38.7% | 79.1% |
| +MHT | 69.4 | 64.0 | 75.8 | 79.2 | 87.3 | 0.11 | 6 | 4 | 20 | 36 | 0 | 67.6% | 75.0% | ||
| 11 | MRCNN+MHT | 47.7 | 35.0 | 75.0 | 46.1 | 99.0 | 0.01 | 2 | 4 | 1 | 111 | 4 | 43.7% | 71.4% | |
| +MHT | 77.8 | 65.5 | 95.7 | 67.0 | 97.9 | 0.02 | 5 | 3 | 3 | 68 | 0 | 65.5% | 74.2% |
IV-E Tracking
To evaluate the performance of our tracking algorithm, we provide the detections as inputs to MHT at 30 frames per second and then compute tracking metrics using our ground truth frames, which we annotated as described in Table I. To dissociate the evaluation of the tracking algorithm and our tracklet association approach, in this section, a passenger that re-enters the field of view of the camera receives a new identifier. Results demonstrating our system’s ability to maintain consistent passenger identifiers are presented in the next subsection.
As Table IV illustrates, our approach shows substantial performance improvements in identity-based (IDF1), recall (IDR), and precision (IDP) as well as in standard recall (Rcll), precision (Prcn), and false alarm rates (FAR). It also improves the tracking-specific metrics of mostly tracked (MT) and mostly lost (ML) trajectories. These results are a consequence of the reductions in false positives (FP), false negatives (FN), and identity switches (IDs). As a result, our method produces substantial gains in MOTA without negatively impacting MOTP. Notably, our approach shows a relative MOTA improvement of up to for passengers and up to for baggage items (Camera 9).
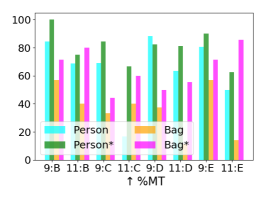
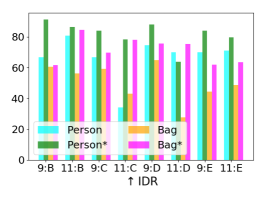
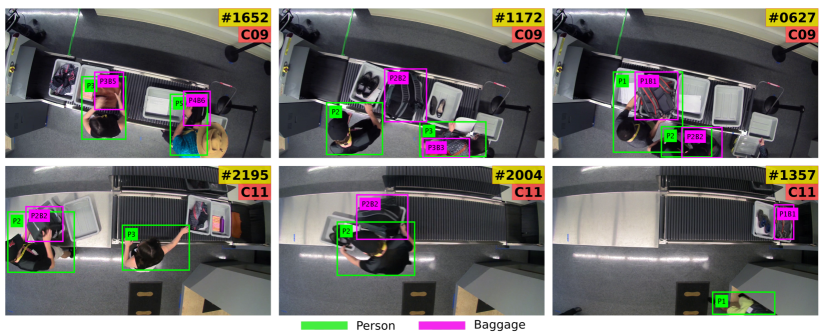
Fig. 10 shows that in the remaining datasets we obtain similar tracking performance improvement in terms of precision, recall, percentage of mostly tracked trajectories (MT), fraction of computed detections that are correctly identified (IDR) [61], and MOTA for passengers and baggage items. Fig. 11 illustrates the tracking and association results.
IV-F Multi-camera Tracklet Association
| Dataset | C9-C2 | C5-C11 | ||||
|---|---|---|---|---|---|---|
| Ours | GT | AR (%) | Ours | GT | AR (%) | |
| A | 20 | 25 | 80.0 | 21 | 26 | 80.8 |
| B | 18 | 20 | 90.0 | 18 | 21 | 85.7 |
| C | 17 | 17 | 100.0 | 12 | 12 | 100.0 |
| D | 16 | 19 | 84.2 | 18 | 21 | 85.7 |
| E | 18 | 20 | 90.0 | 12 | 13 | 92.3 |
| Avg. | 17.8 | 20.2 | 88.8 | 16.2 | 18.6 | 88.9 |
| Data- set | Cam. | +MHT | MCTA | IDF1 | IDR | IDP | IDs | MOTA |
|---|---|---|---|---|---|---|---|---|
| A | 9 | ✓ | ✗ | 68.9 | 67.4 | 70.5 | 13 | 72.0 |
| ✓ | ✓ | 73.0 | 74.8 | 71.3 | 7 | 75.4 | ||
| 11 | ✓ | ✗ | 68.4 | 73.6 | 63.8 | 10 | 75.5 | |
| ✓ | ✓ | 71.5 | 76.4 | 67.2 | 7 | 76.4 | ||
| B | 9 | ✓ | ✗ | 87.6 | 94.1 | 82.0 | 2 | 84.2 |
| ✓ | ✓ | 88.3 | 94.1 | 83.3 | 1 | 84.5 | ||
| 11 | ✓ | ✗ | 68.4 | 63.3 | 74.3 | 4 | 80.0 | |
| ✓ | ✓ | 68.9 | 64.3 | 74.3 | 2 | 81.3 | ||
| C | 9 | ✓ | ✗ | 88.5 | 91.4 | 85.9 | 1 | 89.9 |
| ✓ | ✓ | 95.0 | 98.0 | 92.1 | 0 | 90.2 | ||
| 11 | ✓ | ✗ | 87.2 | 77.2 | 100.0 | 0 | 77.2 | |
| ✓ | ✓ | 87.2 | 77.2 | 100.0 | 0 | 77.2 | ||
| D | 9 | ✓ | ✗ | 88.1 | 88.1 | 88.1 | 4 | 86.4 |
| ✓ | ✓ | 91.6 | 91.6 | 91.6 | 0 | 87.9 | ||
| 11 | ✓ | ✗ | 82.6 | 78.5 | 87.2 | 3 | 85.3 | |
| ✓ | ✓ | 88.2 | 84.1 | 92.7 | 2 | 86.4 | ||
| E | 9 | ✓ | ✗ | 68.6 | 67.7 | 69.5 | 2 | 85.7 |
| ✓ | ✓ | 74.8 | 73.8 | 75.8 | 1 | 85.8 | ||
| 11 | ✓ | ✗ | 85.9 | 83.7 | 88.1 | 1 | 84.7 | |
| ✓ | ✓ | 85.9 | 83.7 | 88.1 | 1 | 84.7 |
Based on the overall flow of passengers through our simulated checkpoint, we consider cameras 9 and 11 the primary cameras for the evaluation of our tracklet association method (Alg. 3). We then use cameras 2 and 5, which are the cameras immediately below them in Fig. 5, as the respective auxiliary cameras. We first evaluate our tracklet association algorithm by assessing the frequency with which it can correctly determine when passengers re-enter the area observed by a camera. Re-entries can happen in transitions from both the primary to the auxiliary camera or from the auxiliary to the primary. Table V shows the number of times a passenger leaves the fields of view of the primary/auxiliary cameras and is temporarily tracked by the corresponding auxiliary/primary camera. As the table indicates, on average, our algorithm correctly detects approximately of re-entry events in all the datasets. The few cases in which re-entries are not correctly detected are caused by temporary tracking failures in the fields of view of the auxiliary cameras.
We also employ identity-based measures [61] to further quantify the impact of our tracklet association algorithm in the tracking results of the primary cameras. Table VI shows that tracklet association improves identity-based measures by up to in dataset A (IDR, camera 9) and in dataset E (IDF1, IDR, and IDP, camera 11), with an average improvement over all the datasets of approximately , , and in IDF1, IDR, and IDP, respectively. The number of identity switches is reduced by up to with an average reduction of . The datasets in which we observe lower improvements correspond to scenarios involving few re-entry events. For example, in Dataset C, no passenger re-enters the field of view of camera 11, and therefore no improvement in identity-based metrics can be obtained. Furthermore, the more modest gains in MOTA (up to ) demonstrate the need for measures that focus specifically on the impact of identity switches on tracking performance.
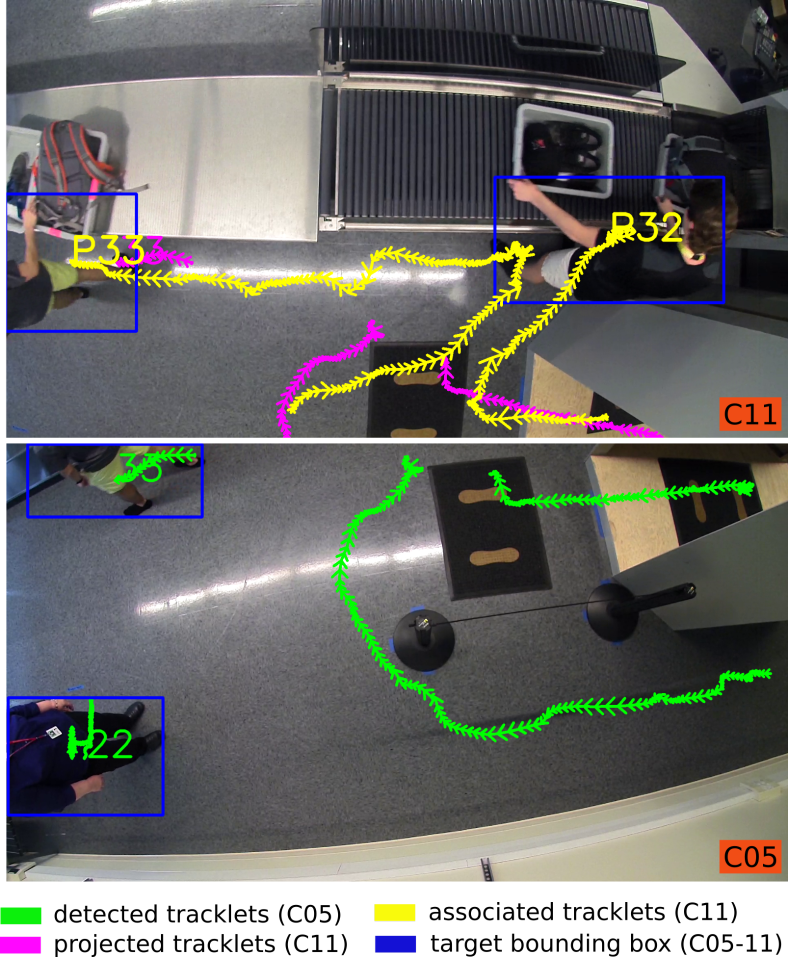
Fig. 12 illustrates the tracklet association procedure. As the passengers with identities P32 and P33 move from the field of view of camera 5 (green trajectories) to that of camera 11, the corresponding tracklets are projected from the former camera to the latter (purple trajectories). The projected trajectories are then successfully associated with the tracklets from camera 11 (yellow trajectories) based on their temporally overlapping segments. In the instant depicted in the figure, passenger P33 is beginning to re-enter the field of view of camera 5, and the corresponding tracklet is also correctly associated with that passenger’s tracklet in camera 11. Hence, the passenger’s identity is successfully handed off between the cameras.
IV-G Passenger-to-Baggage Association
Our tracking algorithm (Alg. 2) associates passengers and their baggage items using their spatio-temporal relationships. We use an pixels distance between passengers and baggage items to identify the associations. This approach can identify which person enters the divestiture area and leaves the retrieval area with which bag (Fig. 11). Table VII, shows that our framework successfully associates above 90% of the passengers and their items in all the datasets, except dataset E. Incorrect associations may occur when passengers leave behind their bags and return to the scene later, when family members enter the divestiture area together, or when TSOs manipulate unassociated bags. These complex associations are out of the scope of our current algorithm.
| Dataset | GT |
|
+MHT | |
|---|---|---|---|---|
| A | 18 | 8 (44%) | 17 (94%) | |
| B | 16 | 7 (44%) | 15 (94%) | |
| C | 15 | 8 (53%) | 14 (93%) | |
| D | 13 | 7 (54%) | 13 (100%) | |
| E | 12 | 7 (58%) | 9 (75%) | |
| Avg. | 14.8 | 7.4 (50%) | 13.6 (92%) |
V Conclusion
In this work, we propose a multistage tracking-by-detection framework to overcome the perspective distortion problem for detection and tracking in challenging overhead camera videos. Our experimental results show that our method can accurately detect, track, and associate passengers and baggage items in such complex scenarios. Our approach can be extended without significant modifications to include additional object classes of interest in similar scenarios or complementary detection algorithms. In the future, we intend to further improve the performance of our detection algorithm by employing dynamic mechanisms for choosing the most informative rotation angles. We also intend to develop online versions of our tracklet association approach in order to monitor the checkpoint in real-time. Finally, by incorporating information regarding passengers traveling together, we will extend our baggage association algorithm to handle complex scenarios involving, for instance, passengers retrieving items for family members.
References
- [1] C. Kim, F. Li, A. Ciptadi, and J. M. Rehg, “Multiple hypothesis tracking revisited,” in International Conference on Computer Vision (ICCV), 2015, pp. 4696–4704.
- [2] R. Henschel, L. Leal-Taixé, D. Cremers, and B. Rosenhahn, “A novel multi-detector fusion framework for multi-object tracking,” CoRR, vol. abs/1705.08314, 2017.
- [3] C. Feichtenhofer, A. Pinz, and A. Zisserman, “Detect to track and track to detect,” in International Conference on Computer Vision (ICCV), 2017.
- [4] R. Ding, M. Yu, H. Oh, and W. Chen, “New multiple-target tracking strategy using domain knowledge and optimization,” IEEE Transactions on Systems, Man, and Cybernetics: Systems, vol. 47, no. 4, pp. 605–616, 2017.
- [5] K. He, G. Gkioxari, P. Dollár, and R. Girshick, “Mask R-CNN,” in International Conference on Computer Vision (ICCV), 2017, pp. 2980–2988.
- [6] W. Liu, D. Anguelov, D. Erhan, C. Szegedy, S. E. Reed, C. Fu, and A. C. Berg, “SSD: single shot multibox detector,” in European Conference on Computer Vision (ECCV), 2016.
- [7] J. Redmon, S. Divvala, R. Girshick, and A. Farhadi, “You only look once: Unified, real-time object detection,” in Conference on Computer Vision and Pattern Recognition (CVPR), 2016, pp. 779–788.
- [8] G. Lin, A. Milan, C. Shen, and I. Reid, “Refinenet: Multi-path refinement networks for high-resolution semantic segmentation,” in Conference on Computer Vision and Pattern Recognition (CVPR), 2017, pp. 5168–5177.
- [9] Z. Wu and R. J. Radke, “Real-time airport security checkpoint surveillance using a camera network,” in Conference on Computer Vision and Pattern Recognition (CVPR) Workshops, 2011, pp. 25–32.
- [10] A. Islam, Y. Zhang, D. Yin, O. Camps, and R. J. Radke, “Correlating belongings with passengers in a simulated airport security checkpoint,” in International Conference on Distributed Smart Cameras (ICDSC). ACM, 2018.
- [11] T.-Y. Lin, M. Maire, S. Belongie, J. Hays, P. Perona, D. Ramanan, P. Dollár, and C. L. Zitnick, “Microsoft COCO: Common objects in context,” in European Conference on Computer Vision (ECCV), 2014.
- [12] Y. Cheng, “Mean shift, mode seeking, and clustering,” IEEE Transactions on Pattern Analysis and Machine Intelligence, vol. 17, no. 8, pp. 790–799, 1995.
- [13] D. Comaniciu and P. Meer, “Mean shift: a robust approach toward feature space analysis,” IEEE Transactions on Pattern Analysis and Machine Intelligence, vol. 24, no. 5, pp. 603–619, 2002.
- [14] R. Mazzon and A. Cavallaro, “Multi-camera tracking using a multi-goal social force model,” Neurocomputing, vol. 100, pp. 41 – 50, 2013.
- [15] S. Zhang, Y. Zhu, and A. Roy-Chowdhury, “Tracking multiple interacting targets in a camera network,” Computer Vision and Image Understanding, vol. 134, pp. 64 – 73, 2015.
- [16] K. Hong, H. Medeiros, P. J. Shin, and J. Park, “Resource-aware distributed particle filtering for cluster-based object tracking in wireless camera networks,” International Journal of Sensor Networks, vol. 21, no. 3, pp. 137–156, 2016.
- [17] H. Medeiros, J. Park, and A. Kak, “Distributed object tracking using a cluster-based kalman filter in wireless camera networks,” IEEE Journal of Selected Topics in Signal Processing, vol. 2, no. 4, pp. 448–463, 2008.
- [18] W. Liu, O. I. Camps, and M. Sznaier, “Multi-camera multi-object tracking,” CoRR, vol. abs/1709.07065, 2017.
- [19] N. Wang, Y. Song, C. Ma, W. Zhou, W. Liu, and H. Li, “Unsupervised deep tracking,” in The IEEE Conference on Computer Vision and Pattern Recognition (CVPR), June 2019.
- [20] R. J. Mozhdehi and H. Medeiros, “Deep convolutional particle filter for visual tracking,” in IEEE International Conference on Image Processing (ICIP), 2017, pp. 3650–3654.
- [21] R. Jalil Mozhdehi, Y. Reznichenko, A. Siddique, and H. Medeiros, “Deep convolutional particle filter with adaptive correlation maps for visual tracking,” in IEEE International Conference on Image Processing (ICIP), 2018.
- [22] R. J. Mozhdehi, Y. Reznichenko, A. Siddique, and H. Medeiros, “Convolutional adaptive particle filter with multiple models for visual tracking,” in International Symposium on Visual Computing (ISVC), 2018.
- [23] V. Bruni and D. Vitulano, “An improvement of kernel-based object tracking based on human perception,” IEEE Transactions on Systems, Man, and Cybernetics: Systems, vol. 44, no. 11, pp. 1474–1485, 2014.
- [24] M. Chuang, J. Hwang, J. Ye, S. Huang, and K. Williams, “Underwater fish tracking for moving cameras based on deformable multiple kernels,” IEEE Transactions on Systems, Man, and Cybernetics: Systems, vol. 47, no. 9, pp. 2467–2477, 2017.
- [25] R. Henschel, Y. Zou, and B. Rosenhahn, “Multiple people tracking using body and joint detections,” in Proceedings of Conference on Computer Vision and Pattern Recognition Workshops, 2019, pp. 0–0.
- [26] A. Sadeghian, V. Kosaraju, A. Sadeghian, N. Hirose, H. Rezatofighi, and S. Savarese, “Sophie: An attentive GAN for predicting paths compliant to social and physical constraints,” in Conference on Computer Vision and Pattern Recognition (CVPR), 2019, pp. 1349–1358.
- [27] A. Alahi, K. Goel, V. Ramanathan, A. Robicquet, L. Fei-Fei, and S. Savarese, “Social LSTM: Human trajectory prediction in crowded spaces,” in Conference on Computer Vision and Pattern Recognition (CVPR), 2016, pp. 961–971.
- [28] A. Gupta, J. Johnson, L. Fei-Fei, S. Savarese, and A. Alahi, “Social GAN: Socially acceptable trajectories with generative adversarial networks,” in Conference on Computer Vision and Pattern Recognition (CVPR), 2018, pp. 2255–2264.
- [29] M. Babaee, A. Athar, and G. Rigoll, “Multiple people tracking using hierarchical deep tracklet re-identification,” arXiv preprint arXiv:1811.04091, 2018.
- [30] M. Keuper, S. Tang, B. Andres, T. Brox, and B. Schiele, “Motion segmentation multiple object tracking by correlation co-clustering,” IEEE Transactions on Pattern Analysis and Machine Intelligence, vol. 42, no. 1, pp. 140–153, Jan 2020.
- [31] S. Xie, R. Girshick, P. Dollár, Z. Tu, and K. He, “Aggregated residual transformations for deep neural networks,” in Conference on Computer Vision and Pattern Recognition (CVPR), 2017, pp. 5987–5995.
- [32] K. He, X. Zhang, S. Ren, and J. Sun, “Deep residual learning for image recognition,” in Conference on Computer Vision and Pattern Recognition (CVPR), 2016, pp. 770–778.
- [33] T. Y. Lin, P. Dollár, R. Girshick, K. He, B. Hariharan, and S. Belongie, “Feature pyramid networks for object detection,” in Conference on Computer Vision and Pattern Recognition (CVPR), 2017, pp. 936–944.
- [34] T. Chavdarova and F. Fleuret, “Deep multi-camera people detection,” in IEEE International Conference on Machine Learning and Applications (ICMLA), 2017, pp. 848–853.
- [35] I. Radosavovic, P. Dollár, R. Girshick, G. Gkioxari, and K. He, “Data distillation: Towards omni-supervised learning,” in Conference on Computer Vision and Pattern Recognition (CVPR), 2018.
- [36] Z. Liu, J. Zhang, and L. Liu, “Upright orientation of 3d shapes with convolutional networks,” Graphical Models, vol. 85, pp. 22 – 29, 2016.
- [37] M. Taj and A. Cavallaro, “Multi-camera track-before-detect,” in International Conference on Distributed Smart Cameras (ICDSC), 2009, pp. 1–6.
- [38] S. Schulter, P. Vernaza, W. Choi, and M. Chandraker, “Deep network flow for multi-object tracking,” in Conference on Computer Vision and Pattern Recognition (CVPR), July 2017, pp. 2730–2739.
- [39] J. Zhu, H. Yang, N. Liu, M. Kim, W. Zhang, and M.-H. Yang, “Online multi-object tracking with dual matching attention networks,” in European Conference on Computer Vision (ECCV), 2018.
- [40] J. Son, M. Baek, M. Cho, and B. Han, “Multi-object tracking with quadruplet convolutional neural networks,” in Conference on Computer Vision and Pattern Recognition (CVPR), July 2017, pp. 3786–3795.
- [41] S. Sun, N. Akhtar, H. Song, A. S. Mian, and M. Shah, “Deep affinity network for multiple object tracking,” IEEE transactions on pattern analysis and machine intelligence, 2019.
- [42] H. Sheng, J. Chen, Y. Zhang, W. Ke, Z. Xiong, and J. Yu, “Iterative multiple hypothesis tracking with tracklet-level association,” IEEE Transactions on Circuits and Systems for Video Technology, 2018.
- [43] H. Sheng, Y. Zhang, J. Chen, Z. Xiong, and J. Zhang, “Heterogeneous association graph fusion for target association in multiple object tracking,” IEEE Transactions on Circuits and Systems for Video Technology, 2018.
- [44] C. Kim, F. Li, and J. M. Rehg, “Multi-object tracking with neural gating using bilinear LSTM,” in European Conference on Computer Vision (ECCV), 2018, pp. 200–215.
- [45] K. Fang, Y. Xiang, X. Li, and S. Savarese, “Recurrent autoregressive networks for online multi-object tracking,” in Winter Conference on Applications of Computer Vision (WACV), 2018, pp. 466–475.
- [46] S. Schulter, P. Vernaza, W. Choi, and M. Chandraker, “Deep network flow for multi-object tracking,” in Proceedings of Conference on Computer Vision and Pattern Recognition, 2017, pp. 6951–6960.
- [47] S. Jin, W. Liu, W. Ouyang, and C. Qian, “Multi-person articulated tracking with spatial and temporal embeddings,” in Conference on Computer Vision and Pattern Recognition (CVPR), June 2019.
- [48] P. Voigtlaender, M. Krause, A. Osep, J. Luiten, B. B. G. Sekar, A. Geiger, and B. Leibe, “Mots: Multi-object tracking and segmentation,” in Conference on Computer Vision and Pattern Recognition (CVPR), June 2019.
- [49] Z. He, J. Li, D. Liu, H. He, and D. Barber, “Tracking by animation: Unsupervised learning of multi-object attentive trackers,” in Conference on Computer Vision and Pattern Recognition (CVPR), June 2019.
- [50] A. Sadeghian, A. Alahi, and S. Savarese, “Tracking the untrackable: Learning to track multiple cues with long-term dependencies,” in International Conference on Computer Vision (ICCV), Oct 2017, pp. 300–311.
- [51] S. Bae and K. Yoon, “Robust online multi-object tracking based on tracklet confidence and online discriminative appearance learning,” in Conference on Computer Vision and Pattern Recognition (CVPR), June 2014, pp. 1218–1225.
- [52] R. Ding, M. Yu, H. Oh, and W.-H. Chen, “New multiple-target tracking strategy using domain knowledge and optimization,” IEEE Transactions on Systems, Man, and Cybernetics: Systems, vol. 47, no. 4, pp. 605–616, 2016.
- [53] Y. Xu, X. Liu, Y. Liu, and S. Zhu, “Multi-view people tracking via hierarchical trajectory composition,” in Conference on Computer Vision and Pattern Recognition (CVPR), June 2016, pp. 4256–4265.
- [54] N. Anjum and A. Cavallaro, “Trajectory association and fusion across partially overlapping cameras,” in 2009 Sixth IEEE International Conference on Advanced Video and Signal Based Surveillance, Sep. 2009, pp. 201–206.
- [55] K. Nithin and F. Bremond, “Multi-camera tracklet association and fusion using ensemble of visual and geometric cues,” IEEE Transactions on Circuits and Systems for Video Technology, vol. 27, no. 3, pp. 431–440, 2017.
- [56] A. S. Hassanein, M. E. Hussein, and W. Gomaa, “Semantic analysis of crowded scenes based on non-parametric tracklet clustering,” in International Joint Conference on Artificial Intelligence (IJCAI), ser. IJCAI’16. AAAI Press, 2016, pp. 3389–3395.
- [57] T. Chavdarova, P. Baqué, S. Bouquet, A. Maksai, C. Jose, T. Bagautdinov, L. Lettry, P. Fua, L. Van Gool, and F. Fleuret, “Wildtrack: A multi-camera HD dataset for dense unscripted pedestrian detection,” in Conference on Computer Vision and Pattern Recognition (CVPR), June 2018, pp. 5030–5039.
- [58] A. A. Taha and A. Hanbury, “An efficient algorithm for calculating the exact hausdorff distance,” IEEE Transactions on Pattern Analysis and Machine Intelligence, vol. 37, no. 11, pp. 2153–2163, Nov 2015.
- [59] L. Leal-Taixé, A. Milan, I. D. Reid, S. Roth, and K. Schindler, “MOTChallenge 2015: Towards a benchmark for multi-target tracking,” CoRR, vol. abs/1504.01942, 2015.
- [60] R. Stiefelhagen, K. Bernardin, R. Bowers, J. Garofolo, D. Mostefa, and P. Soundararajan, “The CLEAR 2006 evaluation,” in CLEAR. Berlin, Heidelberg: Springer-Verlag, 2007, pp. 1–44.
- [61] E. Ristani, F. Solera, R. Zou, R. Cucchiara, and C. Tomasi, “Performance measures and a data set for multi-target, multi-camera tracking,” in European Conference on Computer Vision (ECCV) 2016 Workshops, G. Hua and H. Jégou, Eds., 2016, pp. 17–35.
![[Uncaptioned image]](/html/2007.07924/assets/x27.png) |
Abubakar Siddique is a Ph.D. student in Electrical and Computer Engineering at Marquette University. He holds a Bachelor of Science degree and a Master of Science degree from the University of Dhaka, Bangladesh. Between 2013 and 2016 he was a faculty member at the reputed University of Information Technology and Sciences in Dhaka. His research interests include machine learning, deep convolutional neural networks, multiple object tracking, multi-camera networks, and computer vision. He was a research assistant at the Vision Lab, Old Dominion University where he worked on the development of automatic brain tumor segmentation algorithms. Currently, he is doing research under the CLASP (Correlating Luggage and Specific Passengers) project which is also known as Research and Development of Systems for Tracking Passengers and Divested Items at the Checkpoint. He also received the ALERT research development award for outstanding performance. |
![[Uncaptioned image]](/html/2007.07924/assets/x28.png) |
Henry Medeiros is an Assistant Professor of Electrical and Computer Engineering at Marquette University. His research interests include computer vision and robotics with applications in areas such as manufacturing, agricultural automation, and public safety. He has published over forty journal and peer-reviewed conference papers and holds several US and international patents. Before joining Marquette, he was a Research Scientist at the School of Electrical and Computer Engineering at Purdue University and the Chief Technology Officer of Spensa Technologies, a technology start-up company located at the Purdue Research Park. He is a senior member of the IEEE and has been an associate editor for the IEEE International Conference on Robotics and Automation and the IEEE International Conference on Intelligent Robots. He received his Ph.D. from the School of Electrical and Computer Engineering at Purdue University as a Fulbright scholar. |