The Cepheid Distance to the Seyfert 1 Galaxy NGC 4151
Abstract
We derive a distance of Mpc to the archetypical Seyfert 1 galaxy NGC 4151 based on the near-infrared Cepheid Period–Luminosity relation and new Hubble Space Telescope multiband imaging. This distance determination, based on measurements of 35 long-period (d) Cepheids, will support the absolute calibration of the supermassive black hole mass in this system, as well as studies of the dynamics of the feedback or feeding of its active galactic nucleus.
1 Introduction
Local active galactic nuclei (AGNs) provide unique laboratories to study the co-evolution of galaxies and their supermassive black holes (SMBHs). At redshifts ( Mpc), the host galaxies are well resolved, enabling detailed studies of the structure and dynamics of the their interstellar gas and any connection to the AGN through feedback or feeding. Additionally, since the sphere of influence of the central supermassive black holes is spatially resolved in these local systems, the black hole mass can be measured using resolved dynamical methods. Local AGNs, therefore, are not only central to our understanding of SMBH scaling relations in AGNs, but are also crucial in calibrating SMBH mass measurements based on methods (e.g., reverberation mapping) applicable at higher redshifts (see Ferrarese & Ford 2005; McConnell & Ma 2013; Sahu et al. 2019; Zubovas & King 2019 for reviews).
However, these local AGNs are subject to a single systematic uncertainty that makes all physical parameters highly uncertain: their distances. With accurate knowledge of the local Hubble constant (currently better than a few percent, though tension with results from the cosmic microwave background and baryon acoustic oscillations remains; Riess et al. 2019), the uncertainty of extragalactic distances is principally limited by peculiar velocities relative to the Hubble flow. At very low redshifts, the peculiar velocities can be large compared to the cosmological expansion rate. Even for galaxies as far away as 20 Mpc, peculiar velocities can introduce errors of 20% or more in their redshift-based distances and, of course, the problem is more severe for nearer galaxies.
Redshift-independent distances for the late-type hosts of local AGNs are available only through the Tully–Fisher relation (Tully & Fisher, 1977), but nevertheless are typically uncertain by an irreducible 20%, and more for galaxies at lower inclination. Without an accurate distance, measurements of many other parameters are of limited utility, hampering our ability to understand the impact of the AGN on the evolution of the host galaxy. Thus, we find ourselves in a paradoxical situation for these local AGNs: even while they are the best systems for detailed studies of the structure, dynamics, and energetics (including luminosity measures) of the AGN and host galaxy, these are precisely the objects for which a lack of accurate distances makes all physical parameters highly uncertain.
Understanding the masses of SMBH in nearby AGNs also depends on accurate distance measurements. AGN black hole masses are generally best determined by reverberation mapping (RM; Peterson, 2014). As it is usually applied, RM yields black hole mass uncertainties at – dex, but careful modeling of high-quality data can reduce the uncertainties to – dex (Pancoast et al., 2014b; Grier et al., 2017) and are distance-independent. However, verification of RM-based masses requires independent measurements using other techniques such as modeling stellar or gas dynamics and, more recently, interferometry (Gravity Collaboration et al., 2018), that are distance dependent and, for the most part, applicable only to the nearest AGNs. Accurate distances to nearby AGNs are thus crucial for verification of RM-based masses by other techniques, particularly as the mass measurements themselves become increasingly precise.
For galaxies out to 50 Mpc, Cepheid variables provide an excellent means of distance determination, enabled by the Period–Luminosity Relation (PLR) or Leavitt Law (Leavitt & Pickering, 1912). Recently, Bentz et al. (2019) applied this method at optical wavelengths to the Seyfert 1 galaxy NGC 6814, in order to compare the SMBH mass inferred from dynamical modeling and reverberation mapping. In this contribution, we employ Cepheid variables to determine the distance to the well-known nearby AGN NGC 4151.
NGC 4151 is one of the best-studied AGNs at all wavelengths (e.g., Ulrich, 2000). Yet, despite the intensive scrutiny that it has received on account of its proximity, we do not know its distance to any acceptable degree of accuracy; indeed, the most extreme distance estimates differ by more than a factor of seven. The Extragalactic Distance Database (Tully et al., 2009) quotes a distance for NGC 4151 of 11.2 Mpc based on the average distances of its fellow group members. Only four galaxies contribute to this group-averaged distance, however, with individual distances ranging from 3.9 to 34 Mpc based on the Tully–Fisher line width–luminosity correlation. The object with the smallest estimated distance is NGC 4151 itself at 3.9 Mpc; however, the total galaxy luminosity has not been corrected for the large contribution from the AGN itself, which would cause the galaxy to appear brighter, and therefore nearer, than it actually is. The situation is further confused by the various adopted values in recent studies. We summarize the literature distance measurements to NGC 4151 and adopted values in recent works in Table 1.
| Reference | Distance | Uncertainty | Method |
|---|---|---|---|
| (Mpc) | |||
| Tully et al. (2009) | 3.9 | 0.7 | Tully–Fisher relation |
| de Vaucouleurs et al. (1981) | 4.5 | 0.8 | Tully–Fisher relation |
| Bottinelli et al. (1985) | 4.6 | 0.9 | Tully–Fisher relation |
| Bottinelli et al. (1984) | 4.8 | 0.6 | Tully–Fisher relation |
| Tully et al. (2009) | 11.2 | 1.1 | Tully–Fisher relations of 4 NGC 4151 group members |
| Theureau et al. (2007) | 16.1 | 3.0 | Tully–Fisher relation |
| Tsvetkov et al. (2019) | 16.6 | 1.1 | SN II-P standard candle method |
| Cackett et al. (2007) | 19.0 | 2.0 | Inter-band continuum lags and a thermal reprocessing model |
| Hönig et al. (2014) | 19.0 | IR interferometric angular size and dust reverberation | |
| Tsvetkov et al. (2019) | 20.0 | 1.6 | SN II-P expanding photosphere method |
| Tully & Fisher (1988) | 20.3 | 3.8 | Tully–Fisher relation |
| Yoshii et al. (2014) | 29.2 | 0.4 | Dust reverberation |
| mean | 14.1 | average of the above measurements | |
| standard deviation | 8.2 | standard deviation of the above measurements | |
| Hicks & Malkan (2008) | 13.2 | adopted | |
| Storchi-Bergmann et al. (2010) | 13.3 | adopted | |
| Iserlohe et al. (2013) | 13.3 | adopted | |
| Onken et al. (2014) | 13.9 | adopted | |
| De Rosa et al. (2018) | 13.9 | adopted | |
| Esquej et al. (2014) | 14.9 | adopted | |
| Bentz et al. (2013) | 16.6 | adopted | |
| Burtscher et al. (2013) | 16.9 | adopted | |
| Kishimoto et al. (2011) | 17.6 | adopted | |
Note. — “Adopted” means the distance was assumed in the corresponding study.
An uncertain distance to NGC 4151 limits our understanding of the feeding and feedback processes that we can otherwise study in great detail. For example, the geometry, kinematics, and excitation (e.g., Winge et al. 1999; Das et al. 2005; Shimono et al. 2010; Storchi-Bergmann et al. 2009) of the spatially extended narrow-line region have been well-characterized. AGN-driven outflows have been mapped by Storchi-Bergmann et al. (2010), using near-infrared integral field spectroscopy, down to 8 pc from the nucleus. The UV absorption spectrum (e.g., Crenshaw & Kraemer, 2007) demonstrates that there is considerable kinetic energy in outflows. The calculated mass outflow rate, as well as the power of the outflow, depend on the luminosity of the emitting gas as well as on the geometry of the outflow, both strongly dependent on the distance to the galaxy. It also appears that energetic feedback is occurring on large, resolvable scales. For example, Wang et al. (2010) study the X-ray emission that fills the “H i cavity” in the central kpc of NGC 4151 and consider four separate hypotheses on the origin of the X-rays and the energetics of the interaction between the AGN and the host galaxy. These estimates of the energetics depend linearly on distance, but they still constitute some of the best measurements of AGN feedback in any galaxy in the observable universe.
Finally, NGC 4151 is one of the few AGNs where the mass of the supermassive black hole has been measured by more than one technique: from stellar dynamics, (Onken et al., 2014); from gas dynamics, (Hicks & Malkan, 2008); and from reverberation mapping, , with an additional systematic uncertainty of dex (De Rosa et al., 2018). The precision of the reverberation measurement is likely to improve with detailed modeling.
In this work, we derive the distance to NGC 4151 based on one of the most accurate and widely used methods, the Cepheid PLR, using data obtained with the Hubble Space Telescope (HST). The rest of this article is organized as follows: in §2, we detail our observations, data reduction, and photometry; in §3, we describe the Cepheid search; we present our results in §4 and discuss our findings in §5.
2 Observations, Data Reduction, and Photometry
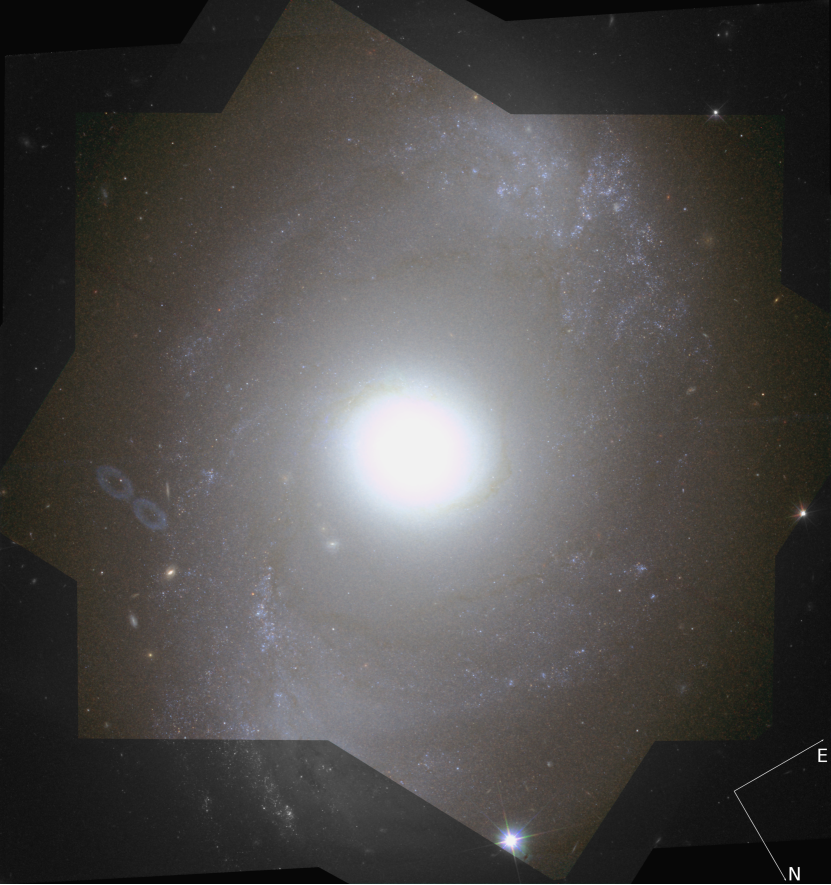
We acquired multiband time-series images of NGC 4151 using the Wide Field Camera 3 (WFC3) onboard HST. The galaxy’s optically bright disk fits well within the field of view of both the UVIS and IR detectors of this instrument. Thanks to the exceptional resolving power of HST, hundreds of thousands of bright stars, including long-period Cepheids, can be photometrically measured in the images. A color composite of NGC 4151 from these HST observations is shown in Fig. 1. We reduced these HST data and performed photometry using DAOPHOT (Stetson, 1987) and related programs. We emphasize that the analysis tools, software, and parameter settings used for this work are not the same as those used by the SH0ES project (Hoffmann et al., 2016; Riess et al., 2016). These differences pertain to the methods used for image registration, point source catalog creation, photometry, PSF modeling, and Cepheid selection. A detailed comparison study between these two approaches is beyond the scope of this work (though we compared the distance derived here with that from a private communication by the SH0ES Team and found excellent agreement).
2.1 Observations
In order to search for Cepheids and measure their periods, we made use of the long-pass optical filter F350LP to phase the light curves with 12 epochs across a baseline of 74 days, in the middle of which the telescope’s orientation angle changed once. The F350LP filter transmission curve is significantly broader in wavelength than the combination of F555W and F814W filters, boosting the Cepheid discovery efficiency by a factor of compared to the filters used traditionally (Hoffmann et al., 2016). We also observed NGC 4151 in F555W (3 epochs), F814W (3 epochs), and F160W (6 epochs), to obtain well-calibrated Cepheid PLRs based on combinations of these filters (Riess et al., 2016). All these observations were dithered to enable hot-pixel and/or cosmic-ray rejection. The per-epoch exposure times were 1050, 1100, 1100, and 1106 s for F350LP, F555W, F814W, and F160W, respectively. A detailed observation log is presented in Table 2.
| Epoch | MJD | DitherExposure Time (seconds) | |||
|---|---|---|---|---|---|
| F350LP | F555W | F814W | F160W | ||
| 1 | 57363.1 | 3350 | 2553 | ||
| 2 | 57370.7 | 3350 | 2550 | ||
| 3 | 57377.9 | 3350 | 2550 | ||
| 4 | 57384.7 | 3350 | 2553 | ||
| 5 | 57390.0 | 3350 | 2550 | ||
| 6 | 57392.8 | 3350 | 2553 | ||
| 7 | 57399.1 | 3350 | 2550 | ||
| 8 | 57405.9 | 3350 | 2553 | ||
| 9 | 57414.7 | 3350 | 2550 | ||
| 10 | 57423.6 | 3350 | 2553 | ||
| 11 | 57429.5 | 3350 | 2550 | ||
| 12 | 57436.9 | 3350 | 2553 | ||
2.2 Data Reduction
We retrieved calibrated images (flat-fielded, dark-subtracted, charge-transfer efficiency corrected, etc.) from the Mikulski Archive for Space Telescopes (MAST), then registered and drizzled them using the AstroDrizzle v2.2.6 package. All the optical images (F350LP, F555W, and F814W) were iteratively registered to the first F350LP image, while all the NIR images were registered to the first F160W image due to the different optics and pixel scales of the IR and UVIS detectors. We drizzle-combined the aligned images of each band into deep master images, with cosmic rays rejected for the optical bands. We also produced a single drizzled image for each epoch, which serves as the basis for the time-series photometry. We set the drizzle pixel scales to the native 0.04″ for the optical images, and a 1/3-finer-than-native (i.e., 0.08″/pixel) for the F160W images.
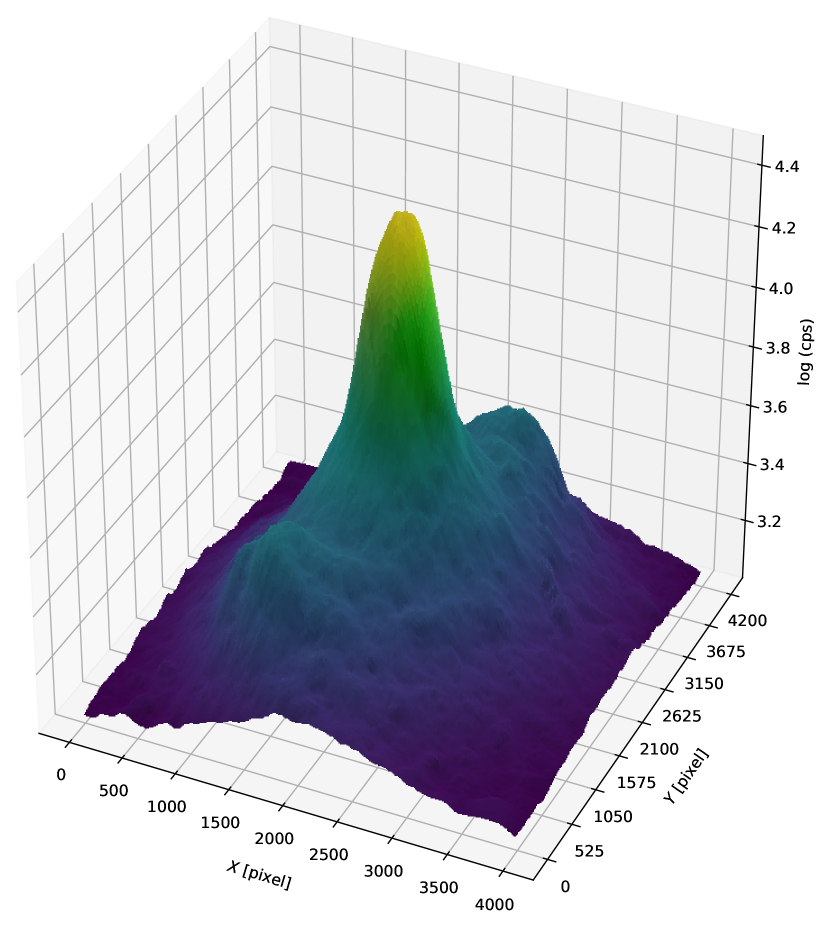
We modeled the surface brightness gradients of all the drizzled images and subtracted these models prior to carrying out the photometry. NGC 4151 exhibits a high surface brightness in a large central region of the disk and a steep gradient in the outskirts, which hampers the ability of DAOPHOT to detect sources and accurately fit PSFs. We masked all point sources found in each image at significance, performed thin-plate spline fits to the background pixel counts across the image using the R implementation of the Tps function with default settings, and obtained a smooth surface brightness model. Fig. 2 shows the results for F350LP as an example. These models were also used for local crowding estimation for Cepheids, as detailed below.
2.3 Photometry
Given their superior depth and resolution, the F350LP data were used to derive the positions of point sources. This information was propagated to other bands for fixed-position photometry. This strategy not only allowed us to track stars in different bands with the same set of identifiers (IDs), but also provided more accurate flux measurements for other bands, especially in F160W where the resolution is much worse. We summarize below the photometry procedures for each band.
F350LP
We started by creating a source list from a two-pass 3 source detection on the F350LP master image using DAOPHOT and ALLSTAR (Stetson, 1994), then performed simultaneous PSF photometry on the 12 epochs of F350LP images using ALLFRAME (Stetson, 1994). In this step, we allowed both the stellar positions and flux to vary until a global PSF fit of all the sources converged. We excluded from the photometry results spurious sources associated with the stray light of foreground bright stars or background extended sources, as well as stars with exceptionally large (top 0.38%) measurement errors for their magnitudes. We selected 57 bright, isolated, non-variable stars as secondary standards to calibrate the epoch-to-epoch magnitude zeropoint offsets. Their positions and calibrated Vega magnitudes are listed in Table 3. We extracted the F350LP light curves using the TRIAL program kindly provided by Peter Stetson.
| ID | R.A. | Decl. | F350LP | F555W | F814W |
|---|---|---|---|---|---|
| [J2000] | [mag(mmag)] | ||||
| 79502 | 182.61050 | 39.41246 | 26.237(17) | 27.647(23) | 27.210(22) |
| 73817 | 182.61060 | 39.41312 | 25.443(18) | 27.023(10) | 27.046(28) |
| 41386 | 182.61072 | 39.41676 | 24.514(25) | 26.120(14) | 25.980(19) |
| 76745 | 182.61148 | 39.41319 | 24.180(18) | 25.788(12) | 25.006(10) |
| 59463 | 182.61307 | 39.41580 | 25.214(12) | 27.507(20) | 25.217(14) |
| 37771 | 182.61457 | 39.41887 | 24.647(26) | 26.168(17) | 25.918(29) |
| 158737 | 182.61525 | 39.40575 | 23.987(21) | 25.580(13) | 25.294(17) |
| 149856 | 182.61543 | 39.40682 | 25.981(18) | 27.548(15) | 26.883(35) |
| 35238 | 182.61730 | 39.42037 | 25.395(16) | 26.940(19) | 26.669(27) |
| 118806 | 182.61890 | 39.41185 | 25.562(12) | 27.048(16) | 26.451(26) |
| 60500 | 182.61891 | 39.41829 | 24.209(23) | 25.890(11) | 25.572(16) |
| 202324 | 182.61935 | 39.40209 | 26.180(19) | 27.798(18) | 27.990(50) |
Note. — Coordinates are based on the WCS solution of the first F350LP image. Uncertainties are given in parentheses and are expressed in units of mmag. This table is available in its entirety in machine-readable form.
F555W & F814W
We performed F555W and F814W photometry using a modified version of ALLFRAME which fixes the stellar positions during the PSF fitting. We ran ALLFRAME on the F350LP, F555W, and F814W master images, with positions fixed to those derived from the aforementioned F350LP time-series photometry. This method kept the stellar centroids from drifting during the PSF fit and provided high precision F555W and F814W flux measurements. We based the optical magnitude calibration on the photometric measurements from this step. Our analysis does not include time-series photometry for F555W & F814W. Instead we phase-corrected the master-image photometry to mean magnitudes based on the F350LP light curves (see §4.2 for details).
F160W
While the F350LP stellar catalog contained a complete set of detectable sources in F555W and F814W, it did not include a large number of redder objects that appear only in the F160W image. We simultaneously fit all the point sources in the F160W image by combining the list of F350LP objects that were detected in F160W with those that were found only in the NIR. We first transformed the positions of the F350LP catalog to the F160W frame and performed a preliminary PSF fit. We then subtracted any detected stars from the F160W master image and obtained a residual image. After that, we ran a two-pass 3 source detection on the residual image to find additional sources that only appeared in F160W. Finally, we combined the lists to form a complete F160W source input catalog and performed iterative PSF fitting using ALLSTAR in fix-position mode to obtain the final F160W photometry. As with F555W and F814W, we did not perform time-series photometry on the F160W images.
3 Cepheid Search
We searched for Cepheids in NGC 4151 using a combination of template fitting and visual inspection.
3.1 Variable Candidate Selection
We selected candidate variables using the widely-used Stetson (1996) index, which measures the significance of variability in a light curve taking measurement error into account. In our case, is reduced to
where sgn is a function that returns for negative values and 1 otherwise, , , , and are the total number of measurements, the th magnitude, the th photometric uncertainty, and the weighted mean magnitude, respectively, for F350LP. Constant stars should have , while Cepheids should exhibit positive (Stetson, 1996).
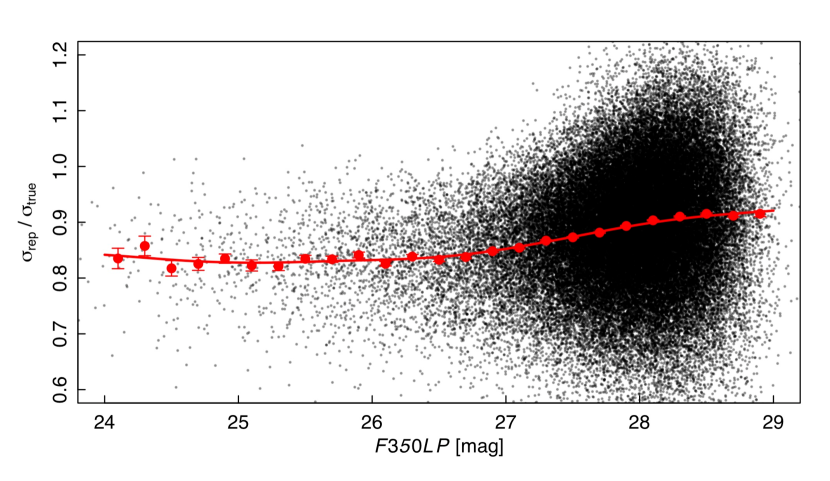
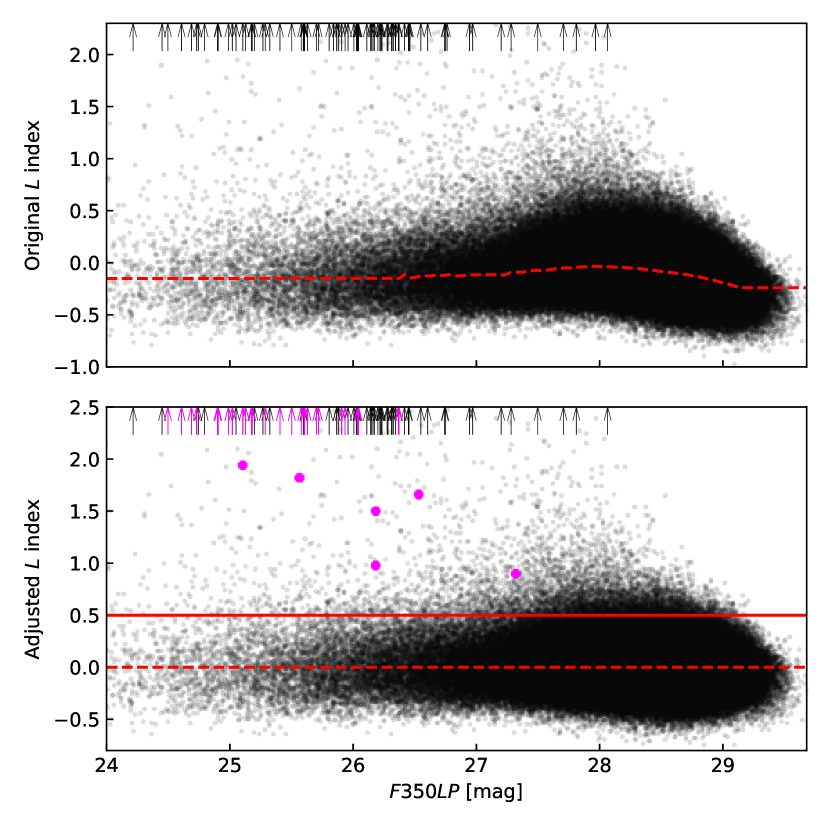
In practice, the photometric uncertainties reported by ALLFRAME are known to exhibit nonlinear and magnitude-dependent biases (as illustrated in Fig. 3) which often lead to a nonuniform shape for the variability–magnitude (–) distribution (Kaluzny et al., 1998). Instead of rescaling measurement errors, we subtracted the median curve of the – relation. The original and adjusted relations are shown in Fig. 4. We conservatively chose and selected 6,956 variable candidates out of 403,738 objects. For reference, Stetson (1996) adopted while Hoffmann et al. (2016) used .
3.2 Cepheid Template Fit
Thanks to their periodicity and predictable light curve shapes, Cepheids with sparse sampling can be accurately characterized with template-fitting methods (e.g. Stetson, 1996; Tanvir et al., 2005). We made use of the Yoachim et al. (2009) V-band Cepheid templates, which are well applicable to the F350LP data given the similarity in effective wavelength between these two filters.
Similar to the practice of Shappee & Stanek (2011) and Hoffmann et al. (2016), we modified the Yoachim et al. (2009) fitting method by letting the Cepheid amplitude be a free parameter. Their templates were derived from eighth-order Fourier series, whose coefficients were firstly transformed into 4 leading parameters obtained from principal component analysis (PCA) and then modeled as polynomial functions of period. This yields fixed template amplitudes for a given period. Since Cepheids with the same period span a range of amplitudes (Stetson, 1996), which are arguably sensitive to metallicity (see Szabados & Klagyivik, 2012; Majaess et al., 2013), we solved for the amplitude as a free parameter in our template-fitting procedure as neither well-calibrated metallicity–amplitude relation nor metallicity measurement for individual Cepheids is available for our case. The fitting model is expressed as
where , , , and are free parameters for mean magnitude, amplitude, period, and initial phase, respectively. is a period-dependent factor that scales the amplitudes of those original templates to unity. and are the mean and th PCA vector, respectively. Polynomialj represents the th polynomial function as shown in Fig. 8 of Yoachim et al. (2009). The allowed ranges of the free parameters were mag, days, and .
We fit the templates to all the variable candidates and derived the best-fit parameters, despite the fact that most of them are not Cepheids. This is the reason we allow the fitting parameters to extend beyond the expected range of Cepheids in our template fitting procedure. We adopted the SLSQP method (Kraft, 1988) to search for the least square fit. To find the global minimum of the , in each fit we used 1500 initial guesses for the nonlinear spaces and , forming a meshgrid of 150 logarithmically spaced trial periods and 10 evenly spaced trial phases. We determined a template error of 0.05 mag using the OGLE Cepheid light curves (Soszynski et al., 2008), and added it to the covariance matrix in quadrature. We obtained the best-fit “periods” and “amplitudes” for all the candidate variables.
We rejected objects exhibiting unrealistic amplitudes or periods that are longer than the observation baseline by 20%, then visually inspected the remaining light curve fits to identify Cepheid candidates. We computed the F350LP amplitudes () of template fits, and rejected objects with mag or mag. Given the limited time span of the observations, we also restricted the visual selection sample to objects with “periods” shorter than 90 days. We visually inspected the light curves of 4,544 objects that survived these cuts and subjectively identified 136 Cepheid candidates that fit well to the saw-tooth shaped templates, with a philosophy that sample cleanliness is more important than completeness.
3.3 Color & Period Cuts
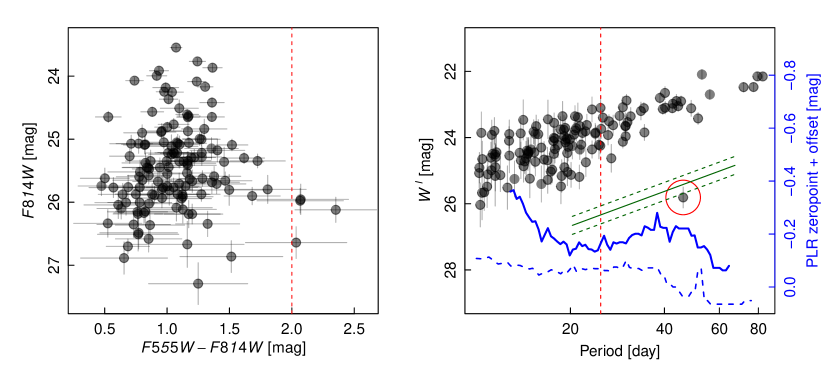
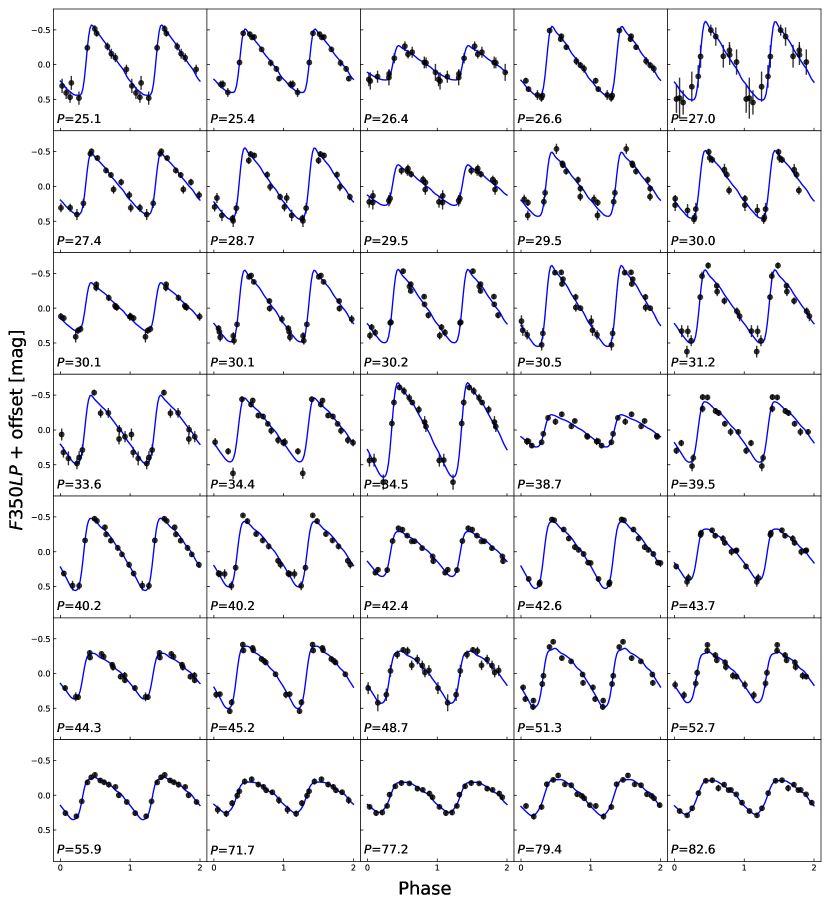
We inspected the colors and the optical Wesenheit PLR of the Cepheid candidates and applied additional cuts on color and period shown in Fig. 5. We rejected 4 candidates with mag, which are possibly due to extreme reddening or measurement errors. We found that the scatter of the optical Wesenheit PLR was significantly larger for d. Since the optical color is used in the NIR Wesenheit distance determination, we excluded 96 candidates with d. We further rejected one possible RV Tauri variable that is 8 off the classical Cepheid PLR, leaving 35 long period ( d) Cepheids that survived all cuts. We present their light curves in Fig. 6. To investigate how the distance modulus is sensitive to the adopted period cutoff, we fit PLRs to subsamples of Cepheids with width of 0.2 dex running across the available period range like a “boxcar.” The PLR zeropoint variations of this running boxcar are shown in Fig. 5 with the blue solid curve. The steep drop in the d region is likely due to the incompleteness of low SNR Cepheids. The standard deviation of the zeropoint variation in the d region is 0.05 mag, consistent with the random error of the PLR zeropoint. We also tested the zeropoint variations as a function of minimum period cutoff, as shown in Fig. 5 with the blue dashed curve. Again, the standard deviation of their zeropoint variations is consistent with the random error of the PLR zeropoint. We find no detectable systematic distance error associated with the adopted d cutoff.
4 Results
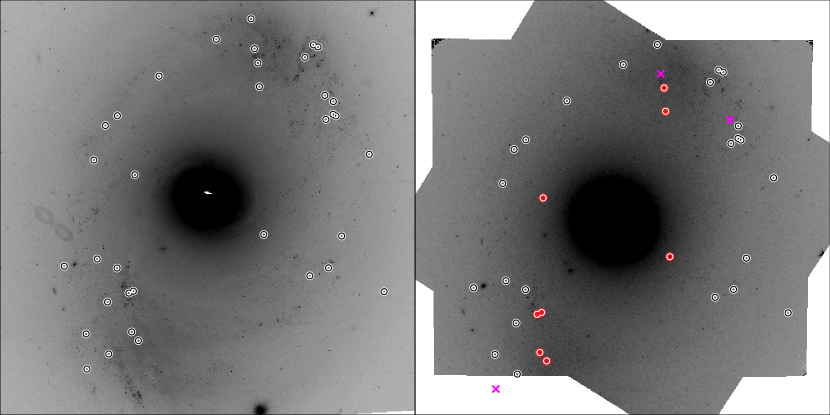
As described in §2.3, our photometry strategy allowed us to track the F160W Cepheid measurements by ID. We measured the F160W magnitudes for 32 out of the 35 optically identified Cepheids, with one of them off the F160W frame and two that were not detected in the F160W frame. We computed their crowding bias in photometry for both F160W and optical data using artificial star tests, and calibrated their magnitudes onto the Vega system. Finally, we obtained the optical and NIR Wesenheit PLRs of these Cepheids and derived the distance to NGC 4151.
4.1 Crowding Correction
We corrected for photometric bias including crowding through artificial star tests. “Crowding” refers to the measurement bias in crowded-field PSF photometry. This effect is location- and image-specific and highly dependent on the exact method used to carry out the photometry. It is usually characterized via artificial star tests (e.g., Stetson & Harris, 1988; Gallart et al., 1996; Holtzman et al., 2006). We estimated the bias of our photometric procedure by injecting and measuring one artificial star at a time in the vicinity of each Cepheid. We repeated this process 100 times (200 times for F160W) in order to obtain statistically solid estimates. We also measured the dispersion of the recovered magnitudes of the artificial stars to obtain an estimate of the measurement uncertainty, which was added in quadrature to the Cepheid photometric errors. The magnitudes of artificial stars were based on the periods of their counterpart Cepheids and best-fit Cepheid PLRs, and as a result multiple realizations of the artificial star tests were performed to update the Cepheid PLRs with iteratively-determined corrections. We found mean corrections of 0.011, 0.006, 0.010, and 0.047 mag for F350LP, F555W, F814W, and F160W, respectively. The aim of the artificial star test is to measure the brightness of artificial stars in exactly the same way as for real stars, such that any bias in the real star photometry appears at the same level in the artificial star photometry. The specific size or scale of bias corrections are strongly dependent on the method and parameters used to measure the source photometry. Two of the most significant factors which impact the size of bias corrections include the minimum separation of nearest neighbor sources which may be de-blended from the source and the methods and statistics use to determine the local sky value. However, once corrected for the measured bias, accurate photometry should not be method-dependent. So we once again note that these crowding correction values are highly dependent on the adopted photometry strategy and thus cannot not be compared with crowding corrections obtained using different methods and/or applied to other data sets. The only meaningful comparison should be based on fully corrected and calibrated magnitudes for the same stars in the same images.
The term “blending bias” is sometimes interpreted differently from crowding bias (Mochejska et al., 2000, 2001). While in practice crowding and blending can be highly degenerate or interchangeable (e.g., Ferrarese et al., 2000; Riess et al., 2016), the chance of physical associations between Cepheids and unresolved clusters or companion stars may lead to a bias if one assumes a uniform crowding level in the vicinity of a Cepheid where artificial stars are tested. Anderson & Riess (2018) cleared up some vague interpretations in earlier literature on this matter through quantitative studies of Cepheid companions and the physical association between Cepheids and open clusters, and found millimag-level biases on the distance modulus due to these effects. We thus excluded such an additional bias correction from our results.
4.2 Magnitude Calibration
We calibrated the Cepheid magnitudes onto the Vega system by adding the aforementioned crowding correction, as well as phase sampling correction, aperture correction, and Vega zeropoints, to be discussed below.
By convention, the mean magnitude of a Cepheid refers to its intensity mean over a full cycle. However, the directly measured magnitudes from the drizzle combined images are sparsely sampled and do not exactly cover one cycle. We computed the offset between the directly measured magnitude and full-cycle intensity mean using the best-fit F350LP template for each Cepheid. For the F555W and F814W band, we scaled the amplitude of the F350LP light curve by the relation in Table 2 of Hoffmann et al. (2016). By simulating F160W light curves (sinusoidal shape assumed) of a typical 0.3 mag amplitude, we found that the F160W phase corrections are marginal due to the small amplitude, and thus we did not include them in the calibration. While based on the same idea, the exact mathematical treatment for our phase correction is slightly different from that of Inno et al. (2013) and Soszyński et al. (2005). In our case, we measured the Cepheid magnitudes based on stacked images (to take advantage of higher SNR than single-epoch images), which contain the integrated flux from multiple epochs. We computed the expected flux offset of a Cepheid between what is measured from the stacked image and the mean flux of a full template cycle, then added this offset back to the measured stacked flux to obtain the mean intensity. We determined 0.016 and 0.005 mag systematic errors associated with phase correction for and , respectively.
| ID | R.A. | Decl. | Ampl. | F350LP | F555W | F814W | F160W | SBc | Fd | F555W | F814W | F160W | |
|---|---|---|---|---|---|---|---|---|---|---|---|---|---|
| [J2000]a | [day] | [mag] | [mag(mmag)]b | [mmag(mmag)]e | |||||||||
| 365142 | 182.636887 | 39.389159 | 10.880 | 0.826 | 26.794( 83) | 26.986(170) | 26.171(172) | 210.6 | s | -9( 95) | 22(142) | ||
| 367447 | 182.638440 | 39.389584 | 16.919 | 0.719 | 26.625( 72) | 26.732( 98) | 26.101(166) | 224.0 | s | -13( 77) | 16(109) | ||
| 391593 | 182.645567 | 39.390032 | 10.225 | 0.663 | 26.860(110) | 26.879(129) | 26.024(185) | 248.7 | s | -24(107) | 31(151) | ||
| 391936 | 182.649235 | 39.391621 | 21.427 | 1.017 | 25.830( 88) | 25.970(113) | 25.271(113) | 281.6 | s | -28( 92) | -1( 99) | ||
| 384416 | 182.647476 | 39.391687 | 12.753 | 0.534 | 26.609(106) | 26.751(119) | 25.793(214) | 273.5 | s | 8( 99) | 33(191) | ||
| 388289 | 182.649585 | 39.392186 | 15.783 | 0.660 | 26.440(138) | 26.582(149) | 25.415(171) | 294.3 | s | -7(130) | 19(157) | ||
| 395256 | 182.652095 | 39.392541 | 25.412 | 0.914 | 25.535( 63) | 25.819( 81) | 24.766( 93) | 23.877(483) | 292.1 | h | 11( 68) | 42( 84) | 202(467) |
| 374104 | 182.646879 | 39.392583 | 33.649 | 0.987 | 26.446( 53) | 26.917(140) | 25.300( 85) | 23.734(324) | 280.4 | h | -8( 38) | -12( 57) | 8(316) |
| 336764 | 182.638068 | 39.392912 | 44.275 | 0.657 | 25.121( 39) | 25.378( 42) | 24.366( 60) | 23.588(223) | 252.0 | h | 4( 34) | 11( 38) | 20(204) |
| 380637 | 182.650438 | 39.393431 | 14.158 | 0.588 | 26.369(130) | 26.449(155) | 25.761(188) | 309.9 | s | -15(146) | 25(163) | ||
Note. — : Coordinates are based on the WCS solution of the first F350LP image. : Fully calibrated Vega magnitudes, including crowding corrections and their uncertainties. : F160W-band local surface brightness in the units of counts/s/sq arcsec. : Flag (including s, h, r, o, and c) indicating Cepheids rejected due to short periods (s; see §3.3), used for PLR (h), rejected due to high SB (r), possible RV Tauri variable (o), or rejected due to red color (c). : Crowding corrections with uncertainties shown in parentheses. This table is available in its entirety in machine-readable form.
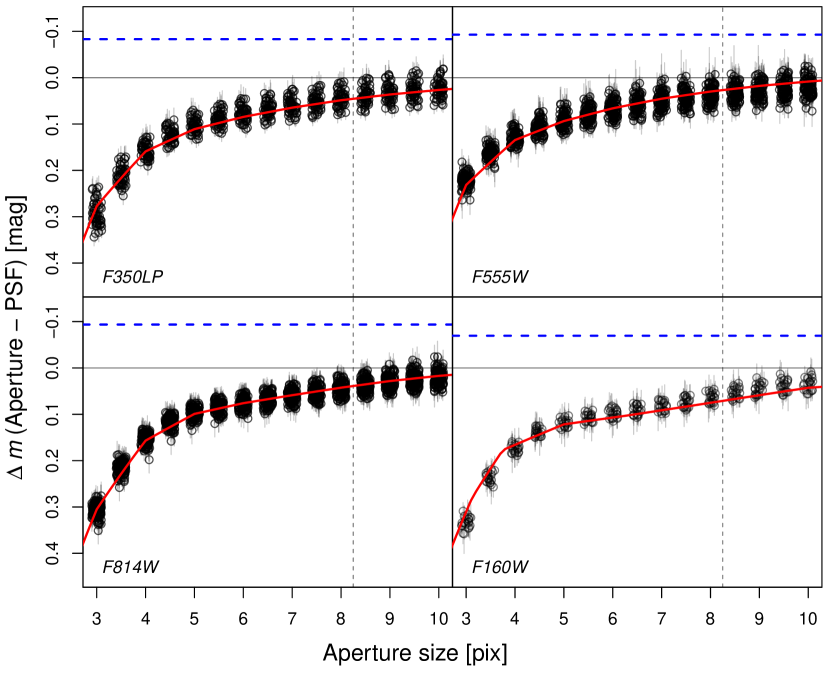
We derived the aperture correction and Vega zeropoints using the PySynphot v0.9.12 package (STScI Development Team, 2013). Due to the lack of isolated bright stars in the NGC 4151 field, we derived PSF models and their aperture corrections based on HST images taken with a similar configuration. We selected hundreds of suitable stars from the images acquired by the SH0ES team (Riess et al., 2016), who observed Cepheids in dozens of nearby galaxies. For F160W, we made use of archival observations of the standard star P330E to construct the PSF model. We measured the aperture magnitudes of a series of aperture sizes using DAOPHOT, and computed their offsets against the PSF magnitudes, as shown in Fig. 7. These offsets were then fit to the growth curve obtained from PySynphot by adjusting only the -intercept of those red curves in Fig. 7. Since the offset between the magnitude measured in a certain aperture and an infinite aperture is fixed, and the offset between instrumental and Vega magnitudes is well established for these instruments and filters, we were able to convert the instrumental PSF magnitudes to infinite-aperture Vega magnitudes. We adopted a conservative 0.02 mag systematic uncertainty since we used the average of many calibrating stars in the aforementioned SH0ES fields to calibrate a different field, NGC 4151.
We list the properties and fully calibrated magnitudes of our Cepheid sample, including the rejected candidates, in Table 4. The locations of the Cepheids in the final sample are shown in Fig. 8.

| Index | Expression | Slope | Intercept | Scatter | |||
|---|---|---|---|---|---|---|---|
| LMC | NGC 4151 | ||||||
| -3.31 | 15.933 | 28.426 | 0.348 | 35 | |||
| -3.26 | 15.915∗ | 28.449 | 0.295 | 24 | |||
Note. — : Intercept was determined based on the data in Table 2 of Riess et al. (2019) which includes the CRNL term. It is greater than the corresponding value in Table 3 of Riess et al. (2019) by 0.03 mag because that table did not include the CRNL term despite its note to the contrary (Riess, private communication).
4.3 Cepheid PLRs
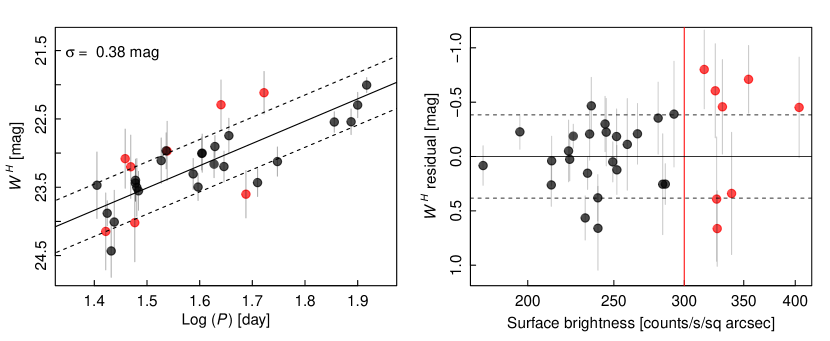
We adopted the Wesenheit indices and Cepheid PLR calibrations of Riess et al. (2019), who used the same combination of filters. Since the crowding level varies significantly across our field, we inspected the PLR residuals against crowding using local surface brightness () as an indicator, as shown in Fig. 9. We observed an increased scatter at high levels, and thus restricted our sample to objects with counts/s/sq arcsec for the PLR. This surface brightness cut reduced the scatter in the PLR by 23%. A cut based on the crowding correction uncertainty () gives a result consistent with the cut to the level of PLR random error. We tested the PLR zeropoint variation for various cuts from 0.15 mag to 0.4 mag, and obtained a standard deviation of 0.05 mag for the resultant distance moduli, which is consistent with the random error of the PLR. We concluded that the systematic error due to crowding correction, if it exists, is smaller than the random error, and excluded such a term in the final error budget. We present the final optical () and NIR () PLRs in Fig. 10 and in Table 5. We note that the F160W count-rate non-linearity correction is included in the LMC calibration of Riess et al. (2019).
4.4 Distance to NGC 4151
We adopted the LMC as the single anchor for this work, as both its Cepheid PLRs and absolute distance have the highest precision to date (Riess et al., 2019; Pietrzyński et al., 2019). We fixed the slopes of the PLRs to those derived by Riess et al. (2019) and computed the PLR intercept offsets between the LMC and NGC 4151. We derived relative distance moduli of and mag using the and PLRs, respectively, and a weighted mean of mag. Adding the geometrically determined LMC distance modulus of mag (Pietrzyński et al., 2019), we obtained a distance modulus for NGC 4151 of mag ( Mpc).
The leading error sources in our distance determination are: the random error due to PLR scatter, the sensitivity of the zeropoint on the adopted PLR slope, the uncertainty in the absolute distance to the LMC, the aperture corrections (see §4.2) and the metallicity dependence of Cepheid PLRs. We present the full error budget in Table 6.
To estimate the distance error due to metallicity, we multiplied the scatter of [O/H] measurements in 21 galaxies presented by Riess et al. (2016) by the metallicity term coefficients ( and per dex of [O/H] for and , respectively) in Equation 2 of Riess et al. (2016). Due to the lack of consistent [O/H] measurements for this system, we did not apply a metallicity correction for NGC 4151.
We investigated the systematic uncertainties due to reddening law by testing a range of values. For the optical Wesenheit index , we computed the color term coefficient for ranges from 2.9 to 3.3 by convolving the Cardelli et al. (1989) extinction curve with the WFC3 filter transmission functions, then applied them to both the LMC and NGC 4151 Cepheid samples with PLR slope fixed to the Riess et al. (2019) choice. Because only the differential effect between the two galaxies contributes to the NGC 4151 distance calibration, the systematic uncertainty due to the choice of reddening law is secondary, as shown in the left panel of Fig. 11. We adopted a conservative uncertainty of 0.01 mag for the -based distance. We performed the same test for the NIR Wesenheit index with reddening laws of using Fitzpatrick (1999), the same formulation adopted by Riess et al. (2016, 2019). As expected, we found an even weaker distance dependence on the reddening law for , as shown in the right panel of Fig. 11.
We studied the NGC 4151 distance dependence on the PLR slopes by redetermining the PLR slopes for various reddening laws using only the LMC sample studied by Riess et al. (2019). We excluded the same outliers (OGL0992 and OGL0847) as Riess et al. (2019) in our calculations, though we note including them did not change the results. We found steeper -band slopes than Riess et al. (2019), who constrained the PLR slope with a much broader Cepheid sample. The distance variations of using these LMC sample constrained and reddening law dependent slopes are shown with dashed lines in Fig. 11. We adopted the 0.033 mag offset due to steeper -band slopes as a systematic error on the -based distance modulus.
| Source | ||
|---|---|---|
| (mag) | (mag) | |
| PLR scatter | 0.06 | 0.06 |
| PLR slope | 0.033 | |
| LMC distance | 0.026 | 0.026 |
| Magnitude calibration | 0.02 | 0.02 |
| Metallicity | 0.03 | 0.02 |
| Phase correction | 0.016 | 0.005 |
| Reddening law | 0.01 | |
| Total | 0.077 | 0.079 |

5 Discussion
5.1 Black Hole Masses
One of the primary reasons for undertaking this investigation has been to facilitate comparisons among various methods of determining the masses of the central black holes in these galaxies. NGC 4151 and NGC 3227 are among a handful of galaxies for which the black hole radius of influence , where is the stellar velocity dispersion, is resolved so masses based on stellar or gas dynamical modeling have high credibility. An accurate distance is required since masses based on stellar or gas dynamics are distance dependent. Masses based on reverberation mapping are, by contrast, distance-independent. Reverberation-based masses are computed from
| (1) |
where is the reverberation time lag between continuum and emission-line flux variations, is the emission line width, and is a dimensionless scaling factor of order unity that depends on the inclination, geometry, and kinematics of the broad emission-line region. The scale factor can be determined by detailed modeling of reverberation data (e.g., Pancoast et al., 2014a; Grier et al., 2017; Horne et al., 2020) and seems to be most sensitive to inclination (Grier et al., 2017). In the absence of detailed modeling, it is customary to use an average scaling factor (Onken et al., 2004) that is determined by assuming that both quiescent and active galaxies follow the same relationship between black hole mass and bulge velocity dispersion (Ferrarese & Merritt, 2000; Gebhardt et al., 2000; Gültekin et al., 2009). The most recent calibration gives (Batiste et al., 2017) with an error on the mean of dex and a standard deviation of dex. Since detailed reverberation models of NGC 3227 and NGC 4151 are not yet available, we use this value here, and note that this introduces a systematic uncertainty of dex.
In Table 5.1, we show various mass determinations for both NGC 3227 and NGC 4151 along with assumed distances for each investigation. Our preferred distance to NGC 3227 is based on a surface brightness fluctuation measurement of its interacting elliptical companion, NGC 3226, as determined by Tonry et al. (2001) with a correction by Blakeslee et al. (2010). Table 5.1 also shows mass measurements for the central black hole in both galaxies adjusted to our preferred distances of 23.7 Mpc for NGC 3227 and 15.8 Mpc for NGC 4151.
| Source | Ref. | Method | (Mpc) | |
|---|---|---|---|---|
| (1) | (2) | (3) | (4) | (5) |
| NGC 3227 | 1 | stars | ||
| NGC 3227 | 2 | gas | ||
| NGC 4151 | 3 | stars | ||
| NGC 4151 | 2 | gas | ||
| NGC 3227 | 1,4,5 | stars | ||
| NGC 3227 | 2,4,5 | gas | ||
| NGC 3227 | 6 | RM | ||
| NGC 4151 | 3,7 | stars | ||
| NGC 4151 | 2,7 | gas | ||
| NGC 4151 | 7,8 | gas | ||
| NGC 4151 | 6 | RM |
Note. — Columns are: 1: Source; 2: References; 3: “stars” refers to stellar dynamical modeling, “gas” refers to gas dynamical modeling, “RM” refers to reverberation mapping; 4: Distance assumed; 5: Black hole mass.
The top part of this table contains the original mass measurements assuming the distances listed, while the two lower parts show the adjusted masses.
The mass measurements for the SMBH in NGC 4151 include a recent determination based on gas dynamics using integral field spectroscopy (Hicks et al., in preparation) and the various techniques applied to this system are in excellent agreement. On the other hand, even with the currently large systematic uncertainty in the reverberation-based masses, the corresponding estimate for NGC 3227 is much lower than the values based on stellar or gas dynamics. However, these differences can be understood as an inclination effect; indeed, unification models (Antonucci, 1993) predict that Type 1 AGNs, like NGC 3227 and NGC 4151, are preferentially at lower rather than higher inclination. If , which is appropriate for a thin disk, this would imply , which is consistent with the inclination of the narrow-line region (Fischer et al., 2013, though note in their paper the inclination given is the complement of the standard definition), but not with the less-reliable inclination of inferred from the Fe K profile (Patrick et al., 2012). However, the inclination of the narrow-line region in NGC 4151 is only (Winge et al., 1999), so a similar inclination correction introduces some tension in the mass comparison. The conclusion we draw from this is that velocity-resolved reverberation mapping is required for a meaningful mass comparison in individual sources because the unknown geometry and inclination of the BLR makes reverberation-based mass measurement using only lag and line width too uncertain.
5.2 Other Implications
We noted in the Introduction that a wide range of distances have been reported for NGC 4151. The distance of Mpc derived by Hönig et al. (2014) by combining near-IR interferometry with dust reverberation is % larger than our Cepheid-based distance, but statistically consistent. On the other hand, the dust-reverberation distance of Mpc (Yoshii et al., 2014) is nearly a factor of two larger than our measurement, probably because at least one assumption in the theoretical prediction of the dust torus radius is incorrect; indeed, of the 17 objects studied, only two of 16 yielded distances consistent within the errors with the standard luminosity distance (we will discuss a Cepheid-based distance for the remaining source, NGC 4051, in a subsequent paper).
The improved distance allowed us to improve both mass and energetics in one of the nearest and best targets to study the physics of active nuclei on small scales. For example, Storchi-Bergmann et al. (2009) derived masses of ionized and hot molecular gas. These masses scale as , and our revised distance thus increases these masses by 41%. Similarly, the mass of ionized gas in the outflow that was calculated as becomes . Storchi-Bergmann et al. (2010) derived the mass outflow rate and outflow power. These both scale with , because the rates are calculated at a certain distance from the nuclear source; thus these quantities are proportional to , and therefore should be increased by 19%.
6 Summary
We obtained multiband time-series observations of the archetypical Seyfert 1 galaxy NGC 4151 with the Hubble Space Telescope and identified over 130 Cepheid candidates in this system. We used a subset of 35 long-period (d) Cepheids to derive a distance of Mpc using the Near-Infrared Cepheid Period–Luminosity Relation.
The precise Cepheid-based distance enabled us to update previous dynamical mass determinations for the SMBH in this AGN, which yield consistent values of dex. These, in turn, are in good agreement with mass estimates based on reverberation mapping.
References
- Anderson & Riess (2018) Anderson, R. I., & Riess, A. G. 2018, ApJ, 861, 36, doi: 10.3847/1538-4357/aac5e2
- Antonucci (1993) Antonucci, R. 1993, ARA&A, 31, 473, doi: 10.1146/annurev.aa.31.090193.002353
- Batiste et al. (2017) Batiste, M., Bentz, M. C., Raimundo, S. I., Vestergaard, M., & Onken, C. A. 2017, ApJ, 838, L10, doi: 10.3847/2041-8213/aa6571
- Bentz et al. (2019) Bentz, M. C., Ferrarese, L., Onken, C. A., Peterson, B. M., & Valluri, M. 2019, ApJ, 885, 161, doi: 10.3847/1538-4357/ab48fb
- Bentz et al. (2013) Bentz, M. C., Denney, K. D., Grier, C. J., et al. 2013, ApJ, 767, 149, doi: 10.1088/0004-637X/767/2/149
- Blakeslee et al. (2010) Blakeslee, J. P., Cantiello, M., Mei, S., et al. 2010, ApJ, 724, 657, doi: 10.1088/0004-637X/724/1/657
- Bottinelli et al. (1984) Bottinelli, L., Gouguenheim, L., Paturel, G., & de Vaucouleurs, G. 1984, A&AS, 56, 381
- Bottinelli et al. (1985) —. 1985, A&AS, 59, 43
- Burtscher et al. (2013) Burtscher, L., Meisenheimer, K., Tristram, K. R. W., et al. 2013, A&A, 558, A149, doi: 10.1051/0004-6361/201321890
- Cackett et al. (2007) Cackett, E. M., Horne, K., & Winkler, H. 2007, MNRAS, 380, 669, doi: 10.1111/j.1365-2966.2007.12098.x
- Cardelli et al. (1989) Cardelli, J. A., Clayton, G. C., & Mathis, J. S. 1989, ApJ, 345, 245, doi: 10.1086/167900
- Crenshaw & Kraemer (2007) Crenshaw, D. M., & Kraemer, S. B. 2007, ApJ, 659, 250, doi: 10.1086/511970
- Das et al. (2005) Das, V., Crenshaw, D. M., Hutchings, J. B., et al. 2005, AJ, 130, 945, doi: 10.1086/432255
- Davies et al. (2006) Davies, R. I., Thomas, J., Genzel, R., et al. 2006, ApJ, 646, 754, doi: 10.1086/504963
- De Rosa et al. (2018) De Rosa, G., Fausnaugh, M. M., Grier, C. J., et al. 2018, ApJ, 866, 133, doi: 10.3847/1538-4357/aadd11
- de Vaucouleurs et al. (1981) de Vaucouleurs, G., Peters, W. L., Bottinelli, L., Gouguenheim, L., & Paturel, G. 1981, ApJ, 248, 408, doi: 10.1086/159166
- Esquej et al. (2014) Esquej, P., Alonso-Herrero, A., González-Martín, O., et al. 2014, ApJ, 780, 86, doi: 10.1088/0004-637X/780/1/86
- Ferrarese & Ford (2005) Ferrarese, L., & Ford, H. 2005, Space Sci. Rev., 116, 523, doi: 10.1007/s11214-005-3947-6
- Ferrarese & Merritt (2000) Ferrarese, L., & Merritt, D. 2000, ApJ, 539, L9, doi: 10.1086/312838
- Ferrarese et al. (2000) Ferrarese, L., Silbermann, N. A., Mould, J. R., et al. 2000, PASP, 112, 177, doi: 10.1086/316520
- Fischer et al. (2013) Fischer, T. C., Crenshaw, D. M., Kraemer, S. B., & Schmitt, H. R. 2013, The Astrophysical Journal Supplement Series, 209, 1, doi: 10.1088/0067-0049/209/1/1
- Fitzpatrick (1999) Fitzpatrick, E. L. 1999, PASP, 111, 63, doi: 10.1086/316293
- Gallart et al. (1996) Gallart, C., Aparicio, A., & Vilchez, J. M. 1996, AJ, 112, 1928, doi: 10.1086/118153
- Gebhardt et al. (2000) Gebhardt, K., Bender, R., Bower, G., et al. 2000, ApJ, 539, L13, doi: 10.1086/312840
- Gravity Collaboration et al. (2018) Gravity Collaboration, Sturm, E., Dexter, J., et al. 2018, Nature, 563, 657, doi: 10.1038/s41586-018-0731-9
- Grier et al. (2017) Grier, C. J., Pancoast, A., Barth, A. J., et al. 2017, ApJ, 849, 146, doi: 10.3847/1538-4357/aa901b
- Gültekin et al. (2009) Gültekin, K., Richstone, D. O., Gebhardt, K., et al. 2009, ApJ, 698, 198, doi: 10.1088/0004-637X/698/1/198
- Hicks & Malkan (2008) Hicks, E. K. S., & Malkan, M. A. 2008, The Astrophysical Journal Supplement Series, 174, 31, doi: 10.1086/521650
- Hoffmann et al. (2016) Hoffmann, S. L., Macri, L. M., Riess, A. G., et al. 2016, ApJ, 830, 10, doi: 10.3847/0004-637X/830/1/10
- Holtzman et al. (2006) Holtzman, J. A., Afonso, C., & Dolphin, A. 2006, ApJS, 166, 534, doi: 10.1086/507074
- Hönig et al. (2014) Hönig, S. F., Watson, D., Kishimoto, M., & Hjorth, J. 2014, Nature, 515, 528, doi: 10.1038/nature13914
- Horne et al. (2020) Horne, K., De Rosa, G., Peterson, B. M., et al. 2020, arXiv e-prints, arXiv:2003.01448. https://arxiv.org/abs/2003.01448
- Inno et al. (2013) Inno, L., Matsunaga, N., Bono, G., et al. 2013, ApJ, 764, 84, doi: 10.1088/0004-637X/764/1/84
- Iserlohe et al. (2013) Iserlohe, C., Krabbe, A., Larkin, J. E., et al. 2013, A&A, 556, A136, doi: 10.1051/0004-6361/201219998
- Kaluzny et al. (1998) Kaluzny, J., Stanek, K. Z., Krockenberger, M., et al. 1998, AJ, 115, 1016, doi: 10.1086/300235
- Kishimoto et al. (2011) Kishimoto, M., Hönig, S. F., Antonucci, R., et al. 2011, A&A, 527, A121, doi: 10.1051/0004-6361/201016054
- Kraft (1988) Kraft, D. 1988, Forschungsbericht- Deutsche Forschungs- und Versuchsanstalt fur Luft- und Raumfahrt
- Leavitt & Pickering (1912) Leavitt, H. S., & Pickering, E. C. 1912, Harvard College Observatory Circular, 173, 1
- Majaess et al. (2013) Majaess, D., Turner, D., Gieren, W., Berdnikov, L., & Lane, D. 2013, Ap&SS, 344, 381, doi: 10.1007/s10509-012-1331-z
- McConnell & Ma (2013) McConnell, N. J., & Ma, C.-P. 2013, ApJ, 764, 184, doi: 10.1088/0004-637X/764/2/184
- Mochejska et al. (2000) Mochejska, B. J., Macri, L. M., Sasselov, D. D., & Stanek, K. Z. 2000, AJ, 120, 810, doi: 10.1086/301493
- Mochejska et al. (2001) —. 2001, arXiv e-prints, astro. https://arxiv.org/abs/astro-ph/0103440
- Onken et al. (2004) Onken, C. A., Ferrarese, L., Merritt, D., et al. 2004, ApJ, 615, 645, doi: 10.1086/424655
- Onken et al. (2014) Onken, C. A., Valluri, M., Brown, J. S., et al. 2014, ApJ, 791, 37, doi: 10.1088/0004-637X/791/1/37
- Pancoast et al. (2014a) Pancoast, A., Brewer, B. J., & Treu, T. 2014a, MNRAS, 445, 3055, doi: 10.1093/mnras/stu1809
- Pancoast et al. (2014b) Pancoast, A., Brewer, B. J., Treu, T., et al. 2014b, MNRAS, 445, 3073, doi: 10.1093/mnras/stu1419
- Patrick et al. (2012) Patrick, A. R., Reeves, J. N., Porquet, D., et al. 2012, MNRAS, 426, 2522, doi: 10.1111/j.1365-2966.2012.21868.x
- Peterson (2014) Peterson, B. M. 2014, Space Sci. Rev., 183, 253, doi: 10.1007/s11214-013-9987-4
- Pietrzyński et al. (2019) Pietrzyński, G., Graczyk, D., Gallenne, A., et al. 2019, Nature, 567, 200, doi: 10.1038/s41586-019-0999-4
- Riess et al. (2019) Riess, A. G., Casertano, S., Yuan, W., Macri, L. M., & Scolnic, D. 2019, ApJ, 876, 85, doi: 10.3847/1538-4357/ab1422
- Riess et al. (2016) Riess, A. G., Macri, L. M., Hoffmann, S. L., et al. 2016, ApJ, 826, 56, doi: 10.3847/0004-637X/826/1/56
- Sahu et al. (2019) Sahu, N., Graham, A. W., & Davis, B. L. 2019, ApJ, 887, 10, doi: 10.3847/1538-4357/ab50b7
- Shappee & Stanek (2011) Shappee, B. J., & Stanek, K. Z. 2011, ApJ, 733, 124, doi: 10.1088/0004-637X/733/2/124
- Shimono et al. (2010) Shimono, A., Sugai, H., Kawai, A., et al. 2010, Publications of the Astronomical Society of Japan, 62, 225, doi: 10.1093/pasj/62.2.225
- Soszyński et al. (2005) Soszyński, I., Gieren, W., & Pietrzyński, G. 2005, PASP, 117, 823, doi: 10.1086/431434
- Soszyński et al. (2008) Soszyński, I., Udalski, A., Szymański, M. K., et al. 2008, Acta Astron., 58, 293. https://arxiv.org/abs/0811.3636
- Soszynski et al. (2008) Soszynski, I., Poleski, R., Udalski, A., et al. 2008, Acta Astron., 58, 163. https://arxiv.org/abs/0808.2210
- Stetson (1987) Stetson, P. B. 1987, Publications of the Astronomical Society of the Pacific, 99, 191, doi: 10.1086/131977
- Stetson (1994) —. 1994, Publications of the Astronomical Society of the Pacific, 106, 250, doi: 10.1086/133378
- Stetson (1996) —. 1996, Publications of the Astronomical Society of the Pacific, 108, 851, doi: 10.1086/133808
- Stetson & Harris (1988) Stetson, P. B., & Harris, W. E. 1988, AJ, 96, 909, doi: 10.1086/114856
- Storchi-Bergmann et al. (2010) Storchi-Bergmann, T., Lopes, R. D. S., McGregor, P. J., et al. 2010, MNRAS, 402, 819, doi: 10.1111/j.1365-2966.2009.15962.x
- Storchi-Bergmann et al. (2009) Storchi-Bergmann, T., McGregor, P. J., Riffel, R. A., et al. 2009, MNRAS, 394, 1148, doi: 10.1111/j.1365-2966.2009.14388.x
- STScI Development Team (2013) STScI Development Team. 2013, pysynphot: Synthetic photometry software package. http://ascl.net/1303.023
- Szabados & Klagyivik (2012) Szabados, L., & Klagyivik, P. 2012, A&A, 537, A81, doi: 10.1051/0004-6361/201117815
- Tanvir et al. (2005) Tanvir, N. R., Hendry, M. A., Watkins, A., et al. 2005, MNRAS, 363, 749, doi: 10.1111/j.1365-2966.2005.09466.x
- Theureau et al. (2007) Theureau, G., Hanski, M. O., Coudreau, N., Hallet, N., & Martin, J. M. 2007, A&A, 465, 71, doi: 10.1051/0004-6361:20066187
- Tonry et al. (2001) Tonry, J. L., Dressler, A., Blakeslee, J. P., et al. 2001, ApJ, 546, 681, doi: 10.1086/318301
- Tsvetkov et al. (2019) Tsvetkov, D. Y., Baklanov, P. V., Potashov, M. S., et al. 2019, MNRAS, 487, 3001, doi: 10.1093/mnras/stz1474
- Tully & Fisher (1977) Tully, R. B., & Fisher, J. R. 1977, A&A, 500, 105
- Tully & Fisher (1988) —. 1988, Catalog of Nearby Galaxies
- Tully et al. (2009) Tully, R. B., Rizzi, L., Shaya, E. J., et al. 2009, AJ, 138, 323, doi: 10.1088/0004-6256/138/2/323
- Ulrich (2000) Ulrich, M. H. 2000, Astronomy and Astrophysics Review, 10, 135, doi: 10.1007/s001590000007
- Wang et al. (2010) Wang, J., Fabbiano, G., Risaliti, G., et al. 2010, ApJ, 719, L208, doi: 10.1088/2041-8205/719/2/L208
- Winge et al. (1999) Winge, C., Axon, D. J., Macchetto, F. D., Capetti, A., & Marconi, A. 1999, ApJ, 519, 134, doi: 10.1086/307337
- Yoachim et al. (2009) Yoachim, P., McCommas, L. P., Dalcanton, J. J., & Williams, B. F. 2009, AJ, 137, 4697, doi: 10.1088/0004-6256/137/6/4697
- Yoshii et al. (2014) Yoshii, Y., Kobayashi, Y., Minezaki, T., Koshida, S., & Peterson, B. A. 2014, ApJ, 784, L11, doi: 10.1088/2041-8205/784/1/L11
- Zubovas & King (2019) Zubovas, K., & King, A. R. 2019, General Relativity and Gravitation, 51, 65, doi: 10.1007/s10714-019-2549-7