Quasi Modes and Density of States (DOS) of 1D Photonics Crystal
Abstract
1-Dimensional (1D) photonics crystals with and without defects have been numerically studied using efficient Transfer Matrix Method (TMM). Detailed numerical recipe of the TMM has been laid out. Dispersion relation is verified for the periodic Photonics Band Gap (PBG) structure. When there are defects, the transmission spectrum can be decomposed into one or more quasi modes with excellent agreement. The Density of States (DOS) is obtained from the phase derivative of the transmission spectrum. Green’s function is also obtained showing much sharper mode characteristics when the excitation source is localized at the peaks of the quasi modes.
2020
S. Liao
1 Introduction
Photonics crystal has been of great interest due to its potential applications in optics filter and low-loss reflection mirror [1], [2]. The transmission spectrum and its phase information of different kinds of photonics crystal has been widely reported using Transfer Matrix Method (TMM) [2]. Experiment on single-mode 1-dimensional (1D) waveguide system has been recently carried out in our group [3]. What’s more, the Green’s function is important in description of random laser [4] and periodic Photonics Band Gap (PBG) structure with defects [3] since the radiation can be understood as convolution of the Green’s function with the source. Also, Local Density of States (LDOS) is closely related to the imaginary part of the Green’s function [5]. The Density of States (DOS), which is the volume integral of the LDOS, is shown to be the phase derivative of the transmission spectrum with respect to frequency for 1D system without loss [6].
2 Transfer Matrix Method
The electromagnetic wave is governed by the Maxwell’s equations and has many applications [8]-[70]. Here we are dealing with the 1D problem in the optics regime.
2.1 Green’s function
The Green’s function is described by
| (1) |
where the delta source is located at .
The boundary conditions are
| (2) | |||||
where denote the right and left sides of the boundary.
2.2 Forward- and backward- propagating waves
The Green’s function in each layer can be expressed as superposition of forward- and back-ward propagating waves,
| (3) |
where is the complex index of refractive.
2.2.1 On the layer boundary
2.2.2 Wave propagations inside layer
The wave propagations inside each layer can be described by a propagators ,
| (11) |
where denote the left and right ends of layer respectively, and
| (14) |
where is the thickness of layer .
2.2.3 The excitation source
From Eq. (4), we know that, away from the source location ,
| (15) |
At the excitation source location, we have
| (18) |
where is complex index of refractive at the source location .
2.3 Numerical recipe
The numerical recipe to obtain the 1D Green’s function is as follows, 1) individually, calculate the transmission and reflection spectra for the segments to the left and to the right sides of the source location , through Eq. (11) and Eq. (15); 2) connect both segments at the source location, through Eq. (18).
2.3.1 The left and right segments
For each segment, we have to cascade the propagator in Eq. (11) and the transfer matrix in Eq. (15), i.e., the cascading procedure has to been done from the end of each segment, where there is only forward propagating wave,
| (21) |
2.3.2 Connect both segments
We now connect both segments at the source location through Eq. (18),
| (22) | |||||
3 Periodic PBG Structure
It is well-known that the dispersion relation of the periodic binary dielectric layers is given by [71],
| (23) |
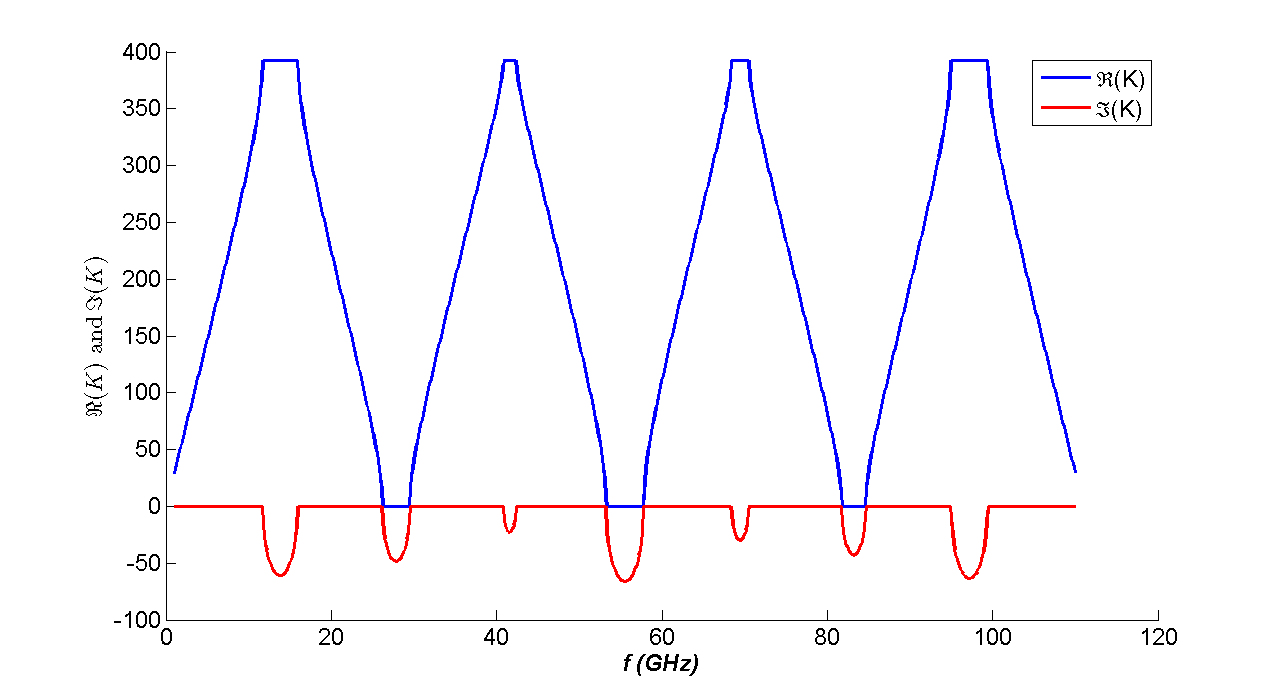
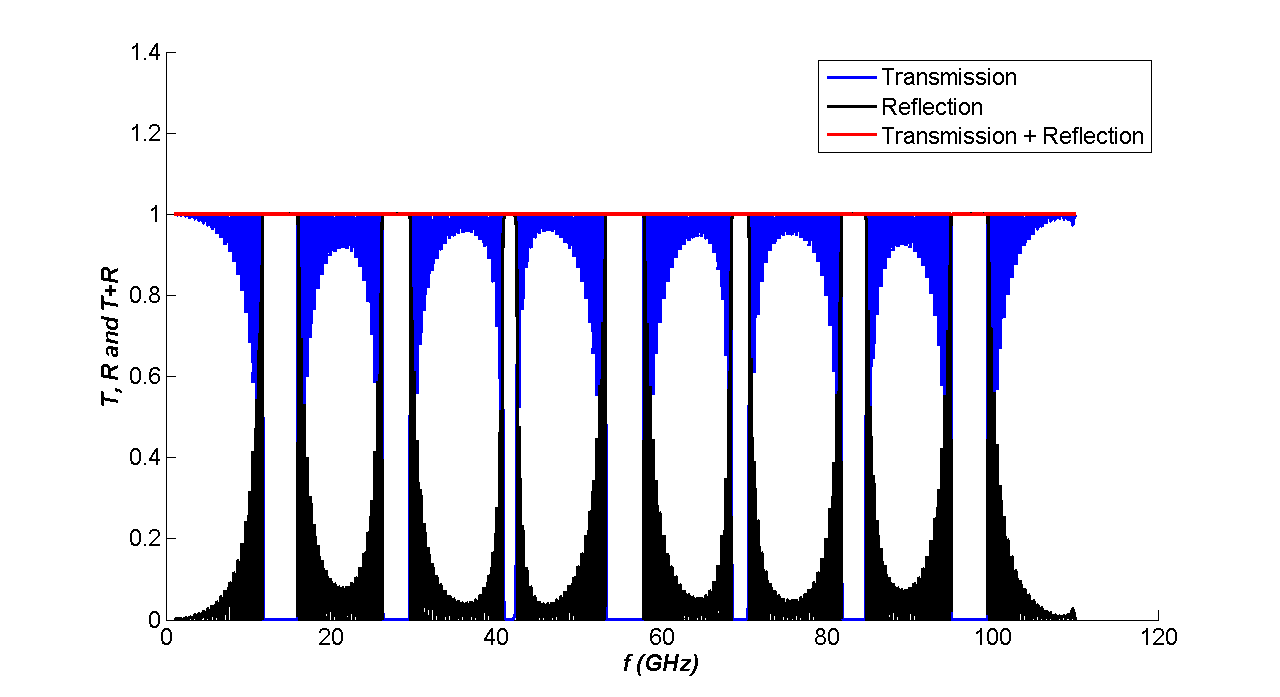
where is the wave vector of the Bloch wave; are the wave vector of the binary pair; is the periodicity of the structure, with being the thickness of each layer. Fig. 1 shows a typical dispersion relation for mm; and ; the frequency ranges from 1 GHz to 110 GHz. The simulated transmission spectrum for such periodic PBG structure has been carried out for 25 pairs of binary dielectric layers: incident wave from left and transmitted wave on the right. The result is shown in Fig. 2, which agrees well with Fig. 1.
4 Defects and Quasi Modes
4.1 Transmission and reflection spectra
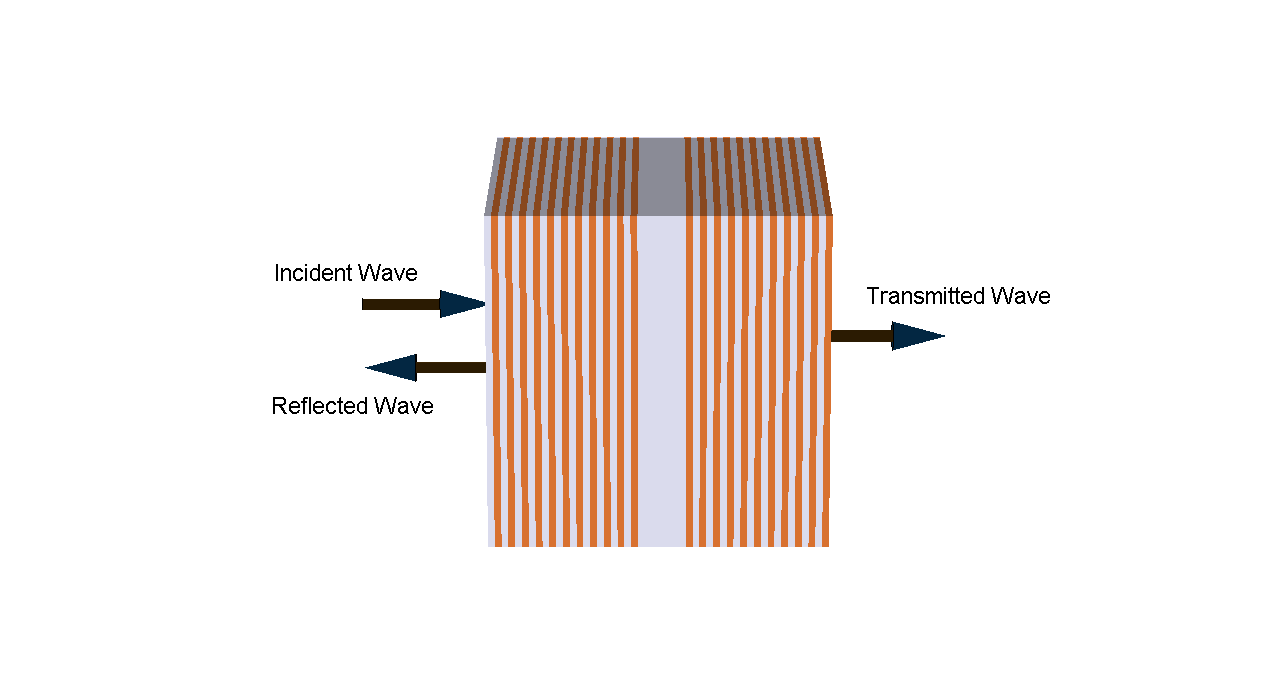
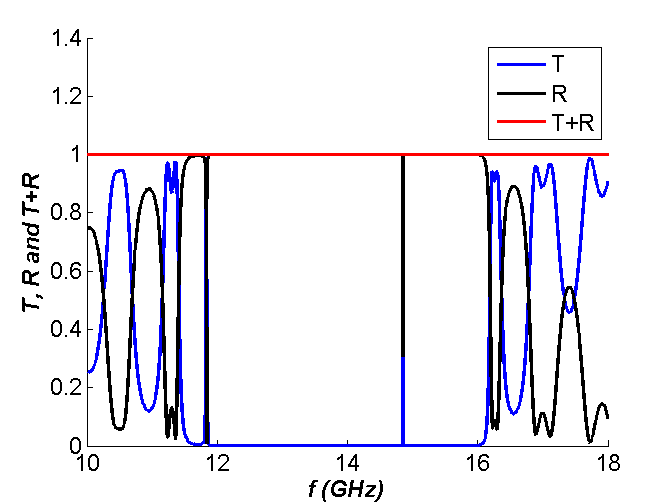
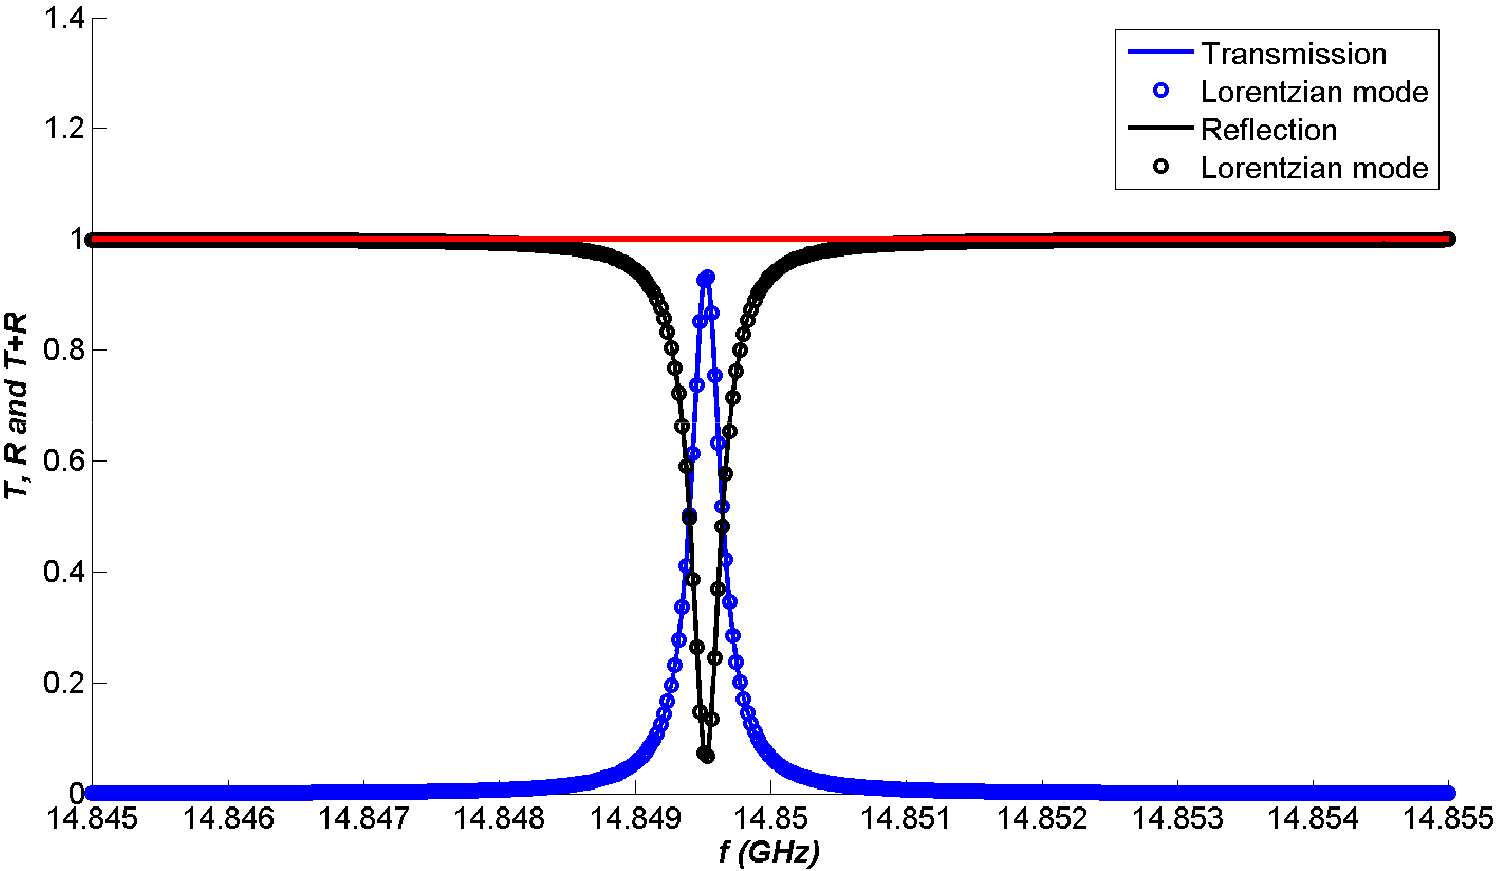
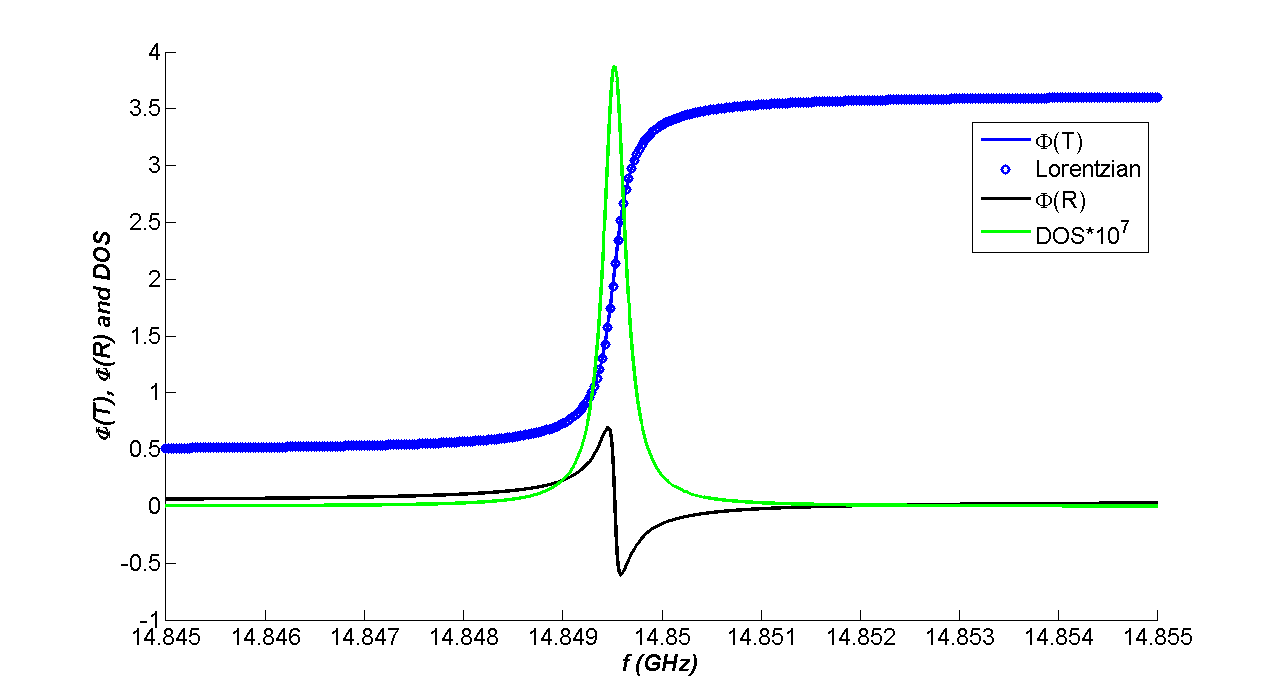
Now let’s look at what happens when one or more defects are introduced deep inside the PBG structure (25 pairs). First, let’s look at single potential well (defect) by replacing the middle 3 pairs with (see Fig. 3). The result is shown in Fig. 4 for the first band gap in Fig. 2. One quasi modes appears at around GHz. A closer look at the intensity and phase of the transmission and reflection spectrum are shown in Fig. 5 and Fig. 6, together with the quasi mode fitting and DOS. Quasi modes will be explained in Section 4.2 and DOS is discussed in Section 4.3.
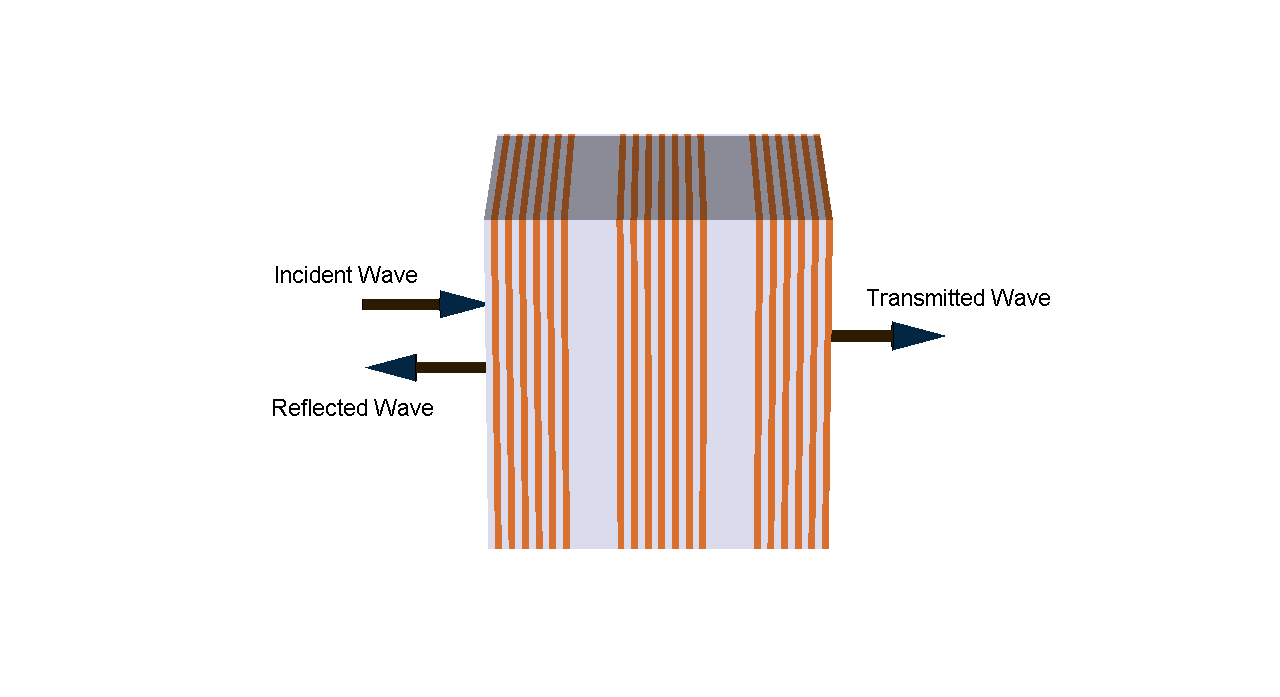
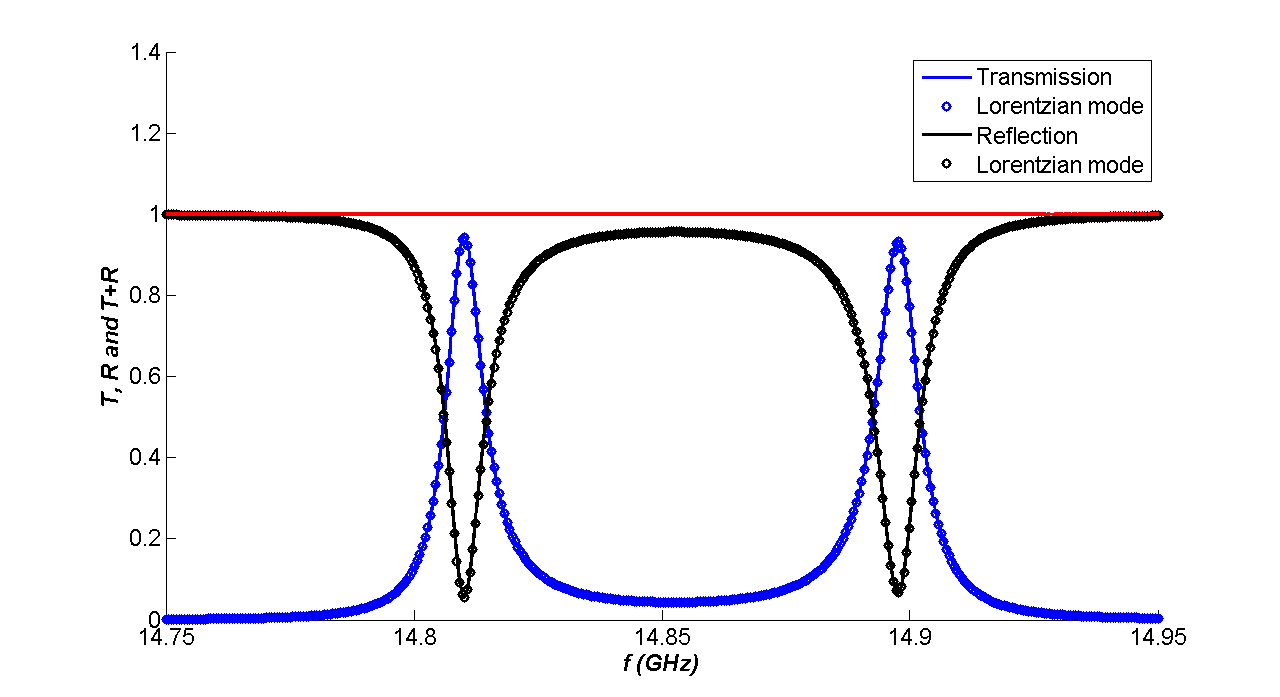
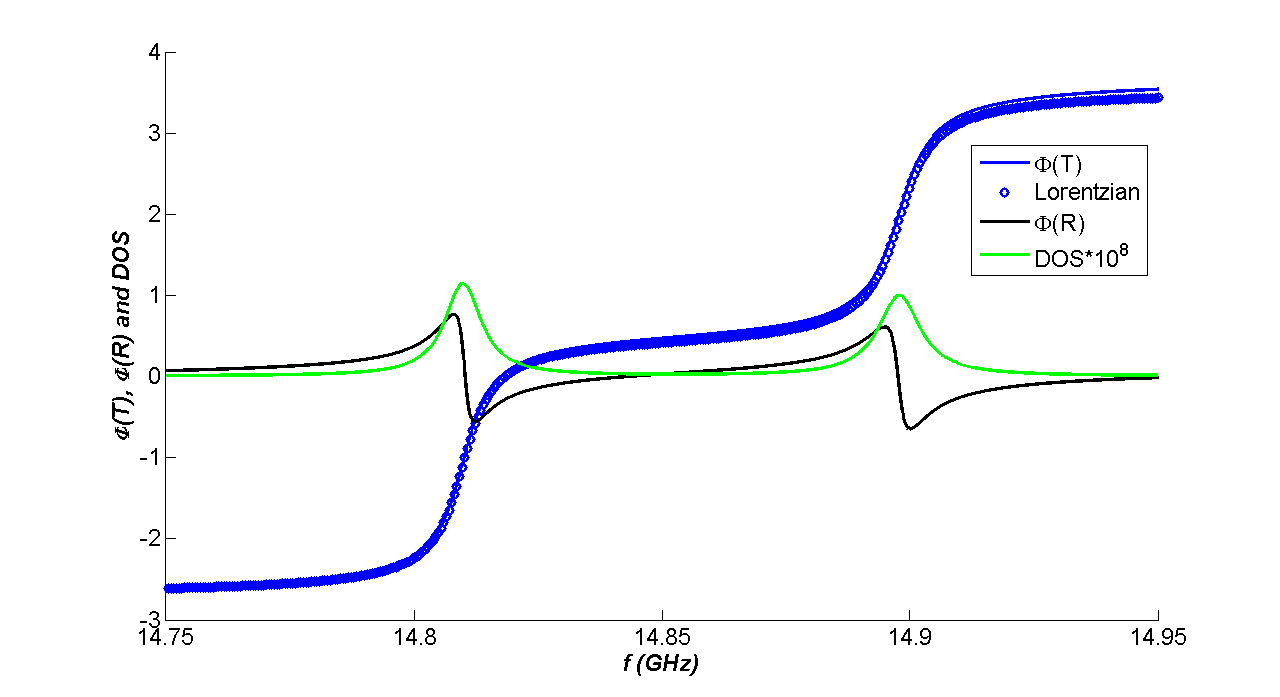
Now let’s look at double potential wells (defects) by replacing 3 pairs with (see Fig. 7) at two locations separated by a potential barrier . The intensity and phase are shown in Fig. 8 and Fig. 9 respectively. Also see Section 4.2 for quasi mode explanation and Section 4.3 for DOS.
4.2 Quasi modes
Quasi modes can be considered as localized modes around the defect sites and could couple with each other if more than one modes are present. Mathematically, the frequency part of the quasi mode can be expressed as the Lorentzian function,
| (24) |
4.2.1 Single quasi mode
4.2.2 Two quasi modes
For double defects inside PBG structure., the wave function can be expressed in sum of two quasi modes,
| (25) |
with GHz, MHz, and GHz, MHz, . Note that in Eq. (25), the phase difference between these adjacent two modes is .
4.3 Density of States
For 1D system, DOS is given by [6],
| (26) |
We also plot the DOS for single defect and double defects in Fig. 6 and Fig. 9 respectively.
4.4 Green’s function
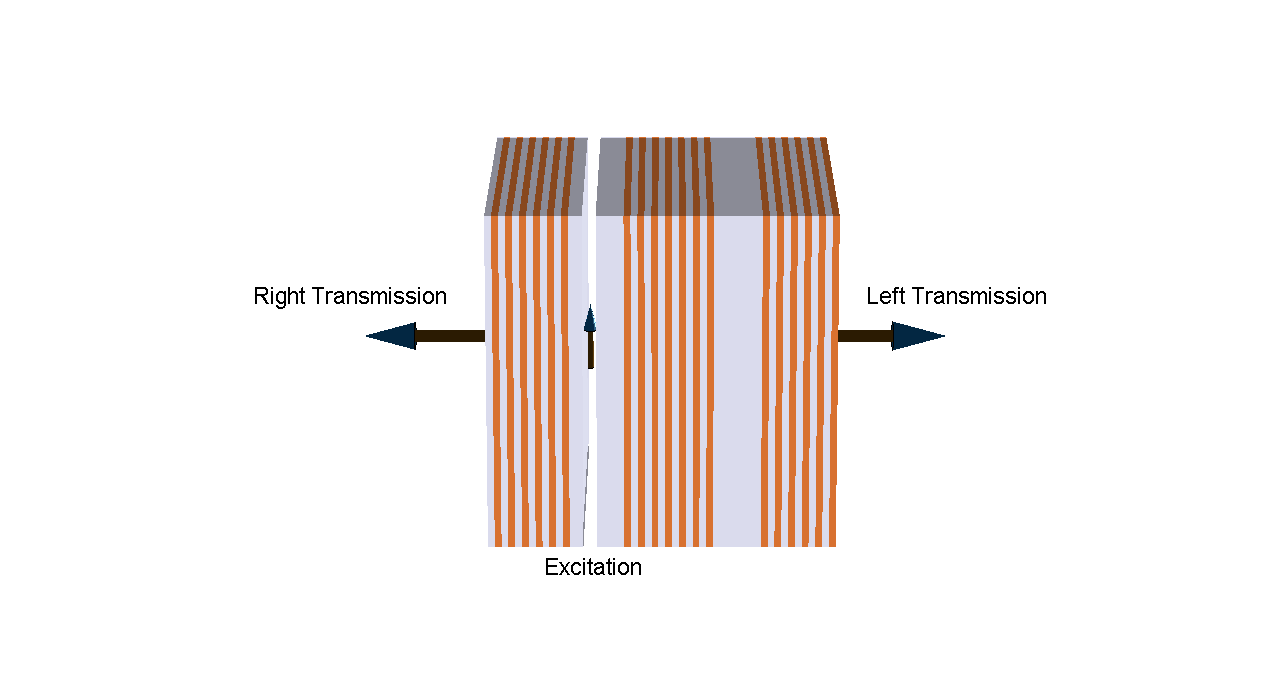
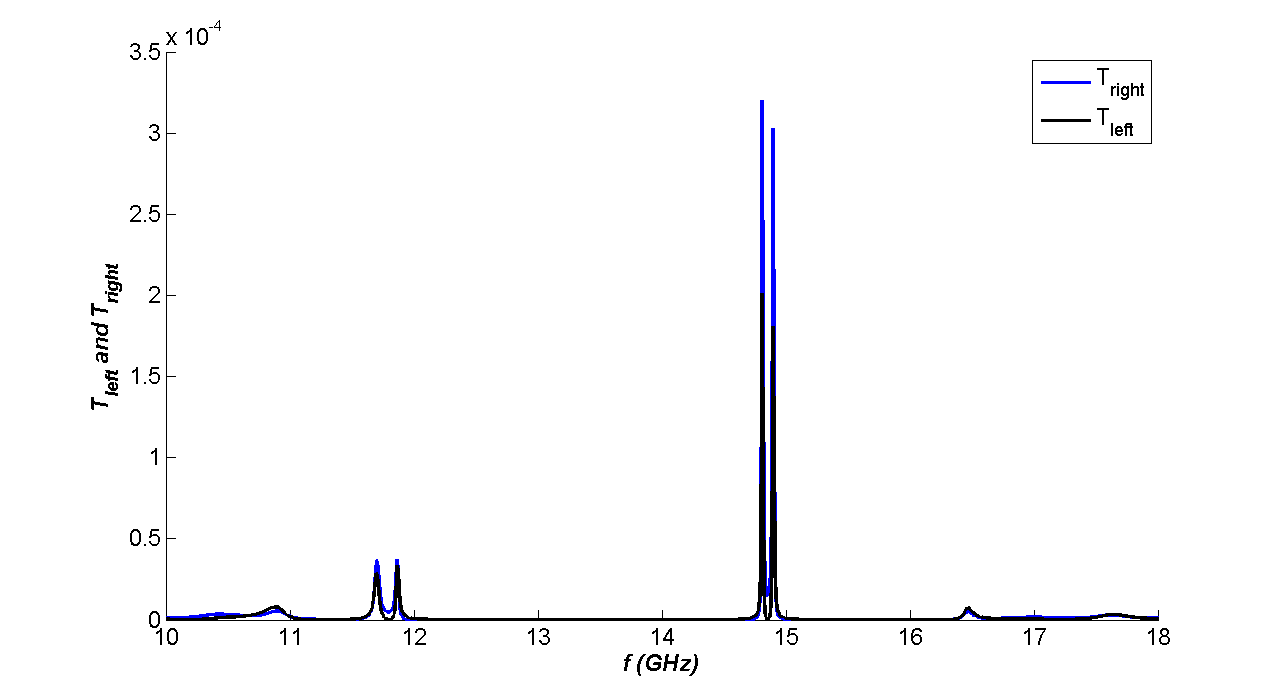
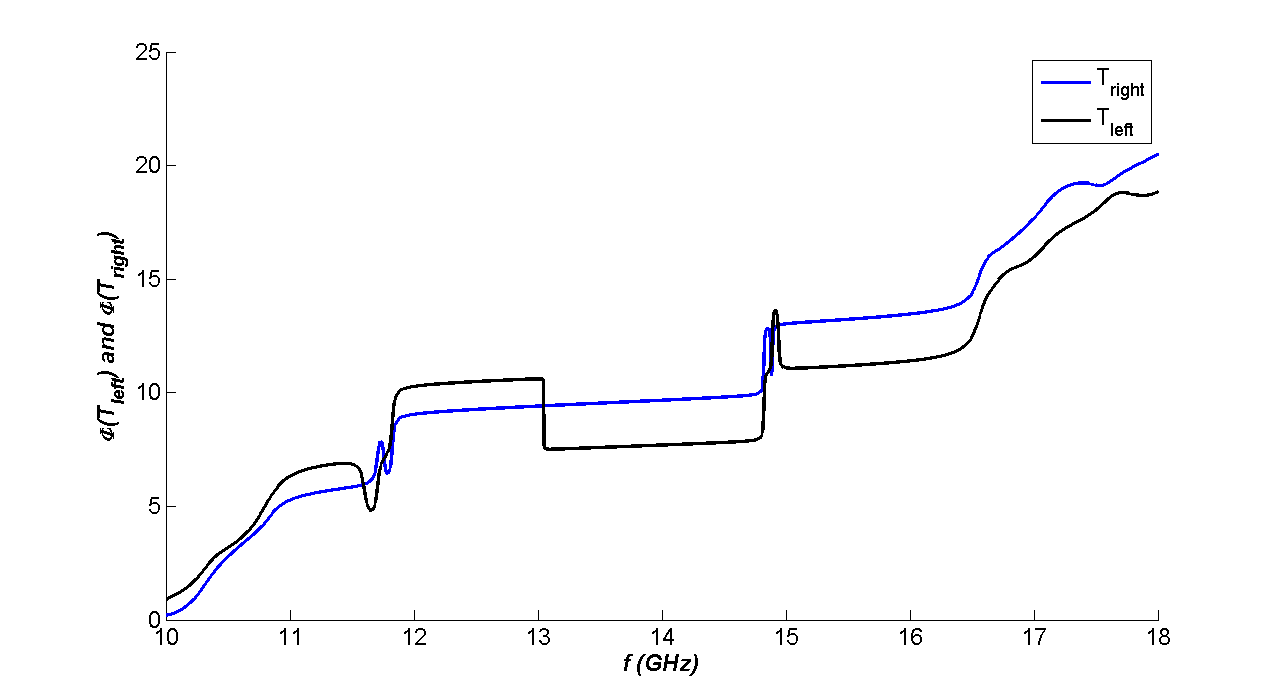
We also obtained the Green’s function following the procedure stated in Section 2.3. Here we show the result for double defects: the schematics with excitation source inside the first defect is shown in Fig. 10. The transmission spectra and phases for both left and right sides are shown in Fig. 11 and Fig. 12 respectively. Compared to the transmission and reflection spectra in Fig. 8 and Fig. 9, we can see that the Green’s function shows much sharper quasi mode peaks.
5 Conclusion
We have simulated the transmission spectrum and the Green’s function for 1D photonics crystal with and without defects. It has been shown that quasi mode decomposition gives excellent agreement with the simulated result. DOS is also obtained through the phase derivative of the transmission spectrum. The method can find applications in design of 1D photonics filter and reflection mirror, defect simulation of photonics crystal and its DOS.
Shaolin Liao wants to thank Prof. Azriel Genack and his group for their help when he worked there as a Postdoc Fellow from 2008-2010.
References
- [1] Yablonovich, E., “Inhibited spontaneous emission in solid-state physics and electronics,” Phys. Rev. Lett. , Vol. 58, 2059, 1987.
- [2] Wu, C. J., Chu, B. H., Weng M. D., and Lee, H. L., “Enhancement of bandwidth in a chirped quarter-wave dielectric mirror,” J. Electromagn. Waves and Appl. , Vol. 23, No. 4, 437-447, 2009.
- [3] Sebbah, P., Hu, B., Klosner, J., and Genack, Z. A., “Quasimodes of spatially extended field distributions within nominally localized random waveguides,” Phys. Rev. Lett. , 96, 183902, 2006.
- [4] Tureci H. E., Douglas, S. A., and Collier, B., “Self-consistent multimode lasing theory for complex or random lasing media,” Physical Review A , Vol. 74, 043822, 2006.
- [5] Sheng, P., Introduction toWave Scattering, Localization and Mesoscopic Phenomena , second edition, Springer, 2006.
- [6] Avishai, Y. and Band, Y. B., “One-dimensional density of states and the phase of the transmission amplitude,” Rapid Communications, Physical Review B , Vol. 32, No. 4, Agust, 1985.
- [7] Ching, E. S. C., Leung, P. T., Maassen, A., Suen, W. M., Tong, S. S., and Young K., “Quasinormal-mode expansion for waves in open systems,” Reviews of Modern Physics , Vol. 70, No. 4, October 1998.
- [8] S. Liao and L. Ou, “A Ping-Pong Computational Electromagnetics (CEM) Algorithm for 2D Antennas/Metasurfaces,” 2020 Asia-Pacific Microwave Conference (APMC 2020), Hong Kong SAR, PR China, 8-11 December, 2020. Also available at arXiv.
- [9] S. Liao and L. Ou, “Iterative Physical Optics (IPO) for Fast and Accurate Simulation of Reflector Antennas,” 2020 Asia-Pacific Microwave Conference (APMC 2020), Hong Kong SAR, PR China, 8-11 December, 2020. arXiv:2007.01861: https://arxiv.org/abs/2007.01861
- [10] S. Liao and L. Ou, “Ultra-sensitive Parity-Time Symmetry based Graphene FET (PTS-GFET) Sensors,” 2020 Asia-Pacific Microwave Conference (APMC 2020), Hong Kong SAR, PR China, 8-11 December, 2020. arXiv:2007.04567: https://arxiv.org/abs/2007.04567
- [11] S. Liao, T. Elmer, S. Bakhtiari, N. Gopalsami, N. Cox, J. Wiencek, A. C. Raptis, “Standoff Through-the-Wall Sensing at Ka-Band Microwave,” Materials Evaluation, American Society of Nondestructive Testing, vol. 70, no. 10, pp. 1136-1145, Oct. 2012. Also available at arXiv:2007.06020, https://arxiv.org/abs/2007.06020.
- [12] Sanchith Padmaraj K. Nirish Patil and S. Liao, “A Compact Dual-band WiFi Energy Harvester,” 2019 Photonics & Electromagnetics Research Symposium - Fall (PIERS - Fall), Xiamen, China, 2019, pp. 1209-1212. DOI: 10.1109/PIERS-Fall48861.2019.9021903
- [13] Y. He Y. Li Z. Zhou H. Li Y. Hou S. Liao and P. Chen, “Wideband Epsilon-Near-Zero Supercoupling Control through Substrate-Integrated Impedance Surface,” Advanced Theory and Simulations, vol. 2, no. 8, p. 1900059, 2019, DOI: 10.1002/adts.201900059.
- [14] S. Liao and L. Ou, “iESC: iterative Equivalent Surface Current Approximation,” available at https://arxiv.org, July 2020.
- [15] S. Liao, Multi-frequency beam-shaping mirror system design for high-power gyrotrons: Theory, algorithms and methods, ProQuest Dissertations And Theses; Thesis (Ph.D.)–The University of Wisconsin - Madison, 2008.; Publication Number: AAI3314260; ISBN: 9780549633167; Source: Dissertation Abstracts International, Volume: 69-05, Section: B, pp. 1-245. https://ui.adsabs.harvard.edu/abs/2008PhDT……..81L/abstract or https://dl.acm.org/doi/book/10.5555/1467404
- [16] L. Ou, S. Liao, Z. Qin, and H. Yin, “Millimeter Wave Wireless Hadamard Image Transmission for MIMO enabled 5G and Beyond,” IEEE Wireless Communications, pp. 1536-1284, 2020. DOI: 10.1109/MWC.001.2000081
- [17] S. Liao, Z. Wang, L. Ou, and Y. Peng, “A Harmonics Interferometric Doppler Sensor With a Neon Lamp Detector,” IEEE Sensors Journal, pp. 1-1, 2020, DOI: 10.1109/JSEN.2020.2970055.
- [18] S. Liao, N. Gopalsami, S. Bakhtiari, T. W. Elmer, E. R. Koehl, and A. C. Raptis, “A novel interferometric sub-THz Doppler radar with a continuously oscillating reference arm,” IEEE Transactions on Terahertz Science and Technology, vol. 4, no. 3, pp. 307-313, Mar. 2014. DOI: 10.1109/TTHZ.2014.2307165
- [19] S. Liao et al., “Passive millimeter-wave dual-polarization imagers,” IEEE Transactions on Instrumentation and Measurement, vol. 61, no. 7, pp. 2042 - 2050, Feb. 2012. DOI: 10.1109/TIM.2012.2183032
- [20] N. Gopalsami, S. Liao, T. Elmer, E. Koehl, A. Heifetz, A. Raptis, L. Spinoulas, and A. Katsaggelos, “Passive millimeter-wave imaging with compressive sensing,” Optical Engineering, vol. 51, no. 9, pp. 091614-1:9, Sep. 2012. DOI: 10.1117/1.OE.51.9.091614
- [21] S. Bakhtiari, T. Elmer, M. Cox, N. Gopalsami, A. Raptis, S. Liao, I. Mikhelson and A. Sahakian, “Compact Millimeter-Wave Sensor for Remote Monitoring of Vital Signs,” IEEE Transactions on Instrumentation and Measurement, vol. 61, no. 3, pp. 830-841, Mar. 2012, DOI: 10.1109/TIM.2011.2171589.
- [22] S. Liao, N. Gopalsami, A. Venugopal, A. Heifetz, and A. C. Raptis, “An efficient iterative algorithm for computation of scattering from dielectric objects,” Optics Express, vol. 19, no. 3, pp. 3304-3315, 2011. DOI: 10.1364/OE.19.003304
- [23] S. Bakhtiari, S. Liao, T. Elmer, N. Gopalsami, and A. C. Raptis, “A real-time heart rate analysis for a remote millimeter wave I-Q sensor,” IEEE Transactions on Biomedical Engineering, vol. 58, no. 6, pp. 1839-45, Mar. 2011. DOI: 10.1109/TBME.2011.2122335
- [24] A. Heifetz, H. T. Chien, S. Liao, N. Gopalsami, and A. C. Raptis, “Millimeter-wave scattering from neutral and charged water droplets,” Journal of Quantitative Spectroscopy and Radiative Transfer, vol. 111, no. 17-18, pp. 2550-2557, 2010. DOI: 10.1016/j.jqsrt.2010.08.001
- [25] S. Liao and R. J. Vernon, “A fast algorithm for computation of electromagnetic wave propagation in half-space,” IEEE Trans. on Antennas and Propagation, vol. 57, no. 7, pp. 2068-2075, Jul. 2009. DOI: 10.1109/TAP.2009.2021890
- [26] S. Liao, “Miter bend mirror design for corrugated waveguides,” Letters of Progress in Electromagnetics Research, vol. 10, pp. 157-162, 2009. DOI: 10.2528/PIERL09062103
- [27] S. Liao and R. J. Vernon, “Sub-THz beam-shaping mirror designs for quasi-optical mode converter in high-power gyrotrons,” Journal of Electromagnetic Waves and Applications, vol. 21, no. 4, pp. 425-439, 2007. DOI: 10.1163/156939307779367332
- [28] S. Liao and R. J. Vernon, “A fast algorithm for wave propagation from a plane or a cylindrical surface,” International Journal of Infrared and Millimeter Wave, vol. 28, no. 6, pp. 479-490, 2007. DOI: 10.1007/s10762-007-9213-0
- [29] S. Liao, “The Taylor Interpolation through FFT Algorithm for Electromagnetic Wave Propagation and Scattering,” arXiv:physics/0610057, Oct. 2006. https://arxiv.org/abs/physics/0610057
- [30] S. Liao and L. Ou, “High-speed Millimeter-wave 5G/6G Image Transmission via Artificial Intelligence,” 2020 Asia-Pacific Microwave Conference (APMC 2020), Hong Kong SAR, PR China, 8-11 December, 2020. arXiv:2007.03153: https://arxiv.org/abs/2007.03153
- [31] I. V. Mikhelson, S. Bakhtiari, T. W. E. II, S. Liao, and A. V. Sahakian, “Remote sensing of heart rate using millimeter-wave interferometry and probabilistic interpolation,” in Proceedings SPIE 8719, Smart Biomedical and Physiological Sensor Technology X, 2013, vol. 87190M. DOI: 10.1117/12.2015282
- [32] S. Liao, N. Gopalsami, S. Bakhtiari, T. Elmer, and A. C. Raptis, “A novel interferometric millimeter wave Doppler radar,” 2013 IEEE International Instrumentation and Measurement Technology Conference (I2MTC), Minneapolis, MN, 2013, pp. 387-391. DOI: 10.1109/I2MTC.2013.6555445
- [33] S. Liao et al., “Millimeter Wave Doppler Sensor for Nondestructive Evaluation of Materials,” 21st Annual Research Symposium & Spring Conference 2012, Dallas, TX USA, 2012. arXiv:2007.00195: https://arxiv.org/abs/2007.00195
- [34] S. Liao, S. Bakhtiari, T. Elmer, A. C. Raptis, I. V. Mikhelson, and A. V. Sahakian, “Millimeter wave I-Q standoff biosensor,” in Proceedings SPIE 8371, Sensing Technologies for Global Health, Military Medicine, Disaster Response, and Environmental Monitoring II; and Biometric Technology for Human Identification IX, 2012, vol. 83711D. DOI: 10.1117/12.924241
- [35] N. Gopalsami, S. Liao, T. Elmer, E. R. Koehl, and A. C. Raptis, “Evaluation of passive millimeter wave system performance in adverse weather,” in Proceedings SPIE 8362, Passive and Active Millimeter Wave Imaging XV, 2012, vol. 83620I. DOI: 10.1117/12.919212
- [36] N. Gopalsami, T. W. Elmer, S. Liao, R. Ahern, A. Heifetz, A. C. Raptis, M. Luessi, D. Babacan and A. K. Katsaggelos, “Compressive sampling in passive millimeter wave imaging,” in Proceedings of SPIE 8022, Passive Millimeter-Wave Imaging Technology XIV, 2011, vol. 80220I. DOI: 10.1117/12.886998
- [37] N. Gopalsami, S. Liao, T. Elmer, A. Heifetz and A. C. Raptis, “Compressive sampling in active and passive millimeter-wave imaging,” 2011 International Conference on Infrared, Millimeter, and Terahertz Waves, Houston, TX, 2011, pp. 1-2. DOI: 10.1109/IRMMW-THz.2011.6105205
- [38] E. Buscarino, S. Liao, M. Perkins, B. Rock, U. Farid and R. Vernon, “High-Power Microwave Transmission and Mode Conversion Program,” Report to USA DOE Office, 2005, DOI: 10.2172/1210042
- [39] S. Liao, “Validity of image theorem under spherical geometry,” Progress in Electromagnetics Research Symposium (PIERS), Marrakesh, Morocco, 2011. arXiv:2007.02000: https://arxiv.org/abs/2007.02000
- [40] S. D. Babacan, M. Luessi, L. Spinoulas, A. K. Katsaggelos, N. Gopalsami, T. Elmer, R. Ahern, S. Liao and A. Raptis, “Compressive passive millimeter-wave imaging,” 2011 18th IEEE International Conference on Image Processing, Brussels, 2011, pp. 2705-2708. DOI: 10.1109/ICIP.2011.6116227
- [41] N. Gopalsami, S. Liao, E. R. Koehl, T. W. Elmer, A. Heifetz, H.-T. Chien and A. C. Raptis, “Passive millimeter wave imaging and spectroscopy system for terrestrial remote sensing,” in Proceedings of SPIE 7670, Passive Millimeter-Wave Imaging Technology XIII, 2010, vol. 767003. DOI:10.1117/12.850123
- [42] R. J. Vernon, S. Liao and J. Neilson, “A high-efficiency four-frequency mode converter design with small output angle variation for a step-tunable gyrotron,” in 2008 33rd International Conference on Infrared, Millimeter and Terahertz Waves, Pasadena, CA, USA, 2008. DOI: 10.1109/ICIMW.2008.4665569
- [43] S. Liao, Vernon RJ and Neilson J., “A four-frequency mode converter with small output angle variation for a step-tunable gyrotron,” Proceedings of the 15th Joint Workshop On Electron Cyclotron Emission and Electron Cyclotron Resonance Heating, EC-15. 477-482, 2009. DOI: 10.1142/9789812814647 0068
- [44] S. Liao, “On the validity of physical optics for narrow-band beam scattering and diffraction from the open cylindrical surface,” Progress in Electromagnetics Research Symposium (PIERS), vol. 3, no. 2, pp. 158-162, 2007. DOI:10.2529/PIERS060906142312
- [45] S. Liao, “Fast computation of electromagnetic wave propagation and scattering for quasi-cylindrical geometry,” Progress in Electromagnetics Research Symposium (PIERS), vol. 3, no. 1, pp. 96-100, 2007. DOI:10.2529/PIERS060906005903
- [46] S. Liao, “Beam-shaping PEC mirror phase corrector design,” Progress in Electromagnetics Research Symposium (PIERS), vol. 3, no. 4, pp. 392-396, 2007. DOI:10.2529/PIERS061005101313
- [47] S. Liao and R. J. Vernon, “The near-field and far-field properties of the cylindrical modal expansions with application in the image theorem,” 2006 Joint 31st International Conference on Infrared Millimeter Waves and 14th International Conference on Teraherz Electronics, Shanghai, 2006, pp. 260-260. DOI: 10.1109/ICIMW.2006.368468
- [48] S. Liao and R. J. Vernon, “The cylindrical Taylor-interpolation FFT algorithm,” 2006 Joint 31st International Conference on Infrared Millimeter Waves and 14th International Conference on Teraherz Electronics, Shanghai, 2006, pp. 259-259. DOI: 10.1109/ICIMW.2006.368467
- [49] S. Liao and R. J. Vernon, “On the image approximation for electromagnetic wave propagation and PEC scattering in cylindrical harmonics,” Progress In Electromagnetics Research, Vol. 66, 65-88, 2006. DOI:10.2528/PIER06083002
- [50] S. Liao and R. J. Vernon, “On fast computation of electromagnetic wave propagation through FFT,” 2006 7th International Symposium on Antennas, Propagation & EM Theory, Guilin, 2006, pp. 1-4. DOI: 10.1109/ISAPE.2006.353495
- [51] S. Liao and R. J. Vernon, “A new fast algorithm for field propagation between arbitrary smooth surfaces,” 2005 Joint 30th International Conference on Infrared and Millimeter Waves and 13th International Conference on Terahertz Electronics, Williamsburg, VA, USA, 2005, pp. 606-607 vol. DOI: 10.1109/ICIMW.2005.1572687
- [52] M. Hajizadegan, M. Sakhdari, S. Liao, and P.-Y. Chen, “High-Sensitivity Wireless Displacement Sensing Enabled by PT-Symmetric Telemetry,” IEEE Transactions on Antennas and Propagation, vol. 67, no. 5, pp. 3445-3449, May 2019, DOI: 10.1109/TAP.2019.2905892.
- [53] L. Zhu, N. Alkhaldi, H. M. Kadry, S. Liao, and P.-Y. Chen, “A Compact Hybrid-Fed Microstrip Antenna for Harmonics-Based Radar and Sensor Systems,” IEEE Antennas and Wireless Propagation Letters, vol. 17, no. 12, pp. 2444-2448, Dec. 2018, DOI: 10.1109/LAWP.2018.2877674.
- [54] S. Liao et al., “Nuclear radiation induced atmospheric air breakdown in a spark gap,” IEEE Transactions on Plasma Science, vol. 40, no. 4, pp. 990-994, Mar. 2012. DOI: 10.1109/TPS.2012.2187343
- [55] S. Liao et al., “Microwave Remote Sensing of Ionized Air,” IEEE Geoscience and Remote Sensing Letters, vol. 8, no. 4, pp. 617-620, Jul. 2011, DOI: 10.1109/LGRS.2010.2098016.
- [56] K. Wang, H. T. Chien, S. Liao, L. P. Yuan, S. H. Sheen, S. Bakhtiari and A. C. Raptis, “Ultrasonic and electromagnetic sensors for downhole reservoir characterization,” in Proceedings of Thirty-Sixth Workshop on Geothermal Reservoir Engineering, Stanford University, Stanford, California, January 31 - February 2, 2011 SGP-TR-191. arXiv:2007.00191: https://arxiv.org/abs/2007.00191
- [57] H. Soekmadji, S. Liao, and R. J. Vernon, “Experiment and simulation on TE10 cut-off reflection phase in gentle rectangular downtapers,” Letters of Progress in Electromagnetics Research, vol. 12, pp. 79-85, 2009. DOI: 10.2528/PIERL09090707
- [58] H. Soekmadji, S. Liao, and R. J. Vernon, “Trapped mode phenomena in a weakly overmoded waveguiding structure of rectangular cross section,” Journal of Electromagnetic Waves and Applications, vol. 22, no. 1, pp. 143-157, 2008. DOI: 10.1163/156939308783122706
- [59] S. Liao and L. Ou, “Bound States in Continuum and Zero-Index Metamaterials: A Review,” arXiv:2007.01361, Jul. 2020. https://arxiv.org/abs/2007.01361
- [60] S. Liao, “Optimal Feedback-Interferometric Fiber Laser Sensors,” 2019 Photonics & Electromagnetics Research Symposium - Fall (PIERS - Fall), Xiamen, China, 2019, pp. 63-65. DOI: 10.1109/PIERS-Fall48861.2019.9021883
- [61] Y. Peng and S. Liao, “On-chip ZIM-BiC Laser,” in 2019 IEEE MTT-S International Conference on Numerical Electromagnetic and Multiphysics Modeling and Optimization (NEMO), 2019, pp. 1-4. DOI: 10.1109/NEMO.2019.8853827.
- [62] S. Liao, “Spectral-domain MOM for Planar Meta-materials of Arbitrary Aperture Wave-guide Array,” in 2019 IEEE MTT-S International Conference on Numerical Electromagnetic and Multiphysics Modeling and Optimization (NEMO), 2019, pp. 1-4, DOI: 10.1109/NEMO.2019.8853816.
- [63] Y. Zeng Z. Tang, S. Liao and Y. Peng, “On-chip Coupler Using Zero-index Metamaterials,” 2019 Photonics & Electromagnetics Research Symposium - Fall (PIERS - Fall), Xiamen, China, 2019, pp. 1458-1460. DOI: 10.1109/PIERS-Fall48861.2019.9021503
- [64] Y. Peng and S. Liao, “ZIM Laser: Zero-Index-Materials Laser,” IEEE Journal on Multiscale and Multiphysics Computational Techniques, vol. 4, pp. 133-142, 2019, DOI: 10.1109/JMMCT.2019.2905368.
- [65] S. Liao and L. Ou, “High-Q Interstitial Square Coupled Microring Resonators Arrays,” IEEE Journal of Quantum Electronics, 23 April 2020. DOI: 10.1109/JQE.2020.2989809
- [66] S. Liao, T. Wong, and L. Ou, “Optimal feedback-interferometric fifer laser microphones,” Optics Letters, Optical Society of America (OSA), vol. 45, no. 2, pp. 423-426, Jan. 2020, DOI: 10.1364/OL.384225.
- [67] S. Liao and T. Wong, “Optimal Design of Feedback-Interferometric Fiber Laser Sensors,” IEEE Sensors Journal, vol. 19, no. 24, pp. 12016-12023, Dec. 2019, DOI: 10.1109/JSEN.2019.2936222.
- [68] S. Liao, T. Wong, Z. Wang, R. Wang, E. Clutter, and H.-T. Chien, “Miniature fiber laser microphones with graphene diaphragms,” 2018 IEEE Research and Applications of Photonics In Defense Conference (RAPID), Miramar Beach, FL, 2018, pp. 1-4. DOI: 10.1109/RAPID.2018.8508963
- [69] E. Clutter B. Matos, Z. Wang, R. Divan, A. Macrander and S. Liao, X-ray Writing of Optical Fiber Gratings with a nm-Mask, The American Vacuum Society (AVS) Prairie Chapter, The University of Chicago, IL USA, 2018. arXiv:2007.00683, https://arxiv.org/abs/2007.00683
- [70] S. Liao and A. Z. Genack, “Polarization correlation in a quasi-1-D random system,” in Frontiers in Optics 2008/Laser Science XXIV/Plasmonics and Metamaterials/Optical Fabrication and Testing, Rochester, New York, USA, 2008. DOI:10.1364/FIO.2008.FWV3
- [71] Stancil, D. D., “Kronig Penney model for periodically segmented waveguides,” Applied Optics, JOSA , Vol. 35, No. 24, August 1996.