The destruction and recreation of the X-ray corona in a changing-look
Active Galactic Nucleus
Abstract
We present the drastic transformation of the X-ray properties of the active galactic nucleus 1ES 1927+654, following a changing-look event. After the optical/UV outburst the power-law component, produced in the X-ray corona, disappeared, and the spectrum of 1ES 1927+65 instead became dominated by a blackbody component ( eV). This implies that the X-ray corona, ubiquitously found in AGN, was destroyed in the event. Our dense day long X-ray monitoring shows that the source is extremely variable in the X-ray band. On long time scales the source varies up to dex in days, while on short timescales up to dex in hours. The luminosity of the source is found to first show a strong dip down to , and then a constant increase in luminosity to levels exceeding the pre-outburst level 300 days after the optical event detection, rising up asymptotically to . As the X-ray luminosity of the source increases, the X-ray corona is recreated, and a very steep power-law component () reappears, and dominates the emission for 0.3–2 keV luminosities , days after the beginning of the event. We discuss possible origins of this event, and speculate that our observations could be explained by the interaction between the accretion flow and debris from a tidally disrupted star. Our results show that changing-look events can be associated with dramatic and rapid transformations of the innermost regions of accreting SMBHs.
Subject headings:
galaxies: active — galaxies: evolution — quasars: general — quasars: individual (1ES 1927+654)1. Introduction
Accreting supermassive black holes (SMBHs) are known to show variable optical, ultraviolet and X-ray emission. One of the most intriguing aspects of this behavior is associated with “changing-look’ sources, in which the optical/ultraviolet broad emission lines, produced by rapidly-moving material surrounding the SMBH (e.g., Kaspi et al. 2000), appear or disappear (e.g., Shappee et al. 2014; LaMassa et al. 2015; Trakhtenbrot et al. 2019). This implies that changing-look active galactic nuclei (AGN) transition from type 1 (showing both broad and narrow ionic emission lines in the optical) to type 2 (showing only narrow lines), or vice versa. The physical mechanism producing these changing-look events is still hotly debated; the observed changes could be related to radiation pressure instabilities in the disk (Śniegowska & Czerny 2019), to state transitions (Noda & Done 2018; Ruan et al. 2019), or to variations in accretion rate (Elitzur et al. 2014), possibly related to transient events (Merloni et al. 2015), with the source going through a highly-accreting phase and producing broad lines.


So far only a few dozens of these systems have been discovered (e.g., Yang et al. 2018; MacLeod et al. 2019) and, due to their rarity, it has been very difficult to catch any of them during the transition phase. We were recently able to observe, for the first time, an AGN in the act of changing phase. 1ES 1927+654 (, Trakhtenbrot et al. 2019) was previously classified as a type 2 AGN (e.g., Gallo et al. 2013 and references therein). In March 2018 the All-Sky Automated Survey for SuperNovae (Shappee et al. 2014) showed that the source suddenly increased in flux by an order of magnitude in the optical V-band (ASASSN-18el/AT2018zf, Nicholls et al. 2018). The analysis of Asteroid Terrestrial-impact Last Alert System (ATLAS, Tonry et al. 2018) data indicated that the event was first detected on December 23 2017. An optical spectroscopic follow-up campaign showed first a very blue continuum and then, months after the optical flux rise, evidence of strong broad Balmer emission lines (Trakhtenbrot et al. 2019).
Right after the appearance of the broad optical lines we started monitoring the source in the X-ray band. X-rays in AGN are primarily created by Comptonization of optical/UV disk photons in a corona of hot electrons, located within a light-hour from the accreting system (Fabian et al. 2009), and likely powered by the magnetic field of the accretion disk (Merloni & Fabian 2001). These electrons transfer their energy to the disk photons, up-scattering them into the X-rays (Haardt & Maraschi 1991), and creating the power-law continuum ubiquitously found in AGN. X-ray observations therefore provide an extremely powerful tool to study the inner regions of AGN and the physical conditions of the accretion flow. In this work we discuss the peculiar X-ray properties of 1ES 1927+654 after the changing-look event. Throughout the paper we adopt standard cosmological parameters (, , ). Unless otherwise stated, uncertainties are quoted at the 90% confidence level.
2. The disappearance and reappearance of the power-law component
Our X-ray campaign consists of 265 NICER (Gendreau et al. 2012; Arzoumanian et al. 2014) observations (for a total of 678ks), 14 Neil Gehrels Swift Observatory (Gehrels et al. 2004) observations (26 ks), and three joint XMM-Newton/NuSTAR (Jansen et al. 2001; Harrison et al. 2013) observations (158/169 ks). Details about the data reduction and spectral analysis of all these X-ray observations are reported in a dedicated companion publication (Ricci et al. 2020, see also Kara et al. 2018), while here we focus on the unexpected spectral properties of 1ES 1927+654 after the changing-look event.
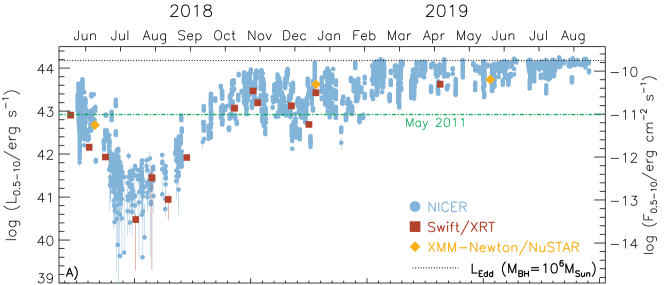
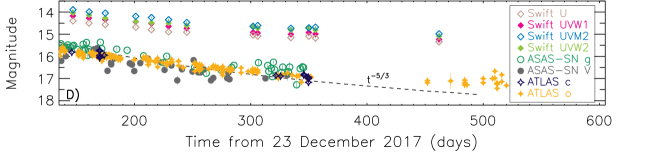
Our monitoring campaign shows that the source is extremely variable in the 0.5–10 keV band (panel A of Fig. 1), with very strong intraday variability (up to 2 dex in 8 hours). The strongest variability is however found on longer time scales. The first X-ray observations, carried out in May 2018, found 1ES 1927+654 at a similar luminosity level of the previous XMM-Newton observation (, Gallo et al. 2013; green dot-dashed line in panel A of Fig. 1). At days from the optical event detection the luminosity of the source started to decrease rapidly, reaching at days. After this dip we observed a constant increase in luminosity, to levels exceeding the pre-outburst value at 300 days. The luminosity then rose up asymptotically to , with the intraday variability decreasing to dex. The X-ray flux variability is tightly connected with the spectral variability, with the source showing a clear harder-when-brighter behavior (panels B and C of Fig. 1). Interestingly, the X-ray and optical/UV fluxes are completely disconnected, with the latter showing a monotonic declining trend for days (Panel D and Trakhtenbrot et al. 2019).
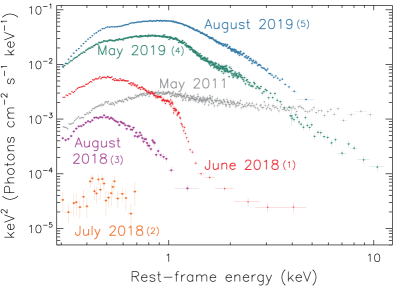
Previous X-ray observations (Gallo et al. 2013) of 1ES 1927+654 (gray spectrum in Fig. 2) found that the source is unobscured (), and that its X-ray spectrum could be well represented by a model that includes a power law () and a blackbody component ( eV). After the optical brightening event, 1ES 1927+654 showed a spectrum completely different from the 2011 XMM-Newton observation. In the first XMM-Newton observation of our campaign (June 2018, red spectrum in Fig. 2), the spectrum was extremely soft, with the emission being dominated by a blackbody-like component. The disappearance of the power-law component, which has not hitherto been observed in AGN, implies that the dramatic event that created the broad lines also destroyed the X-ray corona. The X-ray spectra of 1ES 1927+654 can be typically well modeled by a blackbody, two Gaussian emission lines and a power-law component. Absorption from outflowing ionized gas (with ) is also clearly observed in the XMM-Newton/RGS observations (see Ricci et al. 2020). During the June 2018 XMM-Newton observation the blackbody was found to have a temperature of eV, and only a very faint power-law emission was detected at keV, carrying a very small fraction () of the total 0.3–2 keV flux. The power-law component is undetected or extremely faint also in the observations carried out by NICER in July 2018, when the luminosity was at its lowest level, and in August 2018 (spectra 2 and 3 in Fig. 2, respectively). The spectral analysis of the stacked NICER spectra, obtained combining observations carried out in June to mid-August 2018, recovered only upper limits for the ratio between the power-law and blackbody flux in the 0.3–2 keV band. These upper limits range between % (June 2018) and % (August 2018). As the luminosity of the source increased above the pre-outburst level, our XMM-Newton/NuSTAR and NICER observations show that the power-law component reappeared (spectra 4 and 5). Interestingly, the photon index of this power-law component, , is considerably higher than what is commonly found in AGN (; e.g., Ricci et al. 2017).
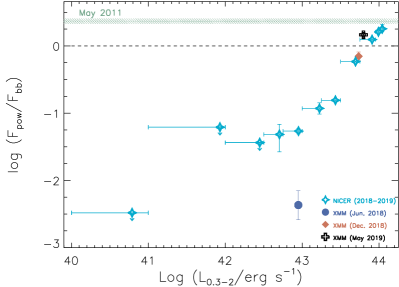
In the X-ray observations carried out in late 2018 and in 2019 the fraction of the total 0.3–2 keV flux ascribed to the power-law component is significantly higher than in June–August 2018, and is found to dominate the X-ray emission in the May 2019 () XMM-Newton/NuSTAR observation. An increase with the luminosity of the ratio between the flux of the power law and that of the blackbody is clearly detected when stacking the NICER observations based on their 0.5–10 keV luminosities (cyan stars in Fig. 3). At the lowest luminosities () the ratio is , which is times lower than the value found in 2011 (), before the optical outburst. The power-law starts to dominate over the blackbody component for 0.3–2 keV luminosities , reaching a ratio between the power law and the blackbody flux similar to that found in the 2011 observations at . All this shows that, as the source becomes brighter, the X-ray corona is being recreated. Such a transition has not been observed before. This can also be observed by comparing the lightcurve to a model-independent flux ratio and to (panels B and C of Fig. 1). Our spectral analysis of the two latest XMM-Newton/NuSTAR observations, which display a strong power-law component, shows that a cutoff at keV is needed to reproduce the data (see Ricci et al. 2020 for details). This cutoff energy is considerably lower than that observed in AGN ( keV; e.g., Ricci et al. 2017), and points to a temperature of the corona of just keV, assuming that the Comptonizing plasma is optically-thin. This assumption is supported by the fact that, considering and , and using Eq. 6 of Ricci et al. (2018), the optical depth of the plasma would be . The low temperature and optical depth also suggest that the X-ray corona is in the process of being reformed, and could imply that the magnetic field powering it is still not strong enough to support the typical X-ray emitting plasma found in AGN.
3. Discussion
The surprisingly soft X-ray continuum (Fig. 2), together with the dramatic X-ray variability (Fig. 1), suggests that the source underwent some catastrophic event that restructured its accretion flow. The lack of X-ray flux above 2 keV implies that the event strongly affected the X-ray corona (and possibly the innermost regions of the accretion flow), possibly completely destroying it. As the X-ray luminosity of 1ES 1927+654 increases, the power-law component reappears, and starts to dominate the overall 0.3–2 keV flux (Fig. 3). This suggests that the X-ray corona is in the process of being recreated.
It has been argued that changing-look events in AGN might be powered by hard-to-soft state transitions (Noda & Done 2018; Ruan et al. 2019), analogous to those observed in black hole X-ray binaries, where the inner disk evaporates into an advection-dominated accretion flow. In this scenario the timescales for the evaporation of the accretion flow should be the viscous timescale. The very soft spectrum of 1ES 1927+654 is reminiscent of the spectral shape of black hole X-ray binaries in the high/soft state (e.g., Remillard & McClintock 2006), and the asymptotic behavior of the luminosity is similar to Eddington-limited accretion outbursts observed in stellar-mass systems (e.g., Kimura et al. 2016). However, the timescales expected for a state transition (e.g., Dunn et al. 2010) of a black hole are considerably longer ( years) than what we observe in 1ES 1927+654, where the spectral variations happen on timescales of hours. Strong magnetization (Noda & Done 2018), possibly coupled with geometrically-thick disks (Dexter & Begelman 2019), could reduce the timescales, but would not be able to explain the spectral variability on day intervals detected by our NICER and XMM-Newton observations.
The event that destroyed the X-ray corona, while increasing the optical/UV flux and creating the broad Balmer lines, could be related to the tidal disruption of a star by the SMBH. While TDEs are rare (e.g., Kawamuro et al. 2016), it has been argued that the presence of a long-lived accretion disk can enhance their rate with respect to inactive galaxies (e.g., Karas & Šubr 2007). TDEs have been discussed as a possible driver of changing-look events (Merloni et al. 2015), and a few cases of AGN in which a TDE might have occurred have been reported over the past few years (e.g., Liu et al. 2020). Merloni et al. (2015) found that the changing-look AGN SDSS 0159+003 (LaMassa et al. 2015) displays a behavior, which is typical of TDEs (Rees 1988), and argued that the event could be related to the disruption of a star by a SMBH. Campana et al. (2015) discussed how the strong variability of IC 3599 could be explained by multiple TDE events recurring every 9.5 years. Blanchard et al. (2017) proposed that the transient PS16dtm was due a TDE in a pre-existing narrow-line Seyfert 1 AGN with a black hole. In this source the increase in the UV and optical flux was not accompanied by an increase of the X-ray flux, which was found to be at least an order of magnitude below the previous XMM-Newton detection. Blanchard et al. (2017) argued that this might be due to absorption of the X-ray corona caused by the disk of debris.
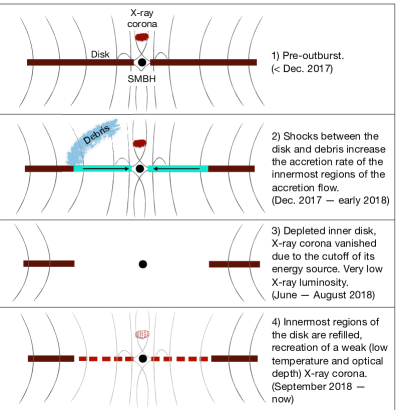
The very soft X-ray emission observed after the event, and the fact that the optical/UV flux decreases following a trend consistent with the behavior (Trakhtenbrot et al. 2019) are in agreement with the TDE scenario (e.g., Komossa 2015; Auchettl et al. 2017), while the re-brightening observed in the X-rays is very different from what is typically observed in TDEs. Interestingly, the behavior seen in 1ES 1927+654 might be consistent with recent hydrodynamic simulations of a debris stream colliding with an accretion disk (Chan et al. 2019). In this scenario, schematically illustrated in Fig. 4, the innermost regions of the accretion flow, where the X-ray coronal power-law component is produced, accrete faster than the outer parts, due to the efficient removal of angular momentum by shocks excited in the disk by the debris. The enhanced accretion rate empties the inner disk, which would lead to the destruction of the magnetic field pattern and cutting off the energy source of the X-ray corona. The disruption of the corona leads to the disappearance of the power law component and to a drastic decrease of the X-ray luminosity of the system. The non-steady accretion flow and/or the shocks could be responsible for the soft component observed below 2 keV (see also Ricci et al. 2020). The lack of UV broad lines (Trakhtenbrot et al. 2019) with ionization energy eV, such as Mg ii 2798 ( eV) and C iv 1549 ( eV), also suggests a depletion of the inner disk. As the inner disk is replenished by material flowing in from the outer disk, the magnetic field around the SMBH is reformed, and restarts powering the X-ray corona; this leads to the reappearance of the power-law component in the X-ray spectrum. During this period an increase in the overall X-ray luminosity is expected, consistent with our observations. The asymptotic luminosity limit at 1044 erg s-1 might indicate that, in this framework, the replenishment of the disk is Eddington-limited (Fig. 2). Interestingly, the observed decrease of the X-ray flux in PS16dtm after the event is similar to what we found for 1ES 1927+654 during the first months after the event, although no re-brightening has been observed so far in this source. 1ES 1927+654 also shares some observational properties with super-soft AGN (e.g., Terashima et al. 2012; Miniutti et al. 2019; Giustini et al. 2020), objects that could be associated to TDEs (e.g., Shu et al. 2018; King 2020), such as the harder-when-brighter behavior (see Ricci et al. 2020 for details), and a very prominent blackbody component, in particular during the lower luminosity intervals.
4. Summary and conclusions
1ES 1927+654 is a type-2 AGN that was recently found to develop broad optical emission lines after an optical outburst (23 December 2017; Trakhtenbrot et al. 2019). Following the changing-look event, we started an intense 450-day X-ray monitoring campaign, which includes observations from NICER (265 pointings), Swift (14) and XMM-Newton/NuSTAR (3). Our observations show that:
-
•
The source is extremely variable both on long and short time scales (see Fig. 1), with the flux changing up to dex in days, and up to dex in hours. The luminosity of the source is found to first show a strong dip down to , and then a constant increase in luminosity to levels exceeding the pre-outburst level 300 days after the optical event detection, rising up asymptotically to .
-
•
After the optical outburst the power-law component produced in the X-ray corona, which is ubiquitously observed in AGN, was found to have almost completely disappeared (Fig. 2). The X-ray spectrum was instead dominated by a very strong blackbody component with eV. During the first (May–August 2018) observations only a very faint power-law emission was detected at keV, carrying only of the total 0.3–2 keV flux.
-
•
A clear positive correlation between the ratio of the power-law and blackbody flux () in the 0.3–2 keV range and the luminosity is found stacking the NICER spectra (Fig. 3). At the lowest luminosities () the ratio is , i.e. times lower than the value found in 2011 (), before the optical outburst. As the X-ray luminosity of the source increases, the X-ray corona is recreated, and a very soft power-law component () reappears, and dominates the emission for 0.3–2 keV luminosities , days after the beginning of the event.
These results show that changing-look events can be associated with dramatic and rapid transformations of the innermost regions of accreting SMBHs. We speculate that the behavior of 1ES 1927+654 could be caused by the tidal disruption of a star by the accreting black hole, which is expected to deplete the innermost regions of the accretion flow (Chan et al. 2019), therefore disrupting the magnetic field powering the X-ray corona (Fig. 4). As the inner regions of the accretion flows are replenished, the magnetic field around the SMBH is reformed, and restarts powering the X-ray corona. This would lead to the reappearance of the power-law component and to the increase of the X-ray luminosity.
Our coordinated multi-wavelength observations of the dramatic transformation of 1ES 1927+654 offer an unprecedented opportunity to probe accretion physics, and to understand the relation between changing-look events and the innermost regions of the accreting system. Upcoming surveys, such as those that are or will be carried out by eROSITA (Merloni et al. 2012), the Einstein Probe (Yuan et al. 2015) and SDSS-V (Kollmeier et al. 2017), are designed to reveal large samples of similar events, allowing to further constrain the typical timescales and the occurrence rates of such transformative events, and to understand their importance to massive black hole growth
References
- Arzoumanian et al. (2014) Arzoumanian, Z., Gendreau, K. C., Baker, C. L., et al. 2014, in Proc. SPIE, Vol. 9144, Space Telescopes and Instrumentation 2014: Ultraviolet to Gamma Ray, 914420
- Auchettl et al. (2017) Auchettl, K., Guillochon, J., & Ramirez-Ruiz, E. 2017, ApJ, 838, 149
- Blanchard et al. (2017) Blanchard, P. K., Nicholl, M., Berger, E., et al. 2017, ApJ, 843, 106
- Campana et al. (2015) Campana, S., Mainetti, D., Colpi, M., et al. 2015, A&A, 581, A17
- Chan et al. (2019) Chan, C.-H., Piran, T., Krolik, J. H., & Saban, D. 2019, ApJ, 881, 113
- Dexter & Begelman (2019) Dexter, J., & Begelman, M. C. 2019, MNRAS, 483, L17
- Dunn et al. (2010) Dunn, R. J. H., Fender, R. P., Körding, E. G., Belloni, T., & Cabanac, C. 2010, MNRAS, 403, 61
- Elitzur et al. (2014) Elitzur, M., Ho, L. C., & Trump, J. R. 2014, MNRAS, 438, 3340
- Elvis et al. (1994) Elvis, M., Wilkes, B. J., McDowell, J. C., et al. 1994, ApJS, 95, 1
- Fabian et al. (2009) Fabian, A. C., Zoghbi, A., Ross, R. R., et al. 2009, Nature, 459, 540
- Gallo et al. (2013) Gallo, L. C., MacMackin, C., Vasudevan, R., et al. 2013, MNRAS, 433, 421
- Gehrels et al. (2004) Gehrels, N., Chincarini, G., Giommi, P., et al. 2004, ApJ, 611, 1005
- Gendreau et al. (2012) Gendreau, K. C., Arzoumanian, Z., & Okajima, T. 2012, in Proc. SPIE, Vol. 8443, Space Telescopes and Instrumentation 2012: Ultraviolet to Gamma Ray, 844313
- Giustini et al. (2020) Giustini, M., Miniutti, G., & Saxton, R. D. 2020, A&A, 636, L2
- Haardt & Maraschi (1991) Haardt, F., & Maraschi, L. 1991, ApJ, 380, L51
- Harrison et al. (2013) Harrison, F. A., Craig, W. W., Christensen, F. E., et al. 2013, ApJ, 770, 103
- Jansen et al. (2001) Jansen, F., Lumb, D., Altieri, B., et al. 2001, A&A, 365, L1
- Kara et al. (2018) Kara, E., Loewenstein, M., Remillard, R. A., et al. 2018, The Astronomer’s Telegram, 12169
- Karas & Šubr (2007) Karas, V., & Šubr, L. 2007, A&A, 470, 11
- Kaspi et al. (2000) Kaspi, S., Smith, P. S., Netzer, H., et al. 2000, ApJ, 533, 631
- Kawamuro et al. (2016) Kawamuro, T., Ueda, Y., Shidatsu, M., et al. 2016, PASJ, 68, 58
- Kimura et al. (2016) Kimura, M., Isogai, K., Kato, T., et al. 2016, Nature, 529, 54
- King (2020) King, A. 2020, MNRAS, 493, L120
- Kollmeier et al. (2017) Kollmeier, J. A., Zasowski, G., Rix, H.-W., et al. 2017, arXiv e-prints, arXiv:1711.03234
- Komossa (2015) Komossa, S. 2015, Journal of High Energy Astrophysics, 7, 148
- Kormendy & Ho (2013) Kormendy, J., & Ho, L. C. 2013, ARA&A, 51, 511
- LaMassa et al. (2015) LaMassa, S. M., Cales, S., Moran, E. C., et al. 2015, ApJ, 800, 144
- Liu et al. (2020) Liu, Z., Li, D., Liu, H.-Y., et al. 2020, arXiv e-prints, arXiv:2004.01517
- MacLeod et al. (2019) MacLeod, C. L., Green, P. J., Anderson, S. F., et al. 2019, ApJ, 874, 8
- Merloni & Fabian (2001) Merloni, A., & Fabian, A. C. 2001, MNRAS, 321, 549
- Merloni et al. (2012) Merloni, A., Predehl, P., Becker, W., et al. 2012, arXiv e-prints, arXiv:1209.3114
- Merloni et al. (2015) Merloni, A., Dwelly, T., Salvato, M., et al. 2015, MNRAS, 452, 69
- Miniutti et al. (2019) Miniutti, G., Saxton, R. D., Giustini, M., et al. 2019, Nature, 573, 381
- Nicholls et al. (2018) Nicholls, B., Brimacombe, J., Kiyota, S., et al. 2018, The Astronomer’s Telegram, 11391
- Noda & Done (2018) Noda, H., & Done, C. 2018, MNRAS, 480, 3898
- Rees (1988) Rees, M. J. 1988, Nature, 333, 523
- Remillard & McClintock (2006) Remillard, R. A., & McClintock, J. E. 2006, ARA&A, 44, 49
- Ricci et al. (2017) Ricci, C., Trakhtenbrot, B., Koss, M. J., et al. 2017, ApJS, 233, 17
- Ricci et al. (2018) Ricci, C., Ho, L. C., Fabian, A. C., et al. 2018, Monthly Notices of the Royal Astronomical Society, 480, 1819
- Ricci et al. (2020) Ricci, C., et al. 2020, Submitted to ApJ
- Ruan et al. (2019) Ruan, J. J., Anderson, S. F., Eracleous, M., et al. 2019, ApJ, 883, 76
- Shappee et al. (2014) Shappee, B. J., Prieto, J. L., Grupe, D., et al. 2014, ApJ, 788, 48
- Shu et al. (2018) Shu, X. W., Wang, S. S., Dou, L. M., et al. 2018, ApJ, 857, L16
- Śniegowska & Czerny (2019) Śniegowska, M., & Czerny, B. 2019, arXiv e-prints, arXiv:1904.06767
- Terashima et al. (2012) Terashima, Y., Kamizasa, N., Awaki, H., Kubota, A., & Ueda, Y. 2012, ApJ, 752, 154
- Tonry et al. (2018) Tonry, J. L., Denneau, L., Heinze, A. N., et al. 2018, PASP, 130, 064505
- Trakhtenbrot & Netzer (2012) Trakhtenbrot, B., & Netzer, H. 2012, MNRAS, 427, 3081
- Trakhtenbrot et al. (2019) Trakhtenbrot, B., Arcavi, I., MacLeod, C. L., et al. 2019, ApJ, 883, 94
- Yang et al. (2018) Yang, Q., Wu, X.-B., Fan, X., et al. 2018, ApJ, 862, 109
- Yuan et al. (2015) Yuan, W., Zhang, C., Feng, H., et al. 2015, arXiv e-prints, arXiv:1506.07735
Appendix A Black hole mass and Eddington ratio
A black hole mass of has been inferred by considering the width of the broad Balmer lines (Trakhtenbrot et al. 2019). However, due to the transient nature of the event, the clouds emitting the broad Balmer lines might not have had the time to virialize, as shown by their variable widths (Trakhtenbrot et al. 2019). The stellar mass of the galaxy inferred from K-band photometry (e.g., Kormendy & Ho 2013) suggests a lower black hole mass (; Li et al. in preparation).
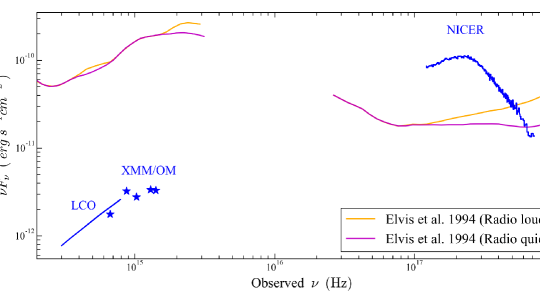
At times days after the event the optical/UV flux had decreased strongly (Trakhtenbrot et al. 2019; panel D of Fig. 1), and most of the emission could be produced in the X-rays. The variability in the X-rays and optical/UV are in fact completely uncorrelated (Fig. 1) and a very strong emission in the X-ray band does not correspond to an increased flux in the optical/UV. While the X-ray emission oscillates between and , the bolometric luminosity inferred from the 5100 flux (using a bolometric correction of =9; Kaspi et al. 2000) is considerably lower (). Similarly, even considering the bolometric luminosity from the near-UV (=2–4; Trakhtenbrot & Netzer 2012) one would obtain . Thus that at the highest X-ray luminosities, the 0.5–10 keV emission is orders of magnitude higher than the bolometric luminosity inferred from the optical or UV. This is also illustrated in Fig. 5, which shows that the spectral energy distribution of the source appears to be dominated by the X-ray emission, and is very different from what is typically found in AGN (Elvis et al. 1994). Therefore at we could consider a 0.5–10 keV bolometric correction of , and the maximum luminosity of 1ES 1927+654 would correspond to for (see panel A of Fig. 1).