Scientific comment on “Tail risk of contagious diseases”
Abstract
Cirillo and Taleb Cirillo_Taleb study the size of major epidemics in human history in terms of the number of fatalities. Using the figures from 72 epidemics, from the plague of Athens (429 BC) to the COVID-19 (2019-2020), they claim that the resulting fatality distribution is “extremely fat-tailed”, i.e., asymptotically a power law. This has important consequences for risk, as the mean value of the fatality distribution becomes infinite. Reanalyzing the same data we find that, although the data may be compatible with a power-law tail, these results are not conclusive, and other distributions, not fat-tailed, could explain the data equally well. Simulation of a log-normally distributed random variable provides synthetic data whose statistics are undistinguishable from the statistics of the empirical data.
Cirillo and Taleb Cirillo_Taleb identify “fat-tailed” distributions with regularly varying distributions Voitalov_krioukov , defined by a complementary cumulative distribution function (or survival function, probability of being above ) given by , with the exponent (of , and the tail index) and an unspecified slowly varying function (for example, a function that tends to a constant when , but not only). Roughly speaking, a “fat-tailed” distribution becomes a power law asymptotically. Be aware that fat-tailed distributions are long-tailed distributions, which are heavy-tailed distributions in their turn, but not the opposite Voitalov_krioukov .
As an alternative, we consider the truncated log-normal (ln) distribution, which is not fat-tailed but is subexponential (and therefore long-tailed and heavy-tailed Voitalov_krioukov ). Its probability density is
for (and zero otherwise), with and the mean and standard deviation of the underlying (untruncated) normal distribution, a lower cut-off, and erfc the complementary error function. The log-normal distribution has been an important competitor of the power law for the size distribution of structures and events in complex systems Malevergne_Sornette_umpu ; Corral_Gonzalez ; Corral_Arcaute .
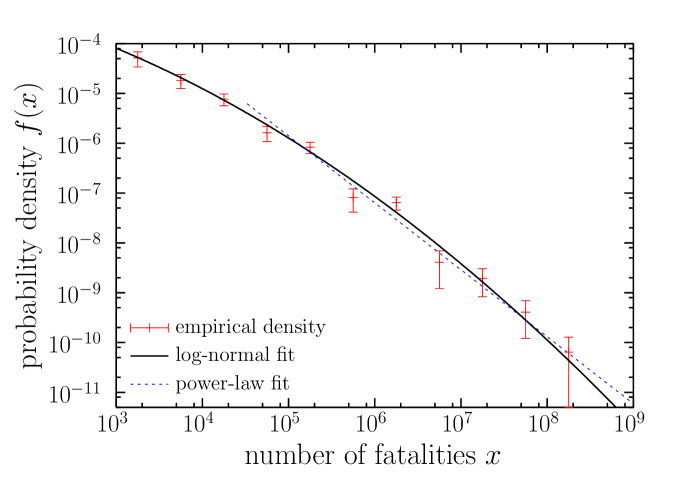
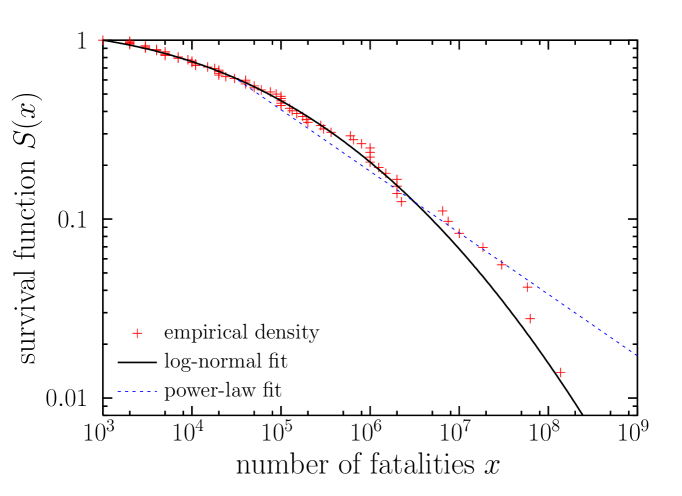
We fit the truncated log-normal to the epidemic data of Ref. Cirillo_Taleb using the method of Ref. Corral_Gonzalez , obtaining (fitting the whole data set), and (value ; scale parameter ). The empirical estimation of the probability density of the data together with the obtained fit are shown in Fig. 1. A comparison with a power-law (pl) fit for the tail (, see Ref. Corral_Gonzalez ) shows that both fits are very close to each other, but also that the power law, with and (value ), gives a higher probability than the log-normal for the most extreme events (as expected).
Next we will compare the statistical behavior of the epidemic empirical data of Ref. Cirillo_Taleb with that of the simulation of a truncated log-normal distribution (with the values of the parameters given above and events).
(a)
(b)
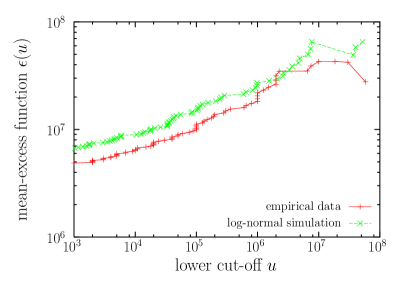
Cirillo and Taleb Cirillo_Taleb propose two main ways to check fat-tailness. One of this uses the mean-excess function , where the brackets denote expected value. This is the same as the expected residual size Kalbfleisch2 (see also Ref. Schroeder ) used in reliability theory and characterizing the distribution in a way totally equivalent to or , provided that the first moment of the distribution is finite (, but note that for this is not the case). Figure 2(a) shows how the mean-excess function of the log-normally simulated data shows the same pattern as the result for the empirical data.
(a)
 (b)
(b)
(c)
 (d)
(d)
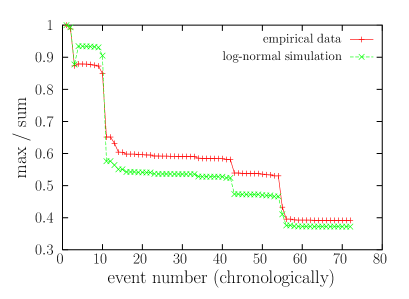
The other approach in Ref. Cirillo_Taleb uses the (partial) maximum-to-sum ratio (the maximum of the values divided by the sum of the values). As , this ratio should tend to zero when the mean of the distribution is finite (as it happens with the log-normal but not with the power law when ). We again compare the empirical data with the simulated data, sorting the simulated data in order that the ranks of the sizes (number of fatalities) follow the same temporal pattern as the empirical data (i.e., the largest simulated event is always put on the 11th position, where the Black Death, the largest event on record, takes place in the original data, and so on). The results, displayed at Fig. 2(b), show again that the behavior of synthetic log-normal data is very close to that of the empirical data. Thus, although the theory teaches us that the maximum-to-sum ratio tends to zero when if the distribution has a finite mean, this convergence can be rather slow, as it happens with the log-normal distribution for the parameter values that describe the epidemic data.
Now we provide complementary evidence that the log-normal distribution is a good fit of the epidemic data of Ref. Cirillo_Taleb . In fact, the power law can be considered a particular case of the truncated log-normal (in the same way that the exponential is a particular case of the truncated normal distribution when and Castillo ). In this sense, the log-normal will always provide a better fit. However, on the other hand, it may happen that this improvement in the fit is not significant, and then the power-law fit suffices for describing the data. This is something that can be evaluated by a likelihood-ratio (LR) test pawitan2001 .
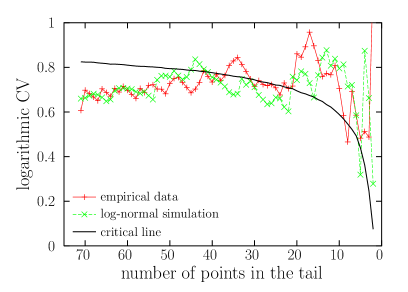
Taking advantage of the fact that the LR between both distributions is a decreasing function of the logarithmic coefficient of variation (CV) Castillo , this provides a very simple way to perform the LR test (without the need of performing maximum-likelihood fitting): critical values of the LR translate into critical values of the logarithmic CV. When this quantity is close enough to one, the power-law hypothesis cannot be rejected, and when it departs significantly from one (from below), the power law is rejected in favor of the log-normal.
The test is performed for different values of the lower cut-off , and the results, for the complete data set, are displayed on Fig. 2(c). This shows that only for the 21 largest epidemics the power-law tail is not rejected in favor of the log-normal. The corresponding cut-off turns out to be at about 350,000 fatalities. In other words, the 21 epidemics with more than 350,000 casualties are well described by a power law (the improvement brought by the log-normal is not significant), but, including events below 350,000, the log-normal fit is significantly better (for the full range). Applying the same procedure to the log-normally simulated data reproduces again the pattern obtained for the empirical data, as also shown in the figure.
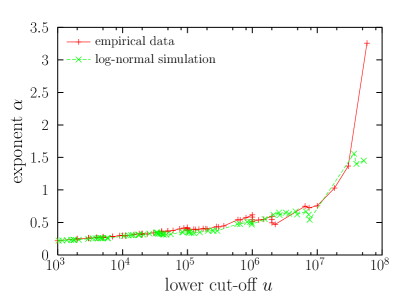
Assuming that a power law can describe the largest epidemics (in terms of fatalities), which would be the value of the corresponding power-law exponent ? Above, for , we report , but for the value is larger. In fact, the value of is not stable at all, growing when the lower cut-off increases (this is already apparent in the results of Cirillo and Taleb Cirillo_Taleb ), which prevents that one can establish a well-defined exponent Baro_Vives . Indeed, Fig. 2(d) shows the resulting exponents as a function of , comparing the original (empirical) data with the log-normally simulated ones. It is clear that the simulated data provides a pattern very similar to the empirical one, with an increase of the value of the exponent when increases. Indeed, this increasing behavior of the fitted exponent is what one expects from a log-normal distribution.
We have shown how the probability distribution of the number of fatalities of historical epidemics can be well explained by a log-normal distribution, which is a distribution that is empirically similar to the power law but quite different from a theoretical point of view (in particular, the mean and all moments of a log-normal distribution are well defined). Our work shows the importance of considering alternative probability models when fitting heavy-tailed distributed data (which is different from “fat-tailed’ data” Voitalov_krioukov ), as well of the key role of computer simulations to contrast the validity of theoretical results when the number of data is not infinite.
I acknowledge discussions with Isabel Serra and support from projects FIS2015-71851-P and PGC-FIS2018-099629-B-I00 from Spanish MINECO and MICINN.
References
- (1) P. Cirillo and N. N. Taleb. Tail risk of contagious diseases. Nature Phys., 16:606–613, 2020.
- (2) I. Voitalov, P. van der Hoorn, R. van der Hofstad, and D. Krioukov. Scale-free networks well done. Phys. Rev. Research, 1:033034, 2019.
- (3) Y. Malevergne, V. Pisarenko, and D. Sornette. Testing the Pareto against the lognormal distributions with the uniformly most powerful unbiased test applied to the distribution of cities. Phys. Rev. E, 83:036111, 2011.
- (4) A. Corral and A. González. Power law distributions in geoscience revisited. Earth Space Sci., 6(5):673–697, 2019.
- (5) A. Corral, F. Udina, and E. Arcaute. Truncated lognormal distributions and scaling in the size of naturally defined population clusters. Phys. Rev. E, 101:042312, 2020.
- (6) A. Deluca and A. Corral. Fitting and goodness-of-fit test of non-truncated and truncated power-law distributions. Acta Geophys., 61:1351–1394, 2013.
- (7) J. D. Kalbfleisch and R. L. Prentice. The Statistical Analysis of Failure Time Data. Wiley, Hoboken, NJ, 2nd edition, 2002.
- (8) M. Schroeder. Fractals, Chaos, Power Laws. Freeman, New York, 1991.
- (9) J. del Castillo and P. Puig. The best test of exponentiality against singly truncated normal alternatives. J. Am. Stat. Assoc., 94:529–532, 1999.
- (10) Y. Pawitan. In All Likelihood: Statistical Modelling and Inference Using Likelihood. Oxford UP, Oxford, 2001.
- (11) J. Baró and E. Vives. Analysis of power-law exponents by maximum-likelihood maps. Phys. Rev. E, 85:066121, 2012.