Microscopic dynamics of the evacuation phenomena
Abstract
We studied the room evacuation problem within the context of the Social Force Model. We focused on a system of 225 pedestrians escaping from a room in different anxiety levels, and analyzed the clogging delays as the relevant magnitude responsible for the evacuation performance. We linked the delays with the clusterization phenomenon along the faster is slower and the faster is faster regimes. We will show that the faster is faster regime is characterized by the presence of a giant cluster structure (composed by more than 15 pedestrians), although no long lasting delays appear within this regime. For this system, we found that the relevant structures in the faster is slower regime are those blocking clusters that are somehow attached to the two walls defining the exit. At very low desired velocities, very small structures become relevant (composed by less than 5 pedestrians), but at intermediate velocities (m/s) the pedestrians involved in the blockings increases (not exceeding 15 pedestrians).
keywords:
Emergency evacuation , Social force model , Blocking clusters , Clogging delaysPACS:
45.70.Vn , 89.65.Lm1 Introduction
The problem of emergency evacuations has become relevant in the last
decades due to the increasing number and size of mass events
(religious events, music festivals, etc). The evacuation through
narrow pathways or doorways appears as one of the most problematic scenarios in
the literature. Many experiments and numerical simulations
have been carried out for a better understanding of the crowd behavior in a
variety of situations. The door width [1, 2, 3, 4, 5, 6, 7, 8, 9], the crowd
composition [6, 10], or even the position of the
exit [2, 11] raise as relevant magnitudes affecting
the evacuation performance. The environmental and contextual realism, the
pressure level, the occupancy density, the sample size, etc. are some inherent
limitations of their experiments. Thus, the comparison between the results of
the controlled experiments and the emergency escape behavior is quite
controversial [1].
Ethical requirements in experimental setting impedes reproduce a
real emergency situation. In this sense, the form that experimental researchers
simulates a competitive scenario differs from one to another experiment.
Threfore, many controlled experiments on the pedestrians’ egress
time show dissimilar results. For instance, Refs. [4, 12, 13] report that under a simulated competitive
scenario (say, allowing the contact between the pedestrians), the more the
pedestrian’s anxiety to reach the exit, the greater the evacuation time. But
other experimental reports provide evidence of decreasing evacuation times for
increasing escaping desires [1, 6]. The former
correspond to a “faster-is-slower” behavior, while the latter correspond to a
“faster-is-faster” behavior. Whether the dominant behavior is
“faster-is-slower” or “faster-is-faster” seems to be a matter of the
pushing aggressiveness, in spite of the desire to reach the
exit [1]. Thus, it has been proposed recently that the term
“faster-is-slower” should be replaced by the more precise one: “aggressive
egress-is-slower”.
The Social Force Model (SFM) introduced by Helbing [14] was the
first model to accomplish a “faster-is-slower” effect for moderate to high
anxiety levels within the crowd. This occurs whenever friction dominates the
pedestrian dynamic [15, 16, 17]. The
“faster-is-faster” phenomenon was also reported within this model, but for
very high pressures among the individuals [17].
The time-lapse between consecutive evacuees and the egress curve are one of
the most common measures for experimental and computational research
[6, 7, 8, 11, 12, 13, 16, 17]. The egress curve shows
that the leaving flow may occur either regularly or intermittently, depending on
the pedestrians’ anxiety to reach the exit. Clogging can be observed as
“arching structures” just before any narrowing of the leaving pathway
[14, 16, 17, 18]. Clogging has also been
related to the pressure inside the bulk on this system
[14, 16, 17, 19, 20, 21, 22, 23, 24].
Our aim is to analyze the relation between the delays of consecutive leaving
pedestrians and the topological structures among the crowd during the
faster is slower and faster is faster regimes. The work is
organized as follows. In Section 2 we introduce the dynamics
equations for evacuating pedestrians, in the context of the Social Force Model
(SFM). We also define the meaning of spatial
clusters. Section 3 details the simulation procedures used
to studying the room evacuation of a crowd under increasing anxiety levels.
Section 4 displays the result of our investigation, while the
conclusions are summarize in Section 5.
2 Theoretical background
2.1 The Social Force Model (SFM)
Our research was carried out in the context of the “social force model” (SFM) proposed by Helbing and co-workers [14]. This model states that human motion is caused by the desire of people to reach a certain destination at a certain velocity, as well as other environmental factors. It is a generalized force model, including socio-psychological forces, as well as “physical” forces like friction. These forces enter the Newton equation as follows.
| (1) |
where the subscripts correspond to any two pedestrians in the
crowd. means the current velocity of the pedestrian
, while and correspond to the “desired
force” and the “social force”, respectively. is the granular
force.
The “desired force” describes the pedestrians own desire to
move at the desired velocity . But, due to
environmental factors (i.e. obstacles, visibility), he (she) actually
moves at the current velocity . Thus, he (she) will
accelerate (or decelerate) to reach the desired velocity that will make
him (her) feel more comfortable. Thus, in the Social Force Model, the desired
force reads [14].
| (2) |
where is the mass of the pedestrian and represents
the relaxation time needed to reach his (her) desired velocity.
is the unit vector pointing to the target position. For
simplicity, we assume that remains constant during an evacuation process,
but changes according to the current position of the
pedestrian. Detailed values for and can be found in
Refs. [25, 14].
The “social force” represents the psychological tendency of any two pedestrians, say and , to stay away from each other (private sphere preservation). It is represented by a repulsive interaction force
| (3) |
where represents any pedestrian-pedestrian pair, or
pedestrian-wall pair. and are two fixed parameters (see
Ref. [16]). The distance is the sum of the
pedestrians radius, while is the distance between the center of mass
of the pedestrians and . stands for the unit vector in
the direction. For the case of repulsive feelings with the walls,
corresponds to the shortest distance between the pedestrian and the
wall [14, 26].
Any two pedestrians touch each other if their mutual distance is smaller than . Also, any pedestrian touches a wall if his (her) distance to the wall j is smaller than . In these cases, an additional force is included in the model, called the “granular force” . It is composed by two forces: a sliding friction and a body force. The expression for this force is
| (4) |
where and are fixed parameters. The function
is equal to its argument if (i.e.
if pedestrians are in contact) and zero for any other
case.
represents the relative tangential velocities of the sliding bodies (or between
the individual and the walls).
Notice that the sliding friction occurs in the tangential direction while the
body force occurs in the normal direction. Both are assumed to be linear with
respect to the net distance between contacting pedestrians. The coefficients
(for the sliding friction) and (for the
body force) are supposed to be related to the areas of contact and the clothes
material, among others.
2.2 Some definitions
In this section we define magnitudes which we have found useful in order to explore the system properties. We will focus our attention in two quantities
2.2.1 Clustering structures
Clusters
Many previous works showed that clusters of pedestrians play a fundamental role during the evacuation process [16, 15, 17]. In this sense, researchers demonstrated that there exist a relation between them and the clogging up of people. Clusters of pedestrians can be defined as the set of individuals that for any member of the group (say, ) there exists at least another member belonging to the same group () in contact with the former. Thus, we define a spatial cluster () following the mathematical formula given in Ref. [27].
| (5) |
where () indicate the ith pedestrian and is his
(her) radius (shoulder width). This means that is a set of pedestrians
that interact not only with the social force, but also with physical forces
(i.e. friction force and body force).
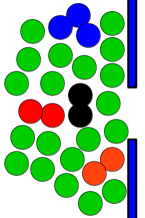
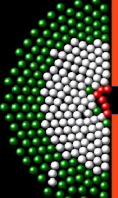
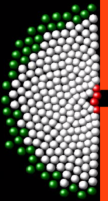
Fig. 1a shows four spatial clusters. We will label a spatial cluster composed by pedestrians as a -spatial cluster. Isolated pedestrians (i.e. without contact with their surrounding individuals) corresponds to a -spatial cluster (green circles in Fig. 1a).
Blocking clusters
The simulations show that some spatial clusters are able to block the
door. We will call blocking cluster to these kind of spatial clusters.
In this sense, a “blocking cluster” is defined as the minimum subset of
clusterized particles (i.e. spatial cluster) closest to the door whose
first and last component particles are in contact with the walls at both sides
of the door [16].
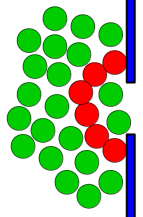
Fig. 1b shows a typical blocking cluster composed
by 6 pedestrians (red circles). As a special type of a spatial cluster, these
can be composed by different number of pedestrians. Our simulations show that
they can include from 5 to a maximum of 15 pedestrians for a door width of
0.92 m. Ref. [15] shows that this depends on door
width.
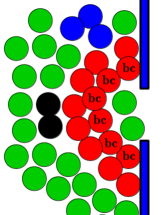
A blocking cluster may coexist simultaneously with other spatial clusters. In
this sense, we can observe in Fig. 1c three spatial
clusters: 2, 3 and 14-spatial cluster are present in it. Notice that
the blocking cluster belongs to a greater spatial cluster of 14 pedestrians. As
we will see in Section 4.3, this occurs more frequently for high
desired velocities.
2.2.2 Clogging delays
Frictional clogging delays
As stated in the last Section, blocking clusters are those spatial structures
that block the exit. Refs. [15, 16, 17] show that
they are responsible of worsening the evacuation performance. Thus, blocking
clusters are one of the mechanism of production of a delay. In
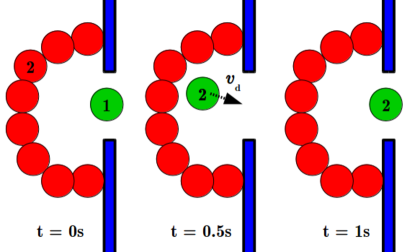
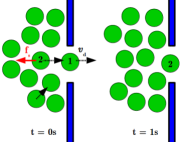
Fig. 2
we illustrate how this mechanism operates. Notice that the clogging delay
starts when individual “1” left the room. At the same time (i.e.,
s), we can observe that individual “2” belongs to a blocking
cluster, delaying his (her) outgoing. Later, at s, it breaks and
finally, individual “2” leaves the room at s.
We conclude that the clogging delay of s between individuals 1 and 2
was originated through a blocking cluster. In other words, the delay is a
consequence of the granular forces between pedestrians. So, we define a
frictional clogging delay as the clogging delays produce by a blocking
cluster.
We remark that the frictional clogging delay consists of two contributions. One
corresponds to the time that spends the individual jammed in the blocking
cluster. And the other corresponds to the time lapse between the breakup of the
blocking structure and the exit time of the pedestrians (belonging to this
blocking structure). This time corresponds to the transit time
(s in Fig. 2).
Social clogging delays
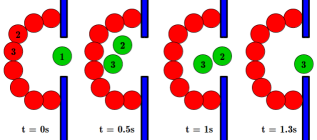
Animations show that there exists another generating mechanism for a delay.
On one side, this can occur without the presence of a blocking
cluster, as we illustrate in Fig. 3a. As in
Fig. 2, the delay of s corresponds to the
outgoing process between individuals 1 and 2. But, in this case,
he (she) is delayed due to the presence of individual 1. Notice that this
occurs due to the social force.
We stress the fact that this situations occur for low pedestrian
density. This may be the case when the anxiety level is small and therefore,
individuals do not each other. Thus, we can observe an unstable equilibrium
between the desired force and the social force near the door.
On other side, we have the situation in which the social force delayed the
outgoing of people can be reached through the breaking of a blocking cluster. We
illustrate this mechanism in Fig. 3b. Again, a
blocking cluster impedes many pedestrians to leave the room, particularly
individuals labeled as 2 ans 3. But, unlike
Fig. 2, it releases two pedestrians after it
breaks, like a burst, at s. Notice that s
corresponds to the same situation showed in
Fig. 3a at s. But, in this case the
clogging delay of s between 2 and 3 is shorter than the former
(i.e., s). Finally, notice that the clogging delay of
1 s between individuals 1 and 2 corresponds to a frictional clogging
delay (i.e., produced by a blocking cluster).
Summarizing, we conclude that the clogging delay of s and s in
Fig. 3a and
Fig. 3b, respectively, was produced by the
repulsion between pedestrians. In other words, the delay is a consequence
of the social force between them. So, we define a social
clogging delay as those clogging delays produced by the social interaction.
2.2.3 Arch-clogging correlation coefficient
In order to quantify the relationship between blocking cluster and clogging delay we define the “arch-clogging” correlation coefficient as follows [16]
| (6) |
where is the total number of clogging delays during the reported
time interval, corresponds to the time stamp for the blocking
cluster breaking and () corresponds to the time stamp for
the delay beginning (ending). The function is equal to 1 if , and zero otherwise. This means that is equal to
1 if the outgoing individual belonged to a blocking cluster during the interval
. Table 1 resumes the diagrams shown
in Figs. 2 and
3.
| Fig. | Pairwise (i,j) | (s) | (s) | (s) | (s) | clogging type | |
|---|---|---|---|---|---|---|---|
| 2 | (1,2) | 0 | 0.5 | 1 | 1 | 1 | frictional |
| 3a | (1,2) | 0 | - | 1 | 0 | 1 | social |
| 3b | (1,2) | 0 | 0.5 | 1 | 1 | 1 | frictional |
| 3b | (2,3) | 1 | - | 1.3 | 0 | 0.3 | social |
This correlation represents the fraction of frictional clogging delays (or social clogging delays) with respect to all the clogging delays appearing during the (stationary) evacuation process. Any value close to one indicates that most of the clogging delays belong to blocking clusters. On the contrary, if is close to zero, most of them belong to social force interactions.
3 Numerical simulations
The simulations were performed on a m m square room with
225 pedestrians inside. The occupancy density was set to people/m2, as
suggested by healthy indoor environmental regulations [28]. The room had
a single exit on one side, placed in the middle of it in order to avoid corner
effects. The door width was m, enough to allow up to two pedestrians
to escape simultaneously (side by side).
The pedestrians were modeled as soft spheres. They were initially
placed in a regular square arrangement along the room with random velocities,
resembling a Gaussian distribution with null mean value. The rms value for the
Gaussian distribution was close to m/s. The desired velocity was the
same for all the individuals. At each time-step, however, the desired direction
was updated, in order to point to the exit.
We used periodic boundary condition (re-entering mechanism) for the outgoing
pedestrians. That is, those individuals who were able to leave the room
were reinserted at the back end of the room and placed at the very back of the
bulk with velocity v = 0.1 m/s, in order to cause a minimal bulk
perturbation. This mechanism was carried out in order to keep the crowd size
unchanged, and therefore, the pressure among pedestrians.
According to the literature (see Ref [14]), the model
parameters used were s, N, m and
10kg m. However, the
pedestrian’s mass and radius were set according to the more realist values of
kg and m, as in Ref. [29]. Also, the
compression coefficient was set equal to
2.62 104 N m-1, according to the experimental value of the
human torso stiffness [30].
The simulations were performed using Lammps molecular dynamics simulator
with parallel computing capabilities [31]. The time integration
algorithm followed the velocity Verlet scheme with a time step of
s. We implemented special modules in C++ for upgrading the Lammps capabilities to attain the “social force model” simulations. We also
checked over the Lammps output with previous computations (see
Refs. [15, 16]).
Data recording was done at time intervals of 0.05, that is, at
intervals as short as 10% of the pedestrian’s relaxation time. The simulating
process lasted until 7000 pedestrians left the room.
The explored anxiety levels ranged from relaxed situations (m/s)
to highly stressing ones (m/s). This last value can hardly be reached
in real life situations. However, in Ref. [17], it was shown that
similar pressure levels can be reached in a big crowd with a moderate anxiety
level. Thus, this wide range of desired velocities allows us to study different
pressure scenarios. We also assumed that the pedestrians were not able to fall
due to the crowd pressure as in Ref. [30].
4 Results
Our results run along four major streams as follows:
-
1.
In Section 4.1 we revisit the context of the evacuation time. We further introduce other novel concepts that will be used throughout the work.
-
2.
In Section 4.2 we show the differences between the faster is slower and faster is faster regimes in terms of the clogging delays.
-
3.
In Section 4.3 we focus on the clusterization phenomenon at either the faster is slower and faster is faster regimes.
-
4.
In Section 4.4 we analyze the relationship between the size of the clustering structures and the corresponding clogging delays.
4.1 A review of the evacuation processes at bottlenecks
The evacuation time versus the desired velocity
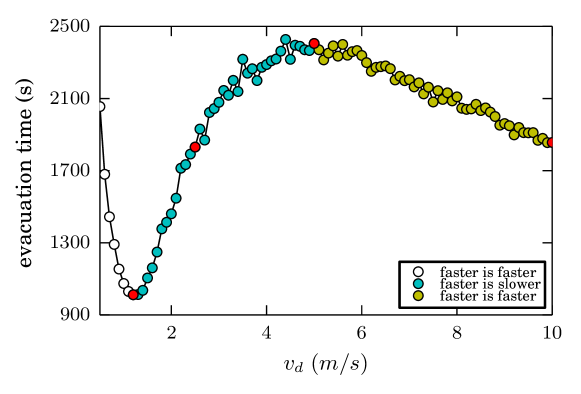
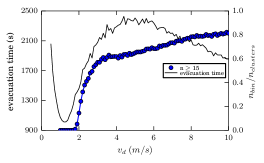
As a first step, we computed the evacuation time for a wide range of desired
velocities . This is shown in Fig. 4. We stress the fact that
the explored range corresponds to the one analyzed by Sticco et. al.
(see Ref. [17]) but, considering periodic boundary conditions.
This means that any pedestrian who left the room is introduced on the opposite
side of the bottleneck (see Section 3).
It can be seen in Fig. 4 the faster is slower (blue
circles) and the faster is faster (white and yellow circles) phenomena
as reported in Ref. [17]. Recall that the faster is slower
regime, introduced by Helbing et. al. [14] corresponds
to the increase in the evacuation time as the pedestrian’s anxiety level
increases. Thus, the evacuation efficiency reduces within this region. It was
shown in Ref. [15] that this is related to the presence of sliding
friction among pedestrians (and the walls).
Besides, it was reported in Ref. [17] that the evacuation time
decreases for very high desired velocities (i.e., high pressures).
This behavior corresponds to the faster is faster regime. It was
concluded (see Ref. [17]) that as the crowd pushing force
increases, the sliding friction at the “blocking cluster” seems not enough to
prevent this kind of structure from (completely) stopping the crowd movement.
This is the reason for the improvement of the evacuation time at the exit. We
call the attention that we are not considering the possibility of fallen
pedestrians due to high pressures (see Ref. [30] for details).
Further readings on the role of the sliding friction can be found in
Refs. [15, 16, 17].
As can be noticed from Fig. 4, the faster is slower regime
appears for desired velocities between 1 and m/s (approximately). This is
somewhat shifted from the range reported in Ref. [17]
((m/s), approximately). The same occurs for both faster is
faster effects. This discrepancy is a consequence of the periodic boundary
condition. The bulk pressure remains (almost) constant during the
stationary state for periodic boundary condition. But, it decreases for
non-periodic conditions, since pedestrians escape from the room. This phenomenon
is similar the one observed in Ref. [17] when varying the number of
pedestrians inside the room.
We will focus on four specific desired velocities in the next section.
These correspond to the minimum evacuation time (m/s), the
maximum evacuation time (m/s) and two desired velocities with similar
evacuation times but on different regimes. The desired velocities m/s
and m/s were chosen as representative of the faster is slower
and faster is faster phenomena, respectively.
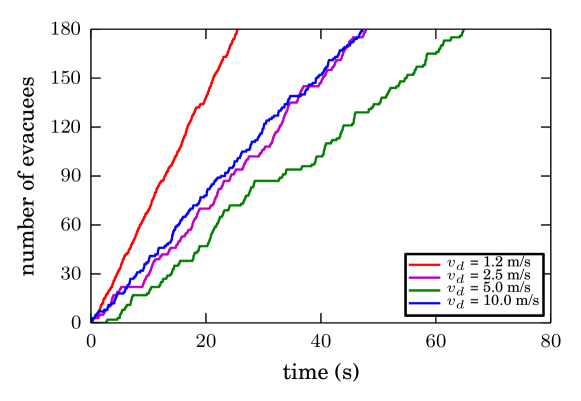
Discharge curves
We proceed to a first microscopic analysis of the evacuation process through the
discharge curves (say, the number of individuals that escape from the room over
time). Fig. 5 shows the discharge curves for four
desires velocities (see caption for details)
[16, 15, 17]. For each curve, the time
between consecutive evacuees (i.e. the delay) is represented by a
horizontal line.
It can be seen in Fig. 5 that the evacuation time for the
first 180 evacuees corresponds to the upper end of each discharge curve.
It can be seen that the desired velocities and m/s correspond to
the minimum and maximum evacuation time, respectively (say, s and s,
approximately). The curves for and m/s meet at the top of the
figure, as expected from Fig. 4. But most interesting, it can be
noticed an increase in the duration of the delays (represented by horizontal
segments) from the curve on the left to one on the right in
Fig. 5. It is worth mentioning that the evacuation time
corresponds to the sum of all delays, and thus, the increase in evacuation time
is related to the increase in the duration of delays. The relationship between
evacuation time and delays will be further analyzed in more detail in the next
section.
A statistical test on the (global) uniformity of the discharge curves was done
in A. It could be established that the flow of evacuees is not
uniform at the faster is slower and faster is faster regimes
(within a significance of ). However, a tendency towards uniformity could
be noticed (at least) for the faster is faster regime as the
individual’s anxiety level () increases.
In summary, the discharge curves show that the pedestrian flow is never
uniform (within a significance level), but delays tends to become more regular
for very high anxiety levels (or bulk pressures).
4.2 Clogging delays analysis
In this section we turn to study the mechanism by which different types of
clogging delays are generated. We analyze the clogging delays distributions and
the contribution of each type of delay to the overall evacuation time.
4.2.1 Production mechanism of a delay
As mentioned in Section 2.2.2, there are two categories of
clogging delays. The first one corresponds to those generated as a
consequence of the social force among individuals (see
Fig. 3). The second one corresponds to those
that occur due to blocking clusters (see Fig. 2).
The former corresponds to a social clogging delay, while the latter
corresponds for a frictional clogging delay. Fig. 6
plots the coefficient (see Eq. 6) as a function of the
clogging delays longer than (or equal to) any threshold .
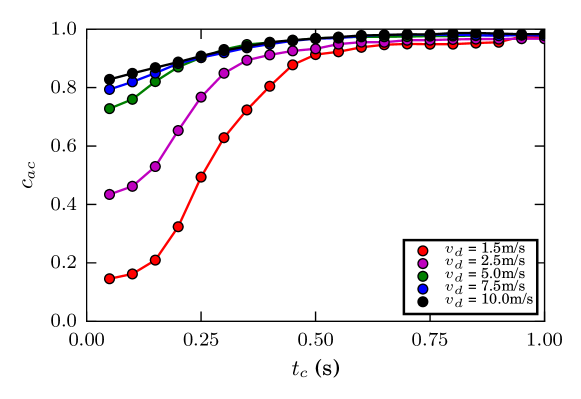
According to Fig. 6, the probability of finding frictional
delays increases among long delays. In other words, long lasting delays
commonly belong to blocking clusters. Thus, we can (almost) exclusively
classify any delay longer than s as a frictional clogging delay.
Notice that this criterion is fulfilled regardless of the value of the
desired velocity (within the explored range). The situation for short
clogging delays appears somewhat mixed. Not all delays less than s belong
to a blocking cluster.
Furthermore, the fraction of frictional delays increases for increasing desired
velocities (see Fig. 3). Recall from
B that the probability of blocking clusters also increases for
increasing values of . This is the reason for the increase of the fraction
of frictional clogging delays when increasing the desired velocity.
A careful examination of the evacuation animations shows that social delays may
also appear after the breaking process of a blocking cluster. This corresponds
to the burst released after the rupture, as exhibit in
Fig. 3b. We observed in the animations (not
shown) that this phenomenon occurs commonly as the desired velocity increases.
Therefore, social delays should not be considered as “opposed” to frictional
delays, but complementary to these.
The major conclusion from this Section is that long delays (say, greater than
s) can be associated to blocking clusters. But, those delays of short
duration may either be associated to social interactions or granular
interactions.
Our next step focuses on the relevance of the frictional and social clogging
delays on the evacuation time. We computed the evacuation time considering
these two categories of delays separately. Fig. 7 shows the
results.
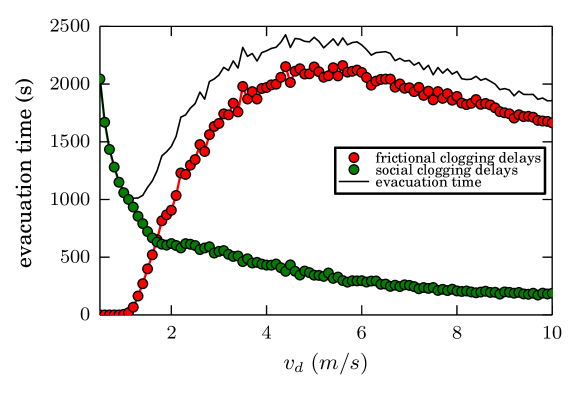
The evacuation time considering (adding) only the frictional delays (and thus
the blocking clusters) is qualitatively similar to the total evacuation time.
This corresponds to (almost) the entire explored interval (m/s).
However, this vanishes for m/s. Recall that people are very seldom
in contact between each other at such low desired velocities, and therefore, no
blocking clusters are present (see B).
The evacuation time associated to the social delays (i.e. social
clogging delays) decreases monotonically as the desired velocity increases. As
mentioned above, the individuals are very seldom in contact
for m/s (see Fig. 3a). Notice that
the total evacuation time and the social evacuation time coincide for
m/s, but no faster is slower effect takes place for the
latter at higher ’s (as expected).
4.2.2 Clogging delay distributions
We further computed the delays’s probability distribution, as shown in
Fig. 8. We chose the same desired velocities as in
Section 4 for the purpose of comparison. The distribution
corresponding to all the clogging delays and the frictional clogging
delays can be seen in red and blue bars, respectively. The latter corresponds
to a subset of the former. Notice that distributions are valid for the specific
door width mentioned in the caption (see Ref. [16] for more
details).
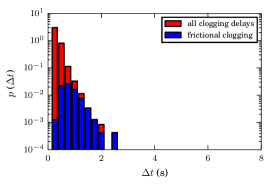
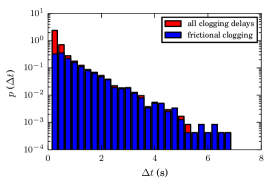
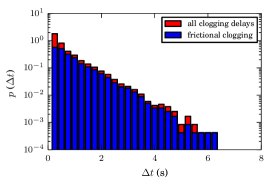
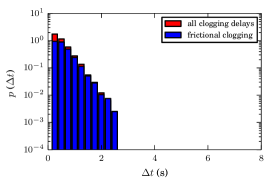
The delays shorter than s in Fig. 8 (approximately) are
present in all the plotted situations. But, clogging delays greater than s
occur only for the intermediate situations 2.5 and 5 m/s (see
Figs. 8b and 8c). Both
situations exhibit delays up to 7 s approximately. Recall that these levels
of correspond to the faster is slower regime (see
Fig. 4). The faster is slower regime includes long delays,
while the faster is faster regime stands for delays no longer than
s (under the explored conditions).
4.2.3 Relevance of the clogging delays
We concluded in Section 4.2.1 that almost all the delays longer
than s correspond to the presence of a blocking cluster. Therefore, they
correspond to frictional clogging delays. In
Section 4.2.2 we further noticed that long delays
(greater than s) appear during the faster is slower regime. We
focus on three categories: short (s), intermediate
(1 s s) and long (s) delays.
Fig. 9 shows the evacuation time for these types of
delays.
-
1.
Short clogging delays (s): This kind of delays are the only relevant ones for desired velocities below m/s. We already mentioned in B that no relevant blocking clusters appear at these desired velocities, and thus, all the clogging delays correspond to social clogging delays. Also, as can be seen this kind of delay does not allow us to distinguish the faster is slower and faster is faster regimes (above m/s).
-
2.
Intermediate clogging delays (1 s s): This category becomes relevant for m/s. Their qualitative behavior for m/s is similar to the total evacuation time. Thus, unlike the short clogging delays, these are a good observable to identify the faster is slower and faster is faster regimes. Also, the cumulative time due to both delays explains almost all of the evacuation time.
-
3.
Long clogging delays (s): They are only present for velocities between 1 and m/s (as we mentioned in Section 4.2.2). As can be seen, these delays are not decisive for the presence of the faster is slower effect. Also, the lack of long clogging delays may be partially responsible for the faster is faster phenomenon.
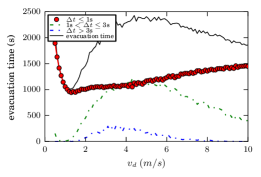
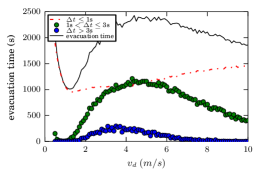
The following conclusions can be outlined from this Section. The analysis of
the delays show that the overall evacuation time is mainly due to
frictional clogging delays for m/s. Also, the slope of
the intermediate clogging delays (1 s s) allows us to
distinguish between the faster is slower and faster is faster
regimes (see Fig. 9).
4.3 Clustering structure analysis
In this section we turn to study the clustering structures. We analyze the different kind of spatial clusters and we explore how they change with the desired velocity.
4.3.1 The morphology in the bulk of the crowd
Fig. 10 shows four snapshots of the bulk close to
the exit. The shown situations correspond to the same desired velocities as in
Section 4.2. Red and white circles represent the blocking and
spatial clusters, respectively. We stress that the individuals in red (blocking
cluster) also belong to the spatial cluster (white color) (see
Fig. 10).


As can be seen in Fig. 10, the number of individuals in
contact increases with increasing desired velocities. This is the expected
picture for people pushing towards the exit. The harder they push (increasing
values of ), the larger the clogging region.
Notice that two small spatial clusters appear at m/s (see white
circles in Fig. 10a). But these merge into a single
spatial cluster of size 35, as the desired velocity increases to
m/s. However, it can be noticed that 4 individuals (green circles
in Fig. 10b) remain out of contact with their closest
neighbors. This is a rather common phenomenon for low desired velocities, as we
were able to observe in the animations (not shown).
Interesting, Fig. 10b, also shows a burst of 3
individuals escaping from the room. These correspond to the breaking of a
(former) blocking cluster (not shown). Therefore, this is associated to a
social clogging delay. Also, the snapshots in Figs. 10c
and 10d show a significant change in the size
relation between the blocking cluster and the spatial cluster for increasing
desired velocities. The ratio between this magnitudes is shown in
Fig. 11.
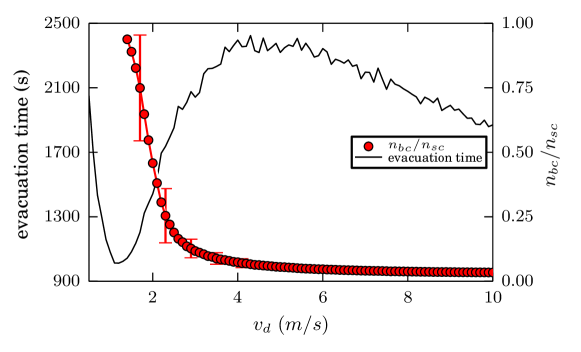
A sharp decay in the blocking-to-spatial ratio can be noticed in
Fig. 11. We immediately identify two regimes according
to Fig. 11. For m/s (approximately), the size
of the blocking cluster is seemingly of the same order as that of
the spatial cluster. For m/s, instead, the size of the blocking
cluster becomes negligible with respect to that of the spatial cluster.
We will next turn to study in more detail the size of the spatial cluster.
4.3.2 Size of spatial clusters
Recall that as the desired velocity increases, more people gets into contact
with each other, and therefore, the size of the spatial cluster increases for
increasing anxiety levels of the individuals. We classified the spatial clusters
into three categories (according to their size ) as follows: small
(), medium () and big (). We remark that
the medium category corresponds to the commonly observed size of the blocking
clusters. Fig. 12 shows the (normalized) number of spatial
clusters for each category (see caption for details). We will analyze each
category separately.
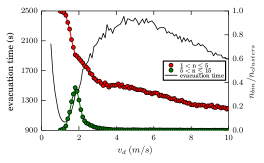
-
1.
Small spatial clusters (): The occurrence of small spatial clusters decreases monotonically as the desired velocity increases. The slope, however, appears sharp for m/s and decreases for m/s (approximately). The former behavior is complementary to an increment of the medium spatial clusters. Also, for m/s the small and big spatial clusters complement each other, while no medium clusters are present. An inspection of the animations shows that the big spatial cluster always surrounds the exit where the pressure maximizes. The small spatial clusters appear at the back of the “bulk”. The latter occur as a result of the perturbations when re-injecting pedestrians, and thus, should be considered as an artifact from the periodic boundary conditions.
-
2.
Medium spatial clusters (): They occur at the very beginning of the faster is slower effect and holds for a narrow range of desired velocities (say, between (m/s)). These are responsible for the increase in the evacuation time (as already known), but even before the evacuation time arrives to a maximum, the medium size clusters vanishes.
-
3.
Big spatial clusters (): They become significant above m/s, approximately. At this threshold, the pressure is high enough to force the pedestrians contact each other. A single big cluster would be expected to very high desired velocities.
4.4 The relation between the size of the spatial clusters and the frictional clogging delays
Recall from Section 4.2.3 that we classified the clogging
delays into three categories: short (s), intermediate
(1 s s) and long (s). We further
classified in Section 4.3.2 the size of the spatial clusters
into other three categories: small (), medium () and big
().
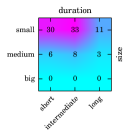
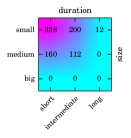
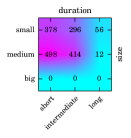
We now focus on the relationship between the size of the spatial
clusters and the corresponding clogging delays. This relationship, however, may
not be a one-to-one connection since the size of the spatial cluster can change
between the beginning of a delay and the rupture of a blocking cluster
(i.e. a subset of the spatial cluster). Thus, many spatial clusters
can be reported during a frictional clogging delay. The number of
spatial clusters (for each category) taking place between the beginning of a
frictional clogging delay and the rupture of the corresponding
blocking
cluster is shown in Fig. 13.
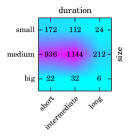
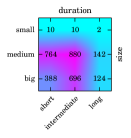
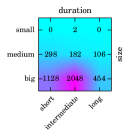
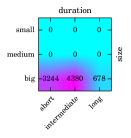
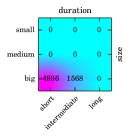
As a first insight, it becomes clear that some kind of correlation between the
size of the spatial cluster and the associated frictional clogging
delay exists. This correlation is different for different values of the
desired velocity (see Fig. 13). This is in agreement with
Figs. 9 and 12, since both
magnitudes depend on the desired velocity. Furthermore, we can recognize
two very different situations by reading the number of reported events inside
each cell (see caption for details). On the upper row of
Fig. 13 (plots (a) to (d)) only small and medium
spatial clusters are relevant. But, on the lower row (plots (e) to (h)), the
medium or big spatial clusters are the relevant ones. A closer examination,
though, shows that a single size is the only relevant one in all the plots
except for plots (c) and (e) ( and 2 m/s, respectively).
The sequence shown in Fig. 13 for increasing values of may be summarized as follows:
-
1.
The patterns (in violet) at and m/s correspond to a “two box” flat one. The same patter occurs at and 2.2 to m/s, but for different cluster sizes.
-
2.
The “four box” square patterns at and m/s are transition patterns between two flat ones.
-
3.
The small size category is relevant for m/s. The medium size category becomes relevant for (m/s). The big spatial clusters are significant for m/s.
Interestingly, Fig. 13 also shows that either the three
categories of frictional clogging delays and the spatial cluster sizes
are present for and m/s (all the cells are not empty). This
means that the categories are somehow “mixed” at these desired velocities. We
can find small, medium and big spatial clusters of all delays long.
Our major conclusions from this Section are as follows. First, two kinds of
spatial clusters are relevant within the faster is slower and
faster is faster regimes. From the point of view of the spatial
clusters, small and medium spatial clusters () dominate the scene for
desired velocities below m/s. These (almost always) match the blocking
cluster definition. But, for m/s, the giant spatial
cluster () becomes the relevant structure during the evacuation
process. We may associate the overall delays (for m/s) to the existence
of this structure rather than its inner most perimeter only (say, the blocking
cluster).
As a second conclusion, we noticed that (approximately) short and intermediate
frictional clogging delays can be associated with small spatial clusters for
low desired velocities (say, less or equal to m/s). Besides, these
clogging delays can be associated with big spatial clusters for desired
velocities greater than m/s. The situation in between, say
(m/s), is somewhat mixed: two “transitions” occur at
and 2 m/s (approximately). The former corresponds to a
smallmedium stage, while the latter corresponds to a
mediumbig stage. All these regimes attain small/intermediate
clogging delays.
5 Conclusions
Our research focused on the microscopic analysis of the evacuation process of self-driven particles confined in a square room with a single exit door. We simulated 225 individuals escaping through a door with a width of two times a pedestrian width. The simulations were done in the context of the Social Force Model. We were mainly interested in properly understanding the faster-is-slower and faster-is-faster phenomena, i.e. the relation between the flow of pedestrians and the formation of structures (clusters) which might impede the motion of the walkers.
We have found that as the desire velocity increases, the system evolves
from a condition in which the flow decreases with increasing to another
in which the flow increases with increasing . The cause of such a change
can be traced to the characteristics of the above mentioned blocking structures.
We have shown that the faster-is-slower and the
faster-is-faster are quite different phenomena from the standpoints of
the “frictional” clogging delays and the underlying clusterization structure.
The faster-is-slower occurs whenever the blocking clusters dominate
the scene, i.e. there is a structure which anchors to the walls of the
exit and is able to momentarily obstruct the exit, accomplishing moderate to
long lasting clogging delays (say, above 1 s). However, as the
increases, the pressure increases as well and then, the blocking cluster
becomes a giant cluster, involving (almost) all the crowd. The giant cluster is
not anchored to the walls but resembles a very viscous fluid. Keep in mind that
in the Social Force Model the agents are not represented by hard spheres but by
soft spheres and as such the resistance opposed by the agents can be overcome
by a force big enough. The harder the pedestrians push, the weaker the
slowing-down, achieving the faster-is-faster phenomenon. This
phenomenon has not been reported on other granular systems, to our knowledge.
For the set of parameters of the Social Force Model used in this work the
analysis of the correlation between the clogging delays and the spatial
structures showed that for m/s, only short (s) and
intermediate (1 s s) clogging delays are produced during
the giant cluster scenario. This means that the pushing efforts overcome the
friction between pedestrians belonging to the “blocking” cluster, and thus,
this kind of structures are not able to hold for a very long time (say, longer
than 3 s). The blocking dynamic is replaced then by the collective dynamic of
the giant cluster. Curiously, we noticed that short delays become increasingly
relevant during the faster-is-faster scenario, since the burst of
leaving pedestrians tends to be increasingly regular.
A by-product of our investigation is that we can distinguish between two categories of clogging delays, according to their production mechanism. The social clogging delays corresponds to those that are generated as a consequence of the social force among individuals. Instead, the frictional clogging delays are a consequence of the granular force among individual. However, social and frictional clogging delays are complementary delays whenever a blocking cluster breaks down, releasing a burst of individuals. We should call the attention on this point when analyzing the overall delay of an evacuation.
Acknowledgments
This work was supported by the National Scientific and Technical Research Council (spanish: Consejo Nacional de Investigaciones Científicas y Técnicas - CONICET, Argentina) and grant Programación Científica 2018 (UBACYT) Number 20020170100628BA. G. Frank thanks Universidad Tecnológica Nacional (UTN) for partial support through Grant PID Number SIUTNBA0006595.
Appendix A Statistical analysis of the discharge curves
This analysis was carried out by means of the Kolmogorov-Smirnov test. This
non-parametric statistical test is a goodness of fit test, which allows
comparing the distribution of an empirical sample with another, or, to what is
expected to be obtained theoretically (null hypothesis) [32].
The following statistic is considered
| (7) |
where S and F represent the cumulative distributions of
the sampled data and the theoretical one, respectively. As can be seen, this
test quantifies the maximum (absolute) difference between both distributions.
In our case, the discharge curves are compared against a uniform flow of
individuals. The latter corresponds to delays of the same duration. This is
useful for analyzing the relative significance of the delays during the
evacuation process.
To carry out the Kolmogorov-Smirnov test, 40 discharge curves were analyzed,
each of which correspond to the evacuation process of 180 individuals. The 40
selected processes were chosen separately in time, in order to be
uncorrelated. The results are presented in Fig. 14.
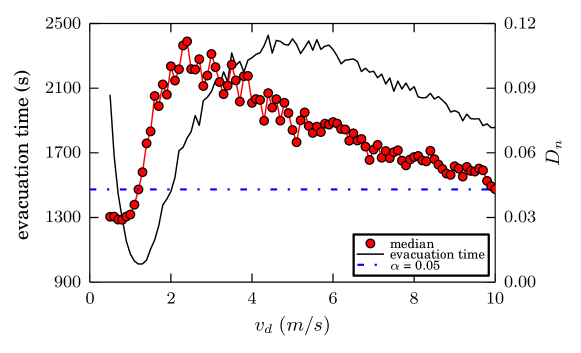
As can be seen, the behavior of the median coincides qualitatively with that
corresponding to the evacuation time. However, both curves are horizontally
shifted from each other. The maximum of the curve corresponding
to the median is approximately at m/s, unlike what happens with the
evacuation time (m/s). It should be noted that the former occurs in
the moment of the inversion of the concavity of the curve associated with the
evacuation time.
We can identify two regimes from Fig. 14, depending on the
desired velocity. For m/s, the discrepancy between the simulated and
uniform flow increases as the desire velocity increases. This means that the
flow becomes more irregular as the anxiety of the individuals increases. As will
be seen in Section 4.3, this is due to the influence of blocking
clusters during the evacuation process.
On the other hand, for m/s, the discrepancy as the
desire to escape from the room increases. Thus, the flow becomes more regular.
It is worth mentioning that this behavior starts during the faster is
slower effect (and continues during the faster is faster effect). In
addition, it is possible to notice a linear behavior of the median in this range
of desired velocity.
Finally, in order to quantify the discrepancy between both distributions, a
significance level of is indicated in Fig. 14 (dashed
line). As can be seen, the null hypothesis is rejected for approximately the
entire explored range of desired velocity. On the other hand, it should be
noted that this is not possible before the minimum evacuation time
(i.e. m/s). At this interval, the individuals are actually
not in contact. Therefore, the flow of evacuees occurs uninterruptedly due to
the absence of blocking clusters. Thus, we can only concluded that the flow it
is not uniform.
Appendix B Blocking cluster probability
We analyze here the probability of occurrence of a blocking cluster (see
Fig. 15). That is, the percentage of time that the system
is in the presence of a blocking cluster. Recall that in
Fig. 6 it was observed that, for any given delay value, as
the desired velocity increases, so does the probability that this delay
was generated by a blocking cluster.
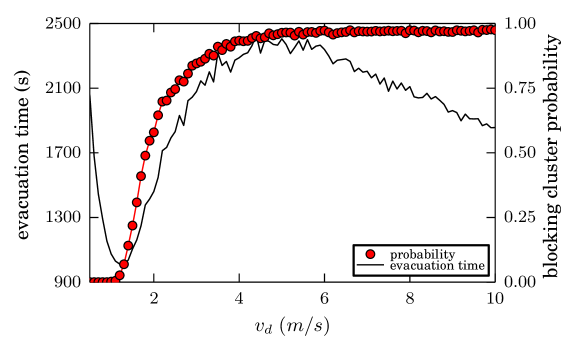
As can be seen, the higher the desired velocity, the greater the probability of
attaining a blocking cluster. Moreover, it has an asymptotic behavior
above m/s, approximately. This means that above this desired
velocity, the presence of blocking clusters is permanent over time. However, we
can note that despite the still presence of a blocking cluster in front of
the door, evacuation time decreases. The explanation for this phenomenon are
explained in Section 4.3.
The above results are in agreement with those reported in
Refs. [15, 16], in spite of the different boundary
conditions, ranges of desired velocity and/or the value of the elastic constant
[29]. But, unlike the results reported in the literature
where this behavior occurs in the presence of the faster is slower
effect, in this case we observe that it is also satisfied during the
faster is faster effect.
Besides, we were able to observe through the process animations that at the
moment in which a blocking cluster is fractured, it is replaced by another
immediately for m/s (i.e. probability of blocking cluster
equal to one). Also, the videos show that the number and composition of
individuals that make up the blocking cluster changes dynamically over time.
However, despite this, the presence of a blocking cluster in front of the door
is permanent for m/s.
References
References
- [1] M. Haghani, M. Sarvi, Z. Shahhoseini, When ‘push’ does not come to ‘shove’: Revisiting ‘faster is slower’ in collective egress of human crowds, Transportation Research Part A: Policy and Practice 122 (2019) 51 – 69.
- [2] W. Jianyu, M. Jian, L. Peng, C. Juan, F. Zhijian, L. Tao, M. Sarvi, Experimental study of architectural adjustments on pedestrian flow features at bottlenecks 2019 (8) (2019) 083402.
- [3] J. W. Adrian, M. Boltes, S. Holl, A. Sieben, A. Seyfried, Crowding and queuing in entrance scenarios: Influence of corridor width in front of bottlenecks, 2018.
- [4] A. Garcimartín, D. R. Parisi, J. M. Pastor, C. Martín-Gómez, I. Zuriguel, Flow of pedestrians through narrow doors with different competitiveness, Journal of Statistical Mechanics: Theory and Experiment 2016 (4) (2016) 043402.
- [5] W. Liao, A. Seyfried, J. Zhang, M. Boltes, X. Zheng, Y. Zhao, Experimental study on pedestrian flow through wide bottleneck, Transportation Research Procedia 2 (2014) 26 – 33, the Conference on Pedestrian and Evacuation Dynamics 2014 (PED 2014), 22-24 October 2014, Delft, The Netherlands.
- [6] W. Daamen, S. Hoogendoorn, Emergency door capacity: Influence of door width, population composition and stress level, Fire Technology 48 (2012) 55–71.
- [7] J. Liddle, A. Seyfried, B. Steffen, W. Klingsch, T. Rupprecht, A. Winkens, M. Boltes, Microscopic insights into pedestrian motion through a bottleneck, resolving spatial and temporal variations.
- [8] A. Seyfried, O. Passon, B. Steffen, M. Boltes, T. Rupprecht, W. Klingsch, New insights into pedestrian flow through bottlenecks, Transport. Sci. 43 (2007) 395–406.
- [9] J. Liddle, A. Seyfried, W. Klingsch, T. Rupprecht, A. Schadschneider, A. Winkens, An experimental study of pedestrian congestions: Influence of bottleneck width and length.
- [10] A. Nicolas, S. Bouzat, M. N. Kuperman, Pedestrian flows through a narrow doorway: Effect of individual behaviours on the global flow and microscopic dynamics, Transportation Research Part B: Methodological 99 (2017) 30 – 43.
- [11] N. Shiwakoti, X. Shi, Y. Zhirui, Y. Liu, J. Lin, A comparative study of pedestrian crowd flow at middle and corner exits, 2016.
- [12] J. M. Pastor, A. Garcimartín, P. A. Gago, J. P. Peralta, C. Martin-Gomez, L. M. Ferrer, D. Maza, D. R. Parisi, L. A. Pugnaloni, I. Zuriguel, Experimental proof of faster-is-slower in systems of frictional particles flowing through constrictions., Physical review. E, Statistical, nonlinear, and soft matter physics 92 6.
- [13] A. Garcimartín, I. Zuriguel, J. Pastor, C. Martín-Gómez, D. Parisi, Experimental evidence of the “faster is slower” effect, Transportation Research Procedia 2 (2014) 760 – 767, the Conference on Pedestrian and Evacuation Dynamics 2014 (PED 2014), 22-24 October 2014, Delft, The Netherlands.
- [14] D. Helbing, I. Farkas, T. Vicsek, Simulating dynamical features of escape panic, Nature 407 (2000) 487–490.
- [15] D. Parisi, C. O. Dorso, Morphological and dynamical aspects of the room evacuation process, Physica A 385 (2007) 343–355.
- [16] D. Parisi, C. O. Dorso, Microscopic dynamics of pedestrian evacuation, Physica A 354 (2005) 606–618.
- [17] I. M. Sticco, F. E. Cornes, G. A. Frank, C. O. Dorso, Beyond the faster-is-slower effect, Phys. Rev. E 96 (2017) 052303.
- [18] I. Sticco, G. Frank, S. Cerrotta, C. Dorso, Room evacuation through two contiguous exits, Physica A: Statistical Mechanics and its Applications 474 (2017) 172 – 185.
- [19] R. Hidalgo, C. Lozano, I. Zuriguel, A. Garcimartín, Force analysis of clogging arches in a silo, Granular Matter 15. doi:10.1007/s10035-013-0451-7.
- [20] E. T. Owens, K. E. Daniels, Sound propagation and force chains in granular materials, 2011.
- [21] S. Ardanza-Trevijano, I. Zuriguel, R. Arévalo, D. Maza, A topological method to characterize tapped granular media from the position of the particles.
- [22] C. Giusti, L. Papadopoulos, E. Owens, K. Daniels, D. Bassett, Topological and geometric measurements of force chain structure, Physical Review E 94.
- [23] L. Papadopoulos, J. G. Puckett, K. E. Daniels, D. S. Bassett, Evolution of network architecture in a granular material under compression, Phys. Rev. E 94 (2016) 032908.
- [24] L. Papadopoulos, M. A. Porter, K. E. Daniels, D. S. Bassett, Network analysis of particles and grains, Journal of Complex Networks 6 (4) (2018) 485–565.
- [25] G. Frank, C. Dorso, Room evacuation in the presence of an obstacle, Physica A 390 (2011) 2135–2145.
- [26] D. Helbing, P. Molnár, Social force model for pedestrian dynamics, Phys. Rev. E 51 (1995) 4282–4286.
- [27] A. Strachan, C. O. Dorso, Fragment recognition in molecular dynamics, Phys. Rev. C 56 (1997) 995–1001.
- [28] M. Mysen, S. Berntsen, P. Nafstad, P. G. Schild, Occupancy density and benefits of demand-controlled ventilation in norwegian primary schools, Energy and Buildings 37 (12) (2005) 1234 – 1240.
- [29] I. Sticco, G. Frank, C. Dorso, Effects of the body force on the pedestrian and the evacuation dynamics, Safety Science 121 (2020) 42 – 53.
- [30] F. Cornes, G. Frank, C. Dorso, High pressures in room evacuation processes and a first approach to the dynamics around unconscious pedestrians, Physica A: Statistical Mechanics and its Applications 484 (2017) 282 – 298.
- [31] S. Plimpton, Fast parallel algorithms for short-range molecular dynamics, Journal of Computational Physics 117 (1) (1995) 1 – 19.
- [32] O. S. A.G. Frodesen, H. Toefte, Probability and statistics in particle physics, Norway: Universitetsforlaget.