Social Force Model parameter testing and optimization using a high stress real-life situation
Abstract
The escape panic version of the Social Force Model (SFM) is a suitable model
for describing emergency evacuations. In this research, we analyze a real-life
video, recorded at the opening of a store during a Black Friday event, which
resembles an emergency evacuation (November 2017,
South Africa). We measure
the flow of pedestrians entering the store and found a higher value (p/s) than the usually reported in “laboratory”
conditions. We performed numerical simulations to recreate this
event. The empirical measurements were compared against simulated evacuation
curves corresponding to different sets of parameters currently in use in the
literature. The results
obtained suggest that the set of parameters corresponding to calibrations
from laboratory experiments (involving pedestrians in which the safety of the
participants is of major concern) or situations where the physical contact is
negligible, produce simulations in which the agents evacuate faster than in
the empirical scenario.
To conclude the paper, we optimize two parameters of the model: the friction
coefficient and the body force coefficient . The best fit we found
could replicate the qualitative and quantitative behavior of the empirical
evacuation curve. We also found that many different combinations in the
parameter space can produce similar results in terms of the goodness of fit.
keywords:
Pedestrian Dynamics , Social Force Model , Empirical measurementPACS:
45.70.Vn , 89.65.Lm1 Introduction
In the last years, a growing interest appeared in the research of
pedestrian dynamics and emergency evacuations. The increasing number of
tragedies in night clubs [1, 2],
sports events [3, 4], and mass gatherings in
general [5, 6], has concerned many people around
the world. The urgency for understanding and preventing these tragedies has
called the attention of researchers from different disciplines.
There are three main approaches to study evacuations and pedestrian dynamics in
general: the theoretical
approach [7, 8, 10],
the experimental
approach ( performing
laboratory experiments) [11, 12, 13], and the empirical
approach ( analyzing
real-life data) [15, 16].
The emergency evacuation in a panic state is a very complex phenomenon that
requires the three approaches to be properly addressed. Each of these approaches
has its strengths and limitations. The laboratory experiments (experimental
approach) allow the researcher to have control over the analyzed situation while
recreating some of the traits that occur in a real-life scenario. However,
doing experiments that truly reproduce emergency
evacuations is impossible due to safety reasons. The analysis of real-life
situations (empirical approach) gives the researcher the
possibility of studying the system with a closer degree of realism. However,
the limitation of this approach is that there are not many documented reports
on real-life emergency evacuations yet.
The theoretical approach is the most common one. This approach does not have to
deal with the difficulties of the experimental and empirical approaches.
Nevertheless, the theoretical models may produce unrealistic results if they
are not validated or adequately calibrated.
Many pedestrian dynamics models were proposed in the last decades (see
Refs. [27, 17]). There
are two main groups of pedestrian models: the discrete
models [10, 9] in which
space and time are discretized and the continuous
models [18] which consider space and time as continuous
variables. The Social Force
Model [7, 18] belongs to the
group of continuous models and it is one
of the most developed models in pedestrian dynamics. Since its first version,
there have been many revisions, extensions, and improvements to
solve multiple problems that go beyond the emergency
evacuations [14, 27].
In this paper, we analyze a real-life video (empirical approach) of a Black
Friday event where pedestrians rush to enter into a Nike store. The video
was specially selected because the crowd behavior resembles an emergency
evacuation.
We also perform numerical
simulations (theoretical approach) to recreate the results of the empirical
scenario. We are only focusing on the escape panic version of the social
force model [18] because this version is specially
oriented to reproduce emergency evacuations.
The paper is organized as follows. In the following section, we describe the forces and the proposed set of parameters that involve the escape panic version of the social force model. In section 2, we mention the research scope and clarify some concepts that will be useful throughout the paper. In section 3, we provide details of the empirical measurements and the numerical simulations that we performed. Section 5 shows the results from both the empirical and numerical analyses. In the last part, we summarize the main conclusions of the work.
2 The escape panic version of the Social Force Model
2.1 The forces of the model
The escape panic version of the social force model came up for the first time in
the year 2000 [18]. Unlike other
versions [7, 38], this one reduces
the force description of the pedestrian evacuations to just a small number of
parameters.
The dynamic of the simulation is determined by an equation of motion involving both “socio-psychological” forces and physical forces. The equation of motion for any pedestrian (of mass ) reads
| (1) |
where the subscript corresponds to the neighboring pedestrians or
the surrounding walls. The desired force represents the
acceleration (or deceleration) of the pedestrian due to his (her) own will. The
social force , instead, describes the tendency of the pedestrians
to stay away from each other. The physical force stands for both
the sliding friction and the body force repulsion. These forces are essential
for understanding the particular effects of panicking crowds.
The pedestrians’ own will is modeled by the desired force . This force stands for the acceleration (deceleration) required to move at the desired velocity . This parameter is associated with the anxiety level to reach a specific target. The parameter is a characteristic time scale that reflects the reaction time. Thus, the desired force is modeled as follows
| (2) |
where represents the unit vector pointing to the
target position and stands for the pedestrian velocity at time
.
The tendency of any individual to preserve his (her) “private sphere” is accomplished by the social force . Therefore, reflects the psychological tendency of two pedestrians to stay away from each other. The mathematical expression to model this kind of “socio-psychological” behavior is as follows
| (3) |
where means the distance between the center of mass of the
pedestrians and , and is the sum of the pedestrian’s
radius. The unit vector points from pedestrian to
pedestrian , meaning a repulsive interaction.
The parameter is a characteristic scale that plays the role of a fall-off
length within the social repulsion. Besides, the
parameter represents the intensity of the social repulsion.
The expression for the physical force (say, the sliding friction plus the body force) has been borrowed from the granular matter field; the mathematical expression reads as follows
| (4) |
where equals if and
vanishes otherwise.
represents the relative tangential velocities of the sliding bodies (or between
the individual and the walls). Further details can be found in
Ref. [18].
The sliding friction occurs in the tangential direction
while the body force
occurs in the normal direction . Both forces are assumed
to be linear with respect to the net distance between contacting pedestrians
(overlap).
The sliding friction is also linearly related to the difference between the
(tangential) velocities. The parameter is a friction coefficient, while
the parameter is a stiffness coefficient (analogous to the constant factor
in the Hooke’s law). For simplicity, we will omit the units of the parameters
and . Remember that the friction coefficient
has units Kg ms-1 and
the body stiffness coefficient Kg s-2.
2.2 The proposed sets of parameters for the model
The escape panic version of the SFM involves 8 parameters: , ,
, , , , and . The original version of the model
fixes the mass kg, was uniformly distributed in the interval
[0.25 m, 0.35 m], to represent average soccer fans. The parameters
N, m take these values to reproduce the distance kept at
normal desired velocities and the measured flows through
bottlenecks [59]. s is said to be a
reasonable estimate for the acceleration time. Regarding the parameters of the
physical forces, and , Ref. [18] does not express reasons
for choosing these values, but may be related to the
research in Ref. [28]. Although this set of parameters has
been used in many research
studies [29, 30, 31, 32, 33, 34, 49], there are other sets
of parameters that have also been proposed to fit specific situations.
In Ref. [22], Li et al. calibrate the parameters , , ,
from a real-life video analysis. The situation studied was an emergency
evacuation of a classroom during the 2013 Ya'an earthquake in
China [62]. They use a Differential Evolution algorithm to fit the
numerical simulation results to the empirical evacuation curve (cumulative
number of evacuees vs. time).
In the research conducted by Haghani et al. [21], the
authors perform a sensitivity analysis where they find that the parameters
and are the most sensitive (the simulation’s output is strongly
dependent on the value of these parameters). They also perform a laboratory
experiment where participants are asked to evacuate a place through a narrow
door. They measured the evacuation time for 3 rushing levels of the
participants and 6 different door widths (varying from 60 cm to
120 cm). Afterward, they successfully calibrated the most sensitive parameters
and to fit the experimental data.
In Ref. [23], Lee et al. perform an evacuation
laboratory experiment varying the proportion of rush/no-rush participants. They
used the Wasserstein distance metric to obtain the parameters and that
best fitted the experimental results. They found many different sets of values
and depending on the proportion of rush/no-rush participants. For the
porpose of this work, we only selected the parameter values corresponding to
100% rush individuals.
The work of Frank et al. uses a subtle modification of the parameters of the
model. They omit the body force () while fixing the other parameters with
the same values proposed by Helbing et al. [18]. The subject of
study of this research is the emergency evacuations in the presence of
obstacles [24].
In the research of Tang et al. [20], the authors perform
pedestrian tracking in a Beijing metro station. They use a regression approach
based on the least square method to fit the parameters and . They obtain
two sets of values depending on whether pedestrians are in an “approach”
situation or a “leave” situation [20]. The first one
denotes pedestrians getting
close to each other while the latter means pedestrians detaching from each
other. We are only interested in the “leave” approach since we
only consider repulsive interaction between pedestrians.
In the research of Sticco et al. [19], The authors explore
the role of the body force, the friction force, and their dynamical
consequences in bottlenecks and corridors. They increased the parameter
with respect to the original version of the SFM. The increment was done in order
to reproduce the qualitative behavior of the fundamental diagram obtained from
the
measurements performed in Ref. [60]. In the research
from Ref. [60], the authors analyze a video recording of
the massive muslim pilgrimage at the entrance of the Jamaraat bridge.
We list in Table 1 the sets of parameters that were
selected for this research. Notice that these correspond to the set of
parameters proposed/used in the works mentioned above. The list of parameters
explicitly excludes the mass, radius, and desired velocity because we will set
those parameters according to a different criterion from the ones proposed by
the authors. In this work, we set the mass value kg. For the
pedestrian radius, we assigned two gaussian distributions:
(37.7 cm,0.09 cm) for females and
(41.8 cm,0.1 cm) for males. See section 4.2 for the
details.
| Authors | (N) | (m) | (Kg s-2) | (Kg ms-1) | (s) | Refs. |
|---|---|---|---|---|---|---|
| Helbing et al. | 2000 | 0.08 | 0.50 | [18] | ||
| Li et al. | 998 | 0.08 | 819 | 510 | 0.50 | [22] |
| Haghani et al. | 2000* | 0.08* | * | 5500 | 0.12 | [21] |
| Lee et al. | 2600 | 0.012 | 750 | 3000 | 0.50 | [23] |
| Frank et al. | 2000 | 0.08 | 0 | 0.50 | [24] | |
| Tang et al. | 729** | 0.10 | * | * | 0.60 | [20] |
| Sticco et al. | 2000 | 0.08 | 0.50 | [19] |
There are many similar works that we did not select because they calibrate
other versions of the model (different from the escape panic
version) [35, 36, 37, 38, 39, 40, 41, 42, 58].
The one in Ref. [43] studies the interval of
parameters and that avoid oscillations in the model. This paper was
excluded because the author explicitly avoids the bumping (and overlapping) in
his theoretical derivation. This could be interpreted as an improvement of the
model in the low-density limit (which is not the case for high-densities
reported in emergency evacuations). The novel work of
Bode [44] calibrates the escape panic version of the SFM
using the experimental data from Ref. [45]. Nevertheless, this
paper does not aim to provide a set of parameters but to promote a robust method
for model calibration.
3 Scope of this research and clarifications
This investigation has two main goals. The first goal is to present the results
of a novel empirical measurement from a real-life video analysis. The second
goal is to compare the empirical measurements with numerical simulations. We
will mention the strengths and weaknesses of the sets of parameters proposed by
different authors across the literature. We do not pretend to provide an
exhaustive description of all the phenomena presented here, but to explain the
more salient features. We stress that this investigation is a call to set the
SFM parameters with caution, rather than offering updated values for these
parameters. We realize that more empirical data is required before we can assess
definite estimates on this matter.
We based the research on the hypotheses that the video analyzed resembles an
emergency evacuation. For simplicity reasons, we will refer to the rush to enter
the Nike store as an evacuation process (although in evacuations, pedestrians
feel the urge to escape from a particular place rather than being urged to enter
into a building).
To simplify the analysis, we set the same parameter values to all the simulated
agents (except for the pedestrian’s diameter). We are aware that the reality is
more complex, but we decided to leave this kind of analysis to future
research.
In section 5.2, we optimize two parameters of the model (
and ). We decided to focus on these two parameters because they are
critical in high-density scenarios. The optimization of parameters like and
(affecting the social repulsion) can be achieved in low-density situations.
Whereas the optimization of
and requires physical contact among pedestrians (like in the analyzed
video). No further questioning will be done on the mutual relation between
parameters in the reduced-in-units context of the SFM. This is out of the scope
of the investigation.
4 Empirical measurements and numerical simulations
In this section we describe the process undertaken to accomplish the empirical
measurements. We also explain the details of the numerical simulations that we
performed.
4.1 Empirical measurements
The core of this work is the analysis obtained from a human rush event video.
The video is available on YouTube [48] and shows a crowd of pedestrians
rushing to
enter a Nike store during a Black Friday event. The event took place at
East Point Shopping Centre in the Ekurhuleni municipality (South Africa).
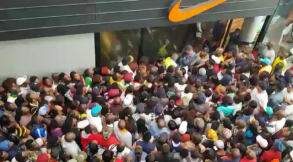
Fig. 1a is a snapshot of the first frame of the video. It
shows a crowd of pedestrians waiting for the security personnel to allow them
to
get in. In the subsequent frames (see the video [48]), it is possible
to see one
person wearing a red t-shirt and white cup that manages to sneak into the store.
Immediately after this, the crowd starts pushing towards the door, the security
personnel steps aside, and the crowd begins to enter massively. Only at the
end of the video, the pedestrians start to enter in a non-rushing fashion.
The door’s capacity is exceeded by the large number of pedestrians trying to
enter
the store at the same time. The glass panel placed at the left side of the door
is cracked as a result of the high pressures it supports. The pedestrians
exhibit high competitive, aggressive, and non-cooperative behavior. We
hypothesize that this situation could be similar to an emergency evacuation
where the crowd is under panic, and self-interest may prevail over rational and
collaborative behavior.
The video is composed by 1848 frames. We excluded the first 219 frames and the
last 458. The first part was excluded because the crowd is waiting to
enter the store. In a similar way, the last part was excluded because the crowd
starts to enter in a much orderly fashion, and no competitive behavior is
observed. The analysis
was done from the frame 220 to the frame 1419 (including the border values).
This is 1200 frames, equivalent to 40 s of recording time (since the video
frequency is 30 frames/s).
The selected 1200 frames correspond to the part of the video where the most
competitive behavior was observed. Recall that we are only interested in
scenarios like this, because the escape panic version of the SFM aims to
reproduce emergency evacuations. The selected 1200 frames were divided into
“segments” of 60 frames each (equivalent to a sampling period of
s). The criteria for choosing this sampling period was to be
large enough to
count a significant number of pedestrians who enter the store but, to be small
enough to achieve a reasonable amount of measurements.
Once we divided the selected 1200 frames into 20 segments of 60 frames each, we
proceed to count the number of ingressed pedestrians in each of the 20
segments.
The video’s quality is good enough to distinguish the pedestrians involved in
the event. Therefore we did the counting manually frame-by-frame. No pedestrian
tracking software was employed to achieve these measurements. In each frame, we
draw a straight line that divided the inside of the store from the outside. As
the video recording is almost steady, we only moved that dividing line once.
Then, we counted how many pedestrians crossed the line in each segment of the
video.
Once we counted how many pedestrians entered the store in each segment, we were
able to calculate the mean flow (averaging) and the cumulative number of
evacuees vs. time (evacuation curve).
4.2 Numerical simulations
Since the escape panic version of the SFM aims to simulate emergency
evacuations, we decided to recreate the conditions of the empirical measurements
to test the SFM and different sets of parameters proposed in the literature.
The SFM was implemented on the LAMMPS simulation software [25].
Additional modules for LAMMPS were written in C++ to expand the software
capabilities. To recreate the Black Friday event conditions, we set a door size
of width m. We set this value since it is almost equivalent to twice
the size of a South African average door [61] (notice that the entrance
of the store is a two-leaf door). Another criteria that made us choose
m is that the door is almost equivalent to 4 pedestrians’ width
(approximately 1.6 m).
The total number of pedestrians was fixed as . The number is
defined as . Where is the total number of pedestrians that
entered the store, while is the number of pedestrians that
appear close to the door in the last analyzed frame. These
pedestrians get inside the store a few frames after the last analyzed frame.
We set the simulated agents’ diameter following the
Ref. [26]. We used the shoulder width
(biacromial breadth) of adults corresponding to the ethnic group of
“non-Hispanic black”. In the video, it is possible to observe that there is
roughly an equal proportion of males and females. Therefore, we set half of the
simulated agents as females and the other half as males. For each half, we set a
gaussian distribution of shoulder widths. For males we assigned
(41.8 cm,0.1 cm) and for females we assigned
(37.7 cm,0.09 cm) [26].
We set a mass of kg to all the simulated agents. This value is the
average weight of men and women reported in
Ref. [26]. We tested whether variations in the mass
value and diameter value could change the results. We found that the model is
robust to mild variations in mass and diameter.
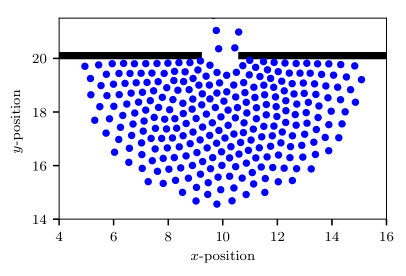
The initial conditions are configurations of agents that are located around the
door (to reproduce the first frame of the video). To create these initial
configurations, the agents were placed in a square enclosure with
random positions and speeds. Then they were made to go to the door area but with
the door closed (so that they do not leave the enclosure). After 20 s the
individuals form a semicircle around the door. That configuration is saved as an
initial condition. We repeated this process 50 times, varying the initial
positions and speeds of the agents.
In each simulation process, we recorded the number of agents that entered the
store every 0.05 s. The simulation process finished when simulated
agents entered the store (which is the total number of ingressed pedestrians
in the empirical measurements). We explored the interval of desired velocities
m/s m/s. This interval corresponds to anxious
individuals (but not extremely fast runners).
We use different sets of parameters to perform numerical simulations. The sets
of parameters that we used are shown in the Table 1. For a
given set of parameters and a given desired velocity, we run 50 iterations
varying the initial conditions. The Eq. (1) was numerically
integrated employing the velocity Verlet algorithm, with a timestep value
10s.
5 Results
We present in this section the main results of our investigation. The section is
divided into two parts. In the first part (section 5.1), we compare
the empirical measurements with numerical simulations by using different
sets of parameter available in the literature. In the second part (section
5.2), we present the results of the parameter optimization
by means of a genetic algorithm.
5.1 Testing
In this section, we present and discuss our empirical results, and we further
compare the numerical simulations with these empirical measurements.
In the previous section, we described the video analysis procedure to obtain
the empirical measurements. Using this data, we were able to plot the empirical
evacuation curve, which is the number of people entering the store as a
function of time (cumulative number of evacuees vs. time).
The empirical evacuation curve is a monotonically increasing function (see the
black dotted line in Fig. 2). There are no time intervals
in which the empirical evacuation process is completely stopped, at least for
the sampling frequency employed in this research (s). We may
speculate that a lower would capture the stop-and-go mechanism
produced by the blocking clusters close to the
door [50].
We used the empirical measurements to calculate the mean flow
of pedestrians entering the store p/s. The
flow value is higher than other experimental measurements at bottlenecks where
individuals are not allowed to harm one
another [52, 53, 54, 55, 56, 57, 13, 63, 64].
The specific flow is defined as the flow scaled by the door
size (say, ). This quantity is used to compare
evacuation processes with different
door dimensions (to a certain extent). The mean specific flow corresponding to
our measurement is p/m.s (assuming a door
width of m). To our knowledge, only the specific flow reported in
Refs. [63, 56] is comparable to ours.
However, the specific flow from
Refs. [63, 56] corresponds to door sizes
much narrower (m) than the estimated door size of the Nike store
(m). It is worth mentioning that some researches have reported that
narrower doors produce a moderate increment in the specific
flow [53] while other researches concluded the opposite
result [65].
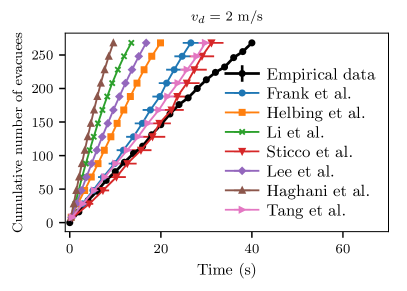
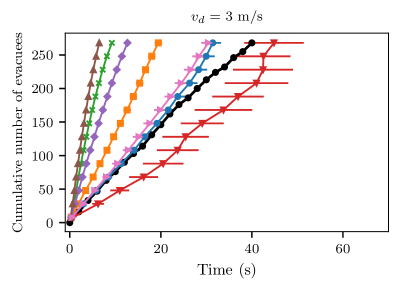
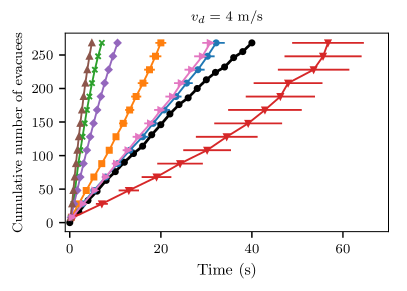
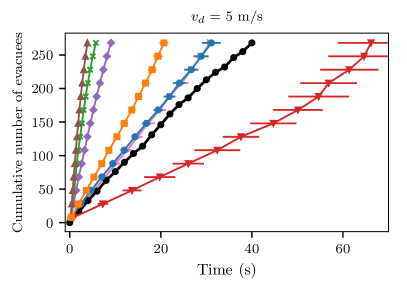
Fig. 2 shows the cumulative number of pedestrians that
entered the store as a function of the time (for both empirical measurements
and numerical simulations). Fig. 2 is a collection of four
figures, all of them include the empirical result (shown as a black dotted
line) and the results of the numerical simulations (shown as colored curves).
Each of these curves is associated with different sets of parameters
(corresponding to the selected papers mentioned in
Table 1).
Each figure from Fig. 2 is
associated to a different desired velocity in the interval
m/s m/s. The numerical results of
Fig. 2a and
Fig. 2b correspond to m/s and m/s, while
the numerical results of Fig. 2c and Fig. 2d
correspond to m/s and m/s, respectively. Recall that we assign
the same desired velocity to every simulated agent from the beginning of the
simulation until the simulated agent manages to enter the store.
The evacuation time is defined as the time for which all the pedestrians
evacuated the place (for example, the evacuation time for the empirical
measurements is s). The Faster-is-Slower is a phenomenon that
occurs when increasing the desired velocity reduces the evacuation time.
The Faster-is-Faster is the opposite effect; this means that the higher the
value of , the lower the evacuation time. Within this framework, we can
distinguish two categories of evacuation curves: the curves that exhibit
Faster-is-Faster (Lee, Li, Haghani) and the curves that exhibit Faster-is-Slower
(Sticco, Frank, Tang). The curves corresponding to the parameters proposed by
Helbing et al. do not display any of these effects significantly.
Within the three sets of parameters that exhibit Faster-is-Slower, the most
noticeable curves are the corresponding to the parameter set proposed by Sticco
et al. Recall that this parameter set is similar to Helbing’s but with the
friction coefficient increased by a factor of five. This correction was
suggested in order to reproduce the qualitative behavior of the fundamental
diagram at the entrance of the Jamaraat bridge [19]. The
evacuation curve shown in
Fig. 2b (for m/s), seems to attain a good agreement
with the empirical
measurements until time s. Above this time, the simulated curve
tends to increase faster than the empirical curve. For higher desired
velocities (m/s), the parameters proposed by Sticco et al.
produce
very large evacuation times due to the high friction value.
The parameter sets proposed by Frank et al. and Tang et al. produce a mild
Faster-is-Slower effect. They seem to be the parameter sets that produce the
best agreement with this empirical data. Notice that the evacuation times
( the time corresponding to the last measurement) surpass
the evacuation time from Helbing et al. (for any of the desired velocity
explored). In the case of Frank et al., this difference can be explained because
the body force is not considered (0), this produces a more significant
overlap between pedestrians, which ultimately leads to an increment in
the friction [19].
In the case of the parameters proposed by Tang et al., it is more difficult to
compare them with Helbing’s because three parameters are modified (, ,
and ). Nevertheless, the value of is reduced and the value of is
increased. These changes tend to diminish the social force repulsion, which
presumingly leads to an effective increment of the overlap (and the friction
force). This is analogous to the reduction stated by Frank et al.
As we mentioned before, the parameters proposed by Haghani, Lee and Li yield
Faster-is-Faster effect. The three of them produce evacuation times below the
empirical measurements (and also below the evacuation time corresponding to
Helbing). This result holds true for any of the explored desired velocities.
The set of parameters proposed by Haghani et al. and Lee et al. were able to
reproduce the experimental results in laboratory conditions where pedestrians
are not allowed to have aggressive behavior against each other. The Black
Firday event (empirical condition) reported in this paper involves highly
aggressive and competitive behavior (see the video from Ref. [48]).
This discrepancy between laboratory and empirical conditions seems to be the
reason why the sets of parameters proposed in
Refs. [21, 23] do not
produce evacuation curves in agreement with the empirical data analyzed in this
paper.
The set of parameters proposed by Li et al. was calibrated using a real-life
(empirical) video analysis. The situation analyzed is an emergency evacuation of
a classroom due to the 2013 Ya'an earthquake in China. In the
video [62], it is possible to observe that students rush to
evacuate the classroom. Despite this, the physical contact between the students
involved is almost negligible. This particular trait of the Ya'an earthquake evacuation may have underestimated the value of the friction
coefficient , and consequently, the expected impact that could have
in a high-density situation such as the Black Friday event analyzed in this
work.
We may summarize this Section as follows. We reported the evacuation curve of
the Black Friday event and measured the flow p/s (and estimated the specific flow p/m.s). This is a higher value than the flow reported under laboratory
conditions throughout the literature. We performed numerical simulations to
reproduce the Black Friday event’s conditions using different sets of parameters
available in the literature. We divided the results into two categories
(parameter sets that yield Faster-is-Slower pattern and parameter sets that
produce Faster-is-Faster pattern). The
parameter sets that yield Faster-is-Slower seem to have better agreement with
the empirical curve (except for the parameter set of Sticco et al. in the
interval m/s). The sets of parameters that yield
Faster-is-Faster
were calibrated from laboratory and empirical situations. In these situations,
the pedestrians involved do exhibit neither aggressive behavior nor significant
physical contact. This fact may have underestimated the value of the friction
coefficient , leading to evacuation curves with evacuation times lower than
the empirical case.
5.2 Parameter optimization
In this section, we present the results of the parameter optimization. We
perform an optimization of the parameters and ; these are the
parameters associated with the physical forces: the body force and the
friction. The
optimization was done using the Differential Evolution (DE) algorithm, which is
a technique that belongs to the family of genetic algorithms (see
Ref. [46] for a detailed explanation of the algorithm).
The goal of DE is to optimize the parameters of the model in order to achieve an
evacuation curve consistent with the empirical measurements obtained from the
Black Friday video. The optimization process finished when the algorithm reached
100 generations. Since we aim to optimize two parameters, we set 2
20 different sets of random values following the recommendations of
Storn [46]. The crossover probability and the differential
weight were set as and , respectively.
The algorithm requires an objective function (a function to minimize), we defined this function as
| (5) |
where is a time value corresponding to the simulated
evacuation curve, is a time value corresponding to the empirical
evacuation curve and is the total number of measurements in the
evacuation curve. The index is associated with a fixed number of evacuees.
For instance, corresponds to zero evacuees, while corresponds to
268 evacuees (both in the empirical curve and in the simulated curve).
is a real number that expresses how much the simulation differs
from the empirical measurement. Notice that this estimator
avoids the usual overweighting of large deviations encountered in quadratic
estimators.
The numerical simulations have the same characteristics as the simulations
from the previous section (total number of evacuees, door size, shoulders width,
etc.). The only two parameters that we aim to optimize are the friction
coefficient and the body force parameter . The other parameters were
fixed to the values proposed by Helbing et al. [18] (except for
the pedestrian mass and radius).
Given the values , the algorithm calculates the mean evacuation curve
over 50 iterations. The mean evacuation is then compared against the empirical
evacuation curve (see Eq. (5)) to obtain a value
. Fig. 3 shows the
fitness landscape, the horizontal axis stands for the parameter and the
vertical axis stands for the parameter . The color bar represents the value
of the objective function .
Fig. 3a shows the fitness landscape for pedestrians with a
desired velocity m/s while Fig. 3b corresponds to
pedestrians with m/s. Both fitness landscapes show that the optimal
values of the parameters and are correlated. The solid black line is
a visual guide to see the correlation in the parameter space. In both plots, it
is possible to observe that increasing the value of requires increasing
the parameter to achieve a similar fitness value .
The correlation can be explained because the friction force depends on the value
of , but it also depends on the overlap between contacting pedestrians
(see the first term in Eq. (4)). The
value of affects the overlap value (which subsequently affects the
friction). Many different combinations of the parameters may produce similar
results (see Ref. [47] for a further discussion). The black solid
line has a different slope depending on the value of . Increasing
reduces the slope because directly affects the overlap between pedestrians
(the higher the desired velocity, the higher the overlap). In other words, if
the desired velocity is higher, the friction coefficient needs to be
lower in order to achieve the same results.
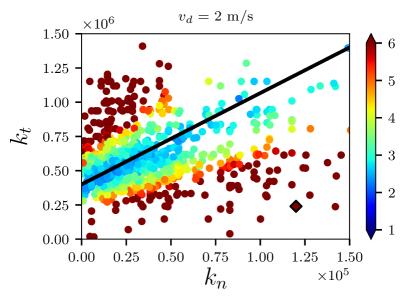
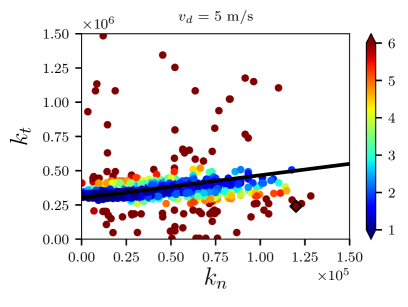
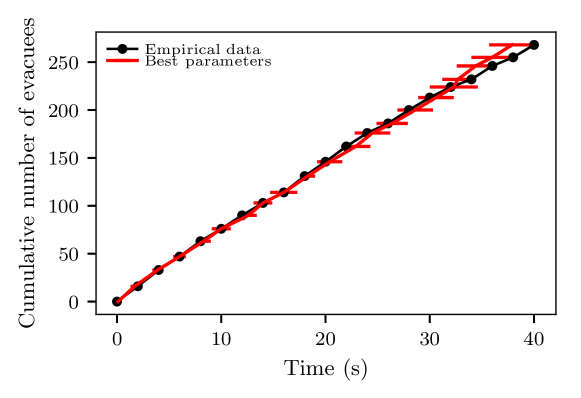
Fig. 4 shows the empirical evacuation curve and the curve corresponding
to the best set of parameters (red line) for m/s. The best set of
parameters was obtained with the DE algorithm. It corresponds to
and parameters:
(0.036, 3.05). The friction coefficient
is higher than the value corresponding to the Helbing’s original
proposal (which is ). This result is consistent with the
friction increment suggested in Ref. [47]. On the other hand, the
body force coefficient is lower than the original value
(1.2). This value has already been questioned in
Ref. [66] since empirical data suggests a
lower value for the human compression coefficient. However, we emphasize that
there is no unique
combination that produces the optimal result since many different parameter
combinations can produce similar outcomes.
If the desired velocity was a known value, we could determine the combination of
parameters ( and ) that best fits the empirical data. Although we did
not estimate the value of , the fitness landscapes shown in this research
can help to narrow down the possible parameters that could fit the empirical
evacuation curve.
For future researches, it will be necessary to find a set of parameters that are able to fit situations like the Black Friday event and also situations such as the Jamaraat pilgrimage (where is low, but the density is extremely high). In the latter case, it would be convenient to fit the parameters using the fundamental diagram measurements reported in Ref. [60].
We conclude this second part of the results by mentioning that the Differential
Evolution algorithm could achieve a set of parameters for m/s
that fits the
empirical data with an agreement value of . This result
suggests that the friction value should be increased respect the original value
proposed in Ref. [18]. We also stress that there
is no unique combination of optimal parameters but a collection of possible
combinations that lead to similar results in terms of the objective function.
6 Conclusions
The escape panic version of the Social Force Model has been widely considered in
pedestrian dynamics. The purpose of the model is to simulate emergency
evacuations under high emotional stress. We have
analyzed a real-life video (Black Friday event) that resembles an emergency
evacuation and then turns out to be suitable for testing and optimizing the
model.
We measured the Black Friday event flow (p/s) and found that it is higher than the flow
measurements reported in most experimental
studies. We argue that this
discrepancy is related to the fact that in controlled experiments, the
participants are not extremely competitive (due to safety considerations). On
the other hand, in the real-life situation analyzed in this paper, it is
possible to observe a high level of competitiveness and aggression, which may
have lead to such a distinct result.
We performed numerical simulations that recreate the Black Friday event. We
used different sets of parameters that were previously proposed/used in the
literature. The parameter sets calibrated from laboratory controlled
experiments
or situations where the physical contact is negligible produced simulations
which display a strong disagreement with our empirical measurements. These sets
of parameters produce simulated agents that evacuate too fast. We think that
even though those
calibrations fit well the situations analyzed in their researches, they are not
completely suitable for analyzing high stress situations like the Black Friday
event because the friction contribution turns out to be underestimated.
The sets of parameters from Refs. [24, 20] provide
better reproduction of the empirical results, although they do not fully
reproduce the empirical evacuation curve of the Black Friday event.
In order to explore the possibility of getting better values of the parameters
and , we implemented a Differential Evolution
algorithm to optimize them. The optimization criteria was to minimize the
difference between the simulated evacuation curve and the empirical evacuation
curve. The values that produce the best fit
are: ), for m/s. These
values reproduce the qualitative and quantitative behavior of the empirical
measurement. We also found that and are correlated in the fitness
landscape. The consequence of this is that there are multiple combinations of
and that produce the same fitness values. We did not attempt to
identify the source of correlation, but we are currently working on this topic
for an upcoming investigation.
We stress that physical forces (friction and body force) are a
critical factor in reproducing emergency evacuations where the pedestrians are
subject to high-density and high anxiety conditions. Therefore, we suggest
calibrating the model parameters using real-life emergency evacuations or
similar situations (like the Black Friday stampede analyzed in this paper). The
results obtained after performing the above mentioned optimization, indicate
that the friction coefficient is generally underestimated.
We believe that in the coming years, there will be an increasing number of
videos like the one analyzed in this work. Situations like Black Friday events,
music concerts, and human stampedes are more often documented and published on
the internet. This data, together with computer vision techniques, will
contribute to study these singular events. We hope that future researches based
on real-life video analysis will improve the theoretical models aimed at
simulating emergency evacuations.
Acknowledgments
This work was supported by the National Scientific and Technical
Research Council (spanish: Consejo Nacional de Investigaciones Científicas
y Técnicas - CONICET, Argentina) grant Programación Científica 2018
(UBACYT) Number 20020170100628BA.
G.A Frank thanks Universidad Tecnológica Nacional (UTN) for partial
support through Grant PID Number SIUTNBA0006595.
References
- [1] Veltfort, Helene Rank, and George E. Lee. The Cocoanut Grove fire: a study in scapegoating The Journal of Abnormal and Social Psychology, 38.2S (1943): 138.
- [2] Atiyeh, B Brazilian kiss nightclub disaster. Annals of burns and fire disasters, 26.1 (2013): 3.
- [3] Wright, Daniel B. ”Recall of the Hillsborough disaster over time: Systematic biases of ‘flashbulb’memories. Applied cognitive psychology, 7.2 (1993): 129-138.
- [4] Delaney, J. Scott, and R. Drummond. Mass casualties and triage at a sporting event. British journal of sports medicine, 36.2 (2002): 85-88.
- [5] Illiyas, Faisel T and Mani, Shibu K and Pradeepkumar, AP and Mohan, Keshav. Human stampedes during religious festivals: A comparative review of mass gathering emergencies in India. International Journal of Disaster Risk Reduction , 5 (2013): 10-18.
- [6] Ngai, Ka Ming and Burkle, Frederick M and Hsu, Anthony and Hsu, Edbert B. Human stampedes: a systematic review of historical and peer-reviewed sources. Disaster medicine and public health preparedness, 3.4 (2009): 191-195.
- [7] Helbing, Dirk, and Peter Molnar. ocial force model for pedestrian dynamics Physical review E, 51.5 (1995): 4282.
- [8] Henderson, Leroy F. On the fluid mechanics of human crowd motion. Transportation research, 8.6 (1974): 509-515.
- [9] Fukui, Minoru, and Yoshihiro Ishibashi. Self-organized phase transitions in cellular automaton models for pedestrians. Journal of the physical society of Japan, 68.8 (1999): 2861-2863.
- [10] Blue, Victor J., and Jeffrey L. Adler. Cellular automata microsimulation of bidirectional pedestrian flows. Transportation Research Record,1678.1 (1999): 135-141.
- [11] Pastor, José M and Garcimartín, Angel and Gago, Paula A and Peralta, Juan P and Martín-Gómez, César and Ferrer, Luis M and Maza, Diego and Parisi, Daniel R and Pugnaloni, Luis A and Zuriguel, Iker Experimental proof of faster-is-slower in systems of frictional particles flowing through constrictions Physical Review E, 92.6 (2015): 062817.
- [12] Liao, Weichen and Seyfried, Armin and Zhang, Jun and Boltes, Maik and Zheng, Xiaoping and Zhao, Ying Experimental study on pedestrian flow through wide bottleneck Transportation Research Procedia, 2 (2014): 26-33.
- [13] Nicolas, Alexandre, Sebastián Bouzat, and Marcelo N. Kuperman. Pedestrian flows through a narrow doorway: Effect of individual behaviours on the global flow and microscopic dynamics. Transportation Research Part B: Methodological,99 (2017): 30-43.
- [14] Köster, Gerta, Franz Treml, and Marion Gödel. Avoiding numerical pitfalls in social force models. Physical Review E, 87.6 (2013): 063305.
- [15] Corbetta, Alessandro and Bruno, Luca and Muntean, Adrian and Toschi, Federico High statistics measurements of pedestrian dynamics. Transportation Research Procedia, 2 (2014): 96-104.
- [16] Zhang, XL and Weng, WG and Yuan, HY and Chen, JG Empirical study of a unidirectional dense crowd during a real mass event Physica A: Statistical Mechanics and its Applications, 392:2781–2791, 2013.
- [17] Schadschneider, Andreas and Klüpfel, Hubert and Kretz, Tobias and Rogsch, Christian and Seyfried, Armin Fundamentals of pedestrian and evacuation dynamics. Systems for Traffic and Transportation Engineering, IGI Global, 2009. 124-154.
- [18] D. Helbing, I. Farkas, and T. Vicsek. Simulating dynamical features of escape panic. Nature, 407:487–490, 2000.
- [19] Sticco, I. M., G. A. Frank, and C. O. Dorso. Effects of the body force on the pedestrian and the evacuation dynamics Safety Science, 129 (2020): 104829..
- [20] Tang, Ming, and Hongfei Jia. An approach for calibration and validation of the social force pedestrian model Proceedings 2011 International Conference on Transportation, Mechanical, and Electrical Engineering (TMEE), IEEE, 2011
- [21] Haghani, Milad, and Majid Sarvi. Simulating pedestrian flow through narrow exits. Physics Letters A, 383.2-3 (2019): 110-120.
- [22] Meifang Li, Yongxiang Zhao, Lerong He, Wenxiao Chen, and Xianfeng Xu. The parameter calibration and optimization of social force model for the real-life 2013 ya’an earthquake evacuation in china. Safety Science, 79:243 – 253, 2015.
- [23] Lee, Hye Rin Lindsay and Bhatia, Abhishek and Brynjarsdóttir, Jenny and Abaid, Nicole and Barbaro, Alethea and Butail, Sachit. Speed modulated social influence in evacuating pedestrian crowds. Collective Dynamics, 5 (2020): 1-24.
- [24] G. Frank and C. Dorso. Room evacuation in the presence of an obstacle. Physica A, 390:2135–2145, 2011.
- [25] Plimpton, Steve. Fast parallel algorithms for short-range molecular dynamics Sandia National Labs,1993
- [26] McDowell, Margaret A., Cheryl D. Fryar, and Cynthia L. Ogden. Anthropometric reference data for children and adults: United States, 1988-1994. Vital and health statistics. Series 11, Data from the national health survey 249 (2009): 1-68.
- [27] Chen, Xu and Treiber, Martin and Kanagaraj, Venkatesan and Li, Haiying. Social force models for pedestrian traffic–state of the art Transport reviews 38.5 (2018): 625-653.
- [28] Melvin, John W. AATD system technical characteristics, design concepts, and trauma assessment criteria. Task EF final report
- [29] Ha, Vi, and George Lykotrafitis. Agent-based modeling of a multi-room multi-floor building emergency evacuation. Physica A: Statistical Mechanics and its Applications 391.8 (2012): 2740-2751
- [30] Song, Xiao and Sun, Jinghan and Xie, Hongnan and Li, Qiyuan and Wang, Zilie and Han, Daolin. Characteristic time based social force model improvement and exit assignment strategy for pedestrian evacuation Physica A: Statistical Mechanics and its Applications 505 (2018): 530-548
- [31] Saboia, Priscila, and Siome Goldenstein. Crowd simulation: applying mobile grids to the social force model The Visual Computer 28.10 (2012): 1039-1048.
- [32] Yang, Xiaoxia and Dong, Hairong and Wang, Qianling and Chen, Yao and Hu, Xiaoming. Guided crowd dynamics via modified social force model. Physica A: Statistical Mechanics and its Applications 411 (2014): 63-73.
- [33] Zhang, Limao and Liu, Mengjie and Wu, Xianguo and AbouRizk, Simaan M. Simulation-based route planning for pedestrian evacuation in metro stations: A case study. Automation in Construction 71 (2016): 430-442.
- [34] Zhao, Yongxiang and Li, Meifang and Lu, Xin and Tian, Lijun and Yu, Zhiyong and Huang, Kai and Wang, Yana and Li, Ting. Optimal layout design of obstacles for panic evacuation using differential evolution Physica A: Statistical Mechanics and its Applications 465 (2017): 175-194.
- [35] Kabalan, Bachar and Argoul, Pierre and Jebrane, Aissam and Cumunel, Gwendal and Erlicher, Silvano. A crowd movement model for pedestrian flow through bottlenecks Annals of Solid and Structural Mechanics 8.1-2 (2016): 1-15.
- [36] Hoogendoorn, Serge P., and Winnie Daamen. Microscopic calibration and validation of pedestrian models: Cross-comparison of models using experimental data. Traffic and Granular Flow’05, pringer, Berlin, Heidelberg, 2007. 329-340.
- [37] Seer, Stefan and Rudloff, Christian and Matyus, Thomas and Brändle, Norbert. Validating social force based models with comprehensive real world motion data. Transportation Research Procedia,(2014): 724-732.
- [38] A. Johansson, D. Helbing, and P.K. Shukla. Specification of the social force pedestrian model by evolutionary adjustment to video tracking data. Advances in Complex Systems, 10(supp02):271–288, 2007.
- [39] Steiner, Albert, Michel Philipp, and Alex Schmid. Parameter estimation for a pedestrian simulation model. Swiss Transport Research Conference, 12-14 September 2007.
- [40] Siddharth, S. M. P., and P. Vedagiri. Modeling the gender effects of pedestrians and calibration of the modified social force model. Transportation research record, 2672.31 (2018): 1-9.
- [41] Zeng, Weiliang and Chen, Peng and Yu, Guizhen and Wang, Yunpeng. Specification and calibration of a microscopic model for pedestrian dynamic simulation at signalized intersections: A hybrid approach Transportation Research Part C: Emerging Technologies, 80 (2017): 37-70.
- [42] M. Luber, J. A. Stork, G. D. Tipaldi, and K. O. Arras. People tracking with human motion predictions from social forces. In 2010 IEEE International Conference on Robotics and Automation, pages 464–469, May 2010.
- [43] Kretz, Tobias. On oscillations in the social force model In Physica A: Statistical Mechanics and its Applications, 438 (2015): 272-285.
- [44] Bode, Nikolai. On Parameter Calibration in Crowd Simulation Models using Approximate Bayesian Computation In arXiv preprint arXiv:2001.10330 (2020).
- [45] J. Liddle, A. Seyfried, W. Klingsch, T. Rupprecht, A. Schadschneider, and A. Winkens. An experimental study of pedestrian congestions: influence of bottleneck width and length In Proceedings of International Conference on Traffic and Granular Flow 2009:2009, Shanghai, China, 2009.
- [46] Storn, Rainer. On the usage of differential evolution for function optimization. Proceedings of North American Fuzzy Information, Processing. IEEE, 1996.
- [47] I.M. Sticco, G.A. Frank, F.E. Cornes, and C.O. Dorso. A re-examination of the role of friction in the original social force model. Safety Science, 121:42 – 53, 2020.
- [48] https://www.youtube.com/watch?v=XTPomOyyxi4
- [49] D. Parisi and C. Dorso. Microscopic dynamics of pedestrian evacuation. Physica A, 354:606–618, 2005.
- [50] D. Parisi and C. Dorso. Morphological and dynamical aspects of the room evacuation process. Physica A, 385:343–355, 2007.
- [51] Li, Hongliu and Zhang, Jun and Song, Weiguo and Yuen, Kwok Kit Richard A comparative study on the bottleneck pedestrian flow under different movement motivations. Fire Safety Journal, (2020): 103014.
- [52] Liddle, Jack and Seyfried, Armin and Klingsch, Wolfram and Rupprecht, Tobias and Schadschneider, Andreas and Winkens, Andreas An experimental study of pedestrian congestions: influence of bottleneck width and length. arXiv preprint arXiv,0911.4350 (2009).
- [53] Kretz, Tobias, Anna Grünebohm, and Michael Schreckenberg. Experimental study of pedestrian flow through a bottleneck. Journal of Statistical Mechanics: Theory and Experiment, 2006.10 (2006): P10014.
- [54] Müller, Klaus Zur Gestaltung und Bemessung von Fluchtwegen für die Evakuierung von Personen aus Bauwerken auf der Grundlage von Modellversuchen. Verlag nicht ermittelbar,1981.
- [55] Muir, Helen C., David M. Bottomley, and Claire Marrison. Effects of motivation and cabin configuration on emergency aircraft evacuation behavior and rates of egress. The International Journal of Aviation Psychology,6.1 (1996): 57-77.
- [56] Nagai, Ryoichi, Masahiro Fukamachi, and Takashi Nagatani. Evacuation of crawlers and walkers from corridor through an exit. Physica A: Statistical Mechanics and its Applications,6.1 (1996): 57-77.
- [57] Seyfried, A and Rupprecht, T and Winkens, A and Passon, O and Steffen, B and Klingsch, W and Boltes, M. Capacity estimation for emergency exits and bottlenecks. Interflam,2007 (2007): 247-258.
- [58] Corbetta, Alessandro, Adrian Muntean, and Kiamars Vafayi. Parameter estimation of social forces in pedestrian dynamics models via a probabilistic method. Mathematical biosciences and engineering, 12.2 (2015): 337-356.
- [59] Ulrich Weidmann. Transporttechnik der fussgänger. IVT Schriftenreihe, 90, Jan 1992.
- [60] Dirk Helbing, Anders Johansson, and Habib Zein Al-Abideen. Dynamics of crowd disasters: An empirical study. Phys. Rev. E, 75:046109, Apr 2007.
- [61] https://www.doorsdirect.co.za/what-are-the-standard-door-sizes-in-your-country
- [62] https://www.youtube.com/watch?v=QH6oPhdfUzg
- [63] Garcimartín, Angel and Parisi, Daniel Ricardo and Pastor, José M and Martín-Gómez, C and Zuriguel, Iker Flow of pedestrians through narrow doors with different competitiveness Journal of Statistical Mechanics: Theory and Experiment, 2016.4 (2016): 043402.
- [64] Jianyu, Wang and Jian, Ma and Peng, Lin and Juan, Chen and Zhijian, Fu and Tao, Li and Sarvi, Majid Experimental study of architectural adjustments on pedestrian flow features at bottlenecks. Journal of Statistical Mechanics: Theory and Experiment, 2019.8 (2019): 083402.
- [65] Seyfried, Armin and Passon, Oliver and Steffen, Bernhard and Boltes, Maik and Rupprecht, Tobias and Klingsch, Wolfram New insights into pedestrian flow through bottlenecks Transportation Science, 43.3 (2009): 395-406.
- [66] Cornes, Fernando Ezequiel, Guillermo Alberto Frank, and Claudio Oscar Dorso. High pressures in room evacuation processes and a first approach to the dynamics around unconscious pedestrians. Physica A: Statistical Mechanics and its Applications, 484 (2017): 282-298.